
Research date: June 30, 2026 | OSINT research on Morgan Stanley (NYSE: MS), how a decade-long shift from a trading house into a wealth-management annuity turned a firm that once traded below its own book value into the richest multiple among the money-center banks, the cash-sweep litigation and private-credit gating sitting underneath that premium, and the peer set (Goldman Sachs, JPMorgan, Bank of America, Charles Schwab, BlackRock, Wells Fargo, UBS) it gets measured against. Live prices, stamped hard.
Important disclaimer. This is OSINT (open-source intelligence) research published for educational and informational purposes only. It is not investment advice, not a recommendation to buy, sell, or hold any security, and not a solicitation. I am not a financial advisor. Morgan Stanley is a leveraged play on capital-markets cycles, equity and bond price levels, and financial regulation, so the figures here can move faster and further than a typical stock when the cycle turns. All figures are point-in-time as of the stated research date (June 30, 2026) and move fast: prices, market caps, share counts, capital ratios, and litigation status will be stale by the time you read this. Any bull, base, or bear scenarios below are illustrative arithmetic on stated assumptions, not price targets. Do your own due diligence and consult a licensed financial advisor before making any decision.
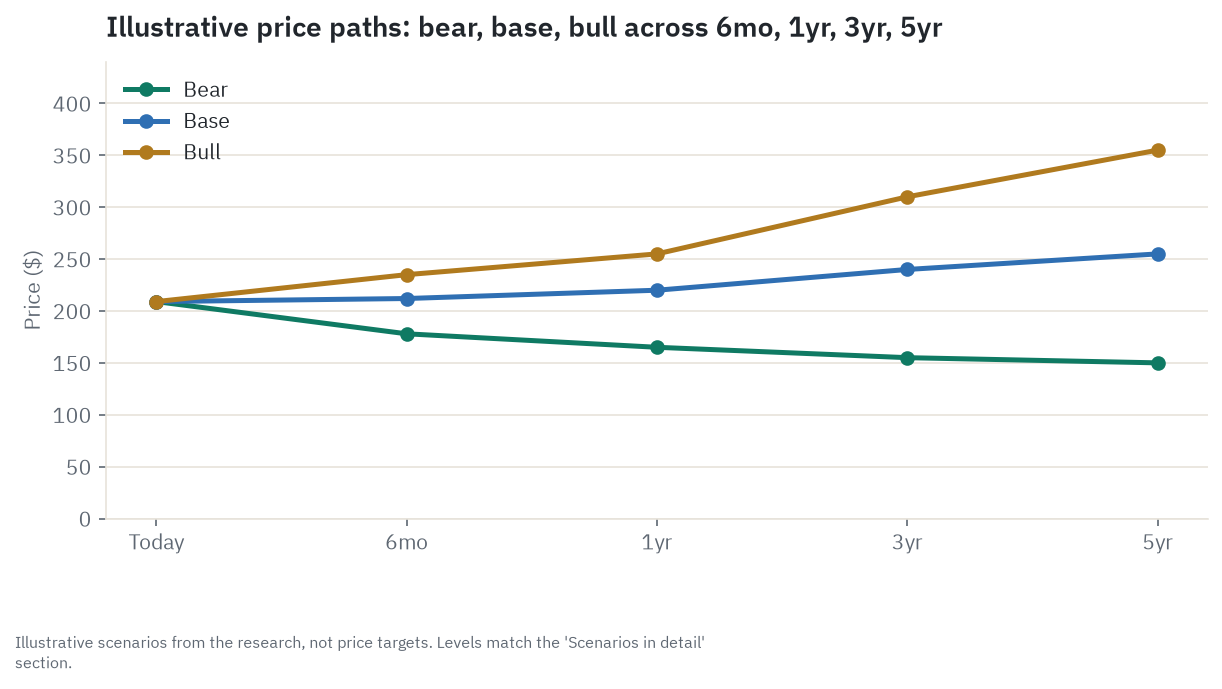
Where this stock could be in 6 months, 1 year, 3 years, and 5 years
Morgan Stanley’s stock (the quote above is live) trades at roughly four times tangible book value, more than double its own ten-year median and a clear step above what Goldman Sachs, JPMorgan, and Bank of America command on the same measure. Tangible book value is shareholder equity with intangible assets like goodwill stripped out, roughly what would be left over for shareholders if the firm were wound down tomorrow. Banks and brokers get priced against that figure rather than against earnings, the way a price-to-earnings ratio prices most companies, because deposits, trading assets, and borrowings are so large relative to a bank’s equity that book value, not a single year’s profit, is the more stable anchor. A stock at four times tangible book means investors are paying four dollars today for every dollar of that liquidation-style equity on the balance sheet, and that reading is roughly 104 percent above Morgan Stanley’s own ten-year median of 1.94 times, the single number this whole piece keeps coming back to. That gap is the entire debate this piece works through. The bull side is real: Morgan Stanley spent the 2020s converting itself from a trading-and-banking firm into a firm that is now about half fee-based wealth and asset management, a business that bills off a client’s assets rather than off a bank’s willingness to lend, and that shift has genuinely raised the firm’s return on capital. The question is whether the stock has already been paid for that transformation once, and is now being asked to pay for it a second time.
Six months. This window is dominated by datable events, not the long story. Second-quarter earnings land on July 15, 2026, the first live test of whether the investment-banking reopening that produced three record quarters in a row is still building or starting to plateau. The Federal Reserve’s June projections turned more hawkish than the market expected, with nine of eighteen policymakers leaning toward another rate increase, so the path of actual policy (not just the talk) matters here too. The base case is roughly flat to modestly higher, around $212, since the stock already sits near where the sell-side consensus target sits, so a good quarter mostly confirms the story rather than re-rating it. The bull case is about $235, close to the stock’s own 52-week high, on another investment-banking beat alongside a Fed that stays on hold. The bear case is about $178, back toward the 200-day moving-average zone, if a hawkish surprise or a market wobble starts the multiple compressing. The single thing most likely to flip this window is the tone of the July earnings call on the deal backlog and on whether the wealth unit’s margin holds.
One year. The dominant twelve-month variable is whether the mergers-and-underwriting reopening that has driven Institutional Securities to record quarters keeps extending, or rolls over the way these cycles have before. Base case is about $220, modest earnings growth with the multiple roughly steady. Bull case is about $255, the up-cycle extending while the wealth business keeps compounding and the buyback keeps shrinking the share count. Bear case is about $165, announced deal volume rolling over, forward earnings estimates cut ten to twenty percent, and the four-times-book multiple starting to compress toward its own longer-run average, a pattern Morgan Stanley itself lived through in 2015 through 2017. The flip signal to watch is announced, not completed, global merger volume and the initial-public-offering backlog, since announced deals lead fee-recognized revenue by several months.
Three years. This window is long enough that a capital-markets downturn is more likely than not to pass through somewhere inside it. Base case is about $240, assuming the cycle wobbles at some point but the wealth annuity and the buyback still carry per-share value higher on net. Bull case is about $310, if the reopening proves to be a genuine multi-year up-cycle rather than a spike and the premium multiple holds. Bear case is about $155, the correlated drawdown described later in this piece working its way through both earnings and the multiple at once. The variable that decides which path plays out is whether the wealth unit’s pretax margin holds near 30 percent through a soft investment-banking quarter, the one real test the “de-risked” story has not yet faced.
Five years. At this horizon the structure matters more than the cycle. Base case is about $255, the wealth annuity compounding at a mid-single-digit pace while the multiple gives back part of its current premium, producing something close to a market-like total return once the dividend is added. Bull case is about $355, if the firm sustains a return on tangible capital well above its own 20 percent goal, the combined wealth-and-investment-management client-asset base approaches the $10 trillion mark management has talked about, and the market keeps defending a multiple near four times book. Bear case is about $150, a genuine reversion of the multiple toward its historical average on earnings that have normalized rather than stayed at their current cycle-favorable level. The variable to track over this stretch is whether the growth in wealth-management net new assets, the net dollar amount of new client money the firm brings in, deposits minus withdrawals, counted before any market gain or loss on what clients already hold, is genuine share gain or mostly the stock market being higher, since industry data attributes the large majority of asset-management revenue growth across the sector to market appreciation rather than net flows, which is exactly why net new assets, not the headline asset total, is the cleaner read on organic growth.
Where the read lands today. On balance the read holds at Hold. Morgan Stanley is a genuinely higher-quality, higher-return franchise than the money-center banks, and the decade spent building the wealth business earned that premium. But the premium is now roughly double the stock’s own historical multiple and sits at or above where the sell-side, in aggregate, already expects the stock to trade, on earnings that are running at a cycle high rather than a sustainable run rate. Practically, that means: hold it if you already own it and do not chase the premium at this price. It would move up to Accumulate on a meaningfully cheaper entry point or on clear confirmation that the investment-banking upcycle has more room to run without the multiple expanding further. It would move down to Reduce if a market drawdown or a stall in the deal cycle starts compressing the multiple while the price has not yet adjusted. The single thing most likely to flip the read either way is whether the wealth-management margin holds through the next real soft patch in investment banking, since that is the one scenario that actually tests whether the diversification is real.
Companion tool
Jump to the interactive dashboard to sort and filter every bank and asset manager in this piece, or download the Excel model to flex the scenarios yourself.
TL;DR
Morgan Stanley runs three different businesses under one roof, and the reason the stock trades where it does is the mix between them. Wealth Management charges a fee on $2.79 trillion of client assets it advises on, a subscription-like revenue stream that barely notices a single bad quarter because the advisor’s pay is a formula tied to revenue, not a fixed salary. Institutional Securities gets paid per deal and per trade, advisory and underwriting fees on mergers and stock and bond offerings plus trading spreads, a business that just posted its best quarter ever ($10.7 billion of net revenue in the first quarter of 2026, ahead of Wealth Management’s own record $8.5 billion) but that can freeze almost overnight when markets turn, as it did in 2022. Investment Management is the smallest piece, charging a fee on $1.9 trillion of assets it runs directly. The firm’s return on tangible common equity, ROTCE, net income divided by tangible common equity and the standard measure of how much profit a bank wrings from each dollar of shareholder capital, is 21.6 percent for full-year 2025 and 27.1 percent in the first quarter of 2026 (a cycle-favorable print, not a stated run rate; the only number management has actually put in a filing is a 20 percent through-cycle goal), and it has climbed because the wealth-and-asset-management share of revenue has roughly doubled since Morgan Stanley bought E*Trade, the self-directed online brokerage, in 2020 for about $13 billion, and Eaton Vance, an active asset manager, in 2021 for about $7 billion, deals that together completed the firm’s pivot from a trading house toward a fee-based wealth-and-asset manager, and the market has rewarded that shift by re-rating the stock from below tangible book value after the financial crisis to roughly four times tangible book today, a premium to every money-center peer in this piece except Charles Schwab’s fundamentally different, asset-light brokerage model. The catch is that the premium is now about double Morgan Stanley’s own ten-year median multiple, the stock sits essentially at the sell-side’s average price target, and all three segments are ultimately levered to the same variable: the level of risk assets. A serious equity drawdown does not just hit the trading desk, it mechanically shrinks the fee base in wealth and asset management too and tends to freeze the deal pipeline at the same time, so the “diversification” the bull case leans on is thinner than it looks in exactly the scenario that would matter most. Add an unresolved, unquantified cash-sweep litigation overhang sitting on roughly a quarter of the wealth unit’s interest revenue and two consecutive quarters of gated redemptions in a small private-credit fund, and the honest read is Hold, Overvalued: a genuinely better business than it used to be, priced as if the good news is not just true but permanent.
Explore it yourself: the interactive dashboard
Open the dashboard in a full screen
The dashboard holds Morgan Stanley and the peer set covered in this piece, sortable by market cap, by what each name is to Morgan Stanley (money-center peer, wealth-management competitor, capital-markets proxy, or adjacent context), and by the two numbers that matter most here: price to tangible book value and return on tangible common equity. It also carries the full rating, the factor read behind it, and the bull, base, and bear horizon table.
Prefer a spreadsheet? Download the Excel model with the segment build, the peer valuation table, and the scenario math behind the horizon chart. The scenario levels in that file are illustrative arithmetic, not targets.
What Morgan Stanley actually does
Think of Morgan Stanley as three separate shops sharing one storefront and one balance sheet. The first shop sells advice on a subscription basis: a financial advisor manages a client’s money and charges a fee based on how much of it there is, a bit like a property manager who is paid a percentage of the rent roll rather than a flat wage. The second shop is a project business: it gets hired, deal by deal, to advise a company on a merger or to help a company sell stock or bonds to investors, and it earns a fee only when that specific project closes. The third shop manages other people’s money directly, in funds, and charges a fee on the assets it runs, without the advisor relationship the first shop has or the deal-by-deal structure of the second.
Those three shops are, in the filings, called Wealth Management, Institutional Securities, and Investment Management, and in the first quarter of 2026 they produced net revenue of $8.5 billion, $10.7 billion, and $1.5 billion respectively, against a firm-wide total of $20.6 billion. The company did not build this mix by accident. Wealth Management’s scale came substantially from two acquisitions, the E*Trade brokerage in 2020 and the Eaton Vance asset manager in 2021, which converted a large block of revenue that used to come almost entirely from trading and banking into a fee-based, subscription-like stream. Before those deals, Morgan Stanley looked a great deal more like Goldman Sachs does today: a firm whose earnings swing hard with the capital-markets cycle. After them, roughly half the firm’s revenue now comes from businesses that keep collecting fees whether or not a single merger gets announced that quarter.
The firm serves three kinds of clients across those shops: individual and family wealth clients (advisor-led, self-directed through E*Trade, and workplace-equity-plan participants through Shareworks and Equity Edge), corporations and financial sponsors that need advice, financing, or capital-raising, and institutional investors (hedge funds, pension funds, insurers) that trade and borrow through the firm’s markets desks. Total client assets across Wealth Management and Investment Management combined reached $9.3 trillion at the end of 2025, and $9.2 trillion at the end of the first quarter of 2026 after netting out about $350 billion counted in both segments. Management has talked publicly, at Morgan Stanley’s U.S. Financials Conference, about pushing the wealth business alone toward $10 trillion of client assets. That figure has not appeared as a stated target inside the 10-K or 10-Q filings themselves, so it should be read as management commentary rather than filed guidance, though it is corroborated across multiple independent news outlets covering the same remarks.
How the money flows
flowchart TD
    TOP["Client assets: $9.3T Wealth+Investment Mgmt (FY25)"]
    CORP["Corporate/sponsor deal & trading demand"]

    TOP --> WM["Wealth Mgmt: $2.79T fee-based assets"]
    TOP --> IM["Investment Mgmt: $1.87T AUM"]
    CORP --> IS["Institutional Securities: $10.72B net rev/Q1'26"]

    WM --> WMFEE["Asset-mgmt fees: $5.08B/qtr (annuity)"]
    WM --> SWEEP["Sweep deposits: $428B -> bank balance sheet"]
    WM --> TRANS["Transactional revenue: $1.13B/qtr"]
    SWEEP --> NII["Net interest income: $2.17B/qtr"]

    IS --> IB["Investment Banking: $2.12B/qtr (advisory+underwriting)"]
    IS --> TRADE["Equity+FI trading: $8.51B/qtr (cyclical)"]

    IM --> IMFEE["Asset-mgmt fees: $1.50B/qtr (annuity)"]

    WMFEE --> REV["Firm net revenue: $20.58B Q1'26"]
    NII --> REV
    TRANS --> REV
    IB --> REV
    TRADE --> REV
    IMFEE --> REV

    REV --> COMP["Compensation: $8.54B/qtr (42% of rev)"]
    REV --> OPEX["Non-comp expenses: $4.93B/qtr"]
    REV --> NETINC["Net income to MS: $5.57B/qtr, ROTCE 27.1%"]

    NETINC --> CAP["Capital layer: CET1 15.1% (Fed CCAR/SCB caps payout)"]
    CAP --> DIV["Dividend: $1.00/share/qtr"]
    CAP --> BUYBACK["Buybacks: $1.75B/qtr"]
    CAP --> RETAIN["Retained capital / reinvestment"]
Read the diagram top to bottom and the whole firm sits on two river systems that meet at the same delta. On the left, household savings and workplace equity flow into $2.79 trillion of fee-based client assets in Wealth Management, plus a smaller $1.87 trillion pool run directly inside Investment Management, and both bill a percentage of the asset level every quarter, whether the market went up or down that quarter. On the right, corporations and financial sponsors bring deal-by-deal demand into Institutional Securities, which converts that demand into advisory and underwriting fees plus trading revenue. A meaningful slice of Wealth Management’s clients also park cash on deposit with the firm’s own bank, roughly $428 billion of it, which the firm lends out and invests at a spread, adding a bank-like net interest income line on top of the pure fee business.
Those five revenue streams (wealth fees, sweep deposit spread, transactional commissions, investment banking, and trading) all land in one firm-wide net revenue number, $20.6 billion in the first quarter of 2026. From there the largest single cost, compensation, takes 42 cents of every dollar, and what is left after non-compensation expenses becomes net income, $5.57 billion in that quarter, a 27.1 percent return on tangible common equity. The last stop is capital: CET1, Common Equity Tier 1, is the core regulatory capital ratio, the highest-quality capital a bank holds to absorb losses before shareholders or depositors are at risk, and Morgan Stanley carries a 15.1 percent CET1 ratio against a Federal Reserve-set requirement of 11.8 percent. That requirement is not fixed; the Fed’s annual stress test sets a Stress Capital Buffer on top of the bare minimum, and that buffer, not just earnings power, gates how much capital Morgan Stanley can pay out through the dividend and the buyback each year.
The investing point in the shape of this diagram is that the left side (wealth and asset management) and the right side (institutional securities) look like two different businesses with two different rhythms, one steady and one lumpy, but they both ultimately bill off the same underlying variable: the level and direction of risk-asset prices. A rising stock market lifts the fee base on the left at the same time it emboldens boards and issuers to transact on the right. The reverse is also true, and that symmetry is the central tension this piece keeps returning to.
The three engines: Wealth Management, Institutional Securities, and Investment Management
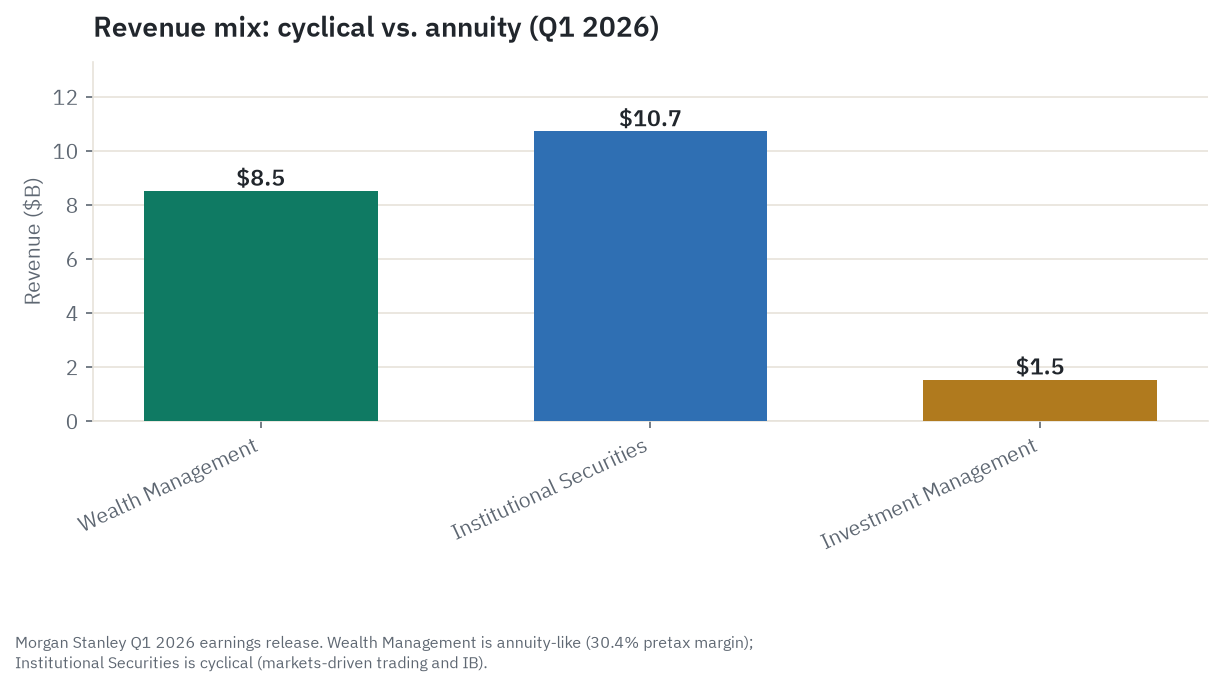
Wealth Management is the crown-jewel annuity, the business the wealth-pivot story is built around. Fee-based client assets stood at $2.79 trillion in the first quarter of 2026, up from $2.35 trillion a year earlier, and net new assets, the net dollar flow of new client money into the firm, ran $118.4 billion in the quarter versus $93.8 billion a year earlier. The segment’s pretax margin reached 30.4 percent in the first quarter, clearing a roughly 30 percent through-cycle target management has cited repeatedly in earnings calls and press coverage (not itself a formal, filed numeric target the way the firm-wide 20 percent return goal is), following 29.3 percent for full-year 2025. The margin has widened for three reasons that all show up in the numbers: scale, since the fixed cost of running the technology and compliance platform is now spread over a much larger asset base; a mix shift toward fee-based accounts and away from lower-margin, one-off brokerage commissions; and the E*Trade and workplace-equity funnel, which brings in large numbers of self-directed clients cheaply, some fraction of whom later convert into full advisory relationships. The single largest cost inside this segment, advisor compensation, is a formula tied to the revenue each advisor generates, so it automatically shrinks in a downturn without a management decision being required.
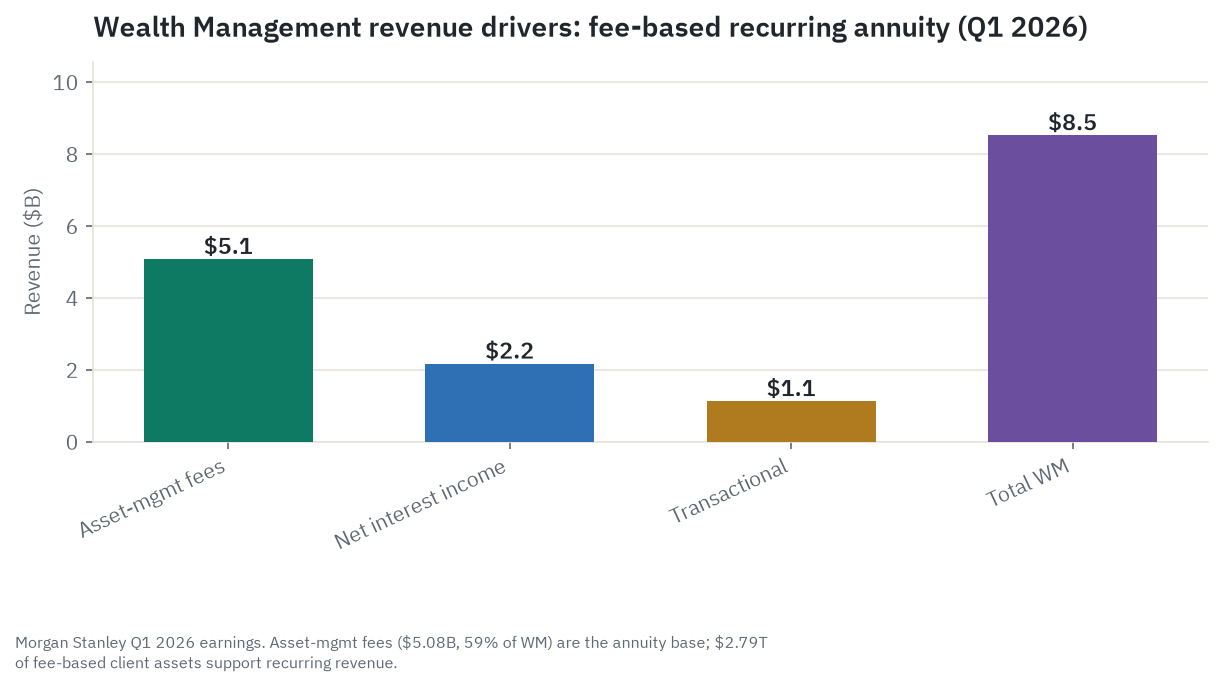
Within Wealth Management, the mix itself matters: asset-management fees made up $5.08 billion, or roughly 59 percent, of the segment’s revenue in the first quarter, the annuity core; net interest income (the spread earned on client cash sitting in Morgan Stanley’s own bank and on securities-based lending) was $2.17 billion, about 25 percent; and transactional commissions were $1.13 billion, about 13 percent. Part of that interest income comes from the cash sweep: when a wealth client’s brokerage account holds cash the client has not invested, Morgan Stanley automatically moves, or “sweeps,” it into a bank deposit or money-market product, then lends or invests that cash itself and keeps the spread between what it earns on it and what it pays the client. The putative class actions described later allege that spread was set unfairly wide, that clients should have been paid closer to prevailing market rates on their idle cash; nothing has been adjudicated, and the allegation is not a finding of wrongdoing. That interest-income slice is the one carrying the litigation overhang discussed later.
Institutional Securities is the cyclical engine, and despite the “wealth de-risks the firm” framing that dominates the bull case, it was in dollar terms the larger of the two big segments in the first quarter of 2026, $10.7 billion against Wealth Management’s $8.5 billion. Investment banking revenue inside the segment, advisory plus equity and debt underwriting, was $2.1 billion, up 36 percent from a year earlier, a genuine reflection of a reopened deal market rather than a one-off. Trading revenue, split between equities ($5.1 billion) and fixed income ($3.4 billion), makes up the larger share of the segment and is now leaning more on financing-type revenue (prime brokerage balances, essentially a lending spread embedded inside the trading business) than on pure trade execution. The segment’s pretax margin, roughly 39 percent in the first quarter, was actually the highest of the three, ahead of Wealth Management’s 30.4 percent, which underlines a point worth sitting with: the reason Morgan Stanley pivoted toward wealth was never that wealth has the fattest margin, it is that wealth’s margin is the most stable one across a full cycle, and a business that reliably earns 30 percent every quarter is worth more per dollar of average profit than one that swings between 40 percent in a good year and well under 20 percent in a bad one, even if the long-run averages end up similar.
Investment Management is the smallest and most purely market-linked of the three, running $1.87 trillion of assets under management for a net revenue of $1.5 billion in the first quarter, down 4 percent from a year earlier on weaker accrued carried interest from real-estate and infrastructure funds rather than any weakness in the core, fee-paying asset base. Its pretax margin, about 18 percent, trails Wealth Management’s because it lacks the embedded deposit and lending spread revenue Wealth Management has, and because a meaningful share of its distribution runs through third-party channels that take a cut. This segment exists largely to be sold alongside the other two rather than to compete head-on, on cost, with a scale player like BlackRock.
Who wins where
Institutional Securities sits inside a genuine oligopoly. Large-cap merger advisory and underwriting realistically has a handful of true competitors, Goldman Sachs, Morgan Stanley, JPMorgan, Bank of America, and Citigroup among the US-listed names, because the barriers to entry, balance-sheet scale, decades of relationship capital, regulatory licensing, deal-team expertise, are real and expensive to replicate. But the customers on the other side of the table, large corporations and financial sponsors, are sophisticated repeat buyers who run competitive processes, hire multiple advisors on the largest deals, and negotiate fees hard, so this is closer to an oligopoly with real countervailing buyer power than a business where the banks simply set the price. Trading and underwriting execution, by contrast, has been a scale-and-technology game for two decades, with spreads compressed by electronic and all-to-all trading platforms; Morgan Stanley’s durable edge there is balance-sheet commitment in financing-heavy businesses like prime brokerage, not pricing power on plain-vanilla execution.
Wealth management is a relationship business with real, if fraying, pricing power. The advisor relationship is a genuine switching-cost moat: clients rarely fire an advisor over a bad quarter in the market, they leave over broken service or trust, and Morgan Stanley’s 42-country footprint supports the kind of complex, high-net-worth needs (estate planning, lending against a concentrated stock position, private banking) a low-cost robo-advisor cannot easily replicate. Set against that, the industry-wide, multi-decade trend has been toward fee compression as index investing and fee transparency have spread, and Morgan Stanley’s own margin gains have come mostly from cost discipline and mix shift toward fee-based accounts rather than from raising the price charged per dollar of assets. Charles Schwab occupies the low-cost end of this same competitive space, and its scale in cheap custody is a genuine structural pressure on the fee rates the whole industry, including Morgan Stanley, can charge, even though Schwab is not a like-for-like valuation comparison given how differently the two businesses are capitalized.
Asset management, the smallest of the three engines, is the segment with the least pricing power. Passive and index investing has substituted for active management for more than twenty years, and firms like BlackRock, the sector’s scale leader in both index products and the Aladdin risk-management platform, set the pace on cost. Morgan Stanley’s Investment Management arm carves out a partial exception in areas that are harder to index, infrastructure and real-estate funds with carried-interest economics, where it competes as a specialist rather than on price.
Company by company: who’s who
Morgan Stanley (NYSE: MS), market cap approximately $329.7 billion as of June 30, 2026 (a range of $329.7 billion to $334 billion depending on the vendor and exact day sampled; see the data-quality notes below), is the leader in US wealth management by advisor-led client assets and a top-three global merger advisor and equities house. The first quarter of 2026 delivered record net revenue of $20.6 billion, net income of $5.4 billion, diluted earnings per share of $3.43, and a 27.1 percent return on tangible common equity, with Wealth Management revenue of $8.5 billion (up 16 percent, on a 30.4 percent pretax margin) driven by $118.4 billion of net new assets, and Investment Banking revenue rebounding 36 percent to $2.1 billion. Bull: the wealth business’s recurring fee revenue keeps compounding and, in theory, smooths the cyclical investment-banking business, with returns now running above the firm’s stated 20 percent goal. Bear: the stock trades at roughly double its own historical multiple of tangible book value for a firm where about half of revenue still tracks the capital-markets cycle directly, and where the same market drawdown that would hurt Institutional Securities would also shrink the wealth and asset-management fee base at the same time, undercutting the diversification story in the one scenario where it matters most.
Goldman Sachs Group (NYSE: GS), market cap approximately $310 billion as of June 30, 2026, is a global investment bank focused on institutional clients, running the largest pure-play Wall Street trading and banking franchise by revenue intensity, with a smaller wealth and asset-management arm than Morgan Stanley’s. First-quarter 2026 net revenues were $17.2 billion (up 14 percent), net earnings $5.6 billion (up 19 percent), and return on equity 19.8 percent, with a record $12.7 billion from Global Banking & Markets, including record equities revenue of $5.3 billion. Bull: the trading and banking franchise is firing on all cylinders, with record equities revenue and a reaccelerating deal pipeline. Bear: Goldman is the most capital-markets-cyclical of the group covered here, which makes it the cleanest read on how far Institutional-Securities-type revenue can fall once the current wallet reverses, a useful downside proxy for the cyclical half of Morgan Stanley’s own business.
JPMorgan Chase & Co. (NYSE: JPM) (full analysis), market cap approximately $882 billion as of June 29, 2026, is the largest US bank by assets, spanning consumer banking, commercial banking, a top global markets and investment bank, and its own asset and wealth-management arm. First-quarter 2026 net income was $16.5 billion (up 13 percent), managed revenue $50.5 billion (up 10 percent), with record Markets revenue of $11.6 billion and a 23 percent return on tangible common equity. Bull: scale, a deep deposit franchise, and diversification across consumer, commercial, and markets let JPMorgan outgrow and outearn most peers through a full cycle. Bear: JPMorgan’s own wealth and asset-management arm is growing client assets faster, roughly 20 percent year over year off a base approaching Morgan Stanley’s, from a larger and better-capitalized platform, meaning Morgan Stanley’s wealth-scale advantage is being actively contested rather than uncontested.
Bank of America Corp. (NYSE: BAC) (full analysis), market cap approximately $411 billion as of June 29, 2026, is the second-largest US bank by assets, with its own large wealth-management franchise (Merrill Lynch, Bank of America Private Bank) competing directly with Morgan Stanley and JPMorgan’s private bank. First-quarter 2026 net income was $8.6 billion (up 17 percent), earnings per share $1.11, the highest in roughly two decades, on net interest income of $15.7 billion (up 9 percent) and equities trading revenue up 30 percent to $2.8 billion, its best trading quarter in fifteen years. Bull: net-interest-income sensitivity combined with a reaccelerating trading and investment-banking business is driving the best earnings quarters in decades. Bear: more exposed to rate moves and consumer credit than the pure wealth-and-banking peers, but relevant here mainly as a valuation counterweight: at roughly 12.4 times forward earnings and 1.87 times tangible book, the cheapest multiple of the money-center set, Bank of America undercuts any argument that Morgan Stanley’s premium is simply “what banks cost right now.”
Charles Schwab Corp. (NYSE: SCHW), market cap approximately $160 billion as of June 28, 2026, is the largest US discount brokerage and registered-investment-advisor custodian, competing with Morgan Stanley and Merrill for mass-affluent and advisor-channel wealth clients. First-quarter 2026 net income was $2.5 billion (up 30 percent), record net revenues $6.5 billion (up 16 percent), total client assets $11.8 trillion (up 19 percent year over year, with Schwab’s own investor-relations release citing a record $13.14 trillion of total client assets in May 2026), core net new assets $140 billion, and 39.1 million active brokerage accounts. Bull: scale in low-cost custody and record net-new-asset growth give Schwab a durable, capital-light fee engine as rates normalize. Bear, and relevant here specifically: Schwab’s low-cost model is a structural pressure on the fee rates the whole wealth industry, Morgan Stanley included, can charge over time; and Schwab’s much higher 6.88 times price-to-tangible-book multiple should not be read as making Morgan Stanley look cheap by comparison, since Schwab is a fundamentally more asset-light custody business with far less tangible book to begin with. Note also that different firms in this comparison define “client assets” differently (custody versus assets under management versus assets under supervision), so the raw trillion-dollar figures across Schwab, Morgan Stanley, and the banks below are directionally, not precisely, comparable.
BlackRock, Inc. (NYSE: BLK), market cap approximately $158 billion as of June 30, 2026, is the world’s largest asset manager and the operator of the Aladdin risk-management platform used across the industry, including by firms like Morgan Stanley and Schwab. First-quarter 2026 assets under management reached a record $13.89 trillion, up from $11.6 trillion a year earlier, with $135.9 billion of long-term net inflows in the quarter and GAAP diluted earnings per share up 46 percent to $14.06. Bull: record assets under management, ETF inflows, and a growing private-markets and technology mix diversify BlackRock beyond plain fee compression. Bear: fee rates on index products keep compressing industry-wide, and BlackRock’s revenue, like Morgan Stanley’s Investment Management arm, is directly exposed to where equity and bond markets sit, not just to the pace of new inflows. BlackRock is included here mainly as adjacent context, an index-fund and distribution gatekeeper rather than a direct valuation comparison for Morgan Stanley.
Wells Fargo & Company (NYSE: WFC), market cap approximately $260 billion as of June 18, 2026, is a top-four US bank by assets with consumer, commercial, corporate, and wealth-management businesses, emerging from a multi-year Federal Reserve asset cap lifted in 2025. First-quarter 2026 net income was $5.25 billion (up from $4.89 billion a year earlier), earnings per share $1.60 (ahead of the $1.58 consensus), and period-end loans topped $1 trillion for the first time since early 2020. Bull: released from its asset cap, Wells Fargo can finally grow its balance sheet and lean back into trading and wealth growth. Bear: still working through the cost and credibility overhang of its past regulatory consent orders relative to cleaner peers like Morgan Stanley.
UBS Group AG (NYSE/SIX: UBS), market cap approximately $155 billion as of June 29, 2026 (primary listing on the Swiss exchange; a separate US listing trades under the same ticker but reports as a foreign private issuer with different filing conventions and foreign-exchange exposure), is the world’s largest wealth manager by invested assets since absorbing Credit Suisse in 2023, and a direct international competitor to Morgan Stanley’s wealth franchise. First-quarter 2026 net profit was $3.0 billion (up 80 percent), underlying pretax profit $4.0 billion (up 54 percent), Global Wealth Management net new assets $37 billion, and investment-bank revenue $4.1 billion (up 27 percent). Bull: Credit Suisse integration synergies are landing faster than guided, and record wealth and markets revenue show the combined franchise scaling well. Bear, and a relevant competitive flag: UBS’s larger global invested-asset book undercuts a loose reading of Morgan Stanley as “the largest wealth manager” in an unqualified sense. Morgan Stanley’s claim is more precisely the largest US advisor-led wealth manager, not the largest wealth manager globally, and UBS still carries integration and legal-liability tail risk of its own from the Credit Suisse merger.
What the filings say
Everything in this section is sourced directly to Morgan Stanley’s FY2025 Form 10-K (filed February 19, 2026, for the year ended December 31, 2025), the Q1 2026 Form 10-Q (filed May 5, 2026, for the quarter ended March 31, 2026), and the 2026 DEF 14A proxy statement (filed April 2, 2026). Figures are GAAP unless marked otherwise; return on tangible common equity and tangible book value per share are non-GAAP measures the firm defines and reconciles itself.
Revenue and profitability. Full-year 2025 net revenue was $70.6 billion, up 14 percent from $61.8 billion in 2024 and $54.1 billion in 2023, a clean three-year acceleration. Net income applicable to common shareholders rose 27 percent to $16.25 billion, and diluted earnings per share rose 28 percent to $10.21. Firm-wide pretax margin climbed to 31 percent from 28 percent in 2024 and 22 percent in 2023, and the expense-efficiency ratio (non-interest expense divided by net revenue, where lower is better) improved to 68 percent from 71 percent and 77 percent over the same span. Return on tangible common equity reached 21.6 percent for full-year 2025, well above the firm’s own stated 20 percent through-cycle goal, up sharply from 12.8 percent in 2023. The trend continued into the first quarter of 2026: net revenue of $20.58 billion (up 16 percent), diluted earnings per share of $3.43 (up 32 percent), and a return on tangible common equity of 27.1 percent. That last figure is worth flagging clearly: it is a cycle-favorable, record print, not a guided run rate. The only number Morgan Stanley has actually put in writing as a target, in the “Return on Tangible Common Equity Goal” section repeated in both the 10-K and the 10-Q, is 20 percent, described by the firm itself as “a forward-looking statement that is based on a normal market environment and may be materially affected by many factors.” Any forward math in this piece anchors on that 20 percent figure, not on the 27.1 percent cycle peak.
Segments. Full-year 2025 net revenue split $33.08 billion (47 percent of the firm, up 18 percent) for Institutional Securities, $31.75 billion (45 percent, up 12 percent) for Wealth Management, and $6.53 billion (9 percent, up 11 percent) for Investment Management. By pretax margin, Institutional Securities was actually the highest-margin segment in 2025 at 34 percent, up sharply from just 19 percent in 2023 as capital-markets activity reaccelerated, narrowly ahead of Wealth Management’s 29 percent (up from 25 percent in 2023) and well ahead of Investment Management’s 23 percent (up from 16 percent). By region, net revenue grew 13 percent in the Americas, 16 percent in EMEA, and 23 percent in Asia in 2025 (rates only; the underlying dollar breakdown was presented as a chart in the filing rather than as extractable text).
Wealth Management in detail. Total Wealth Management client assets were $7.38 trillion at the end of 2025, up from $6.19 trillion a year earlier, and $7.35 trillion at March 31, 2026. Fee-based client assets were $2.75 trillion at year-end 2025 (48 percent of advisor-led client assets) and $2.79 trillion at March 31, 2026. Net new assets ran $356.3 billion for full-year 2025 (versus $251.7 billion in 2024 and $282.3 billion in 2023) and $118.4 billion in the first quarter of 2026 alone (versus $93.8 billion a year earlier). Net interest income in the segment was $7.91 billion for full-year 2025 (down slightly from $8.12 billion in 2023 as rates fell, but up from $7.31 billion in 2024) and $2.17 billion in the first quarter of 2026, up 14 percent year over year. Combined firm-wide client assets across Wealth Management and Investment Management, netted for roughly $350 billion counted in both, reached $9.28 trillion at year-end 2025 and $9.21 trillion at March 31, 2026.
Balance sheet and liquidity. Total assets were $1.42 trillion at year-end 2025, up from $1.22 trillion a year earlier, and $1.58 trillion at March 31, 2026. Deposits were $415.5 billion at year-end 2025 and $428.0 billion at March 31, 2026; total borrowings were $348.9 billion at year-end 2025 and $371.6 billion at March 31, 2026 (of which $132.5 billion carried at fair value). Average liquidity resources over the trailing three months were $385.9 billion at year-end 2025, up from $345.4 billion a year earlier. Common equity was $101.9 billion and tangible common equity (non-GAAP) $79.1 billion at year-end 2025, rising to $104.5 billion and $81.5 billion by March 31, 2026. Book value per share was $64.37 at year-end 2025 and $66.18 at the end of the first quarter of 2026; tangible book value per share (non-GAAP) was $50.00 and then $51.58 over the same span, the figure the stock’s roughly four-times multiple is measured against.
Capital and capital returns. The standardized common equity tier 1 ratio was 15.0 percent at year-end 2025 (down from 15.9 percent a year earlier as the balance sheet and risk-weighted assets grew) and 15.1 percent at March 31, 2026; the advanced-approach ratio was 16.2 percent at year-end 2025. The Federal Reserve set Morgan Stanley’s Stress Capital Buffer at 4.3 percent effective October 1, 2025 (down from a preliminary 5.1 percent after the firm sought reconsideration), producing an aggregate standardized capital requirement of 11.8 percent, meaning the firm is running roughly 330 basis points above its regulatory minimum. On February 4, 2026, the Fed said that 4.3 percent buffer will hold through October 1, 2027, since the 2026 stress-test model revisions were not finalized in time to reset it. Capital returned to shareholders included $4.59 billion of share buybacks in full-year 2025 plus $1.75 billion in the first quarter of 2026 alone, under a reauthorized $20 billion, no-expiration repurchase program announced July 1, 2025. The common dividend was raised to $1.00 per share (declared January 15, 2026) from $0.925 a year earlier, roughly an 8 percent increase.
Share count. Weighted-average basic shares fell from 1.628 billion in 2023 to 1.591 billion in 2024 to 1.574 billion in 2025. Common shares outstanding fell from 1.607 billion at year-end 2024 to 1.583 billion at year-end 2025 to 1.580 billion at March 31, 2026, meaning buybacks are running ahead of new share issuance from equity compensation, so the net effect on shareholders is dilution-negative, the share count is shrinking even as employees keep receiving stock grants.
Disclosed risk factors that matter. Morgan Stanley’s own Item 1A risk-factor language flags four things directly relevant to this piece: results can be materially affected by market fluctuations and by global financial and economic conditions, touching both the trading/banking segment and client-asset levels and flows in wealth management; significant interest-rate changes can adversely affect results, with net interest income (about a quarter of Wealth Management’s revenue) explicitly identified as rate-sensitive; holding large and concentrated positions in market-making, underwriting, and lending (including margin lending) can expose the firm to losses; and extensive legal, regulatory, and compliance risk across anti-money-laundering, sanctions, and anti-corruption rules can produce fines, penalties, judgments, damages, settlements, or outright limits on the business.
Legal and regulatory matters (ongoing, not adjudicated, unless noted otherwise). Morgan Stanley Smith Barney and ETrade Securities are named defendants in consolidated putative class actions over cash-sweep interest rates, a Southern District of New York action (Estate of Sherlip, et al. v. Morgan Stanley, et al., amended complaint filed August 15, 2025, with a motion to dismiss filed by Morgan Stanley Smith Barney on September 12, 2025) and a New Jersey action (In re ETrade Cash Sweep Litigation, No. 2:24-cv-00603, lead counsel not yet appointed). The firm is separately responding to state securities regulators’ inquiries on brokerage cash-sweep balances. None of this had been adjudicated as of the 10-K’s February 19, 2026 filing date, and it remains open, with no new developments noted in the subsequent 10-Q. Peer firms have already settled comparable matters: Merrill Lynch paid $25 million and Wells Fargo $28 million plus $7 million (a combined $35 million) to the SEC in January 2025, and Oppenheimer settled its own private cash-sweep suit in April 2026, giving a rough sense of the range regulators and plaintiffs have accepted elsewhere, though Morgan Stanley’s own exposure has not been quantified or reserved for in its filings. Given that Wealth Management’s net interest income, roughly $7.9 billion for full-year 2025 and about a quarter of the segment’s revenue, is the line the sweep-rate allegations concern, that figure is best read as the outer ceiling of what is exposed, not as an expected loss; total disclosed legal expense for the firm was $137 million in 2025, which is not a meaningful proxy for cash-sweep exposure specifically. Separately, and already resolved within the period: an interest-rate-swaps antitrust class settlement received final court approval on July 17, 2025; a Dutch tax dispute involving two Morgan Stanley subsidiaries was resolved on November 27, 2025 via penalty orders of roughly €101 million (about $117 million), paid in the fourth quarter of 2025; and a UK Competition and Markets Authority gilts-trading antitrust settlement was announced February 21, 2025. On the regulatory side, the 2024 Department of Labor fiduciary rule was vacated in its entirety in March 2026 after the department stopped defending it in court, restoring the older 1975 five-part fiduciary test, a tailwind for the wealth business’s compliance costs, though whether a narrower replacement rule gets proposed is not yet settled, so this should be read as an ongoing regulatory development rather than a permanent all-clear.
Insider and institutional ownership. Per the 2026 proxy, Mitsubishi UFJ Financial Group is by far the largest disclosed shareholder at 380.0 million shares, 24.0 percent of common stock, per its Schedule 13D/A filed November 4, 2025, a strategic, commercial-alliance holder reflecting a long-standing capital and joint-venture relationship rather than a passive index position. The three large passive managers on file, State Street (7.2 percent), Vanguard (6.9 percent), and BlackRock (5.7 percent), are sourced from Schedule 13G/A filings dated late 2023 and early 2024, the most recent on file when the proxy was prepared, and are therefore stale relative to the March 2026 record date. All directors, the director nominee, and current executive officers as a group, 23 people, held 2.7 million shares as of February 27, 2026, well under 1 percent of shares outstanding, typical insider ownership for a bank holding company of this size. Recent Form 4 filings show nothing unusual: Chief Legal and Administrative Officer Eric Grossman sold 11,118 shares on April 20, 2026 at $190.00 to $191.50 per share, retaining 169,403 shares, consistent with routine post-vesting diversification rather than a large disposal, and a batch of 12 Form 4s filed June 2, 2026 reflect routine annual director equity-award grants rather than open-market purchases.
What the market is paying
All figures below were read on June 30 and July 1, 2026, from public market-data vendors. Prices, multiples, and short interest move daily; none of this is a price target. Where two vendors disagreed, both figures are shown rather than one being silently picked.
Price and range. Morgan Stanley closed at $209.04 on June 30, 2026 (prior close $211.72 on June 29). The 52-week range is $135.26 to $230.47, with the low set July 16, 2025 and the high, on a closing basis $227.09, set June 22, 2026. At $209.04, the stock sits roughly 77 percent of the way up its own 52-week range, about 9 percent below its recent closing high and about 55 percent above its 52-week low, the largest drawdown inside the current window. Market cap is approximately $329.7 billion, with shares outstanding of about 1.58 billion, down roughly 1.3 percent year over year on continued buybacks.
Returns. Over the trailing year to June 30, 2026, the stock returned about 48.2 percent on a price basis and 53.47 percent on a total-return basis with dividends reinvested; a separate vendor’s comparison tool showed a slightly different 46 percent price-only figure against the S&P 500’s roughly 20 percent over the same window, a gap consistent with different measurement windows rather than a real disagreement. Year-to-date 2026 returns are disputed across a wider band, roughly 15 percent to 24 percent, depending on which trading day a given vendor anchors as the start of the year. Over five years the stock returned about 127.2 percent on price and 168.33 percent on a total-return basis, against the S&P 500’s roughly 70.5 percent, a clear multi-year outperformance. A single-sourced three-year annualized return figure near 35.6 percent could not be corroborated on a second vendor within this research pass and should be treated as directional only.
Volatility and drawdown. Beta, the sensitivity of the stock’s moves to the broader market, runs about 1.21 to 1.22 on a five-year monthly basis across two sources, consistent with a capital-markets-sensitive business that moves somewhat more than the market. The deepest drawdown confirmed inside the current 52-week window is the roughly 9.3 percent pullback from the June 22, 2026 closing high to the current price; a separately circulating press reference to a much sharper drop in late March 2026 could not be confirmed against a primary price chart in this research pass and is not used here as an exhibit. For long-run context only, the stock’s historical maximum drawdown was about 88 percent during the 2008 financial crisis, a reminder that this remains a leveraged, cyclical business at its core even after the wealth pivot, though not a current risk reading.
Relative to the index and sector. Over both one and five years, Morgan Stanley has meaningfully outrun the S&P 500. Against its own sector exchange-traded fund, the Financial Select Sector SPDR (ticker XLF), the gap is wider still: XLF’s year-to-date 2026 return was roughly flat to down, in a range of negative 1.3 percent to negative 5.3 percent depending on the vendor and cutoff date, and its trailing one-year total return was only 2.2 percent to 2.8 percent. Morgan Stanley has drastically outpaced the average financial-sector stock, which is itself a signal worth weighing: a rich multiple sitting on top of a sector-beating run of returns leaves less room for a miss than a rich multiple built up gradually over years.
Valuation. Trailing price-to-earnings runs about 18.93 to 18.94 times across two vendors that agree closely; forward price-to-earnings is disputed, 17.43 times on one vendor and 17.86 times on another, both dated the same day, likely reflecting different consensus-earnings windows, best described as the high 17s. Dividend yield is about 1.89 to 1.91 percent. The multiple that matters most for a bank or broker-dealer is price to tangible book value, and here Morgan Stanley trades at roughly 4.05 times, using the current price against a tangible book value per share of $51.58 confirmed directly in the Q1 2026 10-Q. That is roughly 104 percent above the stock’s own ten-year median multiple of 1.94 times, meaningfully rich against its own history, not just against peers. Against the peer set, per GuruFocus (a single data vendor, dated late May 2026), Goldman Sachs trades at 2.92 times tangible book, JPMorgan at 2.87 times, and Bank of America at 1.87 times, all below Morgan Stanley, while Schwab trades at 6.88 times, above it, though Schwab’s asset-light, low-tangible-equity model makes that comparison apples to oranges rather than evidence Morgan Stanley is cheap. Cross-checking forward price-to-earnings and simple price-to-book across the same vendor and day: Goldman Sachs 16.72 times and 2.84 times, JPMorgan 14.62 times and 2.55 times, Bank of America 12.39 times and 1.47 times, Schwab 14.25 times and 3.78 times. Morgan Stanley’s forward earnings multiple is the richest of the group apart from being close to Schwab’s. A simple price-to-book figure for Morgan Stanley itself is stale (sourced to January 2026, in a range of 2.90 to 3.24 times) and is not used here as load-bearing; price to tangible book, better sourced and more current, carries the argument instead.
Liquidity and positioning. Average daily trading volume runs about 6.0 to 6.4 million shares across two vendors, comfortably liquid for institutional-size trading. Short interest, per MarketBeat, was 17.92 million shares (1.14 percent of float, 3.0 days to cover) as of June 15, 2026, down from 18.28 million shares (1.20 percent of float) on May 29, 2026, low and declining relative to a peer-group average of roughly 3.15 percent of float, meaning the market carries less bearish positioning against Morgan Stanley than against the average financial-sector name. Second-quarter 2026 earnings are scheduled for July 15, 2026, the next hard catalyst after this snapshot.
The sell-side. Consensus is disputed between vendors reading the same day and the same 25-analyst panel: one vendor labels it a Buy consensus with a mean price target of $207.62 (implying roughly flat-to-slightly-negative return from $209.04), while another labels the identical panel a Hold consensus (12 buy, 12 hold, 1 sell) with an average target of $210.50 (implying roughly flat-to-slightly-positive return). Both agree on the high end of the target range, $240, and roughly on the average, essentially where the stock already trades, but disagree on the rating label itself and meaningfully on the low end, $165 versus $177. Read across both, the honest summary is that the sell-side, in aggregate, is roughly split between Buy and Hold, with a target range of $165 to $240 and an implied return near flat from the current price, opinion rather than fact, and not to be confused with a guarantee.
Technicals. The 50-day moving average sits around $189.28 and the 200-day around $178.41 (both single-sourced from a market-movers note and not independently cross-checked on a dedicated charting site), both well below the current price, describing a stock in an extended uptrend, a so-called golden-cross configuration where the shorter-term average sits above the longer-term one. This describes where past trading has clustered; it does not predict what happens next.
What the crowd is saying
The dominant financial-press narrative through June 2026 is wealth-management maturation paired with a cyclical investment-banking recovery that is still being tested. On the warming side: record first-quarter net new assets, the firm’s own broadening of its wealth-management product lineup, and the rollout of artificial-intelligence agent integration into internal advisor tools like Shareworks and Equity Edge, all read as constructive. On the cooling side: Morgan Stanley’s own forecast of 20 percent growth in announced merger volume for 2026 (the firm’s own house view, self-interested and flagged as such) is optimistic if the macro backdrop holds, and hedged if it does not, and coverage explicitly notes the deal backlog sitting at a three-year high, which cuts both ways: a genuine tailwind if it converts, or the kind of “several consecutive record quarters” pattern that has historically preceded a cyclical air pocket. Chief Executive Ted Pick’s total compensation was raised to $45 million, three-quarters of it deferred and performance-vested, a signal of board confidence in the current strategy.
Retail and social attention on Morgan Stanley specifically is low in intensity; this is not a meme stock, and chatter concentrates among institutional and high-net-worth clients and finance-professional forums rather than the broad retail crowd. Where retail sentiment does spike, it has been narrow and specific: Reddit discussion scored roughly 30 to 35 out of 100 on a bearish scale in late May and early June 2026, driven almost entirely by the North Haven Private Income Fund’s redemption gating (detailed below), with one widely upvoted post (388 upvotes, 119 comments) framing the concern as “First JPMorgan, now Morgan Stanley,” a signal that institutional-investor frustration with private-credit liquidity is spreading across firms rather than being isolated to one name. This is a real, organic signal, not a coordinated campaign, but it is genuinely narrow: North Haven serves accredited and institutional clients, not retail, and the broader retail audience does not appear engaged with Morgan Stanley as a trading idea one way or the other.
Employee sentiment, via Glassdoor (19,784 reviews, 3.9 out of 5 overall), is stable but not exuberant: 76 percent would recommend the company and 73 percent report a positive outlook, with strong marks on career development, but repeated mentions of restructuring and layoffs and of slower growth after the first couple of years suggest ongoing headcount management rather than distress.
The most useful piece of this section is the divergence between the crowd’s story and the underlying numbers. The crowd’s story, echoed across analyst notes and wealth-client pitches, is that Morgan Stanley is a quality compounder with secular tailwinds, an aging high-net-worth population, growing alternatives penetration, a fee-based transition, that deserves a structurally higher multiple. The fundamentals genuinely support parts of that: record net new assets, a segment margin rarely matched among universal banks, a client-asset base that keeps growing. But the valuation the crowd is paying assumes the investment-banking recovery is happening now, not later; if the mergers-and-acquisitions rebound the firm itself has forecast slips into 2027, or rates move back up and deal velocity drops, the multiple has room to compress even while the wealth business keeps growing, exactly the pattern this piece’s research flags from 2015 through 2017, when Morgan Stanley’s own stock re-rated to a lower multiple over roughly two years despite growing wealth-management assets, because investment-banking revenue fell in the meantime. That divergence resolved through multiple compression, not a fundamental blowup, and it is the single clearest historical precedent for how the current premium could unwind without anything actually “breaking.”
Structural pivot or one trade wearing three hats?
The structural case for Morgan Stanley is genuinely different from a recycled Wall Street talking point. The wealth-and-asset-management share of firm net revenue was roughly a quarter of the total around 2010 and is now roughly half, a shift built substantially on two completed acquisitions, E*Trade in 2020 and Eaton Vance in 2021, that added scaled, sticky, fee-based client assets rather than merely promising a future pivot. That fee base, $2.79 trillion, now generates advisory and asset-management revenue that recurs quarter to quarter regardless of how Institutional Securities is doing, and it has been compounding: net new assets have run at $118 billion to $160 billion per quarter or year across recent periods, pulling the combined client-asset pool toward the $10 trillion figure management has referenced. Layer on a capital-markets cycle that has genuinely reopened (Institutional Securities posted record quarters through late 2025 and early 2026) and a regulatory backdrop that has flipped from a capital headwind (the 2023 Basel proposal) to something closer to neutral or a modest tailwind (the March 2026 Basel re-proposal, a stable Stress Capital Buffer, and a reauthorized $20 billion buyback), and the honest bull case is that Morgan Stanley now earns a structurally higher, more capital-light return on equity than at any prior point in its history, which is exactly what the stock’s re-rating from below tangible book value in the years after the financial crisis to roughly four times tangible book today is pricing in.
The real cyclical case, steel-manned rather than softened, is this: a market correction from today’s historically stretched valuation backdrop, with the S&P 500’s cyclically-adjusted price-to-earnings ratio sitting around 40, near an all-time high, is the single most probable event that would hit all three of Morgan Stanley’s segments at once, not sequentially. A 20 to 30 percent equity drawdown would mechanically cut Wealth Management’s $2.79 trillion fee base and its associated revenue by a similar order of magnitude with only a short lag; it would shrink Investment Management’s asset-linked fees the same way; and it would very likely freeze the merger and equity-underwriting reopening currently driving Institutional Securities’ record quarters, since deal committees and boards do not sign multi-billion-dollar transactions into falling markets and issuers pull public offerings rather than price them into a selloff, exactly as happened in 2022. Because Morgan Stanley’s “structural” wealth pivot and its “cyclical” capital-markets business are both ultimately priced off the same underlying variable, the level and confidence of risk assets, a genuine risk-off shock does not diversify away inside the firm the way the wealth-pivot narrative implies. It compounds across segments instead. The proximate trigger could be an actual rate hike (not just hawkish talk, and the Federal Reserve’s own June 2026 projections already show nine of eighteen policymakers leaning that direction), a credit event, disappointment tied to how concentrated the current market rally is in a handful of mega-capitalization technology names, or simple valuation mean reversion with no specific catalyst at all. Corrections of this kind historically do not require a clean reason; they are the mechanism by which multi-year risk-asset rallies end.
Working through the numbers on that specific scenario, a simultaneous 20 to 30 percent equity drawdown (call it 25 percent for illustration) would move through Morgan Stanley roughly as follows, using full-year 2025 actuals as the starting point and treating every figure below as an estimate, not a forecast:
-
Wealth Management’s asset-management fees, roughly $18.6 billion of full-year 2025 revenue, bill directly off the $2.79 trillion fee-based asset level. The mechanism is arithmetic, not behavioral: fees are charged as a percentage of whatever sits in a client’s account, so a $1 million account paying a 1 percent annual advisory fee generates about $10,000 a year, and if a 25 percent market decline cuts that account to $750,000, the fee owed the same year falls to about $7,500 even if the client never withdraws a dollar or fires the advisor. Multiply that across trillions of dollars of fee-based assets and a 25 percent drawdown cuts the segment’s revenue by a similar order with only a short lag, before a single client leaves, on the order of $4.0 billion to $4.6 billion off that revenue line alone, at the same time falling markets tend to discourage the deal activity Institutional Securities depends on, so the wealth and capital-markets engines soften together rather than one offsetting the other. Net interest income partly holds since it is more rate-dependent than market-dependent, though the cash-sorting-into-money-funds dynamic seen in 2023 and 2024 could resume. All told, Wealth Management’s revenue could fall from roughly $31.8 billion toward $27 billion to $28 billion, with pretax profit falling from about $9.2 billion toward roughly $6.5 billion to $7.0 billion as fixed costs stop deleveraging even as advisor compensation adjusts down automatically.
-
Investment Management’s $1.87 trillion asset base is the purest market-beta unit in the firm. The same drawdown, plus evaporating performance and carried-interest fees, could take segment revenue from roughly $6.5 billion toward $5.0 billion and pretax profit from about $1.5 billion toward roughly $0.7 billion.
-
Institutional Securities’ deal pipeline freezes in this scenario the way it did in 2022: boards do not sign mega-deals and issuers pull initial public offerings into a falling market. Investment banking revenue could roughly halve while trading revenue holds up somewhat better (volatility can actually help a trading desk), but financing balances in prime brokerage shrink. Segment revenue could fall from roughly $33.1 billion toward $24 billion to $25 billion, with the pretax margin compressing from 34 percent to the low 20s and pretax profit falling from about $11.2 billion toward roughly $5.0 billion to $5.5 billion.
-
Added together rather than offsetting one another, firm-wide net revenue could fall from $70.6 billion toward roughly $57 billion to $58 billion, a decline of 18 to 20 percent, with the firm-wide pretax margin compressing from 31 percent toward the low-to-mid 20s, net income to common falling from $16.25 billion toward roughly $10 billion, and diluted earnings per share falling from $10.21 toward roughly $6.3 to $6.5, a decline of 35 to 40 percent. Return on tangible common equity would drop from 21.6 percent toward roughly 13 to 14 percent, still profitable and with no balance-sheet stress (the capital ratio would stay comfortably above the 11.8 percent regulatory requirement), but nowhere near the 20 percent goal.
-
The multiple does the rest of the damage. On trough earnings the market would likely re-rate the stock, price to tangible book compressing from roughly 4.05 times toward 2.3 to 2.5 times, still above the ten-year median of 1.94 times, which at a tangible book value in the low-to-mid $50s to $65 per share works out to roughly $125 to $155 a share, a 25 to 40 percent decline from the current $209.04, with a lower trough entirely plausible intra-period. That is the arithmetic behind this piece’s five-year bear-case level.
The point of walking through those five steps is not to predict a crash. It is to show, with numbers rather than assertion, exactly how the “diversification” the bull case leans on can fail in the one scenario that would actually test it, since all three engines are ultimately levered to the same underlying variable.
The most likely outcome, weighing both sides, is a nuanced split: the wealth pivot is real, but it does not repeal the cycle. Morgan Stanley’s earnings power almost certainly has a genuinely higher floor than it did before 2020, the fee base is real, the deposit and lending funnel added through the E*Trade deal is real, and the capital-return capacity from a friendlier regulatory backdrop is real. But the ceiling, and the year-to-year variance around it, is still set by capital-markets and equity-market conditions. Expect continued strong results for as long as the current reopening and market rally persist, a meaningful though not catastrophic earnings and fee-revenue pullback in the scenario where equities correct 15 to 25 percent or the merger wallet re-freezes, and a valuation multiple, currently near four times tangible book, a ten-year high, that has already priced in a good deal of the “this time is structurally different” case, leaving relatively little room for the multiple to expand further even if the fundamentals hold up, and real room for it to compress if they do not.
The scenarios in detail
Four variables decide where the stock lands over the next five years, and every scenario below is just a different setting of these four dials.
-
The level and direction of risk assets, the master variable. This is the single dial that moves all three segments at once, as the stress-test walkthrough above demonstrates: Wealth Management fees bill off the $2.79 trillion fee-based asset level, Investment Management fees bill off the $1.87 trillion asset-under-management level, and Institutional Securities’ deal, underwriting, and financing wallet tracks risk appetite and corporate confidence directly. A rising market lifts all three at once; a 20 to 30 percent drawdown cuts all three at once. The current backdrop is a Shiller cyclically-adjusted price-to-earnings ratio around 40, near an all-time high.
-
The capital-markets wallet and Morgan Stanley’s share of it, the cyclical engine. Institutional Securities was the larger segment in dollar terms in the first quarter of 2026, with investment banking revenue up 36 percent year over year, so roughly half of firm revenue remains the volatile wallet, not the annuity. The size of the overall merger, underwriting, and financing pool is a macro variable outside Morgan Stanley’s control; the firm’s share of that pool is a competitive variable it does control. Both happen to be working in its favor right now, which is exactly what makes the current run rate cycle-favorable rather than durable.
-
Wealth Management margin durability and the quality of asset growth, the annuity. The segment’s pretax margin cleared its roughly 30 percent through-cycle target in the first quarter of 2026. The open question is whether 30 percent is a floor management can defend through a soft patch, or a ceiling reached only because markets have been rising, and how much of the recent net-new-asset growth is genuine market-share gain versus simple market appreciation. Industry-wide data attributes more than 80 percent of asset-management revenue growth across the sector to market appreciation rather than net new flows, so a meaningful chunk of the “compounding annuity” narrative would reverse if the market itself reversed.
-
The multiple, the re-rating risk. At roughly 4.05 times tangible book, about 104 percent above its own history, the market has already paid in full for the “structurally different, deserves a premium” story. This dial has relatively little room left to expand and real room to compress; the 2015-through-2017 precedent is that when the investment-banking wallet rolled over previously, the multiple compressed even while wealth-management assets kept growing.
Supporting dials worth tracking alongside the four above: capital return capacity (a $20 billion buyback authorization, a roughly $1.00-per-quarter dividend, and a 15.1 percent capital ratio against an 11.8 percent requirement, currently permitted by regulation and not merely by earnings), and the legal and regulatory overhang covered earlier (the cash-sweep litigation, the Basel III endgame re-proposal, and private-credit gating).
Bull scenario, “the wealth annuity compounds and the premium holds.” Risk assets grind higher and the capital-markets reopening proves to be a durable, multi-year up-cycle rather than a spike. Wealth Management net new assets stay above $100 billion per quarter with a genuine organic component, not just market beta, and the segment margin holds at or above 30 percent. Return on tangible common equity settles in the 22 to 24 percent range, above the firm’s 20 percent goal but below the 27 percent first-quarter 2026 peak. The buyback keeps shrinking the share count by roughly 1.5 percent a year, Basel III stays capital-neutral, and the cash-sweep litigation resolves without a material charge. The multiple holds near four times tangible book. Earnings per share compound from roughly $10 to $11 today toward the high teens, near $20, by 2030 or 2031, with tangible book per share compounding toward the low $80s. Illustrative valuation: roughly $355 at five years (path of $235, $255, $310, and $355 across the six-month, one-year, three-year, and five-year marks), built from roughly $20 of normalized earnings at about 17.5 times, cross-checked against roughly $85 of tangible book at about 4.1 times. Illustrative arithmetic, not a target. What has to be true: the premium multiple proves durable rather than cyclical, meaning the market keeps treating the wealth mix as a genuine reducer of the cost of capital even through a soft investment-banking quarter. The single thing most likely to break it: the investment-banking wallet turns and the multiple compresses anyway, the 2015-through-2017 pattern repeating and proving the premium was cyclical after all.
Base scenario, “a great franchise at a full price.” Markets are choppy but do not crash; the investment-banking cycle wobbles somewhere across the five years, a soft patch rather than a 2022-scale freeze. Wealth Management margin holds in the 28 to 30 percent range, return on tangible common equity runs near the 20 percent goal through the cycle, and the multiple normalizes gradually from roughly 4.05 times tangible book toward 3.2 to 3.5 times, still a premium to the money-center peers but off its current peak, as growth decelerates. Capital return continues on roughly the current pace. Earnings per share grow at a mid-single-digit pace from about $11 toward $15 to $17 by 2030 or 2031, partly from operating leverage and partly from the shrinking share count, while tangible book per share compounds toward the low $70s; multiple compression offsets much of the earnings growth, so price appreciation runs around 4 percent a year plus the roughly 1.9 percent dividend. Illustrative valuation: roughly $255 at five years (path of $212, $220, $240, and $255), built from roughly $16.5 of normalized earnings at about 15.5 times, cross-checked against roughly $72 of tangible book at about 3.3 times, a roughly market-like total return, not a re-rating. What has to be true: the wealth annuity really does put a higher floor under earnings than it did before 2020, and the multiple gives back only part of its current premium. Most likely to break it: the multiple reverts faster than earnings grow, tipping into the bear case, or the reopening runs hotter and longer than expected, tipping into the bull.
Bear scenario, “peak earnings meet a peak multiple at the wrong point in the cycle.” This is the steel-manned bear case, not a softened one. Equities correct 15 to 25 percent from around a 40 cyclically-adjusted price-to-earnings ratio, whether triggered by a hawkish Fed surprise, a growth scare, disappointment tied to the concentrated mega-capitalization rally, or plain valuation mean reversion with no specific catalyst. The merger and underwriting pipeline that drove the record Institutional Securities quarters stalls; the $2.79 trillion fee base and $1.87 trillion asset-management pool reset down with a lag, so wealth and asset-management fee revenue falls and cannot offset the Institutional Securities air pocket. Forward earnings estimates come down 25 to 40 percent from the peak run rate, and return on tangible common equity falls toward the low-to-mid teens. The roughly four-times price-to-tangible-book multiple compresses toward the historical mix-adjusted average because the premium was already fully priced. A cash-sweep litigation headline and a spreading private-credit liquidity scare (North Haven-style gating extending beyond one small fund) act as accelerants rather than causes. Revenue falls high-teens to roughly 20 percent in the trough year; earnings per share trough near $6 to $7, with the multiple doing most of the damage. Illustrative valuation: roughly $150 at five years, and a deeper intra-period trough is plausible (path of $178, $165, $155, and $150), built from roughly $65 of tangible book per share at about 2.3 times (still above the stock’s own 1.94-times median), cross-checked against roughly $10 of normalized-recovery earnings at about 15 times. That is roughly a 28 percent decline from the current $209.04, and the honest framing is that Morgan Stanley “does not need a disaster to fall 25 to 35 percent, it only needs peak earnings to meet a peak multiple.” What has to be true: a garden-variety cyclical correction while the multiple sits at a ten-year high, nothing more exotic than that. Most likely to save the bull case instead: the wealth-management margin genuinely holds around 30 percent through the drawdown and the market keeps paying the premium, validating the de-risking thesis in the one scenario that actually tests it.
Catalysts and timeline. In the near term: second-quarter 2026 earnings on July 15, the next scheduled test of whether the wealth-management margin holds and the investment-banking backlog is still building; third-quarter earnings in October, testing whether the string of record quarters extends or hits a post-record air pocket; Federal Reserve meetings through 2026 against a June projection set that turned hawkish, where an actual rate increase, not just hawkish language, would be the specific trigger that could re-freeze deal financing the way it did in 2022; the final text of the Basel III endgame capital rule after the June 18, 2026 comment period closed, and any change to Morgan Stanley’s global systemically important bank surcharge bucket, which determines whether the current $20 billion buyback capacity is durable; the broader 2026 bank capital cycle and industry expectations for dividend increases; developments in the cash-sweep litigation docket, including any motion-to-dismiss ruling in the New York or New Jersey actions or any reserve disclosure; and a third consecutive quarter of North Haven redemption gating, which would harden the private-credit-liquidity narrative if it happens. Over the multi-year horizon, the capital-markets cycle eventually turning is the single most probable event in this file, with the 2015-through-2017 period as the direct historical precedent for multiple compression happening even while wealth-management assets kept growing; whether the 30 percent wealth-management margin proves to be a floor or a ceiling once markets stop rising; the pace of net new assets versus market appreciation as the E*Trade and workplace-equity funnel matures, a dynamic some outside analysts have called “asset migration fatigue”; the multi-year growth of private credit as a structurally smaller wallet for bank underwriting and financing even in a healthy deal environment; the 2027 stress-test cycle that resets the Stress Capital Buffer currently held at 4.3 percent through October 2027; and, on a five-to-ten-year horizon, whether artificial-intelligence-driven advice tools begin to compress the pricing power of the human-advisor relationship, an early-stage, watch-list-only risk today.
Leading indicators. The handful of things worth tracking in real time to see which scenario is winning: the level of the S&P 500 and the VIX, the single most direct read on all three segments at once; announced, not just completed, global merger volume and the initial-public-offering backlog, since announced deals lead fee-recognized revenue by three to nine months and a slowdown here is the earliest warning of an Institutional Securities air pocket; the wealth-management pretax margin, quarter over quarter, where holding near 30 percent through a soft investment-banking quarter would validate the de-risking thesis and slipping below it would confirm the bear case; wealth-management net new assets and fee-based flows, ideally split from pure market appreciation, where a deceleration in the organic component specifically would signal the growth engine maturing; the trend in wealth-management net interest income, watching whether the 2023-and-2024 cash-sorting-into-money-market-funds headwind stays reversed or resumes if the Fed eventually cuts; the price-to-tangible-book multiple itself, where movement from roughly four times back toward three times or below is the re-rating the bear case is built on, and can happen without any fundamental miss at all; and North Haven or broader private-credit redemption gating alongside any cash-sweep litigation reserve disclosure, the two accelerants that could sharpen a currently soft narrative into an active selling signal.
Companies to watch (bull / base / bear)
Morgan Stanley (MS), the subject of this piece. Bull: the wealth-management fee annuity keeps compounding and smooths the cyclical investment-banking business, with returns running above the firm’s own 20 percent goal. Bear: all three segments are ultimately levered to the same risk-asset variable, so that smoothing fails precisely in the market correction scenario where it would matter most, and the stock already trades roughly 104 percent above its own ten-year median price-to-tangible-book multiple and at or above the sell-side’s average target, meaning peak earnings are meeting a peak multiple at the same time. Watch: whether the wealth-management margin holds near 30 percent through a genuinely soft investment-banking quarter, and any development in the cash-sweep litigation docket.
Goldman Sachs (GS), the cleanest downside proxy for the cyclical half of Morgan Stanley’s business. Bull: the trading and banking franchise is firing on all cylinders, with record equities revenue. Bear: Goldman is the most capital-markets-cyclical of the major names covered here, useful precisely because it shows, without the wealth-management offset, how far Institutional-Securities-type revenue can fall once the current wallet reverses. Watch: Goldman’s quarterly trading and banking revenue trend as an early read on the broader capital-markets cycle Morgan Stanley shares exposure to.
JPMorgan Chase (JPM), the scale peer contesting Morgan Stanley’s wealth-management moat. Bull: scale and diversification across consumer, commercial, and markets businesses let it outgrow and outearn most peers through a cycle. Bear: JPMorgan’s own asset and wealth-management arm is growing client assets faster, roughly 20 percent year over year, off a base approaching Morgan Stanley’s, meaning Morgan Stanley’s wealth-scale advantage is being actively contested by a larger, better-capitalized rival rather than left uncontested. Watch: JPMorgan’s wealth-and-asset-management net new asset growth rate relative to Morgan Stanley’s own.
Bank of America (BAC), the valuation counterweight. Bull: net-interest-income sensitivity plus a reaccelerating trading and investment-banking business are driving the best earnings quarters in roughly two decades. Bear, and most relevant here: at the cheapest multiples in the money-center set, roughly 12.4 times forward earnings and 1.87 times tangible book, Bank of America directly undercuts any argument that Morgan Stanley’s premium is simply “the going rate for a bank stock right now.” Watch: whether Bank of America’s own multiple re-rates higher, which would suggest sector-wide multiple expansion rather than a Morgan Stanley-specific premium.
Charles Schwab (SCHW), the low-cost pressure on wealth-industry fee rates. Bull: scale in low-cost custody and record net-new-asset growth give it a durable, capital-light fee engine as rates normalize. Bear, and relevant to Morgan Stanley specifically: Schwab’s low-cost model keeps compressing the fee rates the whole wealth industry, Morgan Stanley included, can charge over time; Schwab’s own 6.88-times price-to-tangible-book multiple should not be read as making Morgan Stanley look cheap by comparison, since the two are fundamentally different, differently capitalized businesses. Watch: the pace of industry-wide fee-rate compression and whether it accelerates.
UBS Group (UBS), the global wealth-management competitor. Bull: Credit Suisse integration synergies are landing faster than guided, with record wealth and markets revenue. Bear, and a useful competitive flag: UBS’s larger global invested-asset book is a reminder that Morgan Stanley’s “largest wealth manager” claim is more precisely the largest US advisor-led wealth manager, not the largest globally, and UBS still carries its own integration and legal tail risk from the Credit Suisse merger. Watch: the pace of UBS’s remaining Credit Suisse integration and whether any residual legal costs surface.
BlackRock (BLK), adjacent context as the industry’s index-fund and distribution gatekeeper. Bull: record assets under management and a growing private-markets and technology mix diversify it beyond plain fee compression. Bear: fee rates on index products keep compressing industry-wide, and BlackRock’s revenue is directly exposed to where markets sit, much like Morgan Stanley’s own Investment Management arm. Watch: as context rather than a direct valuation comparison for Morgan Stanley.
Wells Fargo (WFC), context on bank-sector recovery pace. Bull: released from its multi-year Federal Reserve asset cap, it can finally grow its balance sheet and lean back into trading and wealth growth. Bear: still working through the cost and credibility overhang of its past regulatory consent orders relative to cleaner peers. Watch: as broader sector context rather than a direct wealth-management comparison.
Risk controls
The honest risk picture starts with cyclicality: despite the wealth pivot, roughly half of Morgan Stanley’s revenue still tracks the capital-markets cycle directly through Institutional Securities, and the numbered stress scenario above shows that a real market drawdown does not spare the “annuity” segments either, since their fee bases are asset-price-linked too. Concentration compounds this: the investment-banking and trading wallet is inherently lumpy, dependent on deal committees, issuer confidence, and financing conditions that can freeze quickly, as they did in 2022. Valuation risk is arguably the largest single factor right now: at roughly four times tangible book, about double the stock’s own ten-year median, and at or above the sell-side’s average price target, there is little room for the multiple to expand further even on continued good news, and real room for it to compress on anything short of a disaster. Legal and regulatory risk sits specifically on the wealth-management net interest income line, where the cash-sweep class actions remain open and unquantified, and more broadly on the Basel III endgame rulemaking, still not finalized as of this research date, and the eventual shape of any replacement Department of Labor fiduciary rule. Liquidity and access are not concerns here: the stock trades roughly 6 million shares a day and is highly liquid, with low and declining short interest.
What would make a bull turn more cautious: announced merger and equity-underwriting volume rolling over while the multiple is still near four times tangible book, echoing the 2015-through-2017 pattern where the premium proved cyclical rather than structural; the wealth-management pretax margin slipping below roughly 28 percent in a down-market quarter, which would fail the one real test of the de-risking thesis; a cash-sweep litigation reserve or settlement charge getting quantified against the roughly $8 billion annual wealth-management net interest income line; or private-credit redemption gating spreading beyond the North Haven fund into the firm’s broader alternatives distribution.
What would make a bear reconsider: the wealth-management margin genuinely holding near 30 percent through a soft investment-banking quarter, proving the annuity smooths the cycle in the scenario that actually matters; the multiple de-rating toward roughly three times tangible book without an accompanying earnings hit, removing the valuation objection while the franchise keeps compounding; net new asset growth proving substantially organic rather than driven by market appreciation, defending the “compounding annuity” story directly; or the Basel III endgame staying capital-neutral while the buyback keeps shrinking the share count faster than expected, mechanically lifting per-share value.
The single piece of disconfirming evidence that would matter most either way is a real, simultaneous drawdown that hits the wealth-management fee base, the investment-management asset base, and the investment-banking wallet all at once, the scenario modeled in detail above. If that happens and the resulting hit to blended earnings and returns is smaller than the roughly 35 to 40 percent earnings decline and 13 to 14 percent return on tangible capital modeled here, the diversification argument is more real than the bear case gives it credit for. If the hit is as large or larger, the “one trade wearing three hats” critique is confirmed, and the current four-times multiple has no real defense.
Methodology, sourcing, and data-quality flags
This research draws on Morgan Stanley’s FY2025 Form 10-K, Q1 2026 Form 10-Q, and 2026 DEF 14A proxy statement as primary sources for financial and legal facts, cross-checked against multiple market-data vendors (Yahoo Finance, stockanalysis.com, GuruFocus, MarketBeat) for point-in-time price, valuation, and consensus data, and against press coverage (Bloomberg, Reuters, Financial Planning, AdvisorHub, and others) for management commentary and sentiment context, each attributed by tier. Every load-bearing figure in this piece traces to a claim recorded with a source and a confidence tier; a small number of claims that could not be independently cross-checked against a second source are flagged below rather than presented as settled fact.
Here is the full five-factor read behind the rating, in plain terms, since methodology is where that detail belongs rather than in the body of the piece above.
Valuation is unambiguously the weakest factor. Morgan Stanley trades at roughly 4.05 times tangible book value, close to double its own ten-year median of 1.94 times, and its forward earnings multiple, in the high 17s, is the richest in this peer set apart from Schwab’s fundamentally different business model. The stock sits essentially at the sell-side’s average price target rather than at a discount to it. A genuinely higher-quality mix versus the money-center banks justifies some premium, which is why this factor reads as clearly negative but not maximally so.
Growth reads mildly positive. Full-year 2025 net revenue grew 14 percent, diluted earnings per share grew 28 percent, wealth-management net new assets hit a quarterly record, and investment-banking revenue grew 36 percent year over year, with a long runway in wealth management toward the client-asset ambition management has referenced. The offset is that a large share of this recent growth is cyclical, the investment-banking reopening, and market-driven, since industry data attributes more than 80 percent of asset-management revenue growth sector-wide to market appreciation rather than net new flows, so the durable, organic growth rate is almost certainly slower than the headline figures suggest.
Quality is the strongest factor by a clear margin. Return on tangible common equity of 21.6 percent for full-year 2025 sits above the firm’s own stated 20 percent through-cycle goal, the wealth-management segment clears a 30 percent pretax margin, the capital ratio carries roughly 330 basis points of buffer above the regulatory requirement, and the share count is shrinking even after ongoing equity-compensation issuance. This is a genuinely higher-quality franchise than the money-center banks it is compared against here.
Risk reads clearly negative. The correlated cross-segment drawdown exposure modeled in detail above is real and quantifiable, not hypothetical; roughly a quarter of wealth-management revenue, the net interest income line, sits under an unquantified cash-sweep litigation cloud; a small private-credit fund has gated redemptions twice in six months as an early liquidity-stress signal; roughly half of firm revenue still sits in the genuinely cyclical Institutional Securities wallet; and the stock’s beta of about 1.21 sits against a valuation backdrop, a cyclically-adjusted price-to-earnings ratio near 40, that is itself historically stretched.
Momentum, treated here as a soft, low-weight factor, is mildly positive. The price trend has been strongly positive, up about 48 percent over the trailing year, running well above both the 50-day and 200-day moving averages in a golden-cross configuration, with low and declining short interest. Against that, the stock is trading at or above the sell-side’s average target and several recent analyst actions have specifically cited valuation as a concern, so momentum reads as positive but stretched rather than an unambiguous tailwind.
The overall lean is a genuinely higher-quality, higher-return franchise than the money-center banks, one that has earned real credit for the decade spent building the wealth-management annuity, priced at roughly double its own historical multiple on earnings running at a cycle high rather than a sustainable run rate, with a diversification argument that this research shows collapsing in the one drawdown scenario that would actually test it. The quality and growth strengths are real, but they are capped by demanding valuation and correlated, late-cycle risk, so the actionable read lands at Hold, as a labeled research signal, not personalized investment advice.
Data-quality flags:
- Morgan Stanley’s market capitalization is genuinely vendor- and date-sensitive: cross-vendor readings for June 2026 ranged roughly from $280.9 billion to $344.3 billion depending on the exact day and vendor sampled. This piece uses the reconciled range of $329.7 billion to $334 billion for June 30, 2026, with $329.7 billion (agreed by Yahoo Finance and stockanalysis.com, both same-day, both consistent with the SEC-confirmed share count) as the best point estimate. A previously circulating figure near $340 billion did not survive a direct check of its own cited source and is not used here.
- Forward price-to-earnings and peer price-to-book multiples carry vendor-definition risk from different consensus-earnings sources and different book-value cutoff dates; this piece reports ranges and orderings rather than single decimals for Morgan Stanley and its peers alike, and the same caveat applies to the one-year and year-to-date return figures for both Morgan Stanley and the Financial Select Sector SPDR (XLF).
- The sell-side “consensus rating” is a bucketing convention, not a fact: two vendors drew the Buy/Hold line differently from the identical 25-analyst panel on the same day. This piece reports the distribution and the target-price range rather than a single word.
- The cash-sweep litigation (Southern District of New York and New Jersey putative class actions) is open and unresolved as of the research date, with no liability adjudicated. Morgan Stanley’s own regulatory inquiry from the SEC closed without enforcement action, but the private class actions remain pending; this piece does not characterize the matter as resolved or as evidence of wrongdoing, and sizes the exposure against the wealth-management net interest income line as a ceiling, not an expected loss.
- The global 1Q 2026 investment-banking fee-pool figure and the peer price-to-tangible-book comparison table each rest on a single data house (LSEG and GuruFocus respectively) that could not be cross-checked against an independent second source within this research pass; both are treated here as analyst-tier estimates rather than independently verified facts.
- Morgan Stanley’s short interest figure (per MarketBeat) could not be reconciled against a conflicting reading from a different short-interest aggregator that failed a basic sanity check against the firm’s share count; the MarketBeat figure is used here as the better-supported of the two, hedged accordingly.
- The often-cited $10 trillion combined client-asset ambition and the roughly 30 percent wealth-management margin “through-cycle target” are both management commentary reported across multiple news outlets, not language stated as a formal, numeric target inside the 10-K or 10-Q text itself; only the firm-wide 20 percent return-on-tangible-common-equity goal carries that filed status, and this piece anchors its forward math on that 20 percent figure rather than on the 27.1 percent cycle-peak print from the first quarter of 2026.
- The Shiller cyclically-adjusted price-to-earnings ratio for the S&P 500 is reported here at approximately 40, per GuruFocus and multpl data for June 2026, rather than a higher figure (approximately 42.5) that circulated in an earlier pass of this research and could not be pinned to a single, dated primary series.
- A previously circulating reference to a roughly 30 percent intra-year stock-price drawdown in March 2026 could not be confirmed against a primary price chart in this research pass and has been dropped rather than used as a headline exhibit; the confirmed drawdown used in this piece is the roughly 9.3 percent pullback from the June 22, 2026 closing high.
Key sources: Morgan Stanley FY2025 Form 10-K (filed February 19, 2026) and Q1 2026 Form 10-Q (filed May 5, 2026), sec.gov; Morgan Stanley 2026 DEF 14A proxy statement, sec.gov; Morgan Stanley Q1 2026 and FY2025 8-K earnings releases, sec.gov; Federal Reserve Stress Capital Buffer announcement (February 4, 2026) and FOMC Summary of Economic Projections (June 2026), federalreserve.gov; Yahoo Finance, stockanalysis.com, GuruFocus, and MarketBeat for point-in-time price, valuation, and consensus data (June 30 and July 1, 2026); SEC.gov press release on Merrill Lynch and Wells Fargo cash-sweep settlements (May 2025); company filings and investor-relations releases for Goldman Sachs, JPMorgan Chase, Bank of America, Charles Schwab, BlackRock, Wells Fargo, and UBS.
Structured data for search and rich results
{
  "@context": "https://schema.org",
  "@type": "Article",
  "headline": "Morgan Stanley stock: 4x book at cycle peak, bull/base/bear to 2030",
  "description": "MS stock forecast 2026-30: Hold, Overvalued. Bull/base/bear across 6 months to 5 years on a wealth manager at 4.05x tangible book (2x median) with cyclical diversification collapse risk.",
  "author": {
    "@type": "Organization",
    "name": "Deep Market Research"
  },
  "datePublished": "2026-06-30",
  "dateModified": "2026-06-30",
  "image": "/og/ms.png",
  "url": "/posts/ms/"
}
{
  "@context": "https://schema.org",
  "@type": "FAQPage",
  "mainEntity": [
    {
      "@type": "Question",
      "name": "What is the Morgan Stanley stock price forecast for 6 months?",
      "acceptedAnswer": {
        "@type": "Answer",
        "text": "Base case around $212 (roughly flat to modestly higher from $209.04). Bull case near $235 if investment banking beats and the Fed stays benign. Bear case near $178 on a hawkish surprise or market wobble, back toward the 200-day moving average."
      }
    },
    {
      "@type": "Question",
      "name": "What is the Morgan Stanley stock outlook for 1 year?",
      "acceptedAnswer": {
        "@type": "Answer",
        "text": "Base case around $220 on modest earnings growth with the multiple roughly steady. Bull case around $255 if the capital-markets reopening extends and the wealth business keeps compounding. Bear case around $165 if announced deal volume rolls over and the multiple compresses toward the historical average."
      }
    },
    {
      "@type": "Question",
      "name": "What is the Morgan Stanley stock forecast for 3 years?",
      "acceptedAnswer": {
        "@type": "Answer",
        "text": "Base case around $240 assuming the cycle wobbles but the wealth annuity and buyback carry per-share value higher. Bull case around $310 if the reopening proves a durable multi-year cycle and the premium multiple holds. Bear case around $155 if a correlated drawdown hits all three segments at once."
      }
    },
    {
      "@type": "Question",
      "name": "What is the Morgan Stanley stock price target for 5 years?",
      "acceptedAnswer": {
        "@type": "Answer",
        "text": "Base case around $255 with the wealth annuity compounding at mid-single digits while the multiple gives back part of its current premium, producing a market-like total return with the dividend. Bull case around $355 if returns stay above 20% ROTCE and the multiple defends near 4x book. Bear case around $150 if the multiple reverts toward its historical average on normalized earnings."
      }
    }
  ]
}
Prepared June 30, 2026. Figures are point-in-time and will change. This is research and analysis for educational purposes, not investment advice, not a recommendation, and not a solicitation. Morgan Stanley is a leveraged play on capital-markets cycles and financial regulation, so these figures can move faster and further than a typical stock when the cycle turns. Verify all figures independently and consult a licensed financial advisor before making any decision.