
Research date: June 22, 2026 | OSINT research on JPMorgan Chase & Co. (NYSE: JPM), how a universal bank turns deposits into net interest income, fees, and trading profit, the late-cycle credit and capital questions hanging over it, and the money-center and markets peers it is measured against. Live prices, stamped hard.
Important disclaimer. This is OSINT (open-source intelligence) research published for educational and informational purposes only. It is not investment advice, not a recommendation to buy, sell, or hold any security, and not a solicitation. I am not a financial advisor. Banks are leveraged plays on the credit cycle, the rate path, and regulation, so the figures here can move faster and further than a typical stock when the cycle turns. All figures are point-in-time as of the stated research date (June 22, 2026) and move fast: prices, market caps, share counts, and capital ratios will be stale by the time you read this. Any bull, base, or bear scenarios are illustrative arithmetic on stated assumptions, not price targets. Do your own due diligence and consult a licensed financial advisor before making any decision.
Where this stock could be in 6 months, 1 year, 3 years, and 5 years
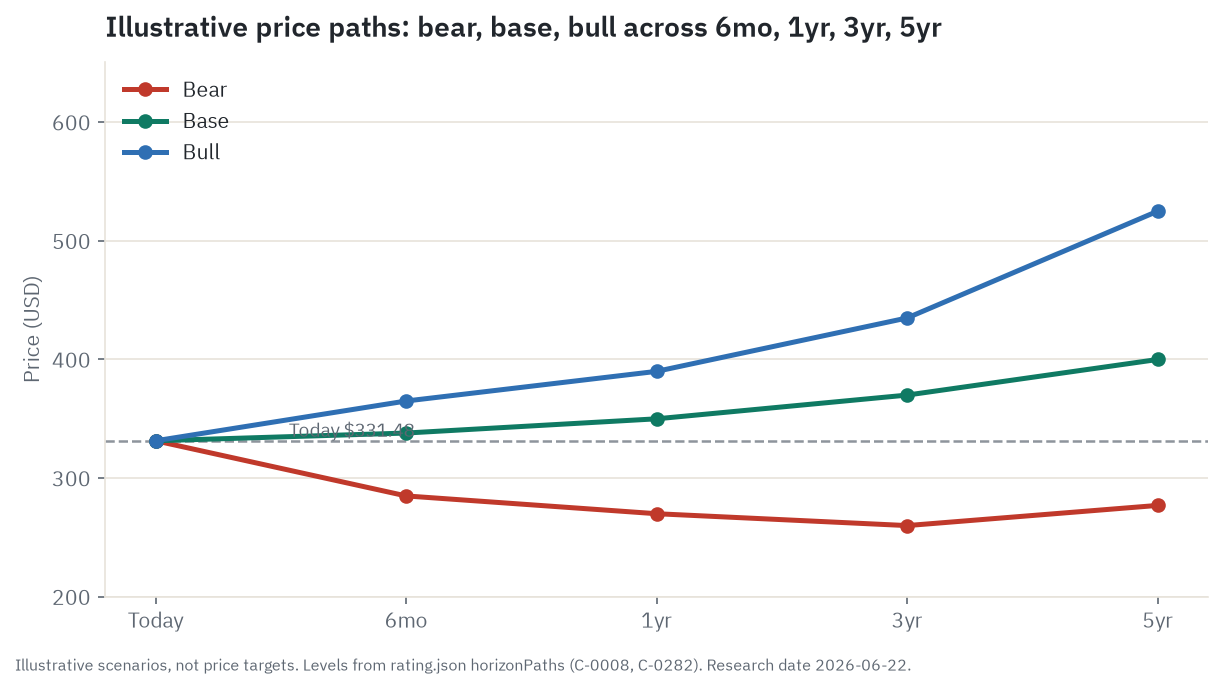
JPMorgan closed at $331.48 on June 22, 2026, a market cap near $888 billion, which works out to roughly 3.05 times its tangible book value of $108.87 a share. That one multiple is the whole debate. Everything below is the story of whether a record price is paying for quality that lasts or for a moment in the cycle that does not. Every dollar level here is an estimate built on stated assumptions, not a price target.
Six months. This window is about datable events, not the long story. Q2 earnings on July 14 is the first real test of whether the record $11.6 billion markets quarter in Q1 was a structural step up or a one-off spike off tariff and geopolitical volatility. The 2026 stress-test results on June 24 and the capital-return signal that follows set the buyback tone, and the Fed’s hold-with-a-hike-bias frames net interest income. The base case is roughly flat to slightly up toward the consensus zone near $338, because the stock is already sitting at what the sell-side calls fair value. The bull case is about $365 if Q2 prints clean beats and the multiple holds. The bear case is about $285 if markets revenue normalizes hard or credit ticks off its plateau and the rich multiple starts to give back. The single thing most likely to flip the read is whether Q2 confirms or breaks the durability of that markets number.
One year. Over twelve months the controlling variables are the net interest income trajectory against the roughly $103 billion full-year guide, the first clear read on whether card charge-offs are plateauing or drifting higher, and the direction of the final Basel capital rule. The base case is about $350, with tangible book compounding around 8 percent while the multiple holds near 3.0 times. The bull case is about $390, near the high end of the analyst range, if durable earnings beats pull consensus up. The bear case is about $270, a de-rating back toward the 52-week-low zone if return on tangible common equity prints in the high teens instead of the low twenties, even with the business performing fine. The flip here is the return number: a few quarters of high-teens returns would pull the multiple down on their own.
Three years. Now the structural drivers start to dominate the cycle. The questions are whether through-the-cycle returns settle above the bank’s own 17 percent target and whether the Basel capital draw caps the per-share compounding the bull case needs. The base case is about $370, on roughly 8 percent book growth at a premium-but-fading multiple near 2.7 times. The bull case is about $435 if a structurally larger trading and fee wallet plus tech cost-out hold returns near 19 to 20 percent at a 3.0 multiple. The bear case is about $260 if returns mean-revert to 17 percent, the multiple re-rates to around 2.0 times, and a recession dents the book. The flip is whether returns hold above, or fall back to, that 17 percent target.
Five years. This is pure durability territory: how strong the fortress stays through a full credit cycle and a CEO transition, and what multiple the market will pay for it. The base case is about $400, with tangible book around $160 a share at a premium-but-normal 2.5 times, plus the roughly 1.8 percent dividend along the way. The bull case is about $525, with tangible book near $175 at a held 3.0 multiple and returns durably elevated. The bear case is about $277, with the premium fully unwinding toward the historical median of about 2.0 times on tangible book near $146. Note that the bear five-year level sits above the three-year low: this is a de-rating and then a recovery, not a permanent impairment. The fortress holds; the premium does not. The flip is whether the Dimon-era premium proves to be franchise (durable) or person (transient).
Where the read lands today. On balance the read holds at Hold. This is the best-run large bank in the United States, with the top deposit and investment-banking franchises and a return profile peers cannot touch, but it trades at a record premium to its own history at what is plausibly peak earnings, while late-cycle credit, a Basel rule that uniquely raises its required capital, and an unresolved succession all sit unhedged and the sell-side already pegs it at fair value. Own the quality, but understand that at this price you are paying close to full freight for it. The single thing most likely to move that read is the path of return on tangible common equity: hold the low-twenties and the premium is defensible, slip toward 17 percent and it is not.
Companion tool
Jump to the interactive dashboard to sort and filter every company in this piece, or download the Excel model to flex the scenarios yourself.
TL;DR
JPMorgan is the largest and best-run universal bank in the United States, and it makes money two ways at once. The first is net interest income, the spread between what it earns on $4.4 trillion of loans and securities and what it pays on $2.56 trillion of deposits, which threw off $95.4 billion in 2025. The second is fees and trading: investment-banking fees, the record $35.8 billion of markets revenue, payments, and the steady asset-management annuity. Those two engines split roughly half and half, and because they tend to move out of step (markets revenue rises when rate-driven income is under pressure, and the reverse) the combined result is steadier than any single-line bank. The firm earned $57.0 billion in 2025, a 20 percent return on tangible common equity (ROTCE: profit earned per dollar of tangible capital, the core bank-profitability gauge, where roughly 17 percent is good and 20 percent or above is exceptional), against a through-cycle target of 17 percent, and it sits on a 14.6 percent capital ratio with roughly $40 billion of excess. That quality is real and it is why the stock earns a premium. The catch is the size of the premium: at $331.48 on June 22, 2026, JPM trades at about 3.05 times tangible book, roughly 50 percent above its own 10-year median, near the top of its decade range, at what looks like peak earnings, with the sell-side mean target near $340 implying only 2 to 3 percent upside. The single biggest risk is not the balance sheet, which is a fortress; it is the combination of a late-cycle credit book with a fat stressed tail, a Basel re-proposal that uniquely raises JPM’s required capital while cutting peers’, and an unresolved succession on a 70-year-old CEO, all landing on a multiple priced for things to keep going right. The honest read is Hold, Overvalued on valuation: you pay close to full price for quality you can measure and risks you cannot.
Explore it yourself: the interactive dashboard
Open the dashboard in a full screen
The dashboard holds the seven banks in this piece, sortable by market cap, by what they are to JPM (money-center peer, markets-and-wealth comp, super-regional), and by the two metrics that matter most for a bank, price to tangible book and return on tangible common equity. Use it to check any single name as you read.
Prefer a spreadsheet? Download the Excel model with the scored company table and an adjustable scoring tab so you can change the weights and see what the read becomes. The scenario levels in that file are illustrative arithmetic, not targets.
The fortress and the spread machine
A bank is a spread machine sitting on top of a giant float. Picture a reservoir. Money flows in from depositors, who hand JPMorgan $2.56 trillion and accept little or no interest on a big chunk of it. The bank holds that water, lets some of it out as loans and securities at a higher rate than it pays to hold it, and keeps the difference. That difference, multiplied across trillions, is net interest income, and for most banks it is the whole business.
JPMorgan is more than that, which is the point. It also runs the largest investment bank in the world by fee share, the biggest US payments rail, and a $4.8 trillion asset-management arm. So on top of the spread, it clips fees: every merger it advises, every bond and stock it underwrites, every dollar that moves through its payments system, every basket of assets it manages. The reservoir analogy still works if you imagine a second set of pipes running alongside the first, carrying fee water that flows on a different schedule than the spread water. When rates fall and the spread narrows, the deal and trading pipes can run faster. When markets freeze, the spread keeps grinding. That diversification is why the combined output is steadier than a pure lender’s.
The “fortress balance sheet” that gets quoted in every headline is really a toll booth that keeps taking tolls even when traffic slows. JPMorgan holds far more capital than regulators require, roughly $40 billion of excess, and it has earned at or above its 17 percent through-cycle return target for eight straight years. The debate this entire piece works through is whether that toll booth is worth a record price. The bull says scale and diversification let JPMorgan out-earn every peer through any weather, so the premium is earned. The bear says you are paying 3 times tangible book for a deposit-led bank at the top of the cycle, with no margin of safety if any one thing goes wrong. Both are sourced. Both belong.
How the money flows
flowchart TD
    DEP["Deposits: $2.56T<br/>23% free noninterest-bearing<br/>77% interest-bearing"]
    WFUND["Wholesale Funding<br/>(debt, repo, FHLB)"]
    EQUITY["Common Equity: $342B<br/>CET1 $288B @ 14.6%"]

    DEP --> ASSETS
    WFUND --> ASSETS
    EQUITY --> ASSETS

    ASSETS["Earning Asset Base: $4.4T total<br/>Loans $1.49T, Securities $821B, Trading inventory"]

    ASSETS --> NII["Net Interest Income<br/>$95.4B FY2025<br/>~$103B guided 2026"]
    ASSETS --> MKTS["CIB Markets<br/>FICC $22.5B + Equities $13.3B<br/>= $35.8B FY2025 (+19% YoY)"]
    ASSETS --> FEES["Fee & Transaction Income<br/>Payments $19.4B, Cards/Service fees"]

    NII --> PREPROV
    MKTS --> PREPROV
    FEES --> PREPROV
    AWM["AWM Fee Annuity<br/>$4.8T AUM, $24.1B revenue<br/>fee-based, rate-insensitive"] --> PREPROV
    IB["IB Fees<br/>~$9.6B FY2025 est.<br/>#1 global wallet 8.4%"] --> PREPROV

    PREPROV["Pre-Provision Net Revenue<br/>~$95-100B annually"]

    PREPROV --> PROV["Credit Costs (Governor)<br/>Provision $14.2B FY2025<br/>Card NCO ~3.4% FY2026 guided"]
    PREPROV --> EXP["Operating Expenses (Governor)<br/>~$95.7B FY2025<br/>Tech $19.8B, Efficiency ~52%"]

    PROV --> NI
    EXP --> NI

    NI["Net Income<br/>$57.0B FY2025 (record)<br/>ROTCE 20%"]

    NI --> CET1["CET1 Capital Accrual<br/>14.6% actual vs 11.5% floor<br/>~$40B excess capital"]
    NI --> CAPRET["Capital Return<br/>Dividend $1.50/qtr, $50B buyback<br/>~$46B returned FY2025"]

    CET1 --> GSIB["G-SIB Surcharge Valve<br/>4.5% now, 5.2% by 2028 proposed<br/>~$20B additional capital at risk"]
    GSIB -.->|"constrains"| CAPRET
Read the diagram top to bottom and you have the whole bank in one picture. At the top, three funding sources feed the engine: $2.56 trillion of deposits (the cheapest fuel, with about 23 percent paying no interest at all), wholesale borrowing, and $342 billion of shareholder equity. That money buys the earning-asset base: $1.49 trillion of loans, $821 billion of securities, and a trading inventory. Those assets generate the two revenue rails, net interest income on one side and markets, fees, investment-banking, and asset-management income on the other. Add them up and you get pre-provision profit, the bank’s gross output before the two governors take their cut.
The two governors are the part a bank reader has to watch most closely. Credit costs are the first: the provision for loan losses was $14.2 billion in 2025, and it is the line that explodes in a recession. Operating expenses are the second, running near $95.7 billion with a $19.8 billion technology budget inside. What survives both governors is net income, $57.0 billion in 2025, which then splits into two destinations: capital that builds the fortress higher, and capital returned to shareholders through the dividend and the $50 billion buyback. The fortress side is measured by the common-equity-tier-1 ratio, or CET1: the bank’s highest-quality, most loss-absorbing capital, common equity, as a percent of its risk-weighted assets. It is the regulator’s core safety gauge, and at 14.6 percent JPMorgan carries far more of it than the rules demand.
The shape is the investing point. A pure commercial bank has only the left rail, the spread, so when rates fall its income falls with them. JPMorgan has both rails, and they are partly uncorrelated, which smooths the ride. The chokepoints are exactly where the bear case lives. Deposit costs (how much the cheap fuel costs when savers chase yield, and the share of any rate increase the bank has to pass through to depositors is called the deposit beta), credit costs (the governor that turns violent in a downturn), and the capital rules at the very bottom, where the proposed G-SIB surcharge acts as a valve that could divert $20 billion of capital away from buybacks and into the regulatory minimum. G-SIB stands for global systemically important bank: the too-big-to-fail surcharge of extra capital the largest, most interconnected banks must hold on top of the baseline, and it scales with a bank’s size and complexity, so JPMorgan, the biggest of them, carries the heaviest version. The dotted line from the surcharge back to capital return is the single most JPM-specific risk in the diagram.
The four engines: how JPMorgan makes money
JPMorgan reports in four pieces. Three are real operating businesses; the fourth is the corporate plumbing. Here is the field guide.
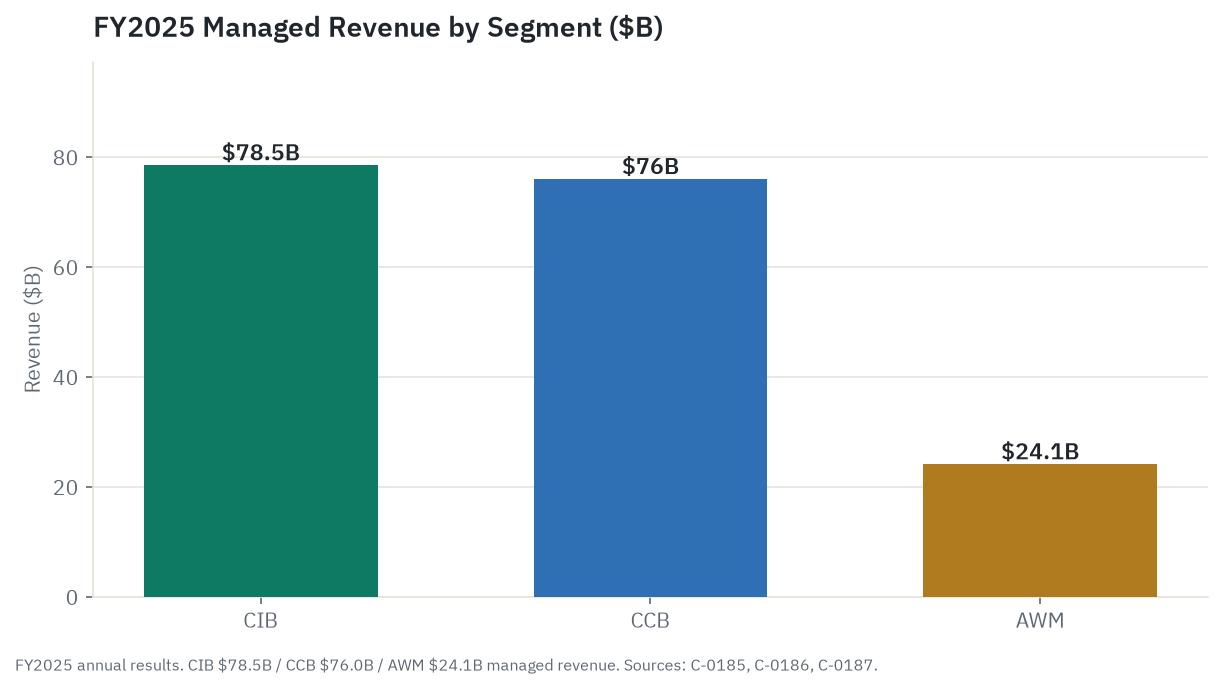
Consumer and Community Banking (CCB) is the bank most people actually touch: checking and savings accounts, credit cards, home and auto loans, and small-business banking. It generated $76.0 billion of revenue in 2025, and in Q1 2026 it produced $19.6 billion of revenue (up 7 percent) and $5.0 billion of net income. This is the deposit and consumer-credit foundation, and its swing factor is the card book. Card net interest income drives the upside; card charge-offs drive the downside, which is why the consumer credit cycle (covered below) matters most here. Chase ranked number one in J.D. Power’s 2026 mobile-banking-app satisfaction study, serving about 63 million active mobile users, so the franchise is healthy at the customer layer even as the credit question hangs over the loan side.
Commercial and Investment Bank (CIB) became the single largest segment in 2025 at $78.5 billion of revenue, after JPMorgan merged its old Commercial Banking unit into the investment bank in early 2024. This is the cyclical engine. It holds the markets business (fixed-income and equities trading), investment-banking fees (advising on mergers, taking companies public, underwriting bonds), and two steadier fee lines, payments and securities services. In Q1 2026 CIB revenue rose 19 percent to $23.4 billion and net income jumped 30 percent to $9.0 billion. JPMorgan ranks number one globally across all three investment-banking product categories at once: mergers advice, equity underwriting, and debt underwriting. The catch is volatility: this is the segment that soars in a risk-on year and sags when the deal window slams shut.
Asset and Wealth Management (AWM) is the quiet annuity. It manages $4.8 trillion of client assets and earned $24.1 billion of revenue in 2025, with a pre-tax margin around 35 to 38 percent. In Q1 2026 it grew revenue 11 percent to $6.4 billion. Because its income is fee-based and tied to assets under management rather than to interest rates, it is the most stable and predictable of the three, and it took in $553 billion of net new client money in 2025, the 22nd straight positive year. When the other engines wobble, this one keeps humming.
The Corporate segment is not a customer business; it is the treasury and chief-investment-office function that holds the securities book and manages the firm’s overall interest-rate positioning. It swings around with rate marks and one-off items, which is why its reported revenue fell by about 60 percent, from $17.4 billion in 2024 to $7.0 billion in 2025, on weaker net rate marks and investment-security results in the chief-investment-office book year over year. Treat it as plumbing, not a profit driver. Because it is plumbing that can swing negative, it is the segment left off the chart below, which shows only the three client-facing operating businesses.
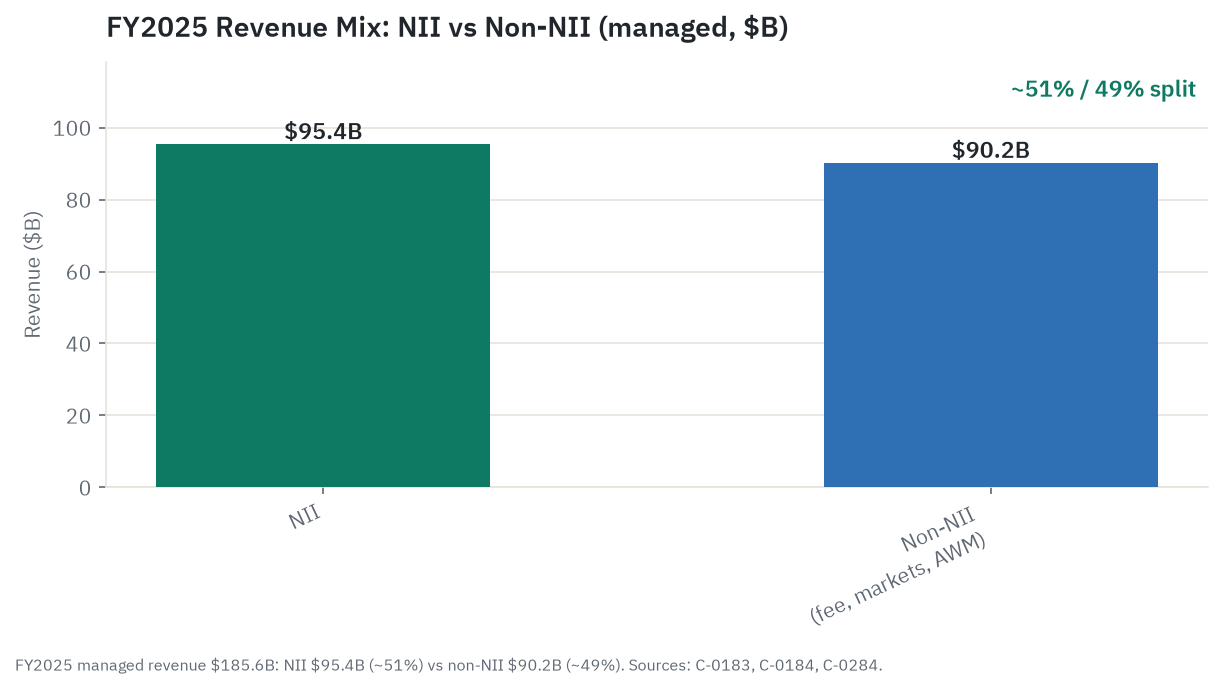
The other split worth holding in your head is net interest income versus everything else. Of the $185.6 billion of managed revenue in 2025, net interest income was $95.4 billion (about 51 percent) and noninterest income, the fees, markets, and asset-management lines, was $90.2 billion (about 49 percent). That roughly even balance is the diversification the bull case rests on. In Q1 2026, net interest income grew only 3 percent excluding markets, yet total revenue rose 10 percent, because markets revenue was up 20 percent and investment-banking fees up 28 percent. The fee rail carried the quarter while the spread rail idled. That is the model working as designed.
Net interest income and the rate cycle
Net interest income is the largest single revenue line, and the one most at the mercy of the Federal Reserve. JPMorgan earned $95.4 billion of it in 2025, up about 3 percent, and management guides full-year 2026 to roughly $103 billion total (about $95 billion excluding the markets-related piece). That guide is worth understanding, because it has already been trimmed once. The initial January 2026 guidance was $104.5 billion; at Q1 earnings in April, management cut it to $103 billion. The cut was entirely in the markets-related slice of net interest income, not in the core lending franchise, which held at about $95 billion. Still, the cut, not the EPS beat, was the headline that day, and the stock fell about 3 percent.
The mechanism here is asset sensitivity, and it is asymmetric. JPMorgan earns more net interest income when rates are higher, but it loses more on the way down than it gains on the way up. The bank’s own disclosure puts a +100-basis-point parallel rate move at about +$1.8 billion of net interest income over the next year, and a -100-basis-point move at about -$2.2 billion. That asymmetry is the rate risk in one number: a rapid cutting cycle hurts more than a hiking cycle helps.
Where rates actually go is the swing factor. As of mid-June 2026 the Fed held its target at 3.50 to 3.75 percent for the fourth straight meeting, and the June dot plot turned hawkish, with the median 2026 projection rising and nine of eighteen participants pencilling in at least one hike by year-end. JPMorgan’s own research desk goes further, forecasting zero cuts in 2026 and a single hike in September 2027. That is a forecast, not a fact, and the Fed may do something else entirely. But if it holds roughly true, net interest income lands near the guide. The base case is a stable-to-slightly-favorable rate backdrop. The bear variant is a demand-driven recession that forces the Fed to cut two or three times into a weakening economy, dragging net interest income below guidance at the same moment credit costs rise. That combination, lower spread income and higher loan losses at once, is the worst case for any bank, and it is the one to watch.
One nuance keeps the rate risk from being larger than it looks. Because so much of a full year’s net interest income is already locked in by the time a rate move happens, the practical full-year hit from removing the back-half cuts that earlier guidance assumed was only about 20 basis points of average net interest income. The spread engine is large and slow; it does not whipsaw quarter to quarter the way trading does.
The markets and investment-banking franchise
This is the cyclical upside, and in Q1 2026 it ran hot. Markets revenue hit $11.6 billion, described as an all-time quarterly record for any bank, up 20 percent year over year, with fixed-income trading at $7.1 billion and equities at $4.5 billion. Investment-banking fees rose 28 percent to $2.9 billion, and JPMorgan’s share of the global investment-banking fee wallet hit 9.8 percent, ranked number one. For the full year 2025, markets revenue was $35.8 billion, up 19 percent, and the firm held the number-one global wallet share at 8.4 percent. Hold those two numbers next to each other: $11.6 billion in a single quarter annualizes to roughly $46 billion, well above the $35.8 billion full-year 2025 pace, which is exactly why the durability question that follows matters so much.
The honest question is durability. That $11.6 billion print was driven by transient catalysts: oil-price volatility from a Strait of Hormuz disruption, geopolitical tension around Iran and Ukraine, and a sharp spike in corporate hedging as US tariff policy shifted. None of those is a reliable annual feature. A reasonable through-cycle quarterly run rate for markets revenue is closer to $8 to $10 billion, based on the 2024 to 2025 pace, which makes Q1 an outlier rather than a new baseline. Management argues the other way: CIB co-head Troy Rohrbaugh’s thesis is that the post-pandemic trading wallet is structurally larger, on a permanently higher volatility baseline, bigger and more complex corporate balance sheets, and sustained financing demand from private-credit sponsors. There is evidence for the structural view: trading volumes have nearly tripled since 2019, and the cost per trade has fallen sharply, which supports margins even in softer environments. The truth is probably both, some structural uplift sitting under a cyclical spike. Q2 earnings on July 14 is the first clean test, the first quarter without the Q1 volatility surge.
History sets the scale of the downside. In 2022, when the deal window shut, JPMorgan’s investment-banking fees collapsed from a pace above $14 billion to under $7 billion. A repeat of that 20-to-40 percent compression in a risk-off 2026 or 2027 would remove $5 to $7 billion from group earnings. That is the cyclicality you are buying with the markets franchise, and it cuts both ways. The steadier fee lines inside CIB cushion it: payments revenue hit $19.4 billion in 2025 and posted its fifth straight record quarter at $5.1 billion in Q1 2026, and securities services grew 18 percent to $1.5 billion. Those are recurring, low-capital, high-switching-cost businesses that hold up when trading ebbs, which is exactly the point of the diversification.
Credit quality and reserves: the late-cycle bear engine
This is where the most serious bear case lives, so it deserves the honest version. The credit picture today is benign, and it is plateauing rather than deteriorating. The headline consumer number, the card net charge-off rate (the share of card loans written off as uncollectible in a year, net of any amounts later recovered, abbreviated NCO and the standard credit-loss gauge), ran at 3.47 percent in Q1 2026 and management guides full-year 2026 to about 3.4 percent, which they actually cut from prior guidance of 3.6 percent. The firm’s chief financial officer characterizes the multi-year rise from post-pandemic lows as “normalization” driven by card-book growth, not consumer breakdown. For context, JPMorgan’s card losses run consistently below peers; Wells Fargo’s card charge-off rate was 4.38 percent against JPMorgan’s 3.24 percent in a comparable late-2024 quarter.
The reserve cushion is large. The allowance for credit losses (the pre-funded reserve the bank sets aside in advance against expected future loan losses; the accounting rule called CECL, current expected credit losses, forces banks to book those expected losses up front rather than waiting for loans to actually go bad) stood at $31.2 billion at the end of 2025 against $1.49 trillion of loans, a coverage ratio around 2.1 percent, and the provision for the full year was $14.2 billion, up about 33 percent from 2024. Part of that step-up was a one-time $2.2 billion reserve build tied to JPMorgan’s agreement to acquire the Apple Card portfolio from Goldman Sachs, a new and relatively unseasoned consumer book coming onto the balance sheet in 2026. Office commercial real estate, the sector everyone worries about, is a manageable line for JPMorgan specifically: roughly $16.3 billion of direct office exposure against a $1.49 trillion loan book, a little over 1 percent. The risk there is a provision item, not a solvency event.
Now the bear case, and it is real because the bank’s own stress test spells out the tail. In the 2025 supervisory stress test, JPMorgan’s card portfolio carried a stressed loss rate of 16.0 percent. That is the fat tail: a benign 3.4 percent today, a 16 percent worst case under a severe recession. You do not need the full severe scenario to feel it. Under a moderate recession, with unemployment rising to 6 or 7 percent rather than the 4.3 percent it sits at now, card charge-offs could climb from 3.4 percent toward 5 or 6 percent and quarterly provisions could spike from about $2.5 billion toward $5 to $7 billion. That maps to a $10 to $15 billion annual hit to provisions versus the current run rate, which is meaningful but absorbable against a $340 billion-plus tangible equity base. This is a scenario, not a forecast, and the provision-spike arithmetic is a back-of-envelope estimate, not a sell-side model. JPMorgan’s own economics desk puts the odds of a US recession over the next year at about 40 percent, which is a research-house view and not a forecast for the stock.
The most quotable piece of the credit story is the tension at the top. JPMorgan keeps posting record results while Jamie Dimon keeps warning, in his own words, that “if there’s a credit cycle, it will be worse than people think.” The bull reads that as prudent stewardship from a CEO who built the fortress for exactly this. The bear reads it as the man with the best view of the loan book flagging a risk the share price ignores. Both readings are defensible, which is the point: the credit cycle is the single largest source of earnings variance over the next two years, and the stock is priced as if it is not coming.
Capital, returns, and Basel: the fortress and the payout
JPMorgan holds far more capital than it needs, and how that excess gets used is one of the central questions. The standardized common-equity-tier-1 ratio, the key regulatory capital measure, was 14.6 percent at the end of 2025 and 14.3 percent at the end of Q1 2026, against a requirement of 11.5 percent. That gap is roughly $40 billion of excess capital, which management has confirmed is deployable. The requirement itself fell to 11.5 percent from 12.3 percent in mid-2025 after JPMorgan performed well in the Fed’s stress test, which lowered its stress capital buffer.
That capital funds a generous and growing shareholder return. The quarterly dividend is $1.50 a share ($6.00 a year), the latest step in 15 straight years of increases, and at the June 22 price that is a yield around 1.81 percent on a modest payout ratio near 30 percent of earnings, which leaves ample room for buybacks. The buyback is large: a $50 billion repurchase program authorized in July 2025, with roughly $25.5 billion remaining after Q1 2026. The firm returned about $46 billion to shareholders in 2025 between dividends and buybacks. Dimon’s stated buyback philosophy is price-sensitive, not mechanical, and that detail is worth holding onto. At a stock trading near 3 times tangible book, he has said he would rather hold the excess and deploy it into the business than buy back shares at a rich price, which is itself a quiet signal about how management views the valuation.
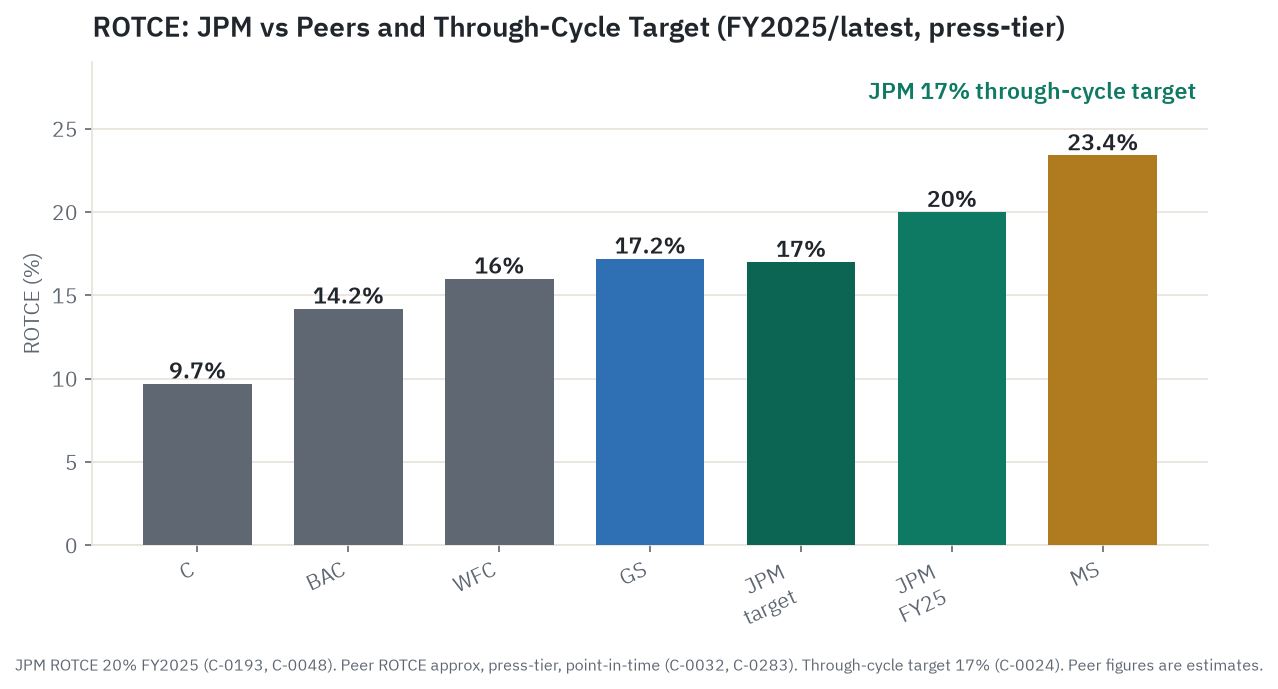
The return profile is the reason the premium exists at all. JPMorgan earned a 20 percent return on tangible common equity for full-year 2025 and 23 percent in Q1 2026, against its own stated through-cycle target of 17 percent. That sits well above every money-center peer (Bank of America and Wells Fargo around 14 to 16 percent, Citigroup in single digits) and JPMorgan earns it on a far larger and more deposit-heavy balance sheet, which makes it harder to achieve, not easier. The crucial debate, and it runs straight into the valuation section, is whether 20-plus percent is the new normal or a cyclical high that mean-reverts toward 17.
The Basel wild card is the one risk that hits JPMorgan harder than anyone. The pending rule, known as the Basel III endgame, is the long-running revision of how much capital US banks must hold against their risks, the final piece of the post-2008 international Basel framework. In March 2026 the Fed, OCC, and FDIC issued a re-proposal of these bank-capital rules and rescinded the controversial 2023 version. For most of the eight US systemically important banks, the re-proposal is meaningful relief, on the order of a 4.8 percent cut to required capital on average. For JPMorgan specifically, management estimates it runs the other way, a roughly 4 percent increase in required capital, driven almost entirely by the G-SIB surcharge methodology, which would push JPMorgan’s surcharge from 4.5 percent toward 5.2 percent by 2028 and require about $20 billion of additional capital. This is an estimate of a proposed rule that is not final; the comment period closed June 18, 2026, and the final form could change materially. Dimon has called the proposed surcharge “absurd” and “un-American,” which is his characterization, not a judgment this piece adopts. The investing point is concrete: if the rule lands roughly as drafted, the $40 billion excess cushion gets partly absorbed into the regulatory minimum rather than returned through buybacks, which caps the per-share compounding the bull case needs, while peers get to return more. The moat narrows by regulation.
What the filings say
The headline financials are strong and dated to the filings. For full-year 2025, managed revenue was $185.6 billion ($182.4 billion on a reported GAAP basis, the difference being a tax-equivalent gross-up), net income was $57.0 billion, and diluted EPS was $20.02. Return on tangible common equity was 20 percent, return on equity 17 percent, and the efficiency ratio, the share of revenue eaten by expenses, was about 52 percent. That last number is a competitive weapon: lower is better, and JPMorgan’s roughly 52 percent compares with about 62 percent at Bank of America and 64 percent at Wells Fargo. It runs leaner than the peers at far larger scale.
The balance sheet at year-end 2025 carried $4.42 trillion of total assets, $2.56 trillion of deposits, $1.49 trillion of loans, and $342 billion of common equity. Tangible book value per share, the metric the stock is really valued against, was $107.56 at year-end and $108.87 at the end of Q1 2026, up about 8 percent year over year, and it has compounded at roughly 10 percent a year over the past decade. That steady tangible-book compounding, plus 15 straight years of dividend growth, is the real evidence of through-cycle earnings power.
Q1 2026 extended the trend: managed revenue of $50.5 billion (up 10 percent), net income of $16.5 billion (up 13 percent), diluted EPS of $5.94 (up 17 percent), and a 23 percent return on tangible common equity. One soft spot showed up in expenses, which rose 14 percent year over year on compensation, marketing, and the Apple Card build-out, pushing the efficiency ratio up to 53 percent. Management’s full-year 2026 expense guide is about $105 billion, up roughly $9 billion from 2025, including a $19.8 billion technology budget. That matters for the bear case: the cost base is growing about 9 percent while core net interest income is roughly flat, so the AI-and-efficiency savings the bulls underwrite have not yet shown up as a single dollar of cost reduction. Dimon concedes AI returns are “difficult to quantify” and are not in the bank’s formal math. You are paying a premium today partly for margin expansion that is, so far, a promise.
On ownership, the signals are quietly positive. Jamie Dimon owns about 6.3 million shares and has historically been a non-seller, which is a meaningful insider signal for a bank CEO. Institutions own about 84 percent of the shares, dominated by passive index funds (Vanguard around 10 percent, BlackRock around 7.7 percent), which makes the float stable and mutes any short-term directional signal from that cohort. The risk factors the company itself flags are the ones this piece has worked through: consumer-credit normalization and the unseasoned Apple Card book, rate and market sensitivity, and the unresolved shape of the Basel rules.
What the market is paying
Start with performance, because it frames the valuation. JPMorgan closed at $331.48 on June 22, 2026, near the top of its 52-week range of $272.11 to $338.09 and within about 2 percent of its all-time high. It returned about 20.5 percent over the trailing year, which actually trailed both the S&P 500 (around 23 percent) and the broader bank sector (the KBW bank index proxy returned roughly 37 percent over the same window). The stock had a sharp drawdown in early 2026 on tariff and macro fear, falling toward the $272 low, then recovered hard through the strong Q1 earnings and has traded near its highs since. Beta is about 1.0, so it moves roughly in line with the market, neither defensive nor especially volatile. Liquidity is enormous, around $3 billion of stock trades daily, and short interest is minimal at 1.07 percent of the float. These are point-in-time figures as of June 22, 2026 and they move fast.
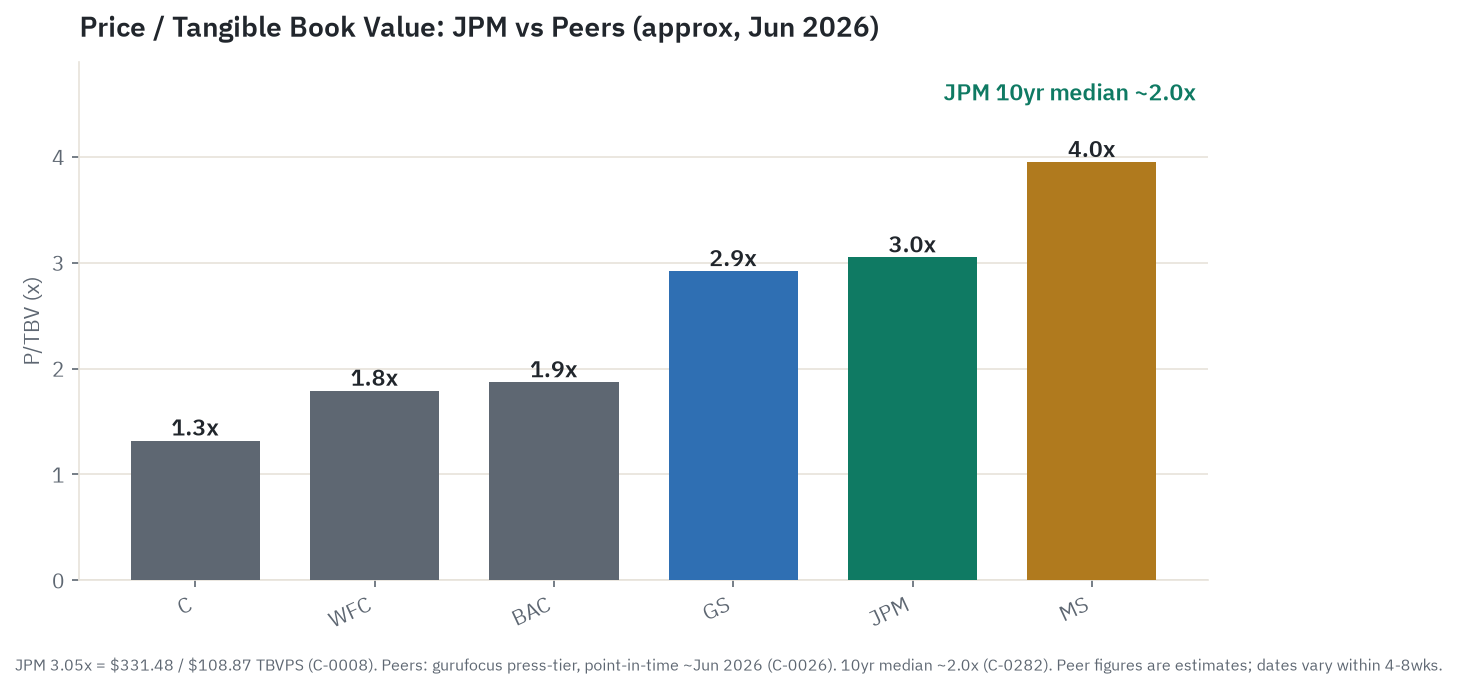
Now the valuation, which is the crux. For a bank, the right lens is price to tangible book value (P/TBV), not the price-to-earnings ratio, because book value is the capital that actually generates the returns. Tangible book value is shareholder equity stripped of goodwill and other intangibles, the hard capital you would actually have left in a liquidation, and it is the standard bank valuation yardstick because a bank’s assets and equity are already marked close to cash value, unlike an industrial firm whose worth sits in factories and brands. JPMorgan trades at about 3.05 times tangible book ($331.48 divided by $108.87). That is roughly 50 percent above its own 10-year median of about 2.0 times and near the top of its decade range of 1.3 to 3.1 times. The forward price-to-earnings ratio of about 14.9 looks cheap, but that is the wrong lens for a bank, and using it would flatter the stock; the tangible-book multiple is what matters and it reads rich.
The premium-justification math is worth doing in plain language, because it is the whole argument. A bank trading above 1.0 times tangible book is being paid for earning more on its capital than that capital costs. The cost of that capital has a name, the cost of equity: the annual return shareholders require to hold the stock given its risk, typically estimated in the 10-to-12 percent range for a large bank. A bank earning above its cost of equity is worth more than its tangible book; one earning below it is worth less. Run the standard residual-income or Gordon-Growth frame: at JPMorgan’s stated 17 percent through-cycle return and a 10-to-12 percent cost of equity, the math supports a multiple of roughly 1.5 to 2.3 times tangible book. A 3.05 times multiple therefore requires one of three things to be true. Either the market believes through-cycle returns will hold well above 17 percent (the 23 percent Q1 number supports that, but it reads cyclically inflated by a record trading quarter), or there is a large and permanent franchise premium for scale, diversification, and management, or some combination. That is the entire two-sided debate: bulls say the returns are structurally higher and the franchise premium is real and durable; bears say the multiple is pricing a peak return that mean-reverts, leaving no support at 3 times.
Set against peers, JPMorgan is rich on its own history but mid-pack within the group. It is cheaper than Morgan Stanley (around 3.95 times tangible book) and roughly in line with Goldman Sachs (around 2.92 times), both of which earn more from markets and wealth, which the market has long re-rated higher than deposit lending. It carries a clear premium over the deposit-heavy money-center peers: Bank of America around 1.87 times, Wells Fargo around 1.78 times, and Citigroup at 1.32 times. The gap to Bank of America and Wells Fargo is partly a return gap (20-to-23 percent versus 14-to-16 percent), but the premium is wider than the return delta alone would mechanically justify, which is the market paying for franchise quality and management continuity that does not show up in any single quarter’s income statement. These peer figures are single-vendor, point-in-time estimates and should be read as dated approximations, not hard facts.
The sell-side is split and, importantly, sees little upside. Consensus sits around a $340 mean target, a mixed Buy/Hold call (one source labels it Buy across 24 analysts, another labels it Hold across 29), with a high of $391 and a low of $295. A $340 mean against a $331 close is only 2 to 3 percent of implied upside. The wide target spread reflects scenario uncertainty, not disagreement that today’s price is full. These are analyst opinions, not facts, and not this piece’s price target.
What the crowd is saying
Treat this section as signal, not fact; sentiment data is the softest input here. The dominant news story through the first half of 2026 is a tidy one: “fortress bank posts record earnings while its own CEO sounds the alarm.” The Q1 beat anchored the best-in-class-execution narrative, while the simultaneous trim to net interest income guidance produced the “beat and retreat” framing that drove the stock down 3 percent on results day. Coverage is warm on operational execution and cooling at the margins on the forward rate and credit picture. Dimon’s running macro commentary, storm clouds, stagflation risk, the credit-cycle warning, threads through every cycle and generates outsized headlines relative to its investable content, which is a structural feature of covering a media-fluent large-bank CEO, not manipulation.
JPMorgan is not a retail-momentum stock. Its Google Trends attention scores near zero on at least one tracker, last among banking peers, which is consistent with a name that is 84 percent institutionally owned and moves on analyst notes and earnings rather than retail search surges. The chatter that exists skews toward income investors and long-term holders debating the dividend, the Dimon commentary, and whether the premium is sustainable; the lean is moderately bullish among holders with a skeptical minority focused on succession and the guidance trim. There is no visible pump pattern, and the float, liquidity, and ownership make coordinated promotion implausible. These are impressions, not measured figures.
The useful part is where the crowd’s story diverges from the filings. The crowd narrative is “fortress bank owns the cycle”; the filings say “net interest income growth has stalled, credit costs are rising, and the expense ramp is ongoing.” The stock’s multiple is priced off a high-return, low-cost-deposit franchise that depends partly on a rate environment that is now fading, and management has acknowledged that the easy tailwind is ending. The record-earnings story sits in direct tension with the CEO’s own repeated warning that the next credit cycle will be worse than expected. And the “fortress” brand is heavily identified with one man, which leads straight to the succession question. The gap between the crowd’s comfort with succession as a distant abstraction and the actual timeline ambiguity is the divergence most worth watching. One employee-side note belongs here: the firm’s full five-day return-to-office mandate for more than 300,000 staff generated real, datable backlash, which is a quiet attrition risk in exactly the technology and middle-office talent the efficiency thesis depends on.
The Jamie Dimon succession question
This is a governance and valuation risk, not gossip, and it has to be framed precisely because some of the most-repeated claims are not confirmed. Here is what is solidly sourced. Jamie Dimon turned 70 in March 2026 and has been CEO since 2005, about 21 years. In January 2025 the firm filed an 8-K announcing a major reshuffle: Daniel Pinto, the long-serving president and chief operating officer and Dimon’s designated emergency successor, announced his retirement at the end of 2026, and Jennifer Piepszak became chief operating officer while explicitly removing herself from CEO consideration “at this time.” Those facts are primary-sourced and can be stated plainly. Pinto’s exit removes the bridge that had cushioned succession uncertainty.
The bench is four internal names. Marianne Lake, who runs Consumer and Community Banking and is a 25-year veteran and former CFO, is the consensus frontrunner by analyst and press read, and in 2025 her mandate was expanded to include international consumer banking in what many interpret as a test period. Troy Rohrbaugh and Doug Petno co-run the investment bank, and Mary Erdoes runs asset and wealth management. Here is the careful part: several aggregator sources claim Lake was formally named CEO-designate for January 1, 2027 with Dimon moving to executive chairman, but the Q1 2026 earnings call does not mention it and no SEC filing has been confirmed naming a successor. As of the research date, the accurate framing is that Lake is the reported frontrunner and no formal designation has been filed; the race is still ongoing. This piece does not state the designation as fact, and it takes no view on Dimon’s health.
The reason this matters for the stock is the “Jamie premium,” the slice of the valuation attributed to Dimon personally. This is an analyst estimate with a wide range, not a fact: Wells Fargo’s Mike Mayo has put the key-person risk near 5 percent of the stock (about $20 billion), while a survey of several investors and analysts put it at 10 to 15 percent (about $90 billion at elevated prices). Those figures diverge enough that the honest read is “analysts estimate somewhere between roughly 5 and 15 percent,” with the dollar amount moving as the share price moves. A formal succession announcement is therefore a latent, datable event that could move the multiple either way, a de-rating if it spooks the market or a relief if it lands cleanly with Dimon staying on as executive chairman, with no obvious offsetting upside. Early reaction to the prospect has reportedly been neutral to positive, which argues the premium may be more franchise than person, but that will only be settled when the handoff actually happens.
Durability versus the cycle
Put the structural case and the cyclical bear case side by side, because the honest answer sits between them.
The structural case rests on three specific facts, not generic fortress talk. First, JPMorgan emerged from the most aggressive rate-hiking cycle since Volcker with its credit book intact, its deposit franchise intact, and a net interest income base $30 to $40 billion a year higher than its pre-2022 run rate, and it absorbed the card-loss normalization that followed without a recession-level event. Second, the capital-markets cycle is re-opening after a four-year drought, with a backlog of mergers and IPOs that gives JPMorgan’s number-one investment bank multiple years of potential fee income. Third, the Basel re-proposal is net relief for the sector as a whole, a secular tailwind for bank returns, even if JPMorgan’s own G-SIB surcharge is the asterisk that points the other way. On top of all that sits scale, diversification across two partly uncorrelated revenue rails, the cheapest deposit base in the country, and the largest technology budget in the industry.
The cyclical bear case is not exotic, because banks are leveraged plays on the credit and capital-markets cycles, and both are late in their expansions. The primary trigger is a credit inflection, most plausibly in late 2026 or 2027: unemployment has sat above 4 percent for a year and a half and is drifting higher, consumers are carrying more revolving credit at high rates, and a push toward 5-to-6 percent unemployment would send card charge-offs and provisions climbing fast. Layer on a capital-markets reversal that compresses CIB fees 20 to 40 percent when the deal window closes, plus the Basel surcharge absorbing the excess capital that was funding buybacks, and you have several governors tightening at once.
The most likely outcome is a split. Net interest income probably lands near guidance, perhaps slightly above if the Fed holds. Credit normalizes slowly in the base case but carries a real 25-to-40 percent chance of a recession that doubles provisions. Capital markets stay structurally higher than the 2022 to 2023 trough but face harder year-over-year comparisons after the Q1 spike. And the Basel outcome is a genuine coin-flip. None of these breaks the firm. The question is not whether JPMorgan survives the cycle, which it plainly will; the question is what multiple a stock at 3 times tangible book deserves when its returns are at a cyclical high and the easy parts of the cycle are behind it.
The scenarios in detail
Four variables decide the next five years. Everything below is just different settings of these dials.
The first and master variable is through-the-cycle return on tangible common equity. JPMorgan printed 20 percent in 2025 and 23 percent in Q1 2026 against its own 17 percent target. Whether that settles at 17 (mean reversion), 19 (a structurally higher floor from the markets, payments, and asset-management mix plus tech cost-out), or stays above 20 (peak persists) is what the multiple is really pricing. The second is the multiple itself: at 3.05 times tangible book versus a 2.0 median, a one-turn swing on a book value heading toward $160 a share is roughly $160 of share price, larger than the entire earnings path. The third is net interest income and markets revenue at the cycle, both of which are near a top. The fourth is the capital, credit, and regulatory complex, the $40 billion of excess set against the Basel draw, the late-cycle card tail, and the succession. Every dollar figure below is an estimate, never a price target, and the levels match the chart at the top of this piece. The three- and five-year levels are laid out below; the nearer 6-month and 1-year triples (bear about $285 then $270, base about $338 then $350, bull about $365 then $390) are set out in the lede and the path chart at the top, and the two sections agree across all four horizons.
Bull, about $525 in five years (tangible book about $175 at a 3.0 multiple). Returns hold at 19 to 20 percent because the higher markets-and-fee wallet proves structural and the AI cost-out finally lands in the efficiency ratio; the net interest income floor holds near $95 billion-plus excluding markets with the Fed parked at 3.5 to 3.75 percent; the Basel final rule softens the G-SIB methodology so the excess keeps funding buybacks; and a clean Lake succession neutralizes the premium risk. Net income drifts from $57 billion toward the low $60 billions, tangible book compounds about 10 percent a year, and EPS outgrows it on buybacks. What has to be true: returns structurally above 17 percent and a multiple that does not de-rate from a record level. What most likely breaks it: the market simply refuses to pay 3 times for a deposit-led bank for five more years even if earnings hold. Peak multiple, not peak earnings, is the fragile part.
Base, about $400 in five years (tangible book about $160 at a 2.5 multiple). Returns settle around 18 to 19 percent, above the 17 percent target on the structural mix but below the cyclically inflated 23 percent; markets revenue normalizes to $8 to $10 billion a quarter; net interest income is flat to modestly down; Basel lands roughly as proposed and trims the buyback pace; and succession resolves cleanly. The multiple drifts from 3.0 toward a premium-but-normal 2.5 as the cyclical return tailwind fades. Tangible book compounds about 8 percent a year, partly offset by that modest multiple compression, so price appreciation is moderate, roughly 3 to 4 percent a year plus the dividend. What has to be true: a soft landing holds and the franchise premium fades gently rather than snapping. What most likely breaks it: a faster credit normalization that pulls returns and the multiple down at the same time.
Bear, about $277 in five years, troughing near $260 to $270 in years one to three (the skeptic’s case). This is a de-rating, not a blow-up. The soft landing wobbles, unemployment drifts toward 5 percent, card charge-offs come off the 3.4 percent plateau, and the Fed, boxed in by sticky inflation, cannot cut to cushion it. The Q1 markets record fades to the $8 to $10 billion run rate, provisions step toward $4 to $5 billion a quarter, and returns print in the high teens instead of the low twenties. That is fine for the business but fatal for a 3-times multiple priced on 20-plus percent. Basel lands near as proposed, capping the buyback, and the succession gets answered, removing the option value the premium represented. Tangible book still grows, about 6 percent a year, but the multiple reverts toward the 2.0 median, a 15-to-25 percent drawdown in a stock the sell-side already pegs at fair value with no margin of safety. Note the five-year bear level sits above the three-year low: the fortress holds and the premium recovers somewhat; it is a de-rating and recovery, not a permanent impairment. What has to be true: the premium was cyclical or personal, not structural. What most likely breaks it: returns proving durable above 17 percent through the normalization, which would re-anchor the multiple.
The catalysts to watch are concrete and near. The 2026 stress-test results landed June 24, sharpening the credit-tail math even though the capital buffers are frozen. Q2 earnings on July 14 is the first durability test of the record markets quarter. The post-stress-test capital-return update reads against the Basel draw. The Fed path through 2026 sets the net interest income floor. And a formal succession announcement remains a latent, datable event. The leading indicators that tell you which scenario is winning: the card charge-off rate (holding 3.4 percent is base or bull, drifting toward 4 to 5 percent is the bear de-rating underway), net interest income against the $103 billion guide, return on tangible common equity against the 17 percent target, the markets and investment-banking run rate, the capital trajectory under Basel, and price to tangible book itself against the 2.0 median, which is the real-time scoreboard for the premium.
Companies to watch (bull / base / bear)
The peer set is the way to triangulate JPMorgan: the money-center banks it competes with for deposits and corporate clients, and the markets-and-wealth houses it competes with for trading and advisory. Every name here carries a genuine bear, not a token one. All figures are point-in-time around June 22, 2026 and are single-vendor estimates where noted.
JPMorgan Chase (JPM). The subject: the largest and best-run US bank, number one in deposits and global investment-banking fee share, 20 percent returns at scale.
- Bull: best-in-class returns on a deposit fortress, $40 billion-plus of excess capital, and investment-banking share gains that compound, a franchise that earns a structural premium.
- Base: returns fade toward 18 to 19 percent, the multiple drifts toward 2.5 times, and the stock compounds modestly with the dividend.
- Bear: 3 times tangible book is about 50 percent above its own 10-year median at peak returns; the Basel surcharge uniquely raises its capital; and the Dimon premium is unhedged. Already at consensus fair value.
Bank of America (BAC). The number-two US bank, the most rate-sensitive money-center, with a huge bond portfolio. Market cap around $407 billion.
- Bull: an $800 billion-plus bond book repricing into higher-for-longer rates drives a multi-year net interest income lift, and a return climbing toward its 16-to-18 percent target closes the discount to JPMorgan.
- Base: steady recovery, return in the mid-teens, the discount to JPMorgan narrows slowly.
- Bear: it is the most asset-sensitive money-center, so a sharp cut cycle collapses net interest income before the bond book reprices; a 14-to-16 percent return leaves a wide gap to JPMorgan that keeps the roughly 1.87-times discount valid.
Wells Fargo (WFC). The number-four US bank, a domestic retail-and-commercial machine, with its multi-year asset cap finally lifted in 2025. Market cap around $251 billion.
- Bull: the asset-cap removal unlocks constrained balance-sheet growth and fee income, and the path to a 17-to-18 percent return is not yet priced into a roughly 1.78-times multiple.
- Base: efficiency-driven return recovery plays out gradually as capital return scales.
- Bear: net interest income undershot in Q1 with the margin compressing, and the return gap to JPMorgan is partly structural; a recession resets the turnaround story.
Citigroup (C). The number-three US bank by assets but the lowest return and cheapest multiple in the group, deep into a multi-year transformation under Jane Fraser. Market cap around $244 billion.
- Bull: at roughly 1.3 times tangible book on a return that is inflecting upward fast (13.1 percent in Q1 2026 against a 10-to-11 percent target), it is the widest discount-to-value story in the group if the transformation delivers.
- Base: the turnaround grinds forward, the discount narrows in fits.
- Bear: the 10-to-11 percent return target is still below the cost of equity, so Citigroup destroys value even on success; if the transformation stalls, the discount is a value trap.
Goldman Sachs (GS). The premier global investment bank, number one in mergers advice, less deposit-funded and more reliant on capital markets. Market cap around $323 billion.
- Bull: the deal cycle is inflecting hard (advisory up 89 percent in Q1 2026), and at a 21 percent return with a large pipeline it is the cleanest play on a sustained deal-and-issuance cycle.
- Base: a strong but volatile markets year, returns in the high teens.
- Bear: its earnings are notoriously cyclical (investment-banking revenue halved in 2022 to 2023); a roughly 3.3-times multiple assumes a cycle peak that history says is temporary, and a deal freeze reverses the return into the teens fast.
Morgan Stanley (MS). The number-one US wealth manager and a co-leader in equities trading, transformed over a decade into a predominantly fee-based model. Market cap around $358 billion.
- Bull: the $7.5 trillion-plus wealth flywheel compounds fee income through the cycle, a 27 percent return is the group’s highest, and the transformation premium has room to expand.
- Base: steady wealth-fee growth carries the group, with markets revenue cyclical on top.
- Bear: at roughly 4.4 times tangible book it is the richest valuation in the group and prices in continued return outperformance; a prolonged equity drawdown stalls fee-based assets, net new money, and institutional trading all at once.
The PNC Financial Services Group (PNC). The largest US super-regional, expanding into the Sun Belt via its FirstBank acquisition. Market cap around $93 billion.
- Bull: FirstBank pushes PNC into faster-growing markets, and a path back to an 18 percent return by year-end at roughly 2.1 times tangible book looks undervalued against its through-cycle power.
- Base: integration proceeds, return dips then recovers through 2026.
- Bear: high integration risk after a January 2026 close, net interest income misses, and it is squeezed between money-center diversification and niche growth, with neither buffer in a slowdown.
One internal link worth following for a different angle on financials: a Berkshire Hathaway deep dive covers a company that is itself a financials giant and a long-standing holder of large bank stakes, with a very different model for compounding capital.
Risk controls
The honest risk paragraph. JPMorgan is a leveraged play on the credit cycle, and the single biggest risk is a recession that pushes card charge-offs from 3.4 percent toward the 5-to-6 percent range and spikes provisions by $10 to $15 billion a year, with a stressed card-loss tail of 16 percent in the severe scenario. Net interest income is rate-path dependent and asymmetrically so, losing about $2.2 billion per 100 basis points of cuts versus gaining $1.8 billion per 100 basis points of hikes, so a rapid cut cycle into a slowdown is the worst combination. The valuation is the position: at 3 times tangible book after a strong run, with the sell-side already at fair value, there is little margin of safety, and a de-rating toward the 2.0 median is a 15-to-25 percent move on its own. Regulation is a JPM-specific risk, with the proposed Basel surcharge uniquely raising required capital and potentially capping buybacks. Key-person and succession risk is real and unhedged on a 70-year-old CEO. And there is always the tail of a trading or operational shock, a London-Whale-style event, in a firm running a balance sheet this large. What would change the read for the better: durable returns above 17 percent through a normalization, a favorable Basel outcome, and a clean succession. What would change it for the worse: a credit inflection and multiple compression arriving together.
Methodology, sourcing, and data-quality flags
This piece was built from parallel research streams (the value-chain map, the SEC filings, market action and valuation, sentiment, the macro and micro economics, a credit deep dive, a capital and Basel deep dive, a markets and investment-banking deep dive, a net-interest-income deep dive, and a forward outlook), then run past a skeptic who argued the short side and a compliance review of the disclaimers and framing. The source hierarchy, strongest first: primary filings (the FY2025 10-K filed February 13, 2026, the Q1 2026 10-Q, the 8-K earnings releases and capital announcements, and Federal Reserve publications); analyst and institutional estimates; reputable trade press; and the piece’s own labeled scenario arithmetic. Every load-bearing financial figure was checked against the EDGAR primary source.
A note on the read itself, factor by factor, in plain terms rather than as scores. On valuation, the evidence reads rich: 3.05 times tangible book is about 50 percent above the 10-year median at what is plausibly peak earnings, the cheap-looking forward earnings multiple is the wrong lens for a bank, and the mean target implies only 2 to 3 percent upside. This is the weak factor. On growth, the read is mildly positive: rate-driven net interest income is guided flat to down and markets revenue is at a transient record, but payments, asset management, and card annuities compound and JPMorgan reliably takes share in downturns. A modest positive, not a growth story. On quality, the read is best-in-class: a 20 percent return on tangible common equity (23 percent in Q1), a 14.6 percent capital ratio with about $40 billion of excess, the number-one US deposit and number-one global investment-banking franchises, a sector-leading roughly 52 percent efficiency ratio, and 15 straight dividend raises. This is the strongest factor and the reason any premium exists. On risk, the read is net negative: a late-cycle credit book with a 16 percent stressed card tail, the Basel re-proposal uniquely raising JPMorgan’s required capital, both revenue engines near a cyclical top, and an unresolved succession on a 70-year-old CEO, partly offset by diversification and the fortress balance sheet. On momentum, the read is mildly positive: the stock sits near its all-time high, about 7 percent above both its 50- and 200-day moving averages, up about 20 percent on the year, with minimal short interest, but it is already at the consensus target so the trend is constructive without much room. Netting it out, a high-quality franchise at a full-to-rich price, late in the cycle: the quality and momentum pull one way, valuation and risk the other, and the lean lands at Hold. Own the fortress, but the premium leaves little to be paid for taking the risk here. The read would move up to Buy on a pullback that flips valuation cheaper (a move toward roughly 2.3 times tangible book) or on confirmed return durability; it would move down to Sell if credit normalization turned the risk read decisively negative and the multiple began compressing.
Data-quality flags:
- Point-in-time figures move fast. Every price, market cap, valuation multiple, capital ratio, moving average, peer comparison, and analyst target is stamped June 22, 2026 and will drift. The freshness bar on this piece is live-prices; treat all of it as a snapshot.
- Price to tangible book is the right multiple, and it is rich. Some earlier vendor reads of 2.3 to 2.9 times are stale (from May, when the stock was near $299) or are price-to-book rather than price-to-tangible-book. Dated to June 22 against tangible book of $108.87, the figure is about 3.05 times.
- Managed versus reported revenue. The $185.6 billion managed-revenue figure includes a tax-equivalent gross-up; the reported GAAP figure is $182.4 billion. Both are correct; the basis is stated where it matters.
- The dividend is $1.50 a quarter ($6.00 a year). An earlier draft figure of $1.60 was an error; JPMorgan investor relations and the primary filings confirm $1.50.
- Forecasts are forecasts. The net interest income guide, the expense guide, the Basel capital impact, the recession odds, and the Fed rate path are outlooks. Their attribution is verified; their truth is not. Each is labeled.
- The Basel impact is an estimate of a proposed, non-final rule. The roughly 4 percent CET1 increase for JPMorgan is management’s estimate under the March 2026 re-proposal, contrasted with the Fed’s roughly 4.8 percent average relief for peers. The comment period closed June 18, 2026; the final rule could change the outcome materially.
- Succession and the “Jamie premium” are reported and estimated, not fact. Pinto’s retirement and Piepszak’s withdrawal are primary-sourced and stated as fact. A formal naming of Marianne Lake as CEO-designate is not confirmed by any filing and is framed only as the reported frontrunner. The “Jamie premium” is an analyst estimate with a wide range (about 5 to 15 percent of market cap) and is labeled as such.
- Credit and provision-spike scenarios are scenarios, not forecasts. The recession provision math ($5 to $7 billion a quarter, $10 to $15 billion a year) is back-of-envelope, and the stress loss rates are the Fed’s supervisory scenario. The 2026 stress-test results were due June 24, one day after the research date, and were not in hand at the time of writing.
- Peer comparisons are single-vendor and point-in-time. Peer multiples, returns, and market caps are sourced to aggregators on dates that bounce within a few weeks; they are dated approximations, not hard facts.
Key sources: JPMorgan FY2025 10-K (EDGAR accession 0001628280-26-008131) and Q1 2026 10-Q; JPMorgan 8-K earnings releases and the July 2025 capital announcement; the Dimon 2025 annual letter; the Q1 2026 earnings call transcript; Federal Reserve FOMC June 2026 projections, the 2025 and 2026 stress-test scenarios, and the March 2026 Basel III re-proposal; stockanalysis.com and marketbeat.com for market data; gurufocus for peer multiples; and trade-press coverage for sentiment and succession context. Figures are point-in-time as of June 22, 2026.
This article is OSINT research for educational purposes only and is not investment advice. I am not a financial advisor, and nothing here is a recommendation to buy, sell, or hold any security. Banks carry credit-cycle, rate, and regulatory risk that can move results faster than a typical company. Figures are point-in-time as of June 22, 2026 and will change. Do your own due diligence and consult a licensed financial advisor before making any decision.