
Research date: July 1, 2026 | OSINT research on Wells Fargo & Company (NYSE: WFC), the fourth-largest US bank by assets, freshly out from under the two most binding restrictions of its 2016 sales-scandal era, the size and the returns that follow, and the money-center and super-regional peers it is measured against. Live prices, stamped hard.
Important disclaimer. This is OSINT (open-source intelligence) research published for educational and informational purposes only. It is not investment advice, not a recommendation to buy, sell, or hold any security, and not a solicitation. I am not a financial advisor. Banks are leveraged plays on the credit cycle, the rate path, and regulation, so the figures here can move faster and further than a typical stock when the cycle turns. All figures are point-in-time as of the stated research date (July 1, 2026) and move fast: prices, market caps, share counts, and capital ratios will be stale by the time you read this. Any bull, base, or bear scenarios below are illustrative arithmetic on stated assumptions, not price targets. Do your own due diligence and consult a licensed financial advisor before making any decision.
Where this stock could be in 6 months, 1 year, 3 years, and 5 years
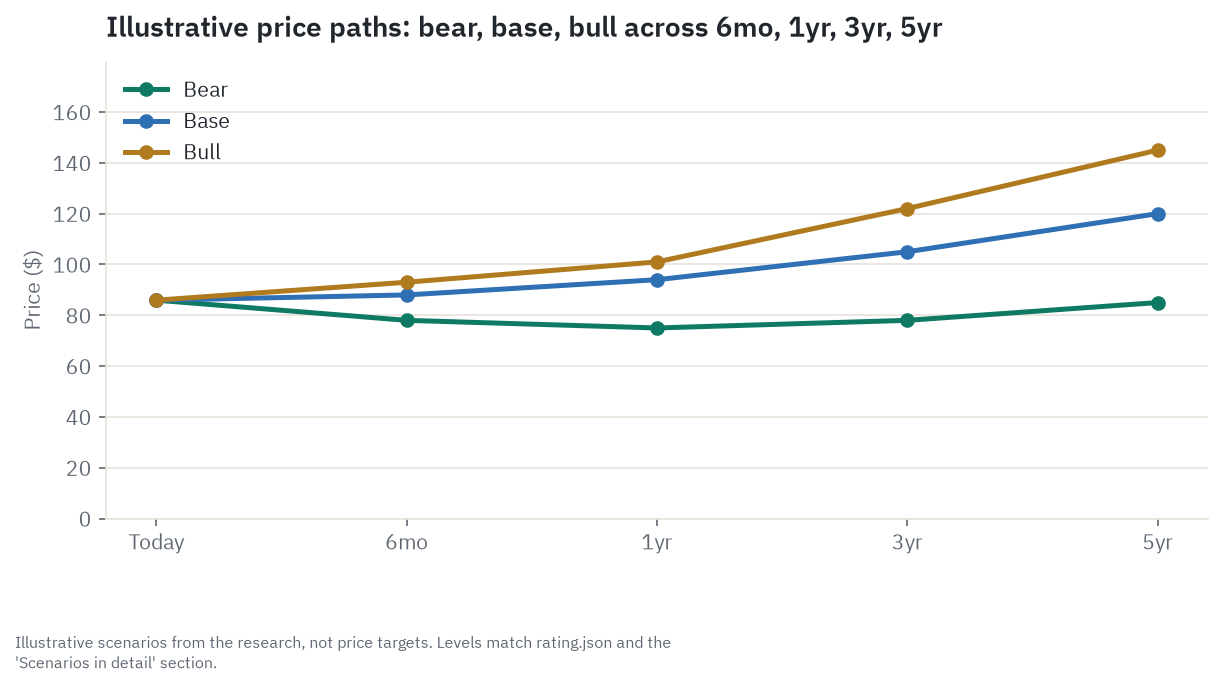
Wells Fargo trades at roughly 1.9 times its tangible book value, the bank’s hard net worth per share once goodwill and other intangibles are stripped out, the number that matters most for a bank because most of a bank’s assets are financial instruments marked close to cash value rather than factories or brand names that are hard to price. Getting to that multiple, and to what it should be, is what the rest of this piece works through, but the short version is this: for the first time in eight years, Wells Fargo is legally free to grow, and the market has not yet decided how much credit that freedom deserves. Every dollar level below is an estimate built on stated assumptions, never a price target.
Six months. This window is almost entirely about the next two earnings prints, mid-July and October 2026, and one specific number inside them: net interest margin, which has now compressed for three straight quarters, from 2.67 percent a year ago to 2.60 percent last quarter to 2.47 percent most recently. The base case is a grind toward the high $80s, about $88, as tangible book keeps accreting and the multiple holds roughly where it sits today. The bull case is about $93, back toward the 52-week high, if that margin shows its first sign of stabilizing. The bear case is about $78 if the margin keeps sliding and a soft print reopens worries about the credit cycle. The single thing most likely to flip the read here is whether that margin number stops falling.
One year. Management has pointed to a full-year 2026 net interest income path of roughly $50 billion, which would be about 5 percent above last year’s figure. Whether that lands, alongside a credit-cost trend that is currently running 22 percent hotter than a year ago, is the dominant variable at this horizon. The base case is about $94, close to where the sell-side’s own average price target already sits, on the guide landing roughly on plan and credit costs normalizing without accelerating. The bull case is about $101, above the 52-week high, if the margin actually inflects higher and returns keep climbing. The bear case is about $75, near the 52-week low, if the net interest income path falls short while provisions keep rising at their current pace. The flip here is a second consecutive quarter of margin deterioration versus a second consecutive quarter of improvement.
Three years. By this point the structural questions take over from the quarterly noise: has the efficiency ratio, the share of revenue eaten by operating costs, closed any of its gap to the best-run money-center peers, and has the elevated commercial-real-estate criticized-loan share worked itself out one way or the other. The base case is about $105, on tangible book compounding at a high-single-digit clip and the multiple holding roughly steady. The bull case is about $122 if that efficiency gap has genuinely narrowed and the multiple has re-rated toward money-center levels. The bear case is about $78, roughly flat from today, if the efficiency ratio stays stuck and credit costs stay elevated through a full cycle. The flip is whether the efficiency ratio has moved meaningfully below 65 percent or stayed stuck in the high 60s.
Five years. This is the durability question in full: has Wells Fargo become a genuinely re-rated, efficiently run money-center bank, or does it remain the structurally discounted name in its own peer group. The base case is about $120, a steady mid-to-high-single-digit compounder on tangible book growth alone. The bull case is about $145 if the growth the freed-up balance sheet is producing proves durably profitable and the market pays a money-center multiple for it. The bear case is about $85, essentially back to today’s price, if the post-restriction re-rating this stock has already enjoyed over the past year gets given back. The single thing most likely to change this long-run read for the worse is a new regulatory enforcement action, given the company’s specific history; for the better, it is a sustained multi-year efficiency-ratio convergence with the strongest peers.
Where the read lands today. On balance the read holds at Hold. Wells Fargo has shed the two most binding constraints of its post-2016 era, the asset-growth cap and the board governance consent order, and it is already turning that freedom into real, double-digit loan growth. But a compressing net interest margin, rising credit costs, and a capital cushion that has quietly thinned while the bank buys back stock mean the stock reads as fairly valued rather than a bargain. The single thing most likely to move that read is whether the net interest margin stabilizes from here or keeps sliding.
Companion tool
Jump to the interactive dashboard to sort and filter every bank in this piece, or download the Excel model to flex the scenarios yourself.
TL;DR
Wells Fargo spent eight years, from February 2018 to June 2025, legally barred from growing its balance sheet beyond roughly where it stood the day the Federal Reserve imposed the restriction, the widely cited “asset cap,” a punishment for the 2016 fake-accounts scandal. A second, related consent order requiring the board to overhaul governance and risk management followed that same year. Both are now gone: the Fed lifted the asset-growth restriction on June 3, 2025, and terminated the governance order on March 5, 2026. The balance sheet has already responded, growing 13 percent in a single year to $2.2 trillion, with commercial and industrial loans up 36 percent in the Commercial Banking segment alone. Returns are climbing too, with return on tangible common equity up from 13.6 percent to 14.5 percent year over year, and the efficiency ratio improving from 69 percent to 67 percent. The catch is what is happening underneath that headline growth. Net interest margin, the spread the bank earns funding loans and securities with its deposit base, has compressed for three consecutive quarters, from 2.67 percent to 2.60 percent to 2.47 percent, and provision for credit losses is up 22 percent year over year as commercial credit normalizes off a benign base. At the same time the bank’s core capital ratio has fallen from 11.09 percent to 10.29 percent as it redeploys freed-up capital into growth and buybacks rather than building a thicker cushion. At around 1.9 times tangible book value and a forward price-to-earnings ratio near 12, the stock is not expensive for a bank earning a mid-teens return on tangible equity, but it is not cheap either: the sell-side’s own low-end price target sits essentially at today’s quote. The honest read is Hold, Fair on valuation: a real, dated regulatory catalyst that has already partly played out, running alongside a genuine margin and credit-cost question the next few quarters will answer.
Explore it yourself: the interactive dashboard
Open the dashboard in a full screen
The dashboard holds Wells Fargo and the five banks it is measured against here, sortable by market cap, by what each one is to Wells Fargo (money-center peer, cheaper restructuring story, super-regional), and by the read behind the rating. Use it to check any single name as you read.
Prefer a spreadsheet? Download the Excel model with the company and peer table and an adjustable scoring tab. The scenario levels in that file are illustrative arithmetic, not targets.
The toll booth that was locked at the gate
A bank does not manufacture anything. Picture a reservoir: money flows in from depositors, who hand the bank their cash and accept little or nothing in interest on a big share of it, and the bank lets some of that water out as loans and securities at a higher rate, keeping the spread. For eight years, Wells Fargo ran that reservoir with a hard cap welded onto the outflow pipe. The Federal Reserve’s 2018 enforcement action, following the 2016 revelation that employees had opened millions of unauthorized accounts to hit sales targets, barred the bank from growing total assets beyond roughly where they stood at the time, an unusual and severe penalty that no other major US bank has operated under in the modern era. A second, related order that same year required the board of directors to overhaul its own oversight of governance and risk management.
Both constraints are now gone. The Fed announced on June 3, 2025 that Wells Fargo had “met all the conditions required” for the asset-growth restriction to be removed, after a multi-year remediation program and third-party review of the bank’s compliance improvements. The board governance consent order followed on March 5, 2026. What makes this more than a regulatory footnote is how quickly the balance sheet responded once the pipe was unlocked: total assets grew from $1.95 trillion in the first quarter of 2025 (right at the old ceiling) to $2.21 trillion a year later, a 13 percent jump that would have been flatly illegal before June 2025. The debate this piece works through is what that freedom is actually worth. The bull case says a bank freed to compete on equal footing with JPMorgan and Bank of America for the first time in nearly a decade has real room to close its valuation gap to those peers. The bear case says the market has had thirteen months to price that story in already, and the stock has already climbed accordingly, while the two things that actually decide near-term earnings, the lending spread and the credit cycle, are both moving the wrong way right now.
How the money flows
flowchart TD
    DEP["Deposits: $1.455T (Q1 2026)\nchecking, savings, CDs, corporate treasury"]
    DEP --> LOANS["Loan book: $1.017T\nC&I, cards, mortgage, auto, CRE"]
    DEP --> SEC["Investment securities\nTreasuries, agency MBS"]
    LOANS --> NII["Net interest income: $12.1B (Q1 2026)"]
    SEC --> NII
    FEE["Fee businesses:\ncards, wealth advisory,\ninvestment banking, trading"]
    FEE --> NONII["Noninterest income: $9.35B (Q1 2026)"]
    NII --> REV["Total revenue: $21.4B (Q1 2026)"]
    NONII --> REV
    REV --> COST["Noninterest expense: $14.3B\n+ credit provisions: $1.1B"]
    COST --> NI["Net income: $5.25B (Q1 2026)"]
    REG["Fed / OCC / CFPB oversight\nasset cap lifted 2025-06-03\ngovernance order lifted 2026-03-05"] -.constrains/frees.-> DEP
Read the diagram top to bottom. Roughly $1.46 trillion of deposits, most of it cheap or free checking and savings money, funds two things: a $1.02 trillion loan book (commercial and industrial credit, cards, mortgages, auto loans, commercial real estate) and an investment-securities portfolio held mostly for liquidity and yield. The gap between what the bank pays for that deposit money and what it earns on the loans and securities is net interest income, $12.1 billion in the first quarter of 2026 and still worth more than half of total revenue. Running alongside that spread business is a second, capital-light set of pipes: fee income from cards, wealth management advice, investment banking, and trading, which do not require the bank to hold the client’s money on its own balance sheet at all. That fee engine, $9.35 billion in the same quarter, is the more scalable, higher-margin half of the business, and it is disproportionately housed in Wealth and Investment Management and the trading and underwriting desks of Corporate and Investment Banking.
The box at the bottom left of the diagram is what makes this company’s story different from every other large US bank’s: for eight years, a regulator sat directly on top of the “deposits” box and would not let it grow past a hard ceiling. That box is unlocked now, and the shape of the whole chain (how much deposit growth becomes loan growth, how much loan growth becomes net interest income, and whether the credit costs on that growth stay contained) is the entire investing question in this piece.
The four segments: where Wells Fargo earns its money
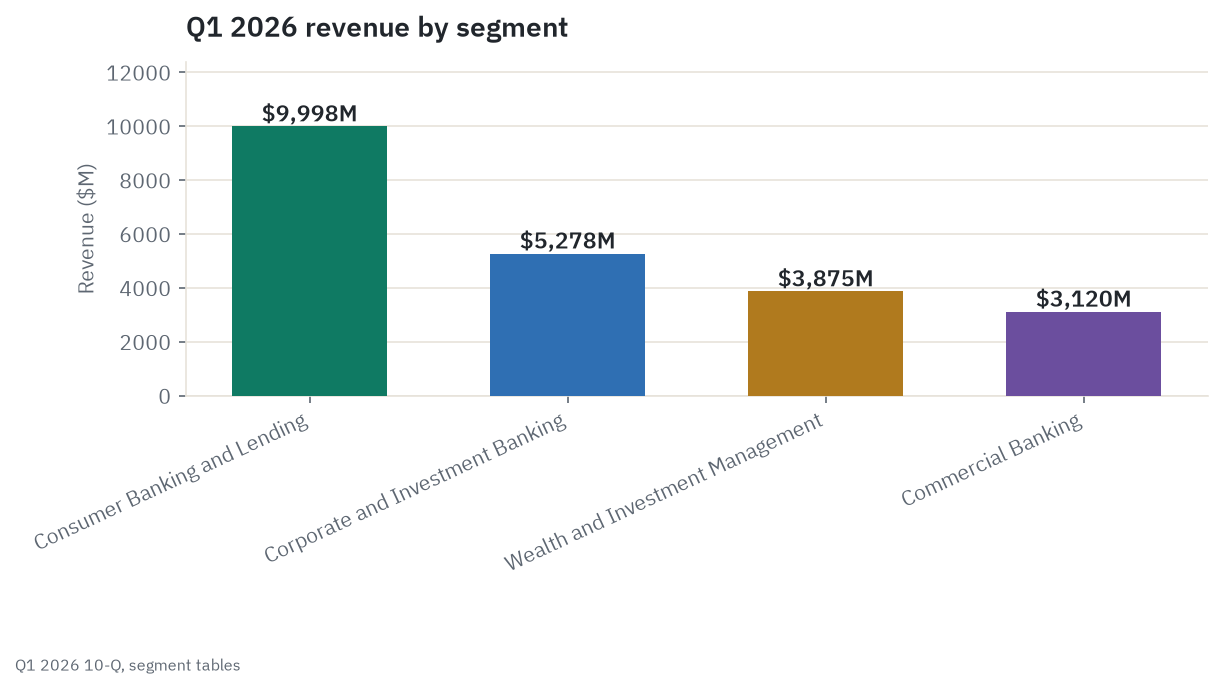
Wells Fargo reports through four segments, and each has a distinct economic character.
Consumer Banking and Lending is the largest by revenue, $9.998 billion in the first quarter of 2026, covering checking and savings accounts, credit and debit cards, and home, auto, and personal lending, along with wealth management delivered through the branch network. Its return on allocated capital jumped to 23.1 percent from 14.9 percent a year earlier, helped by lower provision expense, and its efficiency ratio improved to 66 percent from 68 percent.
Corporate and Investment Banking is the second-largest by revenue, $5.278 billion, and the most capital-markets-flavored of the four: investment banking fees, trading revenue, commercial real estate lending, and treasury management to large corporate and institutional clients. It is also the segment carrying the most visible credit-cycle stress right now: net charge-offs more than doubled year over year, from $97 million to $224 million.
Commercial Banking, $3.120 billion of revenue, serves private, family-owned, and certain public companies with lending, treasury management, and secured credit. It is the segment most directly benefiting from the freed-up balance sheet: average commercial and industrial loans grew 36 percent year over year.
Wealth and Investment Management, the smallest at $3.875 billion of revenue, delivers brokerage, financial planning, trust, and lending services to affluent and high-net-worth clients through financial advisors and digital platforms like WellsTrade and Intuitive Investor. It is the highest-return segment on allocated capital, 28.4 percent, despite carrying the highest efficiency ratio (84 percent, meaning it costs 84 cents to generate a dollar of revenue there), because it is a people-and-advice business rather than a capital-intensive lending one.
Who wins where
Deposit gathering is the stage of this business that keeps its economics through every part of the cycle, because a cheap, sticky deposit base is valuable whether rates are rising, falling, or flat, and whether the credit cycle is benign or turning. Lending and capital-markets activity capture more revenue in absolute dollars, but they are also where the credit risk and the margin compression both live, which is exactly what shows up in the numbers right now: Corporate and Investment Banking’s charge-offs more than doubling, and net interest margin sliding for three straight quarters even as the deposit base itself keeps growing. Wealth and Investment Management is the most acyclical, highest-return stage, insulated from credit risk because it earns fees on assets under management rather than a spread on loans, but it is also the smallest of the four segments, so it cannot single-handedly offset weakness elsewhere. The commodity-like stage of this business is plain consumer and commercial lending at prevailing market rates: rates and underwriting standards are broadly similar across the large banks, so scale, cross-sell, and treasury-management relationships, not a unique rate, are what let Wells Fargo (or any of its money-center peers) keep an edge there. The fee wallet Corporate and Investment Banking is chasing, investment banking and trading revenue, is the same wallet a pure capital-markets house like Goldman Sachs competes for without a large deposit base underneath it, a useful contrast on how differently two banks can earn the same dollar of underwriting or trading revenue.
Company by company: who’s who
Wells Fargo & Company (WFC). The fourth-largest US bank by assets and fifth by market value of common stock, with roughly $2.21 trillion on the balance sheet and a market capitalization near $263.0 billion. Recent result: $5.25 billion of net income in the first quarter of 2026, a 14.5 percent return on tangible common equity, up from 13.6 percent a year earlier. Bull: the asset cap and the board governance consent order are both gone, freeing growth after eight years of forced shrinkage, while returns keep climbing toward the mid-teens. Bear: net interest margin has compressed for three straight quarters and provision expense is up 22 percent year over year as the credit cycle turns, right as the bank’s capital cushion is thinning.
JPMorgan Chase & Co. (JPM). The largest US bank by both assets and market value, with a market capitalization near $896.2 billion, running a universal-bank model across consumer banking, commercial banking, corporate and investment banking, and asset and wealth management. Bull: unmatched scale across every business line and a management team the market pays a structural premium multiple to trust. Bear: already priced for perfection at that premium multiple, leaving little room for any stumble.
Bank of America Corporation (BAC). The second-largest US bank by assets, market capitalization near $416.8 billion, and the closest scale peer to Wells Fargo’s low-cost-deposit business model. Bull: an elite low-cost deposit base and a multi-year securities-repricing tailwind have been lifting net interest income and returns largely independent of the Fed. Bear: the stock trades near the top of its own decade-long valuation range, leaving little margin of safety if the credit cycle turns against it too.
Citigroup Inc. (C). A multi-year self-help restructuring story, market capitalization near $244.9 billion, historically the cheapest large US bank on tangible book value. Bull: still the cheapest of the group on tangible book, with a credible multi-year path to a higher return on equity if the restructuring plan lands. Bear: has repeatedly missed its own return targets over the past decade, so the market has learned to discount the plan until it is actually delivered.
U.S. Bancorp (USB). The largest of the US “super-regional” banks, market capitalization near $95.8 billion, built around a payments and fee-income mix alongside traditional lending. Bull: a less capital-intensive payments and fee mix than a traditional lending-heavy bank. Bear: lacks the scale and capital-markets diversification of the money-center names, leaving it more exposed to a regional-bank-style funding scare.
PNC Financial Services Group (PNC). A top-10 super-regional bank built partly through acquisition, market capitalization near $100.2 billion. Bull: a disciplined underwriting culture and a track record of accretive, well-integrated acquisitions. Bear: a regional-bank balance sheet still carries proportionally more commercial real estate concentration risk than the money-center banks.
What the filings say
Wells Fargo’s first-quarter 2026 10-Q and full-year 2025 10-K tell a story of a bank growing again after eight years of forced restraint, with a genuine tension underneath the headline numbers.
Income statement. Total revenue was $21.446 billion in the first quarter of 2026, up 6 percent year over year, split between net interest income of $12.096 billion (up 5 percent) and noninterest income of $9.350 billion (up 8 percent). Net income was $5.253 billion, up 7 percent, and diluted earnings per share were $1.60, up from $1.39. Full-year 2025 net income was $21.338 billion, up from $19.722 billion in 2024. Full-year 2025 net interest income was actually down slightly, $47.484 billion versus $47.676 billion in 2024, a reminder that the margin pressure now showing up quarter to quarter is not brand new.
Segments & geography. The four-segment mix is detailed above. Geographically, the bank is overwhelmingly US-domiciled: non-US commercial loans were about $88.0 billion of a roughly $629.6 billion total commercial loan book.
Cash flow & balance sheet. Total assets reached $2.206 trillion at the end of the first quarter of 2026, up 13 percent year over year, a growth rate that was legally impossible before June 2025. Total loans were $1.017 trillion (up 11 percent), total deposits $1.455 trillion (up 7 percent). Common stockholders’ equity stood at $163.2 billion and tangible common equity at $137.8 billion.
Capital returns & dilution. Wells Fargo repurchased $17.516 billion of common stock in all of 2025 and another $4.0 billion in the first quarter of 2026 alone. The quarterly dividend is $0.45 per share, an annualized $1.80, a roughly 2.11 percent yield at the current price. Common shares outstanding fell to about 3.06 billion as of mid-April 2026 from 3.26 billion a year earlier, a roughly 6 percent reduction driven almost entirely by the buyback.
Guidance & MD&A. The 10-Q itself carries no formal quantitative full-year guidance; the filing’s forward-looking language is qualitative. Separately, and reported by the trade press rather than filed, the chief financial officer has pointed to a full-year 2026 net interest income path of roughly $50 billion, about 5 percent above 2025’s figure. Treat this explicitly as a forecast, not a filed fact.
Disclosed risk factors that matter. Three stand out from the filing’s own risk-factor and MD&A language. First, net interest margin has compressed for three consecutive quarters and the bank explicitly frames it as sensitive to Fed policy and the yield curve. Second, commercial real estate remains a named concentration: the $132.2 billion CRE book carries $14.6 billion of internally “criticized” loans, about 11.1 percent of the book, though both CRE nonaccrual loans and CRE net charge-offs actually improved from a year ago. Third, the bank still operates under other legacy remediation and reporting obligations tied to the broader 2016-2018 enforcement-action era even though the two most consequential constraints, the asset cap and the governance order, are both now lifted.
Recent material events. The Federal Reserve’s asset-growth-restriction removal (June 3, 2025) and Wells Fargo’s own disclosure of the board governance consent order’s termination (March 5, 2026) are the two defining events of the past year for this company. The OCC separately rescinded its recovery-planning guidelines for large banks including Wells Fargo in March 2026.
Net interest margin: the number the whole bull case has to answer
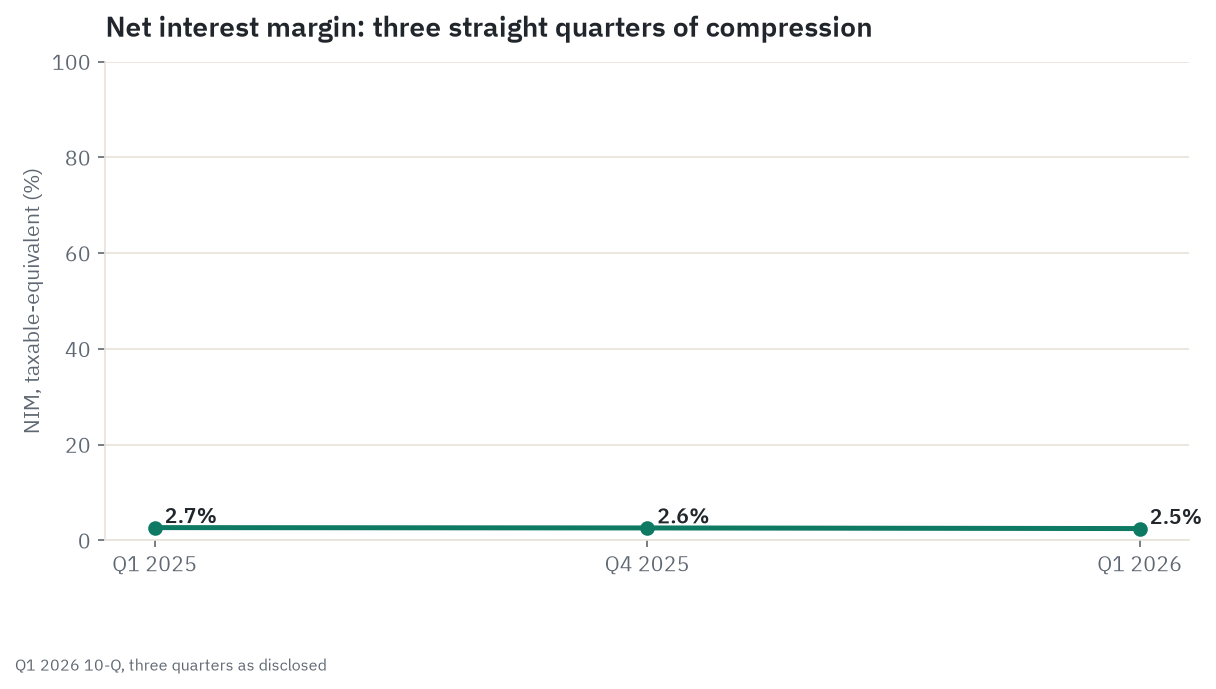
Net interest margin is simply the spread, expressed as a percentage of earning assets, between what a bank earns on its loans and securities and what it pays for the deposits and other funding that support them. Think of it as the toll a bank keeps per dollar that flows through its reservoir. Wells Fargo’s toll has been shrinking for a year: 2.67 percent in the first quarter of 2025, 2.60 percent in the fourth quarter of 2025, and 2.47 percent in the first quarter of 2026. A falling Fed funds rate, down to 3.63 percent as of July 2026 from the 5.25-to-5.50-percent peak of the 2022-2023 hiking cycle, is part of the explanation: as the Fed cuts, the yield on new loans and reinvested securities tends to reprice down, and if that happens faster than deposit costs fall, the spread narrows. This matters because net interest income is still worth more than half of total revenue, so a persistently shrinking margin is a direct headwind to the growth story the freed-up balance sheet is supposed to deliver. It is also the single number this piece’s whole bull case has to answer: a bigger balance sheet earning a shrinking spread on every dollar is a materially different story than a bigger balance sheet earning the same spread it always has.
Balance-sheet growth: the pipe that was capped
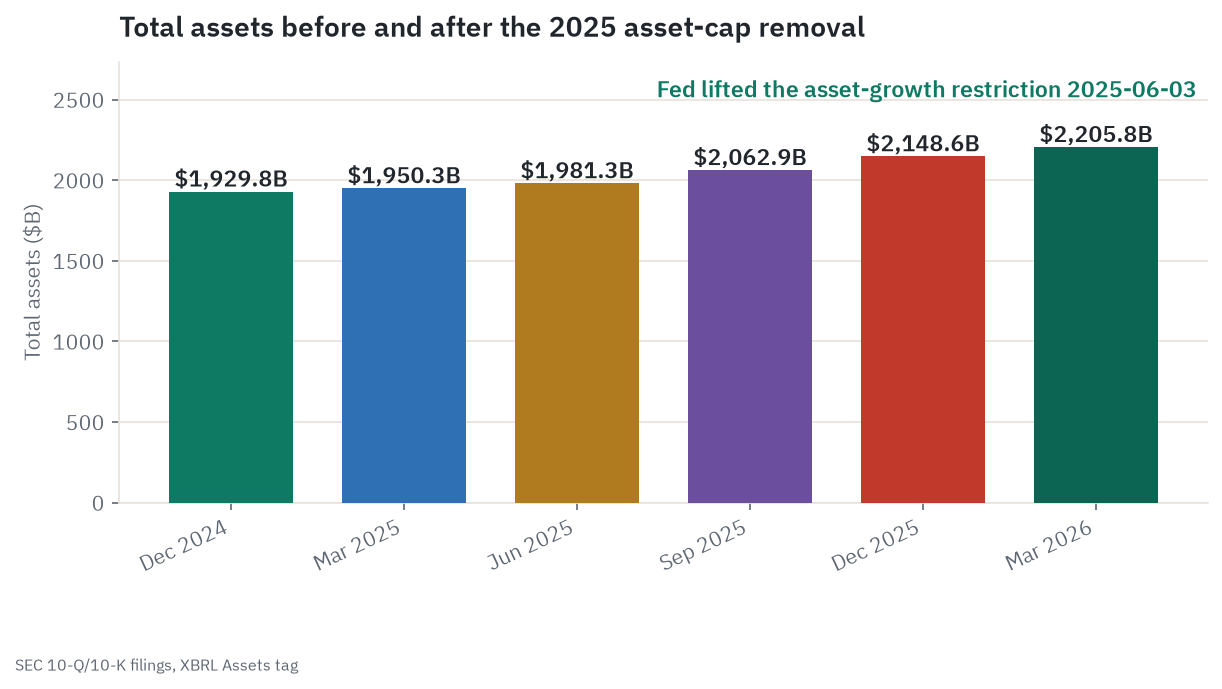
The chart above is the clearest single picture of what changed. Total assets grew only modestly from the end of 2024 ($1.930 trillion) through the first quarter of 2025 ($1.950 trillion), right at the level the old restriction had effectively held the bank to for years. Since the restriction lifted in June 2025, growth has been steady and real: $1.981 trillion in the second quarter of 2025, $2.063 trillion in the third, $2.149 trillion by year-end, and $2.206 trillion by the first quarter of 2026, a 13 percent increase in a single year. The clearest evidence that this growth is not just balance-sheet padding: average commercial and industrial loans in the Commercial Banking segment alone grew 36 percent year over year, from $192.7 billion to $262.2 billion. A bank does not grow a commercial lending book that fast without winning real, competed-for business from somewhere, almost certainly at the direct expense of some combination of JPMorgan, Bank of America, PNC, and US Bancorp, who had been growing uninterrupted for the seven years Wells Fargo could not.
What the market is paying
Wells Fargo closed at $85.94 on July 1, 2026, within a 52-week range of $72.78 to $97.76, putting the stock roughly in the middle of its own one-year trading band after giving back about 10 percent from a January 2026 high. Over the trailing three and five years the stock has returned roughly 97 percent each way, alongside the broader sector’s recovery from the 2023 regional-banking stress episode and the multi-year Fed hiking cycle giving way to net interest income growth across the industry.
On valuation, Wells Fargo trades at roughly 1.9 times tangible book value ($44.98 per share as of the first quarter of 2026), a trailing price-to-earnings ratio near 13.3, and a forward price-to-earnings ratio near 12.0. None of those numbers scream cheap or expensive in isolation: a bank earning a 14.5 percent return on tangible common equity trading at under 2 times tangible book and 12 times forward earnings is, by the market’s usual math, priced roughly for what it is currently delivering, not for a lot more or a lot less. The most useful single data point on how settled that view is: the sell-side’s own price targets run from a low of $85 (essentially today’s price) to a high of $113, a 32-percent-wide spread across 24 analysts, with an average target of $96.52 and a consensus rating of Buy. Recent individual actions capture the split well: Goldman Sachs reiterated Buy at $93 on July 2, 2026, Citi reiterated Hold at $90 on June 30, and Morgan Stanley reiterated Hold while raising its target from $97 to $102 on June 29. That is a Wall Street consensus that likes the story directionally but disagrees meaningfully on how much of it is left to capture.
The stock carries a beta of 0.92, meaning it has moved slightly less than the broad market on average, consistent with a large, well-covered, liquid financial stock rather than a volatile speculative name.
What the crowd is saying
Coverage around Wells Fargo’s fourth-quarter 2025 earnings, reported in mid-January 2026, described the stock as having run “hot into earnings,” and the subsequent pullback was read by at least one prominent commentary desk as profit-taking rather than a fundamental concern, with the same source reiterating a raised price target the same day. More recent coverage, in June 2026, centered on the chief financial officer’s public reaffirmation of the roughly $50 billion full-year 2026 net interest income path, a constructive, forward-looking tone rather than a defensive one. The dominant story arc across the period is “post-restriction bank re-rating,” a genuine shift in narrative from the years immediately following the 2016 scandal, when nearly every headline was about the next fine or the next consent order.
The clearest divergence between narrative and fundamentals worth naming: the “regulatory overhang is over” story has traveled further and faster in the financial press than the underlying facts are old. The asset cap was lifted just over thirteen months before this research was written, and the governance consent order only four months before. A meaningful share of the stock’s roughly 97 percent three- and five-year return very plausibly reflects the market front-running that resolution for a couple of years before it was actually final, which means a real portion of the “cap lift” catalyst is already priced in rather than still ahead of the stock. Separately, a reader relying only on the sell-side’s “Buy, average target $96.52” headline would not necessarily see, without reading the filings directly, that net interest margin has compressed for three straight quarters right alongside a 22 percent increase in credit provisions, even as headline earnings and return on equity both improved. Retail and social chatter volume, search-attention trends, and employee-sentiment data were not independently sourced in this pass to a level that would meet the bar for even a soft, labeled signal, so none of that is asserted here; Wells Fargo is not a thin-float or promotion-susceptible name, and no manipulation pattern was observed or would be expected at this scale.
Durability: does the freed-up balance sheet earn its multiple?
The structural bull case is straightforward and genuinely new: a regulator does not often hand a large US bank an extra 13 percent of balance-sheet capacity in a single year, and Wells Fargo has already shown it can turn that capacity into real, competed-for commercial loan growth (36 percent year over year in one segment alone) rather than simply growing for growth’s sake. If that continues alongside gradual efficiency-ratio improvement (69 percent to 67 percent in a year), there is a real, sourced argument for the stock’s valuation multiple to keep closing the gap to money-center peers.
The cyclical bear case is just as real. Net interest margin has now compressed for three consecutive quarters, and provision for credit losses is up 22 percent year over year, while the bank’s core capital ratio has fallen from 11.09 percent to 10.29 percent as it redeploys freed capital into growth and buybacks rather than a larger buffer. A bank simultaneously seeing rising credit costs and a shrinking capital cushion, by choice, is taking on more risk exactly when a margin of safety would matter more, not less. What historically ends a credit cycle for a bank this size is a sharp rise in unemployment (currently 4.2 percent, drifting down slightly, not up) or a real-estate-specific shock; neither is currently evident, but the commercial real estate book’s 11.1 percent criticized share is elevated by any historical standard even after a quarter of improvement.
The most likely outcome sits between the two extremes rather than at either pole: continued single-digit revenue and net interest income growth, a margin that stabilizes rather than collapses or roars back, and credit costs that keep rising gradually as the cycle normalizes rather than accelerating into a real event. That is roughly what the base-case scenario below assumes.
The scenarios in detail
Four variables decide the five-year outcome, and the scenarios below are simply different settings of them: how much of the freed-up balance sheet turns into profitable growth, whether net interest margin stabilizes or keeps sliding, whether credit costs normalize gently or accelerate, and whether the efficiency-ratio gap to money-center peers closes. The dollar levels match the chart at the top of the article, and the method is auditable rather than picked by feel: tangible book value per share ($44.98 today) is compounded at a scenario-specific annual rate and multiplied by a scenario-specific price-to-tangible-book multiple.
Bull, the freed-up growth proves durably profitable. Net interest margin stabilizes and then modestly recovers as the Fed’s easing cycle matures and asset repricing catches up, credit costs normalize without a real commercial-real-estate event, the efficiency ratio converges from 67 percent toward the low-to-mid 60s, and return on tangible common equity climbs to roughly 16 to 17 percent. Tangible book value per share compounds at roughly 9 percent a year, and the multiple expands from about 1.9 times toward 2.0 to 2.1 times as the market re-rates the post-restriction franchise. On that illustrative arithmetic, tangible book near $69 by year five at roughly 2.1 times works out to about $145, with about $101 at one year and $122 at three. What breaks it: a stall in the efficiency-ratio improvement, or a fresh regulatory or credit event that reopens the overhang narrative the stock has spent the past year shedding.
Base, steady growth into a stable, not-quite-peer-level multiple. Net interest margin compression slows and roughly stabilizes near current levels, credit costs continue a gradual, manageable normalization, and the efficiency ratio improves gradually without fully closing the gap to money-center peers. Return on tangible common equity holds in the mid-teens and the multiple holds close to today’s roughly 1.9 times. Tangible book value per share compounds at roughly 7 percent a year. That is tangible book near $63 by year five at about 1.9 times, roughly $120, with about $94 at one year (close to the sell-side’s own $96.52 average target) and $105 at three. What breaks it: either a genuine acceleration in efficiency and margin (pushing toward the bull case) or a real credit-cycle turn (pushing toward the bear case); the base case is a narrow path between two more decisive outcomes.
Bear, the margin keeps sliding and the multiple gives back the re-rating. Net interest margin keeps compressing through 2026 and into 2027 as the Fed keeps easing and asset repricing lags, credit costs accelerate meaningfully beyond the current 22-percent pace, particularly if commercial real estate’s recent improvement reverses, and the capital ratio’s decline continues, constraining the bank’s flexibility. The multiple de-rates to roughly 1.55 to 1.65 times as the market prices a harder cyclical turn, and tangible book value per share compounds only about 4 percent a year as retained earnings get squeezed. That is tangible book near $55 by year five at roughly 1.55 times, about $85, essentially flat versus the price this piece was written at, with about $75 at one year and $78 at three. The point of this bear case is not that anything breaks catastrophically: it is that the bank stays fine and the stock simply gives back the post-restriction re-rating it has enjoyed over the past year, a period of going nowhere rather than a blowup. What breaks it (in the bad direction): a second regulatory enforcement action, given the company’s specific history, would be the single most damaging surprise.
The catalysts that decide which path wins are datable. Near term: the Q2 2026 earnings print in mid-July (the next net interest margin reading and the credit-provision trend), the Q3 2026 print in October, and the ongoing quarterly commercial-real-estate criticized-loan trend inside each release. Multi-year: the Stress Capital Buffer is fixed at 2.50 percent through September 30, 2027, so the next real capital-requirement inflection is the 2027 stress-test cycle, while the efficiency-ratio convergence (or lack of it) toward money-center peer levels is the structural inflection that matters most over three to five years. The leading indicators worth tracking in real time: the quarterly net interest margin print, the commercial real estate criticized-loan share (currently 11.1 percent of $132.2 billion), the CET1 capital ratio (currently 10.29 percent against an 8.50 percent regulatory floor), the efficiency ratio (currently 67 percent versus the low 50s to low 60s at money-center peers), and any new regulatory or enforcement disclosure given the company’s history.
Banks to watch (bull / base / bear)
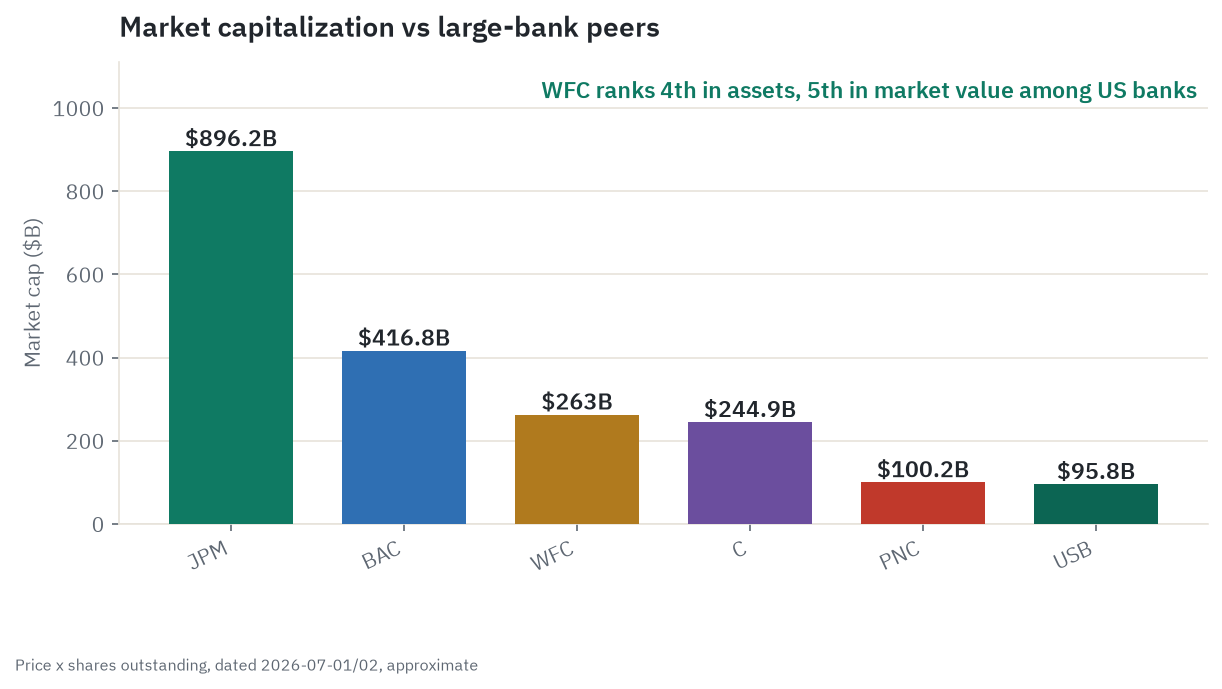
All figures below are point-in-time as of July 1-2, 2026 and move daily; peer market capitalizations in particular are dated, approximate figures.
JPMorgan Chase (JPM). The number-one US bank by both assets and market value, with a market capitalization near $896.2 billion.
- Bull: unmatched scale across every business line and a management reputation the market pays a structural premium multiple to trust.
- Bear: already priced for perfection, leaving no catch-up-valuation story and full exposure to any credit or markets normalization.
Bank of America (BAC). The closest scale peer to Wells Fargo’s low-cost deposit model, market capitalization near $416.8 billion.
- Bull: an elite low-cost deposit franchise and a multi-year securities-repricing tailwind lifting net interest income largely independent of the Fed.
- Bear: trades near the top of its own decade-long valuation range, leaving little room for a normal cyclical turn.
Citigroup (C). A multi-year self-help restructuring story, market capitalization near $244.9 billion.
- Bull: the cheapest large US bank on tangible book value, with a credible multi-year path to a higher return if the restructuring lands.
- Bear: a decade-long record of missing its own return targets means the market has learned to wait for delivery, not the promise.
U.S. Bancorp (USB). The largest super-regional bank, market capitalization near $95.8 billion.
- Bull: a less capital-intensive, fee-and-payments-heavy mix than a traditional lending-first bank.
- Bear: lacks the scale and capital-markets diversification of the money-center names, more exposed to a regional-bank-style funding scare.
PNC Financial (PNC). A top-10 super-regional bank, market capitalization near $100.2 billion.
- Bull: a disciplined underwriting culture and a track record of well-integrated, accretive acquisitions.
- Bear: proportionally more commercial real estate concentration risk than the money-center banks carry.
One internal link worth following for a different angle inside this same peer set: a Morgan Stanley deep dive works through the wealth-management-led model that Wells Fargo’s own Wealth and Investment Management segment is a much smaller-scale version of, and the contrast in scale and margin is instructive. A JPMorgan deep dive covers the money-center benchmark every name in this piece, Wells Fargo included, is ultimately measured against.
Risk controls
The honest risk paragraph, in order of how much it actually matters here. First, the net interest margin trend: three straight quarters of compression (2.67 percent to 2.60 percent to 2.47 percent) is the single biggest threat to the growth story, because net interest income is still worth more than half of revenue, and a margin that keeps sliding could mean the freed-up balance sheet is simply growing into a lower-margin business rather than growing the existing high-margin one bigger. Second, credit costs: provision for credit losses is up 22 percent year over year, and while commercial real estate’s criticized-loan share actually improved this quarter, an 11.1 percent criticized share on a $132.2 billion book remains elevated by historical standards, and Corporate and Investment Banking’s net charge-offs have already more than doubled year over year. Third, the capital cushion: the CET1 ratio has fallen from 11.09 percent to 10.29 percent in a single year as the bank redeploys freed capital into growth and $4.0 billion of first-quarter-alone buybacks, leaving less of a buffer heading into a turning credit cycle, even though the absolute level remains comfortably above the 8.50 percent regulatory floor. Fourth, the regulatory history itself: two of the most consequential constraints from the 2016 scandal era are gone, but the bank’s own filings note other legacy remediation obligations may still be working through completion, and any fresh compliance failure would draw outsized scrutiny given this specific company’s history. Fifth, valuation after a long run: the stock is up roughly 97 percent over both three and five years, and the sell-side’s own lowest price target sits essentially at today’s quote, meaning there is not a wide margin of safety priced in if the next few quarters disappoint.
What would change the read for the better: two consecutive quarters of net interest margin stabilization alongside continued improvement in the commercial-real-estate criticized-loan share, which together would suggest the credit-cycle-turn bear case is not materializing. What would change it for the worse: a second straight quarter of margin deterioration combined with accelerating, not merely rising, provision expense, or any new regulatory enforcement action.
Methodology, sourcing, and data-quality flags
This piece was built from parallel research streams (the business model and moat, growth drivers, the value-chain map, the SEC filings, market action and valuation, sentiment, the macro and micro economics, and a forward outlook), then run past an adversarial skeptic pass arguing the bear case and a compliance review of the disclaimers and framing. The source hierarchy, strongest first: primary filings (the FY2025 10-K filed February 24, 2026, and the Q1 2026 10-Q filed April 29, 2026, both read directly from SEC EDGAR and its structured XBRL data, never from a third-party summary) and Federal Reserve press releases; market-data vendors cross-checked against each other (Yahoo Finance and stockanalysis.com agreed on market cap to within half a percent and on trailing earnings per share to within a penny); and reputable trade press for the one forward-looking figure not found in a filing. Of 41 load-bearing claims recorded, all 41 are verified and none are disputed; the two genuine research gaps (insider and institutional ownership signal, and short interest) were left as honest gaps rather than filled with an estimate.
A note on the read itself, factor by factor, in plain terms rather than as scores. On valuation, the evidence reads fair, not cheap and not expensive: roughly 1.9 times tangible book and a forward price-to-earnings ratio near 12 are reasonable multiples for a bank earning a 14.5 percent return on tangible common equity, and the sell-side’s own low-end target sits essentially at the current quote, which argues against calling the stock a clear bargain. On growth, the read is genuinely positive: the asset-cap and governance-order removals are dated, sourced regulatory facts, not a hoped-for catalyst, and they are already showing up as double-digit commercial loan growth, tempered by the margin compression eating into the quality of that growth. On quality, the picture is mixed but improving: return on tangible common equity and the efficiency ratio both moved the right direction year over year, but the efficiency ratio still lags the strongest peers by a wide margin and the core net interest margin is degrading, not improving. On risk, the evidence is real and rising: credit costs are up 22 percent year over year, the commercial real estate book carries an elevated criticized share, and the capital cushion has thinned even as the bank keeps buying back stock, though the absolute capital level remains comfortably above regulatory minimums. On momentum, the read is mixed: strong three- and five-year returns sit against a roughly 10 percent pullback since January 2026, and the sell-side is directionally positive but meaningfully split on magnitude. Netting it out, a bank that has genuinely shed its two biggest structural constraints, already showing real growth, but trading at a fair rather than cheap multiple with real near-term margin and credit questions still open, and the lean lands at Hold. The read would move toward Buy on two consecutive quarters of margin stabilization alongside continued credit-quality improvement; it would move toward Sell on a second straight quarter of margin deterioration paired with accelerating provision expense, or any new regulatory action.
Data-quality flags:
- Point-in-time figures move fast. Every price, market cap, valuation multiple, capital ratio, and analyst target is stamped July 1-2, 2026 and will drift. The site renders a live price and market cap above this article; that live figure supersedes the $85.94 used in the text.
- The asset-cap and consent-order dates are precise and primary-sourced, but the scope of “the overhang” is not fully closed. The Fed’s own press release confirms the asset-growth restriction was lifted June 3, 2025; Wells Fargo’s own 10-Q confirms the board governance consent order was terminated March 5, 2026. The filing separately notes other legacy remediation obligations from the broader 2016-2018 era may still be working through completion; this piece does not claim every historical consent order is closed, only that these two, the most binding on growth and governance, are.
- The ~$50 billion FY2026 net interest income figure is a forecast, not a filed fact. It is management commentary reported by the trade press, attributed and dated, and should not be read as guidance filed with the SEC.
- Peer market caps are dated, approximate, single-day computations. Each peer’s market capitalization is a same-day share price multiplied by a recent (but not always same-day) cover-page share count; Wells Fargo’s own price and market cap in the frontmatter are held to a stricter same-instant standard.
- A precise, like-for-like peer total-return comparison over identical windows was not computed. The cross-name performance commentary in this piece is qualitative, not a sourced ranking table.
- Insider and institutional ownership signal, and short interest, were not independently sourced in this pass. Both are disclosed gaps rather than filled with an estimate; neither claim appears anywhere in this piece as fact.
- Scenarios are arithmetic, not forecasts. The bull, base, and bear dollar levels are illustrative arithmetic on stated tangible-book-growth and multiple assumptions. They are not price targets and not predictions.
Key sources: Wells Fargo & Company FY2025 10-K (SEC EDGAR accession 0000072971-26-000133) and Q1 2026 10-Q (accession 0000072971-26-000217); SEC XBRL company-concept data for net income, EPS, assets, equity, dividends, buybacks, and shares outstanding; the Federal Reserve’s June 3, 2025 press release on the asset-growth restriction and the Federal Reserve’s H.15 selected interest rates release; the Bureau of Labor Statistics for the US unemployment rate; stockanalysis.com and Yahoo Finance for market data, valuation multiples, and sell-side consensus; and PYMNTS for the reported CFO commentary on the FY2026 net interest income path. Figures are point-in-time as of July 1-2, 2026.
This article is OSINT research for educational purposes only and is not investment advice. I am not a financial advisor, and nothing here is a recommendation to buy, sell, or hold any security. Banks carry credit-cycle, rate, and regulatory risk that can move results faster than a typical company. Figures are point-in-time as of July 1, 2026 and will change. Do your own due diligence and consult a licensed financial advisor before making any decision.