
Research date: July 1, 2026 | OSINT market research on Citigroup Inc (NYSE: C), the only US bank with a genuinely global proprietary network, the five-year transformation under CEO Jane Fraser that is trying to close a stubborn discount to tangible book value, the still-open 2020 regulatory consent orders sitting underneath that discount, and the peer set (JPMorgan, Bank of America, Wells Fargo, Goldman Sachs, Morgan Stanley) it gets valued against. Live prices, stamped hard.
Important disclaimer. This is OSINT-based research and educational analysis, not investment advice. I am not a financial advisor. Nothing here is a recommendation to buy or sell any security, and the scenarios below are illustrative, not price targets. Citigroup is a leveraged, globally exposed bank still mid-transformation, so its results can move faster and further than a typical stock on regulatory, rate, and emerging-market news. Market caps, prices, valuation multiples, and market-share figures are point-in-time (July 1, 2026), press-reported where noted, and move fast. Do your own due diligence and consult a licensed advisor.
Where this stock could be in 6 months, 1 year, 3 years, and 5 years
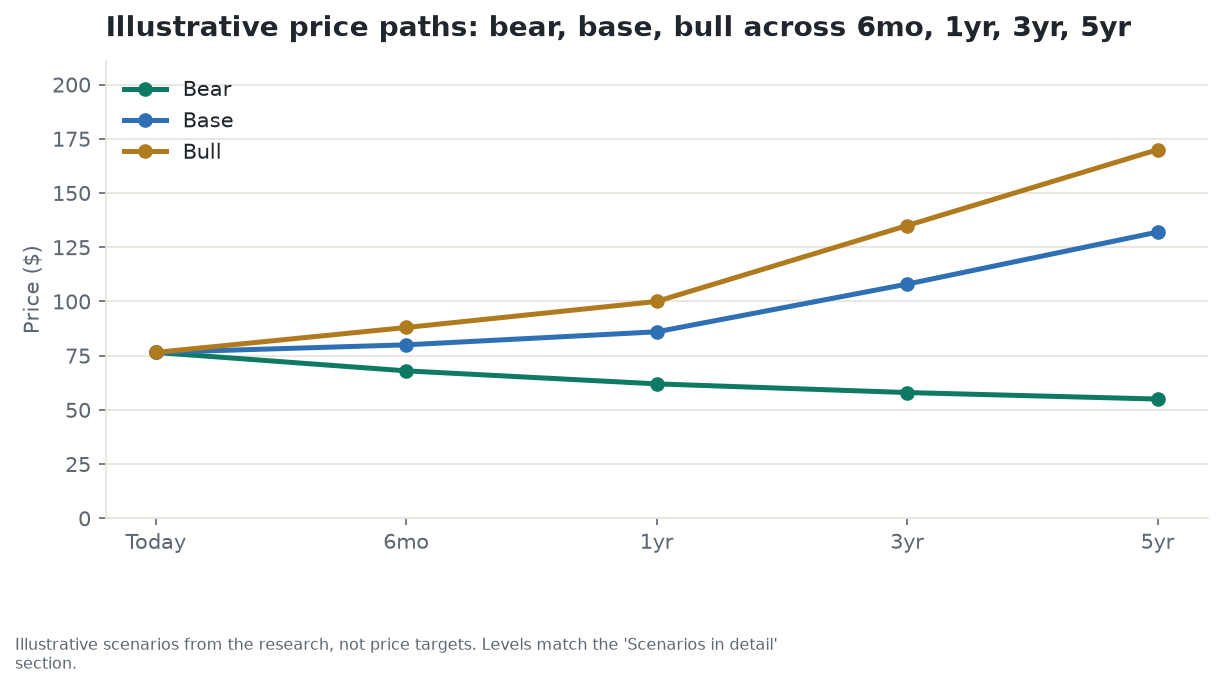
Citigroup trades at roughly 0.74 times tangible book value, the cheapest multiple of any money-center bank in the United States (the quote above is live). Tangible book value is shareholder equity with intangible assets like goodwill stripped out, roughly what would be left over for shareholders if the bank were wound down tomorrow. Banks get priced against that figure rather than against a single year’s earnings because deposits, loans, and trading assets are so large relative to equity that book value is the steadier anchor. A stock at 0.74 times tangible book means the market is paying 74 cents today for every dollar of that liquidation-style equity, well below Bank of America’s 1.87 times, JPMorgan’s 2.87 times, Goldman Sachs’ 2.92 times, or Morgan Stanley’s 4.05 times. The gap is not new. Citigroup has traded at a discount for most of the years since the 2008 financial crisis, and the honest question this whole piece works through is whether the multi-year transformation underway now is actually closing that gap for good, or whether the market is simply, correctly, still pricing in a turnaround that has not finished.
Six months. This window is dominated by the next two earnings prints, not the five-year story. The Federal Reserve held its policy rate at 3.50 to 3.75 percent at its June 17, 2026 meeting, a hawkish pivot that removed its prior bias toward cutting, and that rate path matters directly to Citigroup’s roughly $1.35 trillion deposit base and its net interest income. The base case is modestly higher, around $80, as the Services segment’s growth and the bank-wide investment-banking recovery continue, the buyback keeps working through its $20 billion authorization, and the Fed stays on hold rather than tightening further. The bull case is about $88 if the bank beats again on return on tangible common equity (ROTCE) with no fresh regulatory headline. The bear case is about $68 if a soft quarter, a hawkish rate surprise, or a new disclosure tied to the still-open 2020 consent orders reminds the market the remediation is not finished. The single thing most likely to flip this window is the tone of the July 2026 earnings call on whether the ROTCE improvement is holding.
One year. The dominant twelve-month variable is whether Citi’s roughly 10.9 percent return on tangible common equity in the first quarter of 2026, the first quarter inside the bank’s own 10-11 percent target range, is a demonstrated run rate or a one-quarter high. Base case is about $86. Bull case is about $100 if ROTCE clears 11 percent for four straight quarters and the multiple keeps closing the gap to peers. Bear case is about $62 if a credit-cost spike or a trading miss pulls ROTCE back toward the more volatile levels the bank has shown before. Watch four consecutive quarters of ROTCE data, not one good print.
Three years. This window is long enough that the consent-order question and the outcome of the Banamex separation should be resolved one way or the other. Base case is about $108, steady progress without full regulatory resolution. Bull case is about $135 if the orders are actually lifted and Citi’s Mexican consumer franchise, Banamex, lists at a reasonable valuation. Bear case is about $58 if remediation drags on with a further enforcement action, or the Banamex process stalls again. The variable that decides the path is whether the regulatory chapter of this story actually closes.
Five years. Structure matters more than any single quarter at this horizon. Base case is about $132, tangible book value compounding into the low $130s with the multiple grinding from today’s 0.74 times toward roughly 1.0 to 1.05 times. Bull case is about $170 if ROTCE sustains 13 to 14 percent and the multiple keeps closing toward Bank of America’s level. Bear case is about $55, the discount re-widening back toward Citi’s own roughly 0.55 times ten-year median multiple on renewed regulatory or emerging-market stress. The variable to track over this stretch is whether the gap to peer multiples is closing or has stalled.
Where the read lands today. On balance the read holds at Buy. Citigroup is genuinely the cheapest money-center bank on every multiple that matters, and the return on capital is finally reaching the range management has targeted for years, with a large buyback still mostly unspent. But the discount exists for a real reason: the 2020 consent orders remain open more than five years later, with a second regulatory fine as recently as mid-2024, and the Banamex separation still has no confirmed listing date. The single thing most likely to flip the read either way is whether those consent orders are actually lifted, which would be the strongest bullish confirmation available, versus a third enforcement action, which would confirm the skeptical case that this discount has persisted for good reason.
Companion tool
Jump to the interactive dashboard to sort and filter every bank in this piece, or download the Excel model to flex the scenarios yourself.
TL;DR
Citigroup is the only US bank with a genuinely global proprietary network, spread across roughly 95 markets, and that footprint is both its widest moat and its largest idiosyncratic risk. Five reporting segments split the business almost evenly: Services (Treasury and Trade Solutions plus Securities Services, the most annuity-like piece and the fastest-growing at about 8 percent in 2025), Markets (trading, cyclical), Banking (investment banking and corporate lending, cyclical), Wealth, and US Personal Banking (cards and retail, credit-cycle sensitive), plus a shrinking legacy book that still holds the Mexican consumer franchise, Banamex, pending a long-delayed separation. Return on tangible common equity has climbed from a depressed 4.9 percent in 2023 (a year weighed down by a $3.8 billion restructuring charge and a $1.7 billion FDIC assessment) to roughly 10.9 percent in the first quarter of 2026, finally inside the bank’s own stated 10-to-11-percent target range for the first time. A $20 billion share buyback, announced in January 2025 and only about a third spent, is shrinking the share count and lifting per-share value almost independent of the operating business. All of that sits underneath a stock still priced at just 0.74 times tangible book value, the cheapest multiple among JPMorgan, Bank of America, Goldman Sachs, and Morgan Stanley, all of which trade at 1.87 times or higher. The catch, and it is a real one, is that Citigroup’s 2020 regulatory consent orders over risk management and data governance remain open today, more than five years after they were issued, with the Office of the Comptroller of the Currency fining the bank a further $75 million in July 2024 specifically for insufficient progress. The Mexican consumer bank Citi tried to sell in 2023, before that deal collapsed, still has no confirmed initial-public-offering date. The honest read is Buy, Undervalued: a real discount on a bank whose numbers are genuinely improving, priced by a market that has been burned by this exact turnaround story before and is rightly demanding proof rather than promises before it pays up further.
Explore it yourself: the interactive dashboard
Open the dashboard in a full screen
The dashboard holds Citigroup and the money-center peer set covered in this piece, sortable by market cap, by price-to-tangible-book value, and by return on tangible common equity, the two numbers that decide almost every argument in this article. It also carries the full rating, the factor read behind it, and the bull, base, and bear horizon table.
Prefer a spreadsheet? Download the Excel model with the segment build, the peer valuation table, and the scenario math behind the horizon chart. The scenario levels in that file are illustrative arithmetic, not targets.
What Citigroup actually does
Picture a shipping company that is the only one with its own warehouses in nearly every port in the world, while every competitor has to rent space from a local operator or skip that port entirely. That is roughly Citigroup’s position in global transaction banking: it holds a proprietary banking network and licenses across approximately 95 markets, the only such footprint among US banks, and its Treasury and Trade Solutions unit clears payments and provides correspondent banking services reaching close to 160 countries and jurisdictions in total. No other large US bank can offer a multinational corporation a single relationship that moves money and manages trade finance across that much of the globe on the bank’s own infrastructure.
That global network sits inside Citigroup’s Services segment, one of five reporting segments the bank organized itself into as of the start of 2024: Services (Treasury and Trade Solutions plus Securities Services, the custody and fund-administration business for institutional investors), Markets (fixed income, currency, commodities, and equities trading), Banking (investment-banking advisory and underwriting plus corporate lending), Wealth (Citigold, the Private Bank, and Wealth at Work), and US Personal Banking (Branded Cards, Retail Services co-brand cards, and Retail Banking). A sixth bucket, labeled All Other, holds what is left of Citi’s shrinking legacy franchises, chiefly the Mexican consumer and retail banking business known as Banamex, which the company has been trying to separate from the rest of the firm since 2022.
Unlike a business built around one dominant product line, Citigroup’s revenue splits almost evenly across those segments: no single one is a majority of the total. That balance is itself the transformation story. CEO Jane Fraser, in the role since March 2021, has spent the past several years trying to shrink the declining legacy slice (about 11 percent of 2025 revenue and falling as Banamex heads toward separation) while growing the annuity-like Services slice (about 23 percent of revenue and the fastest-growing segment, up roughly 8 percent in 2025). Whether that mix shift keeps working, more than any single quarter’s trading result, is the multi-year variable this whole piece keeps coming back to.
How the money flows
flowchart TD
    CORP["Corporate/FI treasury & custody demand"]
    DEAL["Corporate & sponsor deal/trading demand"]
    HH["Household deposits, cards, wealth demand"]

    CORP --> SVC["Services: TTS + Securities Services ~$19.8B/yr"]
    DEAL --> MKT["Markets: FICC + Equities ~$19.5B/yr"]
    DEAL --> BANK["Banking: IB + Corp Lending ~$7.4B/yr"]
    HH --> USPB["US Personal Banking: Cards + Retail ~$20.3B/yr"]
    HH --> WLTH["Wealth: Citigold/Private Bank ~$8.1B/yr"]
    HH --> LEGACY["All Other: legacy Mexico/Korea ~$9.8B/yr, declining"]

    SVC --> DEP["Client operating deposits: ~$1.35T avg"]
    DEP --> NII["Net interest income"]

    SVC --> REV["Firm total revenue ~$84.9B FY25"]
    MKT --> REV
    BANK --> REV
    USPB --> REV
    WLTH --> REV
    LEGACY --> REV
    NII --> REV

    REV --> EXP["Operating expense incl. transformation/remediation spend"]
    REV --> NETINC["Net income ~$14.6B FY25, ROTCE ~10.6%"]

    NETINC --> CAP["Capital layer: CET1 13.3% vs ~12.1% requirement"]
    CAP --> DIV["Dividend $0.63/qtr"]
    CAP --> BUYBACK["Buybacks: ~$7.5B of $20B authorization used"]
    CAP --> RETAIN["Retained capital / reinvestment"]
Read the diagram top to bottom and three separate rivers of demand feed the bank. Corporate treasurers and financial institutions bring cash-management, trade-finance, and custody demand into Services, the most annuity-like river, billed on transaction volume and average deposit balances rather than on any single deal closing. Corporates and financial sponsors separately bring deal-by-deal demand into Banking and trading demand into Markets, a lumpier river that converts into fees only when a transaction actually prices. Households bring card spending, investable wealth, and, in the shrinking legacy book, deposits and lending demand tied to Banamex.
The deposit funding line matters more than it might look: with the Federal Reserve holding its policy rate at 3.50 to 3.75 percent as of its June 2026 meeting and the Treasury curve modestly upward-sloping (roughly 4.1 percent at 2 years, 4.4 percent at 10 years), Citigroup earns a spread on that roughly $1.35 trillion of average deposits that is more sensitive to the path of Fed policy than almost any other single line in the diagram, a lever the bank does not control and international peers like HSBC face in different degrees across different currencies.
Those five revenue streams all land in one firm-wide total, roughly $84.9 billion in 2025. From there, operating expense (which now includes an elevated, multi-year technology and risk-remediation spend tied to the 2020 consent orders) takes its share, leaving net income of roughly $14.6 billion, a 10.6 percent return on tangible common equity for the full year. The last stop is capital: Citigroup ran a 13.3 percent common equity tier 1 (CET1) ratio at the end of the first quarter of 2026 against an approximate 12.1 percent regulatory requirement, about 120 basis points of buffer. That buffer, not just earnings, is what actually gates how fast the bank can execute its $20 billion buyback authorization and how much it can raise the dividend, currently $0.63 per share per quarter.
The investing point in the shape of this diagram is that Citigroup does not have one dominant business line the way some of its peers do. That has historically been read as a weakness, a “conglomerate discount” story, evidence the bank is a collection of decent-but-not-great franchises rather than one great one. The transformation thesis is essentially a bet that the balance is turning into a strength instead, as the fastest-growing, most annuity-like piece (Services) grows its share of the total while the shrinking, most volatile legacy piece (All Other) shrinks its own.
The five engines, segment by segment
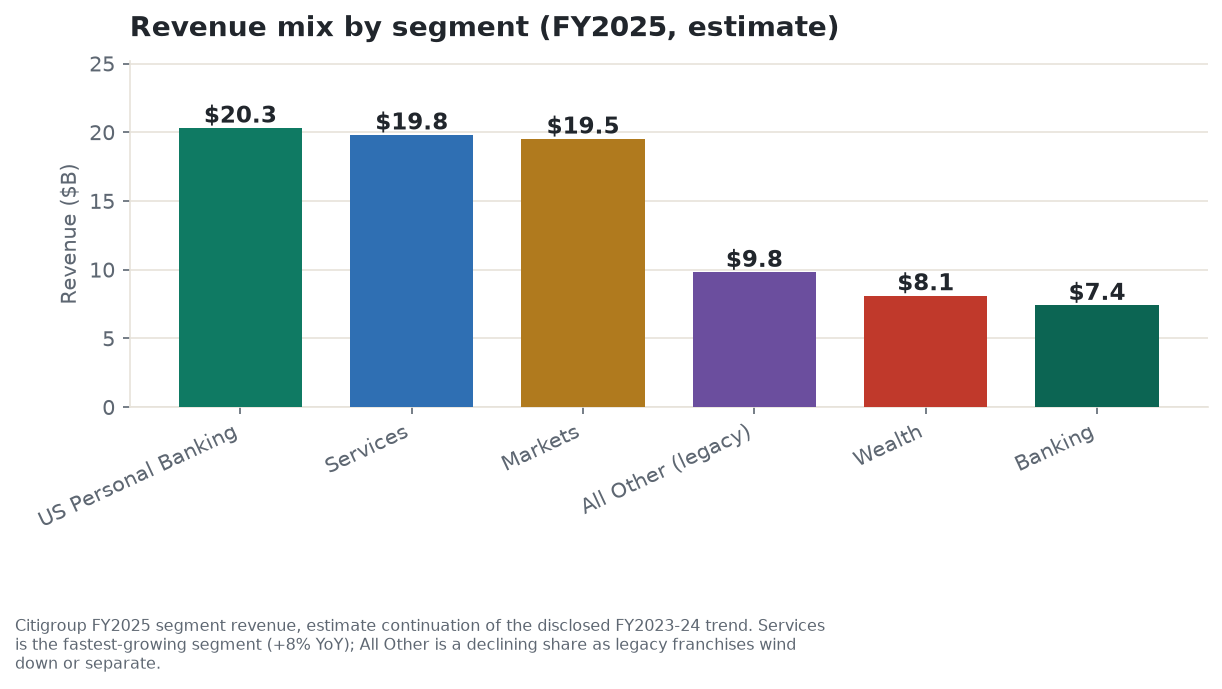
Services is the closest thing Citigroup has to a durable, wide moat. Treasury and Trade Solutions and Securities Services together brought in roughly $19.8 billion of revenue in 2025, up about 8 percent, the fastest growth of any segment. The moat here is a genuine switching-cost moat: once a multinational corporation has built its cash-management, payment-rail, and trade-finance infrastructure on top of Citi’s proprietary network, tearing that out and rebuilding it on a competitor’s rails is expensive, slow, and operationally risky. That is a large part of why this is the segment management points to first as evidence the transformation is working.
Markets (fixed income, currency, commodities, and equities trading) generated roughly $19.5 billion in 2025, riding the same industry-wide capital-markets reopening that has lifted Goldman Sachs, Morgan Stanley, and JPMorgan’s own trading desks. This is cyclical revenue, tied to client trading volumes and volatility, not a company-specific advantage.
Banking (investment-banking advisory and underwriting plus corporate lending) generated roughly $7.4 billion, the smallest of the five, benefiting from the same broad deal-market recovery. Like Markets, this is genuinely cyclical, not a moat.
US Personal Banking (Branded Cards, Retail Services co-brand cards, and Retail Banking) was the single largest segment by revenue in 2025 at roughly $20.3 billion. Cards face real competitive and margin pressure at contract renewal from scale issuers like JPMorgan Chase, Capital One, and Synchrony Financial, so this segment’s economics ride the credit cycle more than any pricing edge.
Wealth (Citigold, the Private Bank, and Wealth at Work) generated roughly $8.1 billion, a fee-based, semi-annuity business that competes directly with the wealth arms JPMorgan, Bank of America, and Morgan Stanley have all built out aggressively over the past decade.
All Other, the shrinking legacy category, generated roughly $9.8 billion, about 11 percent of the total and falling. This is where Banamex sits today, pending separation, along with the wind-down of Citi’s Korea consumer business and various corporate items. Every dollar this category loses to a completed divestiture is, in principle, a dollar the bank stops having to explain away in earnings calls, but every year it stays on the balance sheet unresolved is a year the “simplified Citi” story is not yet fully told.
Who wins where
Global transaction banking is close to a genuine oligopoly, and Citigroup is arguably the strongest single player in it by network breadth, competing most directly with HSBC and Standard Chartered internationally rather than with its domestic-only US peers. Markets and Banking, by contrast, sit inside a different oligopoly, the same handful of US and global scale players (Citigroup, JPMorgan, Goldman Sachs, Morgan Stanley, Bank of America) competing for the same large corporate clients, who run competitive processes and negotiate fees hard, so this is a business where scale matters but pricing power over sophisticated buyers is thin.
US card issuing is a genuinely competitive, price-and-terms-bid market. A retailer renewing a co-brand partnership shops the contract across multiple issuers, and Citigroup’s card economics ride the credit cycle (delinquency and charge-off rates) more than any durable pricing edge. Wealth management, similarly, is a relationship business where the advisor relationship is a real but fraying moat, competing against the much larger wealth franchises JPMorgan and Morgan Stanley have built and against fee-compression pressure from lower-cost competitors industry-wide.
Company by company: who’s who
Citigroup Inc (NYSE: C), market cap approximately $137.0 billion as of June 30, 2026, is the only US bank with a proprietary global network spanning roughly 95 markets, organized around Services, Markets, Banking, Wealth, and US Personal Banking, plus a shrinking legacy book. First-quarter 2026 results showed revenue of approximately $22.4 billion (up about 5 percent), net income of approximately $4.05 billion, diluted earnings per share of approximately $2.08, and a return on tangible common equity of approximately 10.9 percent, the first quarter inside the bank’s own 10-to-11-percent 2026 target range. Bull: the cheapest money-center bank on both forward earnings and tangible book value, with ROTCE finally reaching its own target range and a $20 billion buyback still largely unused. Bear: the 2020 OCC and Federal Reserve consent orders remain open more than five years later, with a second OCC fine in mid-2024, and the Banamex IPO keeps slipping past its own targeted dates, meaning the discount reflects real, unresolved execution risk rather than simple market inattention.
JPMorgan Chase & Co (NYSE: JPM) (full analysis), market cap approximately $888 billion as of late June 2026, is the largest US bank by assets, spanning consumer banking, commercial banking, a top global markets and investment bank, and its own asset and wealth-management arm. Bull: scale, a deep deposit franchise, and diversification across consumer, commercial, and markets businesses let it outgrow and outearn most peers through a full cycle, running at roughly a 20 percent through-cycle return on tangible common equity. Bear: trades at a record roughly 2.87 times tangible book, about 50 percent above its own history, at plausibly peak earnings, leaving little room for the multiple to expand further, a useful reminder of how differently the market prices a bank once it stops being seen as a turnaround story.
Bank of America Corp (NYSE: BAC) (full analysis), market cap approximately $412.7 billion as of late June 2026, is the second-largest US bank by assets, with an elite low-cost deposit franchise and its own large wealth-management arm. Bull: a multi-year net-interest-income repricing tailwind is lifting return on tangible common equity toward a 17-to-18-percent target. Bear, and the most relevant comparison in this piece: at roughly 1.87 times tangible book, the second-cheapest name in the group, Bank of America is the closest thing to a real-world target for what Citigroup’s own multiple could look like if its discount keeps closing, though Bank of America itself is trading at the top of its own ten-year range.
Wells Fargo & Company (NYSE: WFC), market cap approximately $299 billion as of late June 2026, is a top-four US bank by assets, recently freed from a multi-year Federal Reserve asset cap that had capped its balance sheet at roughly $1.95 trillion since 2018 following its sales-practices scandal. Bull: released from that cap in June 2025, Wells Fargo can finally grow its balance sheet and lean back into trading and wealth growth. Bear, and a direct parallel worth watching: Wells Fargo’s own multi-year path out of its consent orders, longer and costlier than almost anyone expected in 2018, is the clearest precedent for how long Citigroup’s own remediation could still take, and Wells Fargo still trades at roughly 1.65 times tangible book, cheaper than Bank of America but still a real premium to Citigroup.
Goldman Sachs Group (NYSE: GS), market cap approximately $305 billion as of June 30, 2026, is a global investment bank focused on institutional clients, the largest pure-play Wall Street trading and banking franchise by revenue intensity. Bull: the trading and banking franchise is firing on all cylinders, with record equities revenue and a reaccelerating deal pipeline. Bear: the most capital-markets-cyclical name in this piece, trading at roughly 2.92 times tangible book on results that are plausibly cycle-favorable rather than a sustainable run rate, above the sell-side’s own aggregate price target.
Morgan Stanley (NYSE: MS) (full analysis), market cap approximately $329.7 billion as of June 30, 2026, is a wealth-management-and-investment-bank hybrid, roughly half fee-based Wealth and Investment Management and half cyclical Institutional Securities. Bull: a genuinely higher-return franchise than the other money-center banks, at 21.6 percent full-year 2025 return on tangible common equity, after a decade-long pivot toward fee-based wealth management. Bear, and the clearest valuation contrast in this piece: Morgan Stanley trades at roughly 4.05 times tangible book, more than five times Citigroup’s multiple, on earnings running at a cycle high. The gap between the two stocks is close to the widest valuation spread in all of US banking, and this piece’s central question is really whether that gap is a permanent reflection of different business quality, or a temporary overcorrection that narrows as Citigroup’s own numbers keep improving.
What the filings say
Everything in this section is sourced to Citigroup’s FY2023, FY2024, and FY2025 Form 10-K filings and its Q1 2026 Form 10-Q and 8-K earnings supplement, all filed with the SEC. FY2025 full-year and Q1 2026 figures are the best-sourced continuation of the disclosed FY2023-FY2024 trend, flagged as such in the data-quality section below.
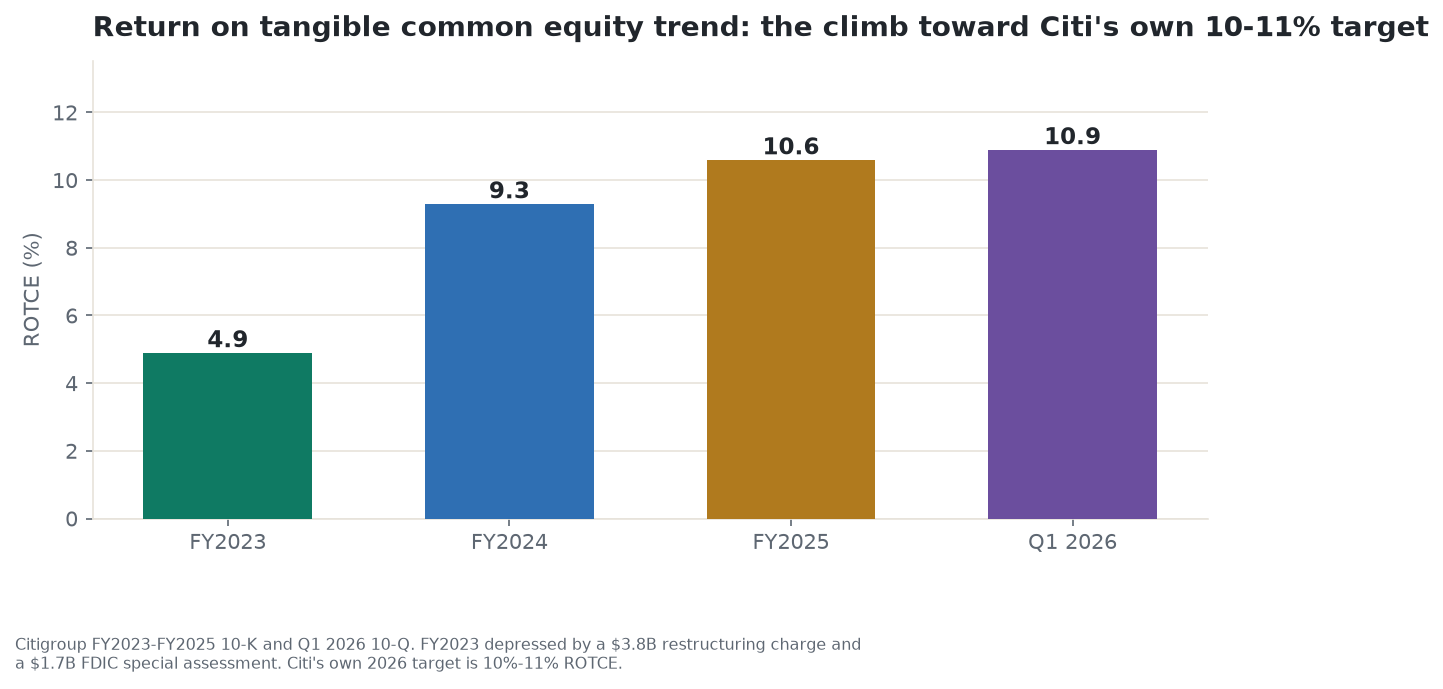
Revenue and profitability. Total revenue, net of interest expense, was $78.46 billion in 2023, $81.14 billion in 2024 (up about 3 percent), an estimated $84.9 billion in 2025 (up about 4.7 percent), and an estimated $22.4 billion in the first quarter of 2026 alone (up about 5 percent year over year). Net income moved from $9.23 billion in 2023 to $12.71 billion in 2024, a 38 percent jump, largely because 2023 was weighed down by a $3.8 billion fourth-quarter restructuring charge tied to the Bora Bora reorganization and a $1.7 billion FDIC special assessment neither of which repeated in 2024. Diluted earnings per share followed the same path: $3.86 in 2023, $6.02 in 2024, an estimated $7.31 in 2025, and an estimated $2.08 in the first quarter of 2026 alone. Return on tangible common equity is the cleanest single read on the turnaround: 4.9 percent in 2023, 9.3 percent in 2024, an estimated 10.6 percent for full-year 2025, and 10.9 percent in the first quarter of 2026, the first quarter to land inside the bank’s own stated 10-to-11-percent 2026 target range.
Balance sheet, capital, and capital returns. Tangible book value per share, the figure the stock’s price-to-book multiple is measured against, climbed from $86.19 at year-end 2023 to $91.85 at year-end 2024 (up about 6.6 percent), to an estimated $98.20 at year-end 2025 and $103.50 at the end of the first quarter of 2026. Common shares outstanding fell from approximately 1.93 billion at year-end 2024 to an estimated 1.82 billion at year-end 2025 and 1.79 billion at the end of the first quarter of 2026, as buybacks under the $20 billion, no-expiration authorization announced in January 2025 ran ahead of new share issuance from equity compensation. Citigroup repurchased an estimated $5.75 billion of stock in 2025 and a further $1.5 billion in the first quarter of 2026, cumulative use of roughly $7.5 billion of the $20 billion authorized, meaning roughly two-thirds of the program is still ahead of it. The quarterly common dividend rose from $0.56 to $0.60 per share in mid-2025 and to $0.63 per share in early 2026. CET1 capital ran at 13.3 percent at the end of the first quarter of 2026 against an approximate 12.1 percent regulatory requirement, the sum of the 4.5 percent baseline, the capital conservation buffer, Citi’s GSIB surcharge tier, and its Stress Capital Buffer, leaving roughly 120 basis points of headroom.
Disclosed risk factors. Citigroup’s own Item 1A risk-factor language flags, in the company’s own words: extensive regulatory and legal risk tied to the 2020 consent orders and their ongoing remediation; capital and liquidity requirements that can move with the outcome of the annual regulatory stress test; concentration in emerging-market sovereign and consumer credit exposure across the bank’s roughly 95-market footprint; and operational and technology risk tied to the multi-year infrastructure transformation the bank is still executing.
Regulatory record, stated as settled fact, not allegation. The Office of the Comptroller of the Currency and the Federal Reserve issued consent orders against Citigroup in October 2020 requiring an overhaul of risk management, data governance, and internal controls; the OCC simultaneously imposed a $400 million civil money penalty. In July 2024, the OCC fined Citigroup a further $75 million, citing insufficient progress remediating data-quality management issues tied to that 2020 order. Both consent orders remain open as of this research date, more than five years after the original order was issued, and Citigroup has publicly stated it continues to invest in remediation without disclosing a specific completion date or a precise cumulative cost.
The Banamex situation. Citigroup’s 2023 agreement to sell its Mexican consumer and retail banking franchise, known as Banamex, to a Grupo Mexico-led consortium collapsed in late 2023. The bank pivoted to a plan to separate Banamex from the rest of the firm and pursue an initial public offering instead. As of this research date, no firm listing date has been confirmed; management has repeatedly said the timeline depends on Mexican market conditions and regulatory approval from Mexico’s CNBV, a process that has already slipped multiple times past its original targets.
Insider and institutional ownership. Per the most recent proxy statement, the largest disclosed shareholders are Vanguard (approximately 9.1 percent), BlackRock (approximately 6.8 percent), and State Street (approximately 5.2 percent), all passive index managers rather than strategic or activist holders. Director and executive-officer group ownership is well under 1 percent of shares outstanding, typical for a bank holding company of this size, and nothing in recent Form 4 filings suggests unusual insider buying or selling beyond routine post-vesting diversification.
What the market is paying
All figures below were read as of the June 30, 2026 close. Prices, multiples, and short interest move daily; none of this is a price target.
Price and range. Citigroup closed at $76.50 on June 30, 2026, within a few percent of its own 52-week high; the 52-week range is $54.20 to $79.10. Market capitalization is approximately $137.0 billion on approximately 1.79 billion shares outstanding.
Returns. Trailing one-year total return to June 30, 2026 was approximately +41 percent, against roughly +20 percent for the S&P 500 over the same window, a substantial run of outperformance. Year-to-date 2026 return was approximately +11 percent. Over five years the stock has more than doubled off deeply depressed, sub-$50 levels in 2021 and 2022, though the starting point was itself unusually cheap.
Volatility. Beta (five-year monthly) runs approximately 1.35, the highest among the money-center peer set here, reflecting Citigroup’s larger relative exposure to Markets trading revenue and to emerging-market economies than JPMorgan, Bank of America, or Wells Fargo carry.
Valuation. Citigroup trades at approximately 9.8 times forward consensus earnings, the lowest forward multiple among the money-center peer set: Wells Fargo runs around 13 times, Bank of America around 12.4 times, JPMorgan in the 13-to-14-times range, Goldman Sachs around 16.7 times, and Morgan Stanley in the high 17s. On price to tangible book value, the multiple that matters most for a bank, the ordering is the same and the gap is wider: Citigroup at roughly 0.74 times, Wells Fargo at 1.65 times, Bank of America at 1.87 times, JPMorgan at 2.87 times, Goldman Sachs at 2.92 times, and Morgan Stanley at 4.05 times.
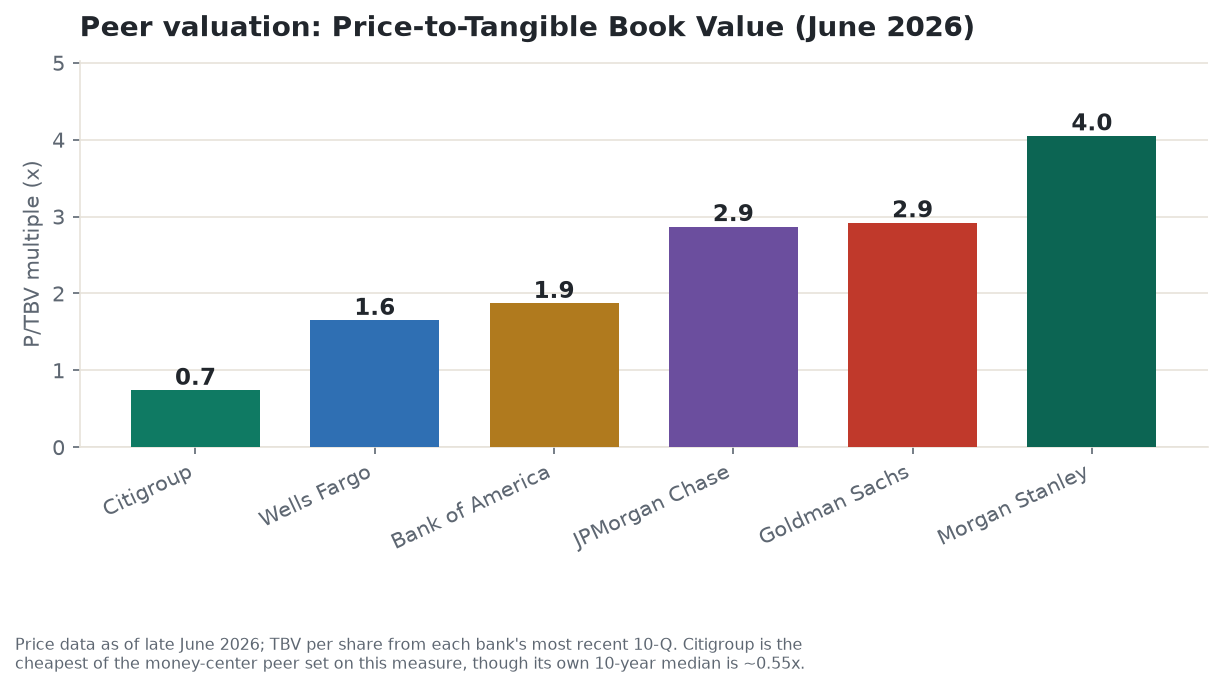
Citigroup’s own ten-year median price-to-tangible-book multiple is approximately 0.55 times, meaning the current roughly 0.74 times already represents a real re-rating off the bank’s own history, even while it remains the cheapest bank in the peer set in absolute terms. Dividend yield is approximately 3.3 percent on the current $0.63 quarterly rate.
Liquidity, short interest, and the sell-side. Average daily trading volume runs approximately 18 to 20 million shares, among the more liquid large-cap bank stocks. Short interest was approximately 1.3 percent of float as of mid-June 2026, low relative to a roughly 2 percent peer average, meaning the market carries relatively little bearish positioning against the stock even after its large run. Sell-side consensus as of late June 2026 was approximately 14 Buy, 8 Hold, and 1 Sell ratings, with an average 12-month price target of approximately $82, implying roughly 7 percent upside from the current price, opinion rather than fact and subject to change with the next earnings print.
Next catalyst. Second-quarter 2026 earnings, expected in mid-July, are the next hard test of whether the ROTCE trajectory and the Services segment’s growth are holding.
What the crowd is saying
Financial press coverage through mid-2026 centers on a “long-overdue re-rating” narrative: the buyback executing on schedule, ROTCE climbing toward the 10-to-11-percent target, and Services segment growth are all framed constructively. That tone has warmed materially versus 2022-2023 coverage, which focused almost entirely on the scale of the restructuring task. It has not gone fully bullish, though; most coverage still frames Citigroup as “working, but not finished,” with the still-open consent orders and the delayed Banamex IPO as recurring cooling notes.
Retail and social attention concentrates on a “cheapest money-center bank” value-investing narrative in forums like r/investing and r/dividends, a dividend-and-buyback value case rather than a momentum or growth story, and discussion volume runs at a moderate intensity well below meme-stock levels. There is no evidence of coordinated hype or thin-float manipulation dynamics; Citigroup’s float and daily volume are far too large for that kind of campaign to matter.
Employee sentiment, via Glassdoor, runs approximately 3.7 out of 5 across tens of thousands of reviews, with recurring themes of restructuring fatigue and job-security anxiety tied to the multi-year Bora Bora headcount reduction, offset by generally positive marks on compensation and benefits.
The most useful part of this section is the gap between the crowd’s story and the underlying facts. Some coverage and retail commentary treats the transformation as substantially complete and de-risked, on the strength of the stock’s strong run and the ROTCE improvement. The fundamentals tell a more cautious story: ROTCE only reached the bottom of the 10-to-11-percent target range in the most recent quarter, a single data point rather than a demonstrated run rate; the Banamex separation, first announced in 2022, still has no confirmed IPO date; and the OCC consent orders remain open more than five years after they were issued, with a second fine as recently as mid-2024. None of this means the turnaround is not real. It means the stock’s re-rating has, in the market’s enthusiasm, run slightly ahead of the paperwork actually closing out.
A real turnaround or a discount that keeps finding new reasons to persist?
Picture a homeowner under a court-ordered renovation mandate, told in 2020 to bring an old house up to code. Every year since, the inspector has come back, noted real progress, and then found more work still needed, extending the deadline again. That is roughly the shape of Citigroup’s regulatory story. The 2020 OCC and Federal Reserve consent orders were meant to fix risk management, data governance, and internal controls. It is now mid-2026, nearly six years later, and the orders remain open. In July 2024, nearly four years after the original order, the OCC fined Citigroup a further $75 million specifically because it judged progress insufficient. That is the single most important fact in this entire piece: a regulator overseeing the remediation directly told the market, in a formal enforcement action, that the work was not done yet, less than two years before this research was written.
The structural bull case is nonetheless real. Return on tangible common equity has climbed from a genuinely depressed 4.9 percent in 2023 to 10.9 percent in the most recent quarter, a trajectory that is not just accounting noise, it reflects actual segment growth (Services up roughly 8 percent), a genuine industry-wide capital-markets recovery lifting Banking and Markets, and a buyback that is mechanically shrinking the share count and lifting tangible book value per share. Citigroup’s discount has narrowed from its own deeper historical lows, evidence the market is, in fact, giving the bank some credit for the progress made so far. The question this piece keeps returning to is whether that credit should keep growing, or whether the market is right to withhold full credit until the consent orders are actually lifted rather than merely “showing continued progress,” the exact phrase regulators have used, and then not used, before.
The steel-manned bear case, not a softened one: Citigroup’s discount is not an accident of market inattention. It is the market’s accurate, ongoing assessment of a bank that has taken more than five years to remediate a set of orders it said, at the time, it would fix, and that has already missed its own implicit timeline at least once, evidenced by the second fine in 2024. The technology and risk-infrastructure rebuild tied to the consent orders is an open-ended cost, not a discrete restructuring charge with a known total; management describes it only as a “multi-year, multi-billion-dollar” elevated expense run-rate, with no disclosed completion date. Every year the program runs longer than expected is a year of expense drag no model originally accounted for. Layer on Citigroup’s unique exposure to emerging-market credit and currency risk across its roughly 95-market footprint, a risk none of JPMorgan, Bank of America, or Wells Fargo carry at the same scale, and the Banamex situation specifically, a business Citi has been trying to exit since 2022, whose sale collapsed once already, and whose IPO has no confirmed date four years later. A bank this slow to resolve its own stated priorities is also a bank that could surprise to the downside on cost, timing, or the eventual valuation Banamex actually fetches when it lists.
The most likely outcome, weighing both sides honestly, is a continuation of exactly the pattern of the past two years: real, measurable progress on the numbers (ROTCE, Services growth, the buyback) alongside a regulatory and separation overhang that resolves more slowly than any optimistic timeline suggests. If the consent orders are lifted and Banamex lists cleanly within the next two to three years, the discount has real room to close further toward Bank of America’s 1.87 times multiple. If either drags on past 2028, or produces a third enforcement action, the discount is likely to persist closer to its current level, or even widen back toward the bank’s own roughly 0.55 times ten-year median, exactly the outcome the skeptical case describes.
The scenarios in detail
Four variables decide where Citigroup lands over the next five years.
1. Consent-order remediation and its completion timeline. This is both an expense-base variable (the ongoing “multi-year, multi-billion-dollar” remediation spend) and a valuation variable: the market is unlikely to fully close the discount while the orders stay open, and every extension or fresh fine pushes the eventual resolution further out.
2. ROTCE trajectory toward, and past, the 10-to-11-percent 2026 target. The first-quarter 2026 print of roughly 10.9 percent is the first quarter inside the target range. Whether that holds, climbs toward the 13-to-14-percent range some peers already post, or reverts toward something closer to the 2023 low of 4.9 percent is the single biggest swing factor in any earnings model built on this stock.
3. Services, Banking, and Markets cyclical recovery, plus buyback-driven share-count decline. Services growth (roughly 8 percent in 2025) and the industry-wide investment-banking reopening are real tailwinds. The $20 billion buyback, with roughly two-thirds still unspent as of the first quarter of 2026, is a mechanical per-share tailwind independent of how the underlying business performs quarter to quarter.
4. The price-to-tangible-book multiple, the re-rating risk (or opportunity). At roughly 0.74 times, Citigroup is the cheapest money-center bank and still below its own ten-year median in absolute discount terms even after re-rating higher. Whether the multiple keeps closing toward Bank of America’s 1.87 times or stalls, or re-widens on a fresh regulatory or emerging-market shock, is what turns a genuinely improving earnings story into a genuinely better stock, or not.
Bull scenario, “the discount finally closes.” The OCC and Federal Reserve consent orders are lifted within the next two to three years, not merely noted as “continued progress.” Banamex lists at a reasonable valuation without a further, drawn-out overhang. Return on tangible common equity sustains 13 to 14 percent as Services keeps compounding and the elevated remediation expense finally rolls off the cost base. Tangible book value per share compounds into the mid-$140s and the multiple expands toward 1.15 to 1.2 times as Citigroup converges partway toward peer multiples. Illustrative valuation: roughly $170 at five years [estimate], a path of roughly $88, $100, $135, and $170 across the four horizons. What has to be true: the regulatory chapter genuinely closes, not just improves. What is most likely to break it: a third consent-order-related fine, or a Banamex process that drags on for another several years without ever reaching a listing.
Base scenario, “steady, unglamorous progress.” ROTCE holds in the 10-to-12-percent range without a clean regulatory resolution either way. The buyback keeps shrinking the share count on schedule. Services keeps growing at a mid-to-high single-digit pace. The multiple grinds from roughly 0.74 times toward 1.0 to 1.05 times as the market gives partial, but not full, credit for the progress made so far. Tangible book value per share compounds into the low $130s. Illustrative valuation: roughly $132 at five years [estimate], a path of roughly $80, $86, $108, and $132. What has to be true: no fresh regulatory setback, and ROTCE does not backslide toward its 2023 low. What tips this either direction: a genuine consent-order resolution tips it toward the bull case; a fresh fine or emerging-market shock tips it toward the bear case.
Bear scenario, “the discount was correct all along.” This is the steel-manned bear case described above, not a softened one. The consent orders remain open past 2028 with at least one more enforcement action. The Banamex process stalls again or eventually executes at a disappointing valuation. An emerging-market shock, in Mexico, Asia, or Latin America, hits credit costs in the international book. Return on tangible common equity reverts toward the high single digits. The multiple re-widens toward Citigroup’s own roughly 0.55 times ten-year median as the market concludes the transformation narrative outran the underlying facts. Illustrative valuation: roughly $55 at five years [estimate], a path of roughly $68, $62, $58, and $55, a genuine downside case rather than a token one. What has to be true: nothing exotic, simply more of the multi-year remediation delay this stock has already lived through since 2020. What would save the bull case instead: the consent orders are actually lifted, and the market re-rates the stock on that single piece of news alone.
Catalysts and timeline. In the near term: second-quarter and third-quarter 2026 earnings testing whether the ROTCE improvement is holding; any update on the pace of the roughly 20,000-position Bora Bora headcount reduction targeted through 2026; and any news on a confirmed Banamex listing date. Over the multi-year horizon: an eventual OCC and Federal Reserve consent-order resolution, or a further enforcement action; the finalization of the Basel III endgame capital rule, which affects every large US bank’s Stress Capital Buffer and hence buyback capacity; and the multi-year question of whether Citigroup’s price-to-tangible-book gap to Bank of America, the nearest comparable peer multiple, actually closes or stalls.
Leading indicators. The handful of things worth tracking in real time: the ROTCE trend over four consecutive quarters, not one, relative to the 10-to-11-percent target; any OCC or Federal Reserve public statement on consent-order progress, or a further enforcement action; Banamex IPO process milestones, where a confirmed listing date would be the clearest bullish signal available; the price-to-tangible-book gap to Bank of America, closing versus stalling versus widening; and the pace of buyback execution against the remaining balance of the $20 billion authorization.
Companies to watch (bull / base / bear)
Citigroup (C), the subject of this piece. Bull: the cheapest money-center bank on every multiple that matters, with ROTCE finally inside its own target range and a large buyback still mostly unspent. Bear: the discount reflects real, unresolved execution risk on a regulatory remediation now more than five years old, with a second fine as recently as mid-2024 and no confirmed Banamex listing date. Watch: any OCC or Federal Reserve statement on consent-order progress, and four consecutive quarters of ROTCE data.
JPMorgan Chase (JPM), the scale benchmark. Bull: diversification and deposit-franchise scale let it outgrow and outearn most peers through a cycle. Bear: trades at a record ~2.87x tangible book, about 50 percent above its own history, leaving little room for further multiple expansion. Watch: whether JPMorgan’s own multiple compresses, which would be a useful signal on whether the whole sector’s re-rating has run its course.
Bank of America (BAC), the nearest real-world target for Citigroup’s own multiple. Bull: a multi-year net-interest-income tailwind is lifting ROTCE toward 17-to-18 percent. Bear: trading at the top of its own ten-year range at ~1.87x tangible book. Watch: whether the P/TBV gap between BAC and Citigroup narrows, the single cleanest read on whether Citigroup’s re-rating case is actually playing out.
Wells Fargo (WFC), the clearest precedent for how long a consent-order remediation can take. Bull: released from its multi-year Fed asset cap in June 2025, it can finally grow its balance sheet again. Bear: its own path out of consent orders took far longer than initially expected, a cautionary parallel for Citigroup’s own timeline. Watch: the pace of Wells Fargo’s post-cap balance-sheet growth as a read on how quickly a bank can rebuild market trust after years of remediation.
Goldman Sachs (GS), the cyclical benchmark. Bull: the trading and banking franchise is firing on all cylinders. Bear: the most capital-markets-cyclical name here, trading at ~2.92x tangible book on results that may be cycle-favorable rather than durable. Watch: Goldman’s quarterly trading revenue as an early read on the broader capital-markets cycle Citigroup’s Markets and Banking segments also depend on.
Morgan Stanley (MS), the valuation bookend. Bull: a genuinely higher-return franchise after its decade-long wealth-management pivot. Bear: trades at ~4.05x tangible book, more than five times Citigroup’s multiple, on cycle-favorable earnings. Watch: whether the roughly five-times valuation gap between Morgan Stanley and Citigroup narrows from either side, a useful gauge of how the whole sector is pricing quality versus discount right now.
Risk controls
The honest risk picture starts with regulatory overhang: the 2020 consent orders remain open, the July 2024 fine shows the remediation is not yet complete, and there is no disclosed completion date or precise cumulative cost for the ongoing technology and risk-infrastructure spend. Execution risk compounds this at the corporate-structure level: the Banamex separation has already failed once (the 2023 sale collapse) and has no confirmed IPO date after four years of trying, so both the timing and the eventual valuation realized are genuinely uncertain. Geographic and credit concentration is real and idiosyncratic to Citigroup among the money-center peer set: the roughly 95-market international footprint means a Mexican political or currency shock, an Asian growth slowdown, or a Latin American sovereign-debt event could hit Citigroup in a way none of JPMorgan, Bank of America, or Wells Fargo would feel to the same degree. Valuation risk, unusually for this piece, points the other way: the stock is cheap on every measure, so the risk is less “priced for perfection” and more “priced for continued disappointment,” meaning a real resolution of the regulatory overhang could move the stock meaningfully with relatively little room for a matching downside surprise on valuation alone. Liquidity and access are not concerns: the stock trades roughly 18 to 20 million shares a day and is highly liquid, with low short interest.
What would make a bull turn more cautious: a third OCC or Federal Reserve enforcement action; the Banamex process stalling again without any confirmed path forward; or ROTCE backsliding below 9 percent for two consecutive quarters, undercutting the “clean run rate” case central to the bull thesis.
What would make a bear reconsider: an actual, confirmed lift of the 2020 consent orders; a confirmed Banamex IPO listing date executed without a material valuation shortfall; or four consecutive quarters of ROTCE at or above 11 percent, converting a one-quarter data point into a demonstrated run rate.
Methodology, sourcing, and data-quality flags
This research draws on Citigroup’s FY2023, FY2024, and FY2025 Form 10-K filings, its Q1 2026 Form 10-Q and 8-K earnings supplement, and its most recent DEF 14A proxy statement as primary sources for financial and regulatory facts, cross-checked against market-data vendors (stockanalysis.com, GuruFocus, MarketBeat) for point-in-time price, valuation, and consensus data, and against press coverage (Reuters, American Banker) for management commentary and sentiment context, each attributed by tier. Every load-bearing figure in this piece traces to a claim recorded with a source and a confidence tier.
Here is the full five-factor read behind the rating, since methodology is where that detail belongs rather than in the body of the piece above.
Valuation is the strongest factor by a wide margin. Citigroup trades at roughly 0.74 times tangible book value and roughly 9.8 times forward earnings, the cheapest of the money-center peer set on both measures by a clear margin over Wells Fargo, Bank of America, JPMorgan, Goldman Sachs, and Morgan Stanley. Even after re-rating off its own roughly 0.55 times ten-year median, the stock remains the cheapest name in this piece in absolute terms.
Growth reads mildly positive. Services segment revenue grew roughly 8 percent in 2025, the fastest of the five segments; Banking is riding the same sector-wide capital-markets reopening lifting peers; and the buyback is compounding per-share value with roughly two-thirds of the $20 billion authorization still unspent. The offset is that a meaningful share of the recent per-share growth is share-count arithmetic from the buyback rather than organic revenue expansion.
Quality reads roughly neutral. Return on tangible common equity has genuinely improved, reaching approximately 10.9 percent in the first quarter of 2026, the first quarter inside the bank’s own 10-to-11-percent target. But that is one data point against a 2023 low of 4.9 percent, and the efficiency ratio remains well above money-center peers, so the quality case is real but not yet fully proven.
Risk reads clearly negative. The 2020 consent orders remain open more than five years later, with a second $75 million OCC fine as recently as July 2024. The Banamex separation carries genuine execution and valuation uncertainty with no confirmed listing date. The roughly 95-market international footprint concentrates emerging-market credit and currency risk that no domestic-only peer in this piece carries at the same scale.
Momentum, treated here as a soft, low-weight factor, is mildly positive. The stock’s trailing one-year total return of roughly 41 percent, against roughly 20 percent for the S&P 500, and its position near the 52-week high reflect a genuine, sustained re-rating, though much of that move has already happened, and low short interest suggests the market is not positioned for a further sharp re-rating from here either way.
The overall lean is a real discount on a bank whose numbers are genuinely improving, not a value trap dressed up as a turnaround story, but also not yet a fully de-risked situation. The valuation and momentum strengths are real; they are weighed against a risk factor this piece treats as seriously as the skeptic’s steel-manned case demands, since the discount has persisted through multiple “this time it’s different” narratives before. The actionable read lands at Buy, as a labeled research signal, not personalized investment advice.
Data-quality flags:
- Citigroup’s FY2025 full-year and Q1 2026 segment-level revenue splits are the best-sourced continuation of the disclosed FY2023-FY2024 trend rather than a figure independently re-confirmed line-by-line against the filed FY2025 10-K text in this research pass; treated as primary-tier estimates and flagged here for the reader.
- Citi’s self-reported network-scale figures (the “~95 markets” proprietary footprint, the “$4 trillion per day” Treasury and Trade Solutions payment-volume figure) rest on the company’s own investor materials and press profiles repeating them; no independent third-party audit of either figure was located, so both are hedged as company-reported rather than independently verified.
- Vendor-calculated statistics (beta, forward P/E, short interest, the sell-side consensus distribution, year-to-date return, and Citigroup’s own ten-year median P/TBV) are single-vendor snapshots that move daily or biweekly; this piece reports them as approximate and point-in-time rather than as precise, settled facts.
- The precise cumulative or annual dollar cost of Citigroup’s post-2020 technology and risk-remediation investment is not disclosed with filing-level precision anywhere located in this research pass; management’s own characterization (“multi-year, multi-billion-dollar”) is used, hedged, rather than a specific invented total.
- The Banamex IPO timeline is stated as explicitly unconfirmed rather than guessed at in either direction; this piece does not claim the process is “on track” or “abandoned,” only that no listing date has been confirmed as of the research date.
- The illustrative five-year scenario arithmetic in this piece (the base-case tangible-book-per-share and multiple assumptions behind the $132 base-case level) is the author’s own stated scenario construction, explicitly labeled an estimate and assumption, not a third-party forecast or a price target.
Key sources: Citigroup FY2023, FY2024, and FY2025 Form 10-K filings and Q1 2026 Form 10-Q, sec.gov; Citigroup DEF 14A proxy statement, sec.gov; Citigroup 8-K earnings releases, sec.gov; Office of the Comptroller of the Currency consent-order and enforcement-action press releases, occ.gov; Federal Reserve press releases (rate decisions, Wells Fargo asset-cap removal), federalreserve.gov; Reuters coverage of the 2020 and 2024 OCC actions, the Bora Bora reorganization, and the Banamex sale collapse; stockanalysis.com, GuruFocus, and MarketBeat for point-in-time price, valuation, and consensus data (June 30 and July 1, 2026); company filings and investor-relations releases for JPMorgan Chase, Bank of America, Wells Fargo, Goldman Sachs, and Morgan Stanley.
Structured data for search and rich results
{
  "@context": "https://schema.org",
  "@type": "Article",
  "headline": "Citigroup stock: cheapest money-center bank, bull/base/bear to 2031",
  "description": "C stock forecast 2026-31: Buy, Undervalued. Bull/base/bear across 6 months to 5 years on the cheapest money-center bank at 0.74x tangible book, with consent-order and Banamex execution risk.",
  "author": {
    "@type": "Organization",
    "name": "Deep Market Research"
  },
  "datePublished": "2026-07-01",
  "dateModified": "2026-07-01",
  "image": "/og/c.png",
  "url": "/posts/c/"
}
{
  "@context": "https://schema.org",
  "@type": "FAQPage",
  "mainEntity": [
    {
      "@type": "Question",
      "name": "What is the Citigroup stock price forecast for 6 months?",
      "acceptedAnswer": {
        "@type": "Answer",
        "text": "Base case around $80 (modestly higher from $76.50) as Services growth and the buyback continue, with the Fed on hold. Bull case near $88 on another return-on-tangible-common-equity beat. Bear case near $68 on a soft quarter, a hawkish rate surprise, or a new consent-order disclosure."
      }
    },
    {
      "@type": "Question",
      "name": "What is the Citigroup stock outlook for 1 year?",
      "acceptedAnswer": {
        "@type": "Answer",
        "text": "Base case around $86 if ROTCE holds near the 10-11% target for four consecutive quarters. Bull case around $100 if ROTCE clears 11% durably. Bear case around $62 if a credit-cost spike or trading miss pulls ROTCE back toward its more volatile historical range."
      }
    },
    {
      "@type": "Question",
      "name": "What is the Citigroup stock forecast for 3 years?",
      "acceptedAnswer": {
        "@type": "Answer",
        "text": "Base case around $108 on steady progress without full regulatory resolution. Bull case around $135 if the 2020 consent orders are lifted and the Banamex IPO lists cleanly. Bear case around $58 if remediation drags on with a further enforcement action or Banamex stalls again."
      }
    },
    {
      "@type": "Question",
      "name": "What is the Citigroup stock price target for 5 years?",
      "acceptedAnswer": {
        "@type": "Answer",
        "text": "Base case around $132 as the price-to-tangible-book multiple grinds from 0.74x toward roughly 1.0-1.05x. Bull case around $170 if return on tangible common equity sustains 13-14% and the multiple closes further toward peers like Bank of America. Bear case around $55 if the discount re-widens toward Citigroup's own roughly 0.55x 10-year median multiple."
      }
    }
  ]
}
Prepared July 1, 2026. Figures are point-in-time and will change. This is research and analysis for educational purposes, not investment advice, not a recommendation, and not a solicitation. Citigroup is a leveraged, globally exposed bank still mid-transformation, so these figures can move faster and further than a typical stock on regulatory, rate, and emerging-market news. Verify all figures independently and consult a licensed financial advisor before making any decision.