
Research date: June 29, 2026 | OSINT research on Bank of America Corporation (NYSE: BAC), how the second-largest US bank turns a $2 trillion deposit base into net interest income, fees, and trading profit, the bond-book overhang and credit questions sitting under the franchise, and the money-center and super-regional peers it is measured against. Live prices, stamped hard.
Important disclaimer. This is OSINT (open-source intelligence) research published for educational and informational purposes only. It is not investment advice, not a recommendation to buy, sell, or hold any security, and not a solicitation. I am not a financial advisor. Banks are leveraged plays on the credit cycle, the rate path, and regulation, so the figures here can move faster and further than a typical stock when the cycle turns. All figures are point-in-time as of the stated research date (June 29, 2026) and move fast: prices, market caps, share counts, capital ratios, and bond marks will be stale by the time you read this. Any bull, base, or bear scenarios are illustrative arithmetic on stated assumptions, not price targets. Do your own due diligence and consult a licensed financial advisor before making any decision.
Where this stock could be in 6 months, 1 year, 3 years, and 5 years
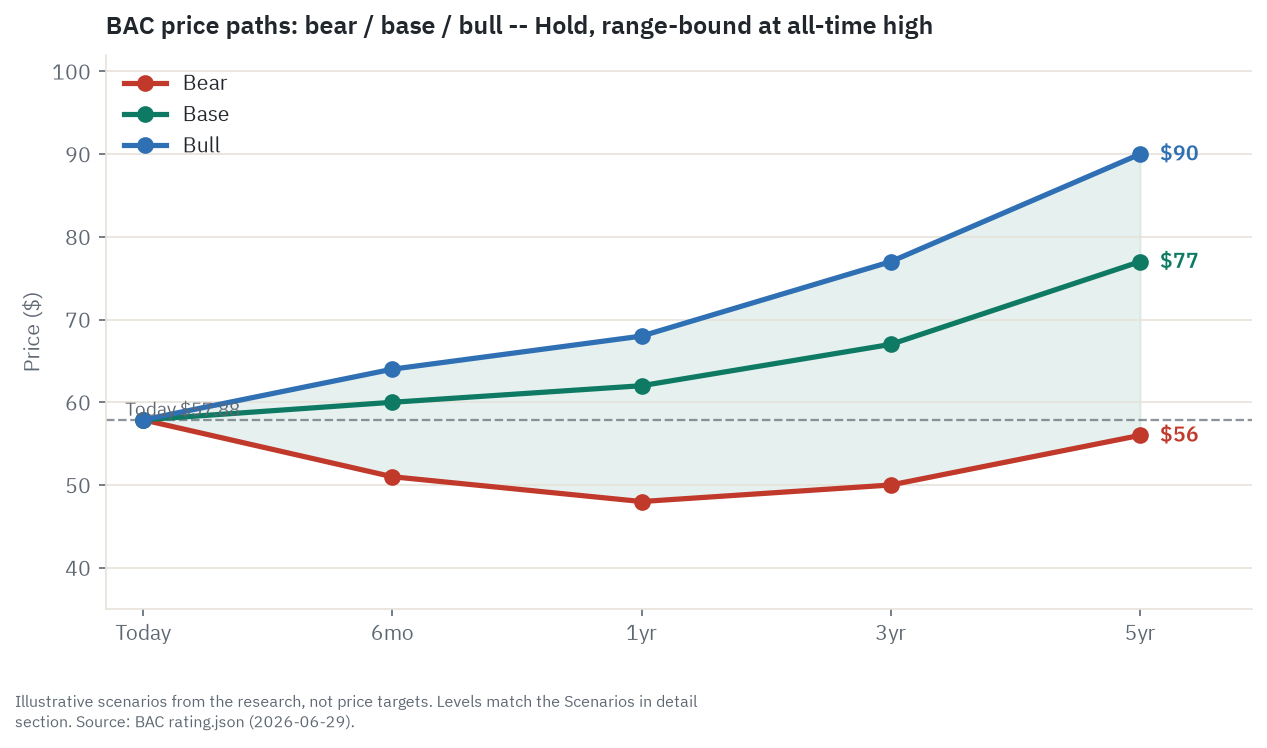
Bank of America closed at $57.88 on June 29, 2026, a market cap near $412.7 billion across roughly 7.13 billion diluted shares, which works out to about 2.0 times its tangible book value of $28.84 a share. Tangible book value is the bank’s hard net worth per share, its common equity after goodwill and other intangibles are stripped out, the equity that actually absorbs losses, and price to tangible book is the multiple that matters most for a bank because a bank’s assets are mostly financial instruments marked close to cash value rather than hard-to-value factories or brands. That one multiple is the whole debate. The franchise is genuinely good and genuinely improving, but the price already pays for the improvement, and 2.0 times tangible book is the top of where this bank has traded in a decade, reached at an all-time high. Everything below is the story of whether that price is paying for quality that compounds or for a moment in the cycle that does not. Every dollar level here is an estimate built on stated assumptions, not a price target.
Six months. This window is about datable events, not the long story. The Q2 print in mid-July is the first test of whether net interest income is tracking the upper half of the raised full-year guide. The Fed meets in September with a hawkish set of projections, and the first hard reads on the commercial-real-estate maturity wall start landing in the third and fourth quarters. The base case is a modest grind higher to about $60 as tangible book accretes and the multiple holds near 2.0 times. The bull case is about $64 if a rate hike lands, credit stays benign, and the stock breaks its 52-week high. The bear case is about $51 if office and commercial-real-estate losses start to crystallize and a recession scare compresses the multiple toward 1.75 times. The single thing most likely to flip the read here is whether the second-half office defaults force a visible reserve build.
One year. Over twelve months the controlling variables are net interest income delivery against the plus 6 to 8 percent guide, the trajectory of deposit costs, and whether credit normalizes quietly or the cycle turns. The base case is about $62, just under the sell-side mean target, with the guide delivered, return on tangible common equity holding near 16 percent, and the multiple slipping a touch as the inflection becomes the run rate. The bull case is about $68, inside the high-target band the street already publishes, if returns push toward 17 to 18 percent and buybacks keep shrinking the share count. The bear case is about $48, the start of the recession double hit, where the Fed cuts, net interest income decelerates toward flat, provisions build off the office wall, and the multiple reverts toward 1.6 times. The flip here is the September Fed meeting and whether the curve forces cuts.
Three years. Now the structural drivers start to dominate the cycle. The questions are whether the bond-repricing runway keeps lifting net interest income, whether return on tangible common equity settles in the mid-teens or reverts, and how much capital relief the final Basel rule delivers. The base case is about $67, on roughly 7 percent annual tangible-book compounding at a multiple that has drifted to about 1.9 times. The bull case is about $77 if returns hold 17 to 18 percent, Basel relief funds an accelerated buyback, and the multiple stays near 2.1 times. The bear case is about $50, a full credit cycle turned in 2027 or 2028, returns reverted toward 13 percent, and the multiple parked near its 1.45 to 1.5 times median, which is roughly dead money from here. The flip is whether the return inflection proves durable through a cycle.
Five years. This is pure durability territory: where the repricing runway leaves earnings as it burns down, what return level the market will underwrite, and whether the deposit moat held against fintech. The base case is about $77, a solid mid-single-digit total-return compounder once you add the roughly 2 percent dividend, with tangible book near $40 a share at about 1.9 times. The bull case is about $90, with tangible book near $42 at a held 2.1 times and returns durably elevated. The bear case is about $56, the cycle-peak premium given back while the business stays fine, with tangible book near $37 at about 1.55 times, which is roughly flat over five years. The flip is return durability and whether the moat stays intact.
Where the read lands today. On balance the read holds at Hold. This is a high-quality, still-growing bank with an elite low-cost deposit base and a multi-year tailwind that is lifting returns toward a 17 to 18 percent target, but it trades at the top of its own ten-year range at an all-time high, where the current 16 percent return is already fully in the price. The reward on flawless execution is roughly matched by the downside of a normal cyclical reversion, so it reads as a great company at a fully-priced stock. The single thing most likely to move that read is the path of return on tangible common equity: hold the mid-to-high teens and the premium is defensible, slip toward 13 percent and it is not.
Companion tool
Jump to the interactive dashboard to sort and filter every bank in this piece, or download the Excel model to flex the scenarios yourself.
TL;DR
Bank of America is the second-largest US bank by assets, behind only JPMorgan, and it makes money two ways at once. The first is net interest income, the spread between what it earns on roughly $2.1 trillion of loans and securities and what it pays on a $2 trillion deposit base, which threw off about $60.1 billion in 2025. The second is fee and trading income from four businesses: Merrill and the Private Bank in wealth management, investment banking and treasury services, sales and trading, and consumer card and service charges. The engine underneath all of it is the deposit franchise. Bank of America funds itself at a blended 1.47 percent, and its consumer book costs just 0.51 percent, because more than a quarter of its deposits sit in checking and operating accounts that pay nothing and 92 percent of consumer checking accounts are the customer’s primary account. That cheap, sticky funding is the moat. The bank earned $30.5 billion in 2025, a 14.22 percent return on tangible common equity (ROTCE: profit per dollar of tangible capital, the core bank-profitability gauge), rising to 16.0 percent in the first quarter of 2026, against a roughly 10.5 to 11 percent cost of equity. It sits on an 11.2 percent capital ratio with about $20 billion of excess and returned $9.3 billion to shareholders in a single quarter. The catch is the price and the bond book. At $57.88 the stock trades at about 2.0 times tangible book (its hard net worth per share after goodwill is stripped out, the key bank multiple), the ceiling of its own ten-year range, at an all-time high, with the current return already discounted. And the held-to-maturity bond portfolio carries about $81 billion in unrealized losses, an economic cost of carry that suppresses the margin even though it never touches regulatory capital. The honest read is Hold, Overvalued on valuation: a fine bank, a full price.
Explore it yourself: the interactive dashboard
Open the dashboard in a full screen
The dashboard holds Bank of America and the eight banks it is compared against here, sortable by market cap, by what each one is to BAC (money-center peer, capital-markets comp, super-regional), and by the two metrics that matter most for a bank, price to tangible book and return on tangible common equity. It also lays out the rating, the factor read behind it, and the full bull, base, and bear horizon table. Use it to check any single name as you read.
Prefer a spreadsheet? Download the Excel model with the net-interest-income build, the segment model, the deposit-repricing schedule, the scenario math behind the horizon chart, and the peer valuation table. The scenario levels in that file are illustrative arithmetic, not targets.
The spread machine and the toll booth
A bank is a spread machine sitting on top of a giant float, and Bank of America has one of the largest floats in the country. Picture a reservoir. Money flows in from depositors, who hand the bank close to $2 trillion and accept little or no interest on a big chunk of it. The bank holds that water, lets some of it out as loans and securities at a higher rate than it pays to hold it, and keeps the difference. That difference, multiplied across trillions, is net interest income (NII), and for most banks it is the whole business.
What makes Bank of America more than an average lender is the cost of the water and a second set of pipes. The cost is the moat. Because the bank holds the densest consumer-checking franchise in the United States, it funds itself more cheaply than almost anyone, and that cheap funding does not run away when rates rise. The second set of pipes is fee income: Merrill Lynch and the Private Bank charge fees on $4.6 trillion of client assets, the investment bank clips fees on corporate deals, the trading desk earns spreads on institutional flow, and the card business collects interchange. Those fee pipes run on a different schedule than the spread, so when one slows the other often does not.
The “fortress” language that gets quoted around big banks is really a toll booth that keeps taking tolls even when traffic slows, governed by one constraint: regulatory capital. The bank holds far more capital than the rules require, and the Federal Reserve’s annual stress test sets the maximum pace at which it can hand earnings back to shareholders. The debate this entire piece works through is whether that toll booth is worth a top-of-range price. The bull says the deposit moat plus a multi-year earnings tailwind lifts returns and the premium is earned. The bear says you are paying the highest multiple of the last decade for a deposit-led bank at an all-time high, with a recession able to hit the spread and credit losses at the same time, and an $81 billion bond hole the accounting politely keeps off the books. Both are sourced. Both belong.
How the money flows
flowchart TD
    DEP["Consumer and Corporate Depositors - $2.02T avg deposits"]
    WF["Wholesale Funding - LT debt $326B"]
    DF["Deposit Franchise - NIB $514B at 0% cost - THE MOAT"]
    LOANS["Loan Book - $1.19T avg - consumer plus commercial"]
    SEC["Securities Portfolio - $901B AFS plus HTM"]
    NII["NII Spread Engine - $15.7B per qtr - NIM 2.07%"]
    CB_FEE["Consumer Banking - card fees, service charges, $11.0B rev per qtr"]
    GWIM["GWIM and Merrill Lynch - $4.6T client assets - AUM fees"]
    GB["Global Banking - IB rank 3 globally - IB fees $1.84B per qtr"]
    GM["Global Markets - FICC plus Equities - S and T $6.4B per qtr"]
    NI["Net Income - $8.6B Q1 2026 - ROTCE 16%"]
    CAP["CET1 Capital - 11.2% ratio, $200B - regulatory constraint"]
    DEP --> DF
    WF --> DF
    DF --> LOANS
    DF --> SEC
    LOANS --> NII
    SEC --> NII
    NII --> NI
    CB_FEE --> NI
    GWIM --> NI
    GB --> NI
    GM --> NI
    NI --> CAP
Read the diagram top to bottom and you have the whole bank. At the top is funding. Depositors supply roughly $2.02 trillion on average, and the bank adds about $326 billion of long-term debt issued in the capital markets. The deposit franchise is the chokepoint and the moat: about $514 billion of those deposits are noninterest-bearing (NIB), meaning checking and operating balances that pay a literal zero, so the blended cost of all deposits is just 1.47 percent. The wholesale debt, by contrast, is market-priced and offers no advantage over peers. It is a cost center, not a moat.
The middle is deployment. The bank takes that cheap funding and puts it into two kinds of earning assets: about $1.19 trillion of loans yielding roughly 5 to 6 percent, and about $901 billion of securities yielding closer to 2.5 to 3 percent. The gap between what those assets yield and what the funding costs is the net interest margin (NIM: the spread expressed as a percentage of earning assets), and margin times earning assets is net interest income. At 2.07 percent the reported margin looks thin, and a later section explains exactly why.
The bottom is conversion and constraint. Net interest income joins the four fee engines (consumer banking, wealth management, investment banking, and trading), and the combined result flows to net income, about $8.6 billion in the first quarter of 2026. That income then runs into the capital wall: the common equity tier 1 ratio (CET1: the core regulatory capital measure, equity divided by risk-weighted assets) sits at 11.2 percent, and the Fed’s stress test governs how much can be retained versus returned. The investing point is the shape. The cheapest funding in the system feeds a giant balance sheet, and the only governor on how fast earnings come back to shareholders is the regulator.
The four segments: where Bank of America earns its money
Bank of America reports in four segments. The chart below shows the first-quarter 2026 revenue mix, with the return on allocated capital (ROAC) each segment earns, and the short version is that the consumer bank is the spine and the other three diversify it.
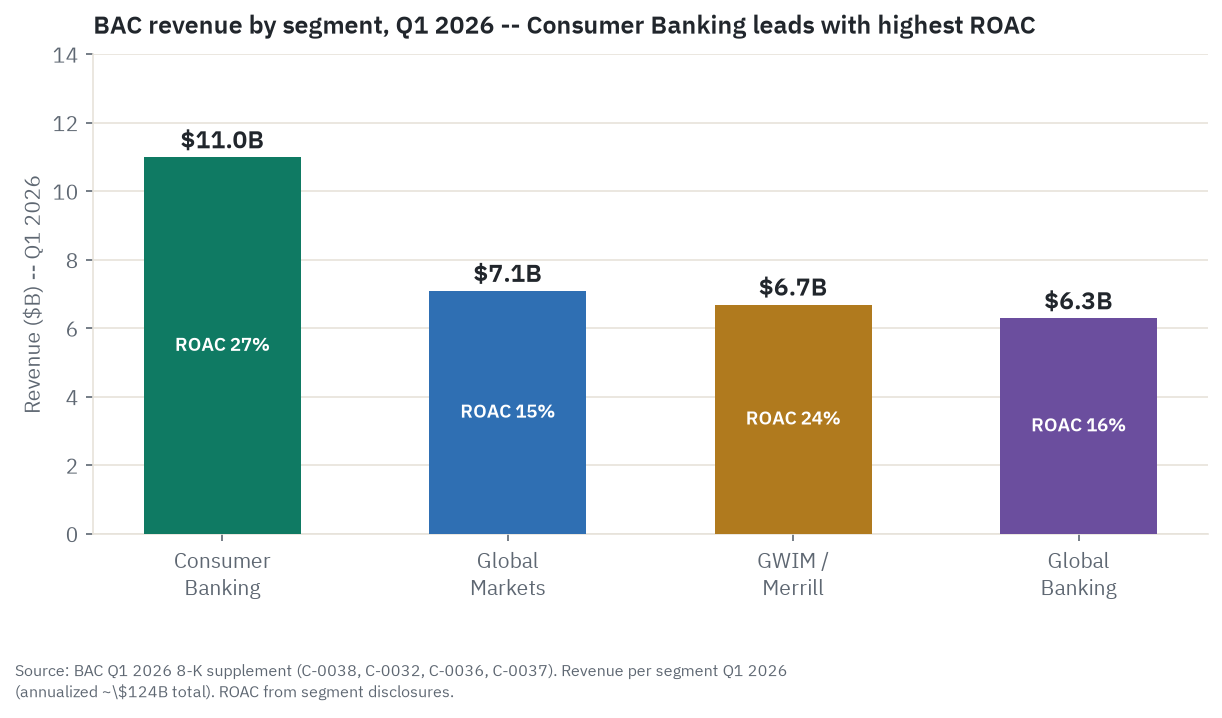
Consumer Banking is the engine. It produced $11.0 billion of revenue in the first quarter, up 5 percent, and $3.1 billion of net income at a 27 percent return on allocated capital, the highest of the four. This is where the deposit moat lives: about $951 billion of average deposits at a 0.51 percent cost, 38.4 million consumer checking accounts, and a 29th consecutive quarter of net new checking growth. It also carries the card book, where credit-card net charge-offs ran 3.64 percent, down from 4.05 percent a year earlier. The segment is both the lowest-cost funding source for the whole bank and a high-return business in its own right.
Global Wealth and Investment Management (GWIM), which is Merrill Lynch plus the Private Bank, is the structural compounder. It earned $6.7 billion of revenue in the quarter, up 12 percent, and $1.3 billion of net income at a 24 percent return. The headline number is the client base: $4.6 trillion in total client balances, up about 10 percent year over year, with $2.1 trillion in assets under management and $4.3 billion of asset-management fees, up 15 percent. Those fees are charged as a percentage of assets, so they compound with markets and net inflows without much extra capital, which makes them the least cyclical revenue in the company. The catch is the efficiency ratio (noninterest expense as a share of revenue, where lower is better): GWIM ran near 75 percent in 2025 because financial-advisor compensation is expensive, so it is a high-return but low-margin business by design.
Global Banking is corporate and commercial lending plus the investment bank. It earned $6.3 billion of revenue, up 5 percent, and $2.1 billion of net income at a 16 percent return. Investment-banking fees were $1.84 billion, up 21 percent, with Bank of America ranked roughly third in the global fee wallet. The segment also runs treasury and cash-management services for large corporations, which are sticky because companies need the operational plumbing, and it holds most of the bank’s commercial-real-estate exposure, the credit item to watch.
Global Markets is the trading business: fixed income, currencies, and commodities (FICC) plus equities. It earned $7.1 billion of revenue, up 8 percent, and $2.0 billion of net income at a 15 percent return, the thinnest of the four but still above the cost of equity. Sales and trading revenue was $6.4 billion, with equities up 30 percent to $2.8 billion, the best quarter in fifteen years and the sixteenth straight quarter of year-over-year growth. Trading is capital-intensive and lumpy, and it distorts the consolidated margin in a way the next section explains, but it deepens corporate relationships and the equities franchise has been gaining share.
What the filings say
The trajectory in the filings is clear: revenue is accelerating, returns are climbing, and the bank is handing back a lot of capital. Total revenue net of interest expense rose to $113.1 billion in 2025, up 7 percent, and ran $30.3 billion in the first quarter of 2026, up 7 percent year over year. Net income was $30.5 billion for 2025 and $8.6 billion in the first quarter, with diluted earnings per share of $3.81 for the year and $1.11 for the quarter, up 25 percent. Return on tangible common equity, the number the whole valuation keys off, went 12.94 percent in 2024, to 14.22 percent in 2025, to 16.0 percent annualized in the first quarter of 2026. That last figure is important because it hit the bank’s own medium-term target a year early, and because a careless reading sometimes confuses it with the cost of equity (the roughly 10.5 to 11 percent return shareholders require). The bank is now earning well above what its capital costs.
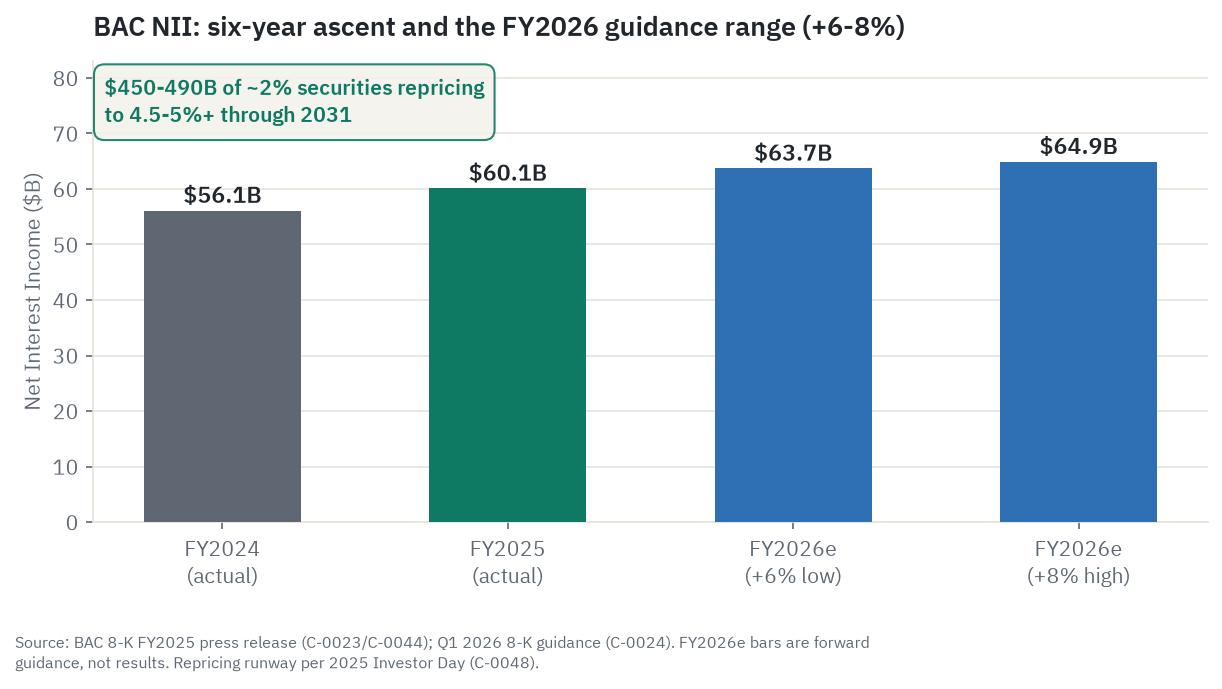
The spread engine is the story underneath the trajectory. Net interest income went from $56.1 billion in 2024 to $60.1 billion in 2025 on a reported basis, and the quarterly run is a near-straight staircase: $14.4 billion in the first quarter of 2025, then $14.7 billion, $15.2 billion, $15.8 billion, and $15.7 billion in the first quarter of 2026, up 9 percent year over year. On the first-quarter call management raised full-year 2026 net interest income guidance to grow 6 to 8 percent over that roughly $60.1 billion base, up from the 5 to 7 percent guided in January, after the first quarter beat its own forecast. The driver behind that staircase is the subject of its own section below.
Margins are respectable and improving. The efficiency ratio, noninterest expense over revenue, where below 50 percent is elite, was 61.65 percent for 2025 and about 61 percent in the first quarter, an improvement of roughly 170 basis points year over year, with management targeting more than 200 basis points of positive operating leverage (revenue growing faster than expenses) in 2026. That 61 percent lags JPMorgan’s roughly 51 percent, which is a real gap, though it reflects scale rather than waste: JPMorgan earns more revenue per dollar of expense, not because Bank of America is undisciplined but because the larger firm has more operating leverage.
On the balance sheet, total assets were about $3.5 trillion at the end of the first quarter, with $1.2 trillion of loans (up 9 percent year over year, split roughly 40 percent consumer and 60 percent commercial), $2.0 trillion of deposits, and $326 billion of long-term debt. Tangible common equity (TCE: common equity stripped of goodwill and intangibles) was $205.7 billion. The securities book was about $901 billion, split between $386 billion of available-for-sale (AFS) bonds carried at fair value and $515 billion of held-to-maturity (HTM) bonds carried at cost, almost all agency mortgage-backed securities and Treasuries. That bond book is the bear case, and it has its own section.
Capital return has been heavy. The bank bought back $21.4 billion of stock in 2025 (about 452 million shares) and another $7.2 billion in the first quarter of 2026, and it pays a $0.28 quarterly dividend, $1.12 a year. Add it up and total capital returned was about $29.5 billion in 2025 and $9.3 billion in the first quarter alone. The share count fell from 7.61 billion at the end of 2024 to 7.13 billion at the end of the first quarter of 2026, a 7 percent reduction in fifteen months, which is the mechanical reason earnings per share grew faster than net income. As for what management itself flags as the load-bearing risks, the 10-K lists three that matter: interest-rate sensitivity in net interest income, the effect of higher rates on the securities portfolio and capital, and uncertainty around regulatory capital rules. Each of those gets its own treatment below.
The deposit franchise: the core moat
This is the section most specific to Bank of America’s case, so it is worth being precise about why the deposit base is a moat rather than a slogan. A bank’s single most important input cost is what it pays for funding. Bank of America pays a blended 1.47 percent on close to $2 trillion of deposits, and its consumer book pays just 0.51 percent, down from 0.61 percent a year earlier even though the Fed held its policy rate at 3.50 to 3.75 percent through a hawkish June 2026 meeting, with a dot plot whose median projects a year-end rate near 3.8 percent and nine of eighteen officials penciling in a hike. The reason is mix. About $514 billion of deposits, roughly 26 percent of the total, are noninterest-bearing checking and operating balances that cost exactly zero and do not respond to rate moves at all. Sit $514 billion of free funding on top of the balance sheet and the blended cost stays low no matter what the Fed does.
The technical way to measure stickiness is the deposit beta: the fraction of a Fed rate move that a bank passes through to depositors. Through the 525-basis-point hiking cycle from 2022 to 2023, Bank of America’s consumer deposit cost rose only about half a percentage point, a cumulative consumer beta in the low teens, far below the roughly 40 percent retail average for the industry. The corporate-wide blended beta was higher, in the mid-30s, because wealth and corporate clients are more rate-aware, but the consumer anchor held. That low beta is not luck. It comes from primacy, the share of accounts that are the customer’s main account, which Bank of America puts at 92 percent of consumer checking. A customer who has direct deposit, bill pay, Zelle, a card, a mortgage, and a linked Merrill account does not move that relationship for a few extra basis points at an online bank. The switching cost is the moat.
The honest counterpoint is that the down-cycle is where this gets tested. Deposit beta is capped on the way up, because a bank can never pass through more than 100 percent of a rate increase, but it is uncapped on the way down in the sense that a depositor can always leave for a higher yield somewhere else. Money-market funds hold roughly $7.75 trillion (per the Investment Company Institute in mid-May 2026, a figure that moves weekly) at yields near 3.6 to 3.7 percent, and high-yield savings accounts offer close to 4 percent, against a national average savings rate near 0.45 percent. The test so far has been passed: consumers moved excess savings into money funds but left their checking accounts in place, and the noninterest-bearing share has stabilized around 26 percent after falling from a 2022 peak near 35 percent. The structural vulnerability is a fintech that one day replicates the whole primacy bundle at a competitive rate. No one has done it at scale, but it is the one thing that would erode the zero-cost base, and it is the moat’s true long-term risk.
The loan book and credit quality
Credit is where a bank’s earnings can turn fast, so it pays to look at the canary metrics. As of the first quarter of 2026 they read benign. Net charge-offs (NCOs: loans written off as uncollectible, net of recoveries) were $1.41 billion, a 0.48 percent annualized rate, down from 0.54 percent a year earlier. The provision for credit losses (the amount set aside against future losses) was $1.34 billion, slightly below charge-offs, which means the bank released a small amount of reserve rather than building. Total allowance for credit losses (ACL: the reserve cushion on the balance sheet) stood at $14.3 billion, about 1.09 percent of loans, and nonperforming loans were $5.8 billion, or 0.49 percent. On the consumer side, card net charge-offs of 3.64 percent are well below the roughly 4 to 5 percent of the subprime-skewing card issuers, because Bank of America’s card book is prime-oriented. Consumer credit normalization, the slow return to pre-pandemic loss rates, looks roughly complete rather than deteriorating.
The exception, and the one credit item bears focus on, is commercial real estate, specifically office. Total commercial-real-estate loans are about $66 billion, and commercial criticized exposure across all of commercial is $24.3 billion. Criticized is a regulator-and-bank term for loans flagged as showing weakness, the special-mention and classified buckets, a watch-list step that builds before any actual default or charge-off, so it reads as an early-warning gauge for the office and commercial book rather than a tally of realized losses. The construction share of the book has fallen from 39 percent in 2009 to 14 percent today, which reduces the riskiest slice. The problem is the system backdrop. Office mortgage delinquency hit a record near 12.34 percent in early 2026 (per the Mortgage Bankers Association, an analyst-tier figure), worse than the financial-crisis peak, and, on industry estimates, more than $100 billion of commercial-mortgage-backed office loans mature in 2026 with more than half expected to miss refinancing. The maturity wall is concentrated in the back half of 2026 and into 2027, which is exactly the forecast window.
Here is the honest gap. Bank of America’s specific office-subsector balance, its office criticized loans, and its commercial-real-estate charge-off rates by subtype were not individually disclosed in the filings reviewed for this piece. The aggregate commercial criticized number is the visible metric, and commercial net charge-offs ran a low 0.20 percent in the quarter. The bull line is that a diversified bank of this size, with construction risk down and a sticky deposit base, absorbs the office cycle without much trouble. That may well be right. But an undisclosed office number at a record-delinquency moment is a flag, not a comfort, and if office losses show up in the third and fourth quarters a reserve build of a few billion dollars is plausible and would offset a meaningful chunk of the net-interest-income gain the bull case is banking.
The bond book and the AOCI overhang
This is the single most distinctive bear point on Bank of America versus its peers, and it requires a careful explanation because the accounting is where most readers get it wrong. During 2020 and 2021, when the Fed held rates near zero and pandemic deposits flooded in, the bank deployed several hundred billion dollars into fixed-rate securities yielding around 2 percent. When rates jumped in 2022 and 2023, the market value of those bonds fell well below what the bank paid. The chart below sizes the result.
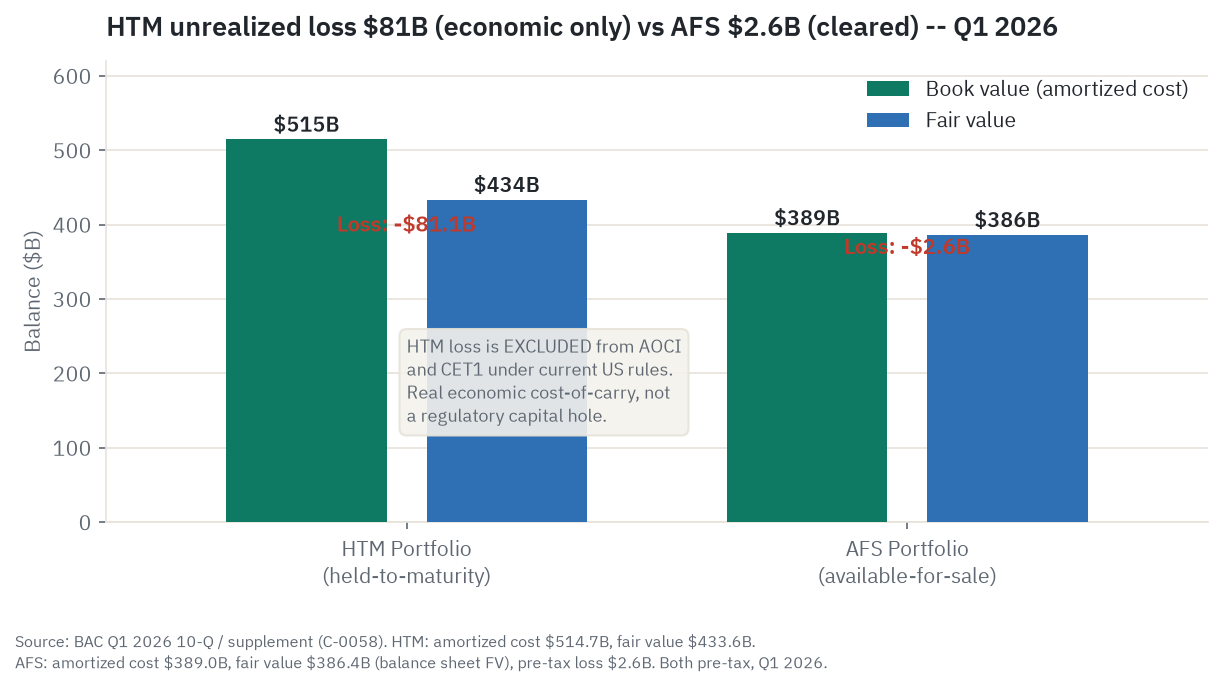
Banks split their bond books into two buckets with very different accounting. Available-for-sale (AFS) bonds are marked to market every quarter, and the gains or losses flow through a line called accumulated other comprehensive income (AOCI), which directly reduces tangible book value and regulatory capital. Held-to-maturity (HTM) bonds are carried at original cost, and their unrealized losses do not flow through AOCI or through capital at all, on the theory that the bank will hold them to maturity and collect par. As of the first quarter of 2026, the AFS loss has been worked down to just $2.6 billion, effectively cleared. The HTM loss is the big one: about $81.1 billion pre-tax, roughly $60 to $62 billion after tax, which is close to 30 percent of the bank’s $205.7 billion of tangible common equity.
The reason this matters in both directions is the crux. The bull is right that the loss does not touch regulatory capital. Because the bonds are flagged held-to-maturity, the $81 billion sits off the capital calculation, the CET1 ratio is unaffected, and as long as the bank is never forced to sell, the loss is never realized. And Bank of America is far less likely to be forced to sell than a Silicon Valley Bank, because its $2 trillion deposit base is diversified, largely insured, and sticky rather than concentrated in a single nervous industry. The bear is right that the loss is real economic cost all the same. About $515 billion of the balance sheet is trapped earning roughly 2 percent while the bank funds it at 1.47 percent and could reinvest at 4.5 to 5 percent, and that drag is the main reason the consolidated margin is a thin 2.07 percent. Strip out the large trading book and the core banking margin is 2.55 percent rather than the reported 2.07 percent. Those low-yielding, balance-sheet-heavy trading assets sit in the average-earning-asset denominator and dilute the headline margin, even though they earn their keep as trading and fee revenue booked elsewhere rather than as net interest income. The bond drag is real on top of that. Mark the HTM book to market and tangible book value per share is not $28.84, so the multiple you pay is flattered by an accounting convention.
There is a tail to watch and a tailwind to note. The tail: if long rates spike toward 5 percent, the HTM hole widens by an estimated $15 to $20 billion, and if regulators ever reopen the debate about putting these losses into capital, the comfort evaporates. The tailwind: the same maturity schedule that traps the money is the engine of the recovery. As those low-yield bonds mature over the next five to seven years and the proceeds reinvest at current rates, the loss burns down and earnings rise, which is the bridge to the next section. The honest framing is that the overhang is neither a non-issue nor a solvency event. It is a multi-year cost of carry that the bank will spend half a decade digging out of, and the dig-out is itself the growth story.
The repricing runway: why net interest income keeps rising
The most important thing to understand about Bank of America’s earnings over the next several years is that the largest piece of its growth does not depend on the Fed. At the November 2025 investor day, management put a number on it: roughly $450 to $490 billion of low-yield securities and fixed-rate loans are scheduled to mature and reprice at current market yields between 2026 and 2031, a window the chief executive calls a “five-year runway.” Think of it as a conveyor belt. Every year a slice of bonds bought at 2 percent rolls off the end, and the cash gets reinvested at 4.5 to 5 percent or better. That yield pickup, on a base this large, mechanically lifts net interest income whether the Fed hikes, holds, or cuts modestly, because it is set by the maturity ladder, not the rate cycle. Six straight quarters of rising net interest income confirm the belt is already moving.
That is the structural half of the rate story. The cyclical half is the bank’s disclosed sensitivity, and it cuts the other way. A 100-basis-point parallel drop in rates would cost about $2.0 billion of net interest income over twelve months, while a 100-basis-point rise would add less than $500 million. The asymmetry has a mechanical cause. On the way down, the consumer deposit cost is already pinned near its 0.51 percent floor and cannot fall much further, while floating-rate loans and maturing-bond reinvestment yields reprice down in full, so the spread compresses hard. On the way up, deposit costs eventually have to catch up, which caps the gain. It is the same down-beta point made about deposits, applied to the spread itself: cuts compress the spread more than hikes widen it. The takeaway is that the bank is no longer strongly tilted to benefit from rising rates the way it once was, and that a fast cutting cycle is the real risk to the spread. The repricing belt cushions a rate-cut cycle because it runs on its own clock, but it does not erase the hit: the disclosed sensitivity already nets the belt against the cut and still shows minus $2 billion per 100 basis points.
This is also why a rate hike reads as a bull catalyst for the stock even though the direct one-quarter pickup is under $500 million. A hike does its work mainly by signaling “higher for longer,” which keeps the reinvestment yields on the $450 to $490 billion repricing belt elevated for years and supports the bank multiple and sentiment. The sustained belt benefit dwarfs the small direct sensitivity, so the bullish part of a hike is the rate environment staying high, not a single quarter’s net interest income jump. The base-case guide of plus 6 to 8 percent for 2026 assumes the rate curve as of early January holds, so the guide beats if the Fed holds or hikes and comes under pressure if the Fed is forced to cut hard into a slowdown.
Capital, regulation, and the return of capital
Capital is the governor on everything a bank can return, and Bank of America’s capital position is strong and the regulatory wind has turned favorable. Its common equity tier 1 ratio was 11.2 percent, about $199.7 billion, against a 10.0 percent minimum requirement, leaving roughly $20 billion of excess. That ratio has drifted down gently over the past year, from 11.8 percent, as loan and trading-asset growth lifted risk-weighted assets faster than earnings added capital, which is an orderly decline rather than a warning. One near-term constraint to note: the bank’s systemic surcharge rises by half a point in January 2027, which lifts the minimum to 10.5 percent and consumes roughly $9 billion of that excess.
The bigger regulatory picture flipped from headwind to tailwind. The original 2023 Basel III endgame proposal would have forced large banks to hold materially more capital, capping buybacks for years. The re-proposal issued in March 2026 reverses that: agency estimates put the net effect at roughly 5 percent lower required capital for the largest US banks once the recalibrated systemic surcharge is netted against the Basel changes, and management has said it expects the surcharge changes to “more than offset” the Basel impact. On top of that, the stress capital buffer (the bank-specific cushion the Fed sets each year from its stress test) is frozen through October 2027, and all 32 tested banks cleared the 2026 stress test in late June. The combination is the most bank-favorable capital backdrop since before 2023.
You will see a figure floating around that the Basel relief “unlocks $40 billion of buybacks.” Treat that as an analyst estimate, not a disclosed number. It does not appear in any Bank of America filing. The defensible version is that the bank has roughly $20 billion of current excess capital plus perhaps $8 to $10 billion more from the re-proposal over time, on top of the $8 to $9 billion of capital it generates each quarter. What is solid is the actual return: $29.5 billion handed back in 2025, $9.3 billion in the first quarter of 2026 alone, and a 7 percent reduction in the share count over fifteen months. One honest caveat: buying back stock at roughly 2.0 times tangible book is meaningfully less accretive than the sub-tangible-book buybacks the bank did a few years ago. The same dollar retires fewer shares at a higher price, so the per-share math is weaker than it was, even though the absolute return is large. The deeper version of that point is about value, not just share count. Buying stock above tangible book actually dilutes tangible book value per share for the holders who remain, because the bank lays out roughly two dollars of cash to retire one dollar of book, whereas the sub-book buybacks of the Berkshire-entry era added to tangible book per share. So at 2.0 times the buyback still shrinks the share count and lifts earnings per share, but it is far less accretive to tangible book than it was below book, the opposite of the value-building repurchases of a few years ago.
What the market is paying
Bank of America has had a strong run, and the valuation now reflects it. The stock returned about 25.5 percent over the past year, beating the S&P 500 but trailing the KBW bank index, and it sits near $57.88 against a 52-week range of $44.75 to $59.20, which puts it in the top decile of its own range, about 8 percent above its 50-day moving average and 10 percent above its 200-day. The 14-day relative strength index near 71 is in overbought territory, which is a description of how fast it has run, not a forecast. The stock fell to $44.75 in an April tariff scare and recovered the entire drawdown within about ten weeks, which is the character of the name: rate-sensitive, macro-driven, with sharp drops and quick recoveries.
For a bank the foundational valuation question is price to tangible book value (P/TBV: the stock price divided by tangible book value per share), because it tells you how much the market will pay for the hard equity the bank has built, and that depends on the return the bank earns on that equity. Book, rather than earnings, is the primary anchor for a bank because bank earnings swing with the credit cycle and reserve releases, while tangible book is the steadier, loss-absorbing base the regulator actually constrains, which makes it the more reliable yardstick through the cycle. The chart below plots Bank of America against eight peers on price to tangible book versus return on tangible common equity, and the relationship is what you would expect: higher returns command higher multiples.
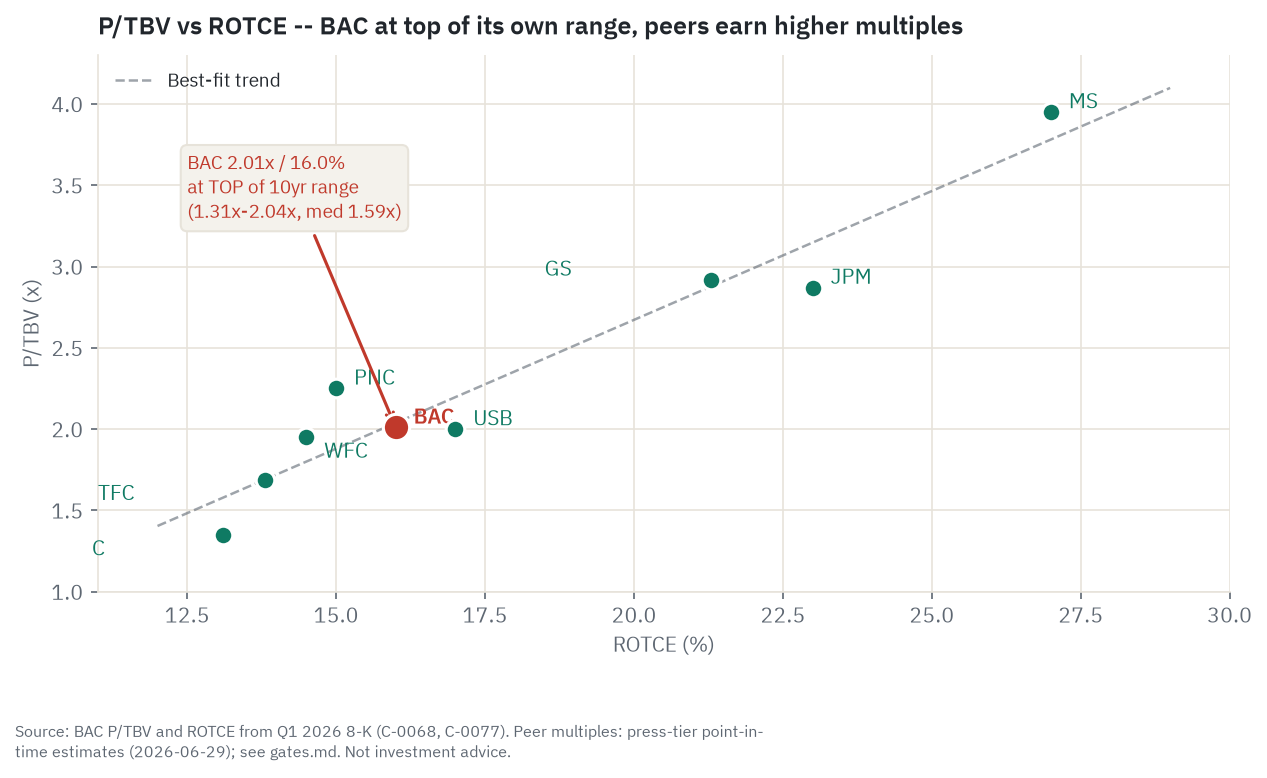
Here is the core valuation point, and it is the opposite of the comfortable framing you usually hear. At $57.88 against $28.84 of tangible book, Bank of America trades at about 2.0 times. Its own ten-year range is roughly 1.31 to 2.04 times, with a median near 1.59 times. So 2.0 times is not a bargain waiting to re-rate. It is within a rounding error of the highest multiple the stock has carried in a decade, about 26 percent above its own ten-year median, reached at an all-time high. The popular “it trades at a discount to JPMorgan’s 2.87 times” line is a category error: JPMorgan’s premium is earned and structural, sitting on a roughly 23 percent return versus Bank of America’s 16 percent, a gap that has persisted for years. A higher, more durable return should command a higher multiple. There is no law that says the gap converges, and the more likely path is that it persists because the earnings gap persists. Where Bank of America actually sits is in a cluster with Wells Fargo near 1.95 times and US Bancorp near 2.0 times, in line with its returns. The cheap-bank argument is gone.
Run the math the bulls themselves use and the tension is exact. Under the standard excess-return framework, a 16 percent return on a 10.5 percent cost of equity with 5 percent long-run growth implies a fair multiple right around 2.0 times, which is where the stock trades. So the price already fully discounts the 16 percent run rate, and 16 percent was a quarterly peak; the full year was 14.22 percent. The market gives no credit for the 17 to 18 percent management target, which is the bull’s point, but it also leaves no margin of safety. If the return holds 18 percent, the implied multiple is about 2.36 times, roughly $68, around 18 percent upside. If it reverts to a normal-cycle 13 percent, the implied multiple is about 1.45 times, roughly $42, around 27 percent downside before any book-value growth. That is the trade: limited upside on flawless execution against larger downside on a normal reversion. On the rest of the multiples the stock is about 14 times trailing earnings and roughly 13 times forward earnings, with a dividend yield near 1.9 percent. The sell-side is lopsided bullish: of 24 analysts, 16 rate it Strong Buy, 6 Buy, 2 Hold, and none Sell, with a mean target near $63 to $64, roughly 8 to 10 percent above the current price. A lopsided sell-side, an all-time high, and a ceiling multiple together are the textbook setup for a stock priced near the top of its cycle.
What the crowd is saying
The dominant narrative is a net-interest-income inflection story with a fading bond-book worry underneath it. The first-quarter beat in April, with net interest income up 9 percent and the guide raised, was read as confirmation that the inflection is real, and sentiment on the street has warmed from cautiously optimistic to outright bullish. The most telling data point is what did not happen: the stock rose only about 0.3 percent on the day of a clear beat, which several analysts read as a sign that the good news was already in the price after a run to all-time highs. When a stock barely moves on confirming news, much of the story is already paid for. Everything here is signal, not fact, and the soft readings (retail chatter, search interest) are directional impressions only.
The piece of sentiment everyone asks about is Berkshire Hathaway, and it deserves a precise, motive-free treatment. The disclosed facts, from Form 4 and quarterly 13F filings, are these. Berkshire began selling Bank of America in July 2024 from a peak near 1.03 billion shares, sold for seven consecutive quarters including the first quarter under new chief executive Greg Abel, and has cut the position by roughly 50 percent. As of the first-quarter 2026 13F it still held about 517 million shares, 9.52 percent of its equity portfolio, worth roughly $25 billion, its fourth-largest position, and the first-quarter sale was only about 0.71 percent of the remaining stake, a sharp deceleration. Berkshire has never stated a reason, and none is asserted here. You can read the seven-quarter sell-down as a bearish tape on price-to-book if you like, given that Berkshire first bought when the stock traded at a deep discount to book and trimmed as it crossed to a premium. But the residual $25 billion is as material as the selling, and the popular “Buffett is abandoning the bank” framing overstates what the filings show, which is a partial monetization of a roughly decade-long gain with a $25 billion position retained. For a full picture of how Berkshire is deploying its $397 billion cash pile and repositioning its equity book under Greg Abel, see the Berkshire Hathaway (BRK.B) deep-dive.
The useful part of sentiment is where the crowd’s story and the filings diverge. The crowd treats the bond loss as an existential capital hole; the filings show it is excluded from regulatory capital under current rules, real as economic cost but not a solvency event. The crowd treats the Berkshire selling as a directional vote against the stock; the filings show a retained $25 billion and a decelerating pace. And the crowd’s reflexive “JPMorgan is simply better” frame, while broadly true on returns, underweights Bank of America’s genuine return inflection and the Merrill compounding engine. Each of those gaps is a place where the consensus could be wrong in either direction, which is exactly why they are worth naming.
Does the deposit franchise earn its premium?
This is where the evidence gets weighed rather than listed, against the question the whole piece is built on: does the low-cost deposit franchise and the earnings tailwind justify a top-of-range price? Four durability tests answer it.
The first is moat durability, and here the answer is a clear yes. The deposit franchise is not a narrative, it is data: a consumer deposit beta in the low teens through 525 basis points of hikes, 92 percent primacy, and 29 straight quarters of net new checking growth. That is about as proven as a banking moat gets, and the only real threat is multi-year fintech substitution that is not visible at scale yet. The second is earnings durability, and here the answer is mixed. The repricing belt makes net interest income structurally durable over a two-to-four-year horizon because it runs on maturities rather than the Fed, but the disclosed minus $2 billion per 100 basis points means an aggressive cutting cycle into a recession could pull several billion of run-rate income quickly. Returns are durable in a soft landing and cyclical in a hard one.
The third test is capital durability, and the answer is strong. An 11.2 percent capital ratio against a 10.0 percent floor, a cleared stress test, a buffer frozen to October 2027, and a favorable Basel re-proposal leave plenty of room for buybacks and the dividend even through a normal downturn. The fourth is franchise durability, and the answer is a quiet yes. Merrill’s $4.6 trillion platform compounds with markets and inflows at a 24 percent return on capital, and it is the most structural grower in the company. Put the four together and the bull, base, and bear each need something specific to be true. The bull needs returns to prove durable at 17 to 18 percent through a cycle, earning the premium rather than just discounting it. The base needs a soft landing where the guide is delivered and tangible book compounds. The bear needs the cycle to turn, the recession double hit to land, and the cycle-peak premium to be given back. The franchise is good enough that the bear is about the stock, not the bank.
The scenarios in detail
Four dials decide the five-year outcome, and the scenarios are just different settings of them. The first is the net-interest-income trajectory, with its structural repricing belt and its cyclical minus $2 billion per 100 basis points sensitivity. The second is return on tangible common equity, the number the multiple keys off, now 16 percent against a 10.5 to 11 percent cost of equity and a 17 to 18 percent target. The third is the multiple itself, currently 2.0 times tangible book at the top of a 1.31 to 2.04 times decade range. The fourth is capital and credit together: the capital that funds buybacks against the credit that could force reserve builds. A fifth and slower dial sits underneath all of them, the deposit moat, treated here as the structural floor. The dollar levels below match the chart at the top of the article, and the method is auditable rather than picked by feel: base-case tangible book compounds about 7 percent a year from $28.84, bull about 8 percent on faster buyback accretion, bear about 5 percent as provisions absorb earnings, with the multiple held, drifted, or reverted in each case.
Bull, the 17 to 18 percent return is delivered and the premium holds. Net interest income compounds at the top of and then beyond the guide as the repricing belt runs and rates stay hold-or-hike, returns climb to a sustained 17 to 18 percent, the final Basel rule confirms the capital relief and funds an accelerated buyback, and credit normalizes without a cycle. The multiple holds near 2.1 to 2.15 times. On illustrative arithmetic that is tangible book near $42 by 2031 at about 2.1 times, roughly $90, with about $68 at one year and $77 at three. What breaks it: a recession that forces aggressive Fed cuts, hitting the spread and provisions together.
Base, the guide is delivered, the multiple normalizes, and tangible book compounds. Net interest income grows the guided 6 to 8 percent in 2026 and keeps rising into 2028 and 2029 as the belt runs, returns hold 15 to 16 percent, the Fed holds or cuts once, and credit normalizes without a hard recession. The multiple compresses modestly from 2.0 toward 1.9 times as the inflection becomes the run rate, while tangible book compounds about 7 percent a year. That is tangible book near $40 by 2031 at about 1.9 times, roughly $77, with about $62 at one year (just under the sell-side mean) and $67 at three. It is a solid but not heroic total return: price appreciation plus a roughly 2 percent yield. What breaks it: either a sharp cutting cycle or a commercial-real-estate wave.
Bear, the cycle turns and the cycle-peak premium is given back. A 2026-to-2028 slowdown forces the Fed to cut, net interest income rolls over toward flat as the minus $2 billion drag bites and deposit mix keeps grinding, office and commercial-real-estate losses crystallize off the maturity wall and force a multi-billion reserve build, and returns revert toward 13 percent. The market stops paying 2.0 times for a 13 percent return and the multiple mean-reverts toward its 1.45 to 1.5 times median, while tangible book still grows but slowly. That is roughly $42 near term on the reversion math, and on compounded bear book near $37 by 2031 at about 1.55 times, roughly $56, with about $48 at one year and $50 at three. The point of the bear is that nothing breaks. The bank stays fine and the stock simply gives back the cycle-peak premium it was carrying, a lost half-decade rather than a blowup. What defuses it: the belt holding net interest income up through the cuts and the office losses staying contained, which is precisely the base case.
The catalysts that decide which path wins are datable. Near term: the second-quarter print in mid-July (net interest income versus the guide, and the provision line as the credit canary), the September Fed meeting and its new projections (the single most important date for the twelve-month spread view), the office commercial-mortgage maturity events in the back half of 2026, and the quarterly buyback pace. Multi-year: the final Basel rule in late 2026 or 2027, the repricing belt running through 2031, the credit-cycle turn risk in 2027 and 2028, and the slow fintech threat to the deposit base. The leading indicators to watch in real time are net interest income against the 6 to 8 percent guide, the Fed path through monthly inflation and the dot plot, office charge-offs and criticized balances in the third- and fourth-quarter prints, return on tangible common equity against the 16 percent run rate, the noninterest-bearing deposit ratio and the 0.51 percent consumer cost, the buyback pace against the capital position, and the multiple against its own 1.31 to 2.04 times history.
Banks to watch (bull / base / bear)
The peer set is how you sanity-check whether Bank of America’s price and returns make sense. Each name below is one line on what it is, then the bull and bear in brief. All figures are point-in-time as of June 29, 2026 and move daily; peer multiples in particular are single-vendor and a few weeks stale in places.
JPMorgan Chase (JPM). The number-one US bank and the benchmark everyone is measured against, with about $885 billion of market cap.
- Bull: a roughly 23 percent return, a 14.3 percent capital ratio, and the leading deposit and investment-banking franchises make the 2.87 times tangible book a premium that is structurally earned.
- Bear: at 2.87 times it is priced for perfection, with no catch-up valuation story and full exposure to any credit or markets normalization.
Wells Fargo (WFC). The closest model comparable to Bank of America, a consumer-and-commercial bank, freed in March 2026 from the asset cap it had operated under since 2018. Market cap about $257 billion.
- Bull: removal of the cap finally allows balance-sheet growth, and if the 67 percent efficiency ratio improves toward 65 and returns move to 15 to 17 percent, the roughly 1.95 times multiple re-rates higher.
- Bear: the efficiency gap is structural, the margin is compressing, and a 10.3 percent capital ratio is the thinnest in the money-center group.
Citigroup (C). The cheapest megabank, a multi-year restructuring story under chief executive Jane Fraser, with about $246 billion of market cap.
- Bull: at roughly 1.35 times tangible book it is the clearest value in the group, with returns of 13.1 percent already beating its own target and a 12.7 percent capital ratio (note a vendor discrepancy that shows 13.6 percent; the primary filing reads 12.7 percent).
- Bear: international complexity, unresolved regulatory consent orders, and a return still near the cost of equity mean the transformation is not yet proven.
US Bancorp (USB). The largest super-regional, differentiated by its Elavon payments business, with about $94 billion of market cap.
- Bull: a 17 percent return slightly above Bank of America’s, a best-in-class 58 percent efficiency ratio, and a 3.7 percent dividend yield at about 2.0 times tangible book.
- Bear: heavy goodwill from the Union Bank deal compresses tangible equity, and the smaller scale means little trading revenue to cushion a credit turn.
PNC Financial (PNC). The number-two super-regional, expanding into the Southeast via its FirstBank acquisition, with about $99 billion of market cap.
- Bull: a 2.95 percent margin well above Bank of America’s and a path back to an 18 percent return by year-end justify the roughly 2.25 times multiple.
- Bear: a 10.1 percent capital ratio is the tightest in the group, and if the return recovery stalls the premium multiple evaporates.
Truist Financial (TFC). The Southeast super-regional formed from the BB&T and SunTrust merger, with about $63 billion of market cap.
- Bull: the best efficiency ratio in the entire group at 57.9 percent and a 4.1 percent dividend yield at 1.69 times tangible book, well below its own history, with returns still set to climb toward a 16 to 18 percent target.
- Bear: seven years post-merger and a 13.8 percent return still trails the group, which is why the market pays a discount and a high yield.
Goldman Sachs (GS). The premier investment bank and trading house, relevant as the competitor for Bank of America’s Global Banking fee wallet, with about $306 billion of market cap.
- Bull: a record trading franchise and a 21.3 percent return justify roughly 2.9 times tangible book if the results hold.
- Bear: at 2.9 times, well above its own history, it prices in sustained record results, and trading normalizes.
Morgan Stanley (MS). The benchmark for the Merrill wealth franchise, with about $337 billion of market cap and a $5.7 trillion wealth platform.
- Bull: a 27 percent return, the highest in the group, and a 30 percent wealth-management margin justify a premium 3.95 times multiple.
- Bear: at 3.95 times, a market downturn compresses assets, flows, and returns all at once.
One internal link worth following for a different angle on the same sector: a JPMorgan deep dive works through the universal-bank benchmark that Bank of America’s valuation is most often measured against, and the contrast between an earned premium and a top-of-range price is the whole comparison.
Risk controls
The honest risk paragraph. Bank of America is a leveraged play on the credit and rate cycle, and the risks rank in that order. The largest is interest-rate sensitivity in net interest income: the disclosed minus $2 billion per 100 basis points means an aggressive Fed cutting cycle compresses the biggest income line, and the worst version is a recession that forces those cuts while provisions are rising, the double hit, where the 2025 severe stress scenario implied about $59 billion of nine-quarter losses against a $5.7 billion full-year 2025 provision. Second is the bond-book overhang: the $81 billion held-to-maturity unrealized loss is about 30 percent of tangible common equity, economic rather than regulatory, but real, and it widens if long rates spike. Third is credit, where consumer normalization looks complete but the commercial-real-estate and office maturity wall lands in the back half of 2026 and into 2027 and the bank’s specific office exposure is undisclosed. Fourth is the deposit franchise itself: a faster mix shift into interest-bearing accounts or money funds compresses the margin even if rates hold. Fifth is regulatory capital: any reversal of the favorable Basel path or a worse stress result caps buybacks.
The valuation is the position. At 2.0 times tangible book after a strong run, at an all-time high, with the sell-side mean already only 8 to 10 percent above the price, there is little margin of safety, and a de-rating toward the 1.6 times median is a meaningful move on its own even if the business does nothing wrong. What would change the read for the better: returns proving durable at 17 to 18 percent through a normalization, a confirmed Basel relief, or a pullback that restores a margin of safety. What would change it for the worse: the credit inflection and multiple compression arriving together, the recession double hit that turns the two-way sensitivity into a one-way drag while reserves build.
Methodology, sourcing, and data-quality flags
This piece was built from parallel research streams (the value-chain map, the SEC filings, market action and valuation, sentiment, the macro and micro economics, a growth-levers deep dive, and a forward outlook), then run past a skeptic who argued the short side and a compliance review of the disclaimers and framing. The source hierarchy, strongest first: primary filings (the FY2025 10-K filed February 25, 2026, the Q1 2026 10-Q, the 8-K earnings releases and supplements, the November 2025 investor day, and Federal Reserve publications); analyst and institutional estimates; reputable trade press; and the piece’s own labeled scenario arithmetic. Every load-bearing financial figure was checked against the EDGAR primary source. Of 108 load-bearing claims, 104 are verified, none are disputed, and four are macro-color figures that are hedged and attributed rather than stated flat.
A note on the read itself, factor by factor, in plain terms rather than as scores. On valuation, the evidence reads rich: 2.0 times tangible book is the top of the bank’s own ten-year range (1.31 to 2.04 times, median near 1.59 times), reached at an all-time high, and on the bulls’ own excess-return math it already fully discounts the 16 percent run-rate return, leaving no margin of safety. This is the weak factor and the core of the bear. On growth, the read is genuinely strong: six straight quarters of rising net interest income, a guide raised to plus 6 to 8 percent, a $450 to $490 billion repricing runway that lifts earnings largely independent of the Fed, Merrill balances up about 10 percent, and a return that has climbed from 12.94 to 14.22 to 16.0 percent. This is the strongest pillar. On quality, the read is high but not best-in-class: an elite, empirically proven low-cost deposit moat (0.51 percent consumer cost, 26 percent noninterest-bearing, 92 percent primacy, a sub-15 percent consumer beta through 525 basis points of hikes) and a return well above the cost of equity, tempered by a 61 percent efficiency ratio that lags JPMorgan’s roughly 51 percent and the $81 billion bond cost of carry that suppresses the 2.07 percent margin. On risk, the read is net negative: the two-way rate sensitivity that creates the recession double hit, the bond overhang at about 30 percent of tangible common equity, and the office maturity wall, offset by a capital fortress, a cleared stress test, a frozen buffer, and a deposit base that makes a forced sale unlike Silicon Valley Bank. On momentum, the read is roughly neutral: a strong price trend (up about 25 percent on the year, above both moving averages), positive revisions, and a lopsided 16-Strong-Buy sell-side book, netted against an overbought all-time-high entry, the muted 0.3 percent reaction to a clear beat, and seven straight quarters of Berkshire selling. Netting it out, a high-quality, still-growing franchise priced at the top of its own range with real cyclical risk, a great company at a fully-priced stock, and the lean lands at Hold. The read would move up to Buy if returns prove durable at 17 to 18 percent while the multiple stays only fair, or on a pullback that restores a margin of safety; it would move down to Sell if the recession double hit materializes and the return reverts toward 13 percent while the multiple is still at cycle peak.
Data-quality flags:
- Point-in-time figures move fast. Every price, market cap, valuation multiple, capital ratio, moving average, peer comparison, and analyst target is stamped June 29, 2026 and will drift. The freshness bar on this piece is live-prices; treat all of it as a snapshot. The site renders a live price and market cap above this article, so the current quote there supersedes the $57.88 used in the text.
- The bond loss is economic, not regulatory. The roughly $81 billion held-to-maturity unrealized loss does not flow through accumulated other comprehensive income or regulatory capital under current US rules, so it does not reduce the reported capital ratio or tangible book. It is a real economic cost of carry that suppresses the margin and burns down over five to seven years as the bonds mature. It is framed here as both, never as a non-issue or a solvency event.
- Return on tangible common equity, stated correctly. The figure is 14.22 percent for 2025 and 16.0 percent annualized in the first quarter of 2026, not the roughly 10.5 to 11 percent that is the bank’s cost of equity. The two are sometimes confused; they are different things.
- Price to tangible book is the right multiple, and it is at the ceiling. At about 2.0 times against $28.84 of tangible book, the figure is the top of the ten-year range, not a discount to JPMorgan. Some vendor reads of tangible book bounce by a few cents (for example $28.84 versus $28.98); the difference is methodology.
- The “$40 billion buyback unlock” is an analyst estimate. It does not appear in any Bank of America primary filing. The defensible version is roughly $20 billion of current excess capital plus perhaps $8 to $10 billion of optionality from the Basel re-proposal, framed as an estimate.
- Four macro figures are hedged. The roughly 40 percent odds of a Fed hike by December are market-implied from futures and move daily. The roughly $7.75 trillion of money-market-fund assets is the Investment Company Institute reading from mid-May 2026. The industry card-delinquency aggregates are single-source and attributed. The 15-to-30 percent recession probability is an economist-consensus estimate. None of these is a rating driver, and each is attributed rather than stated as fact.
- Berkshire is disclosed tape with no asserted motive. The roughly 50 percent sell-down over seven quarters and the residual roughly $25 billion, 9.52 percent, fourth-largest position are sourced to Form 4 and 13F filings. Berkshire has stated no reason, and none is asserted here; the residual stake is treated as as material as the selling.
- The office number is a disclosure hole. Total commercial real estate is about $66 billion and commercial criticized exposure is $24.3 billion, but the specific office-subsector balance and office criticized loans were not individually disclosed in the filings reviewed. The risk is framed qualitatively against the record system-level office delinquency.
- Peer comparisons are single-vendor and point-in-time. Peer multiples, returns, and capital ratios are sourced to aggregators on dates that bounce within a few weeks; they are dated approximations, not hard facts. The Citigroup capital ratio carries a vendor discrepancy (12.7 percent primary versus 13.6 percent vendor).
- Scenarios are arithmetic, not forecasts. The bull, base, and bear dollar levels are illustrative arithmetic on stated tangible-book-growth and multiple assumptions. They are not price targets and not forecasts.
Key sources: Bank of America FY2025 10-K (EDGAR accession 0000070858-26-000157) and Q1 2026 10-Q; the Q1 2026 and Q4 2025 8-K earnings releases and supplements; the November 2025 investor day financial overview; Federal Reserve FOMC June 2026 projections, the 2026 stress-test results, the stress-capital-buffer freeze, and the March 2026 Basel III re-proposal; the Investment Company Institute for money-market-fund assets; the Mortgage Bankers Association for commercial-real-estate delinquency; gurufocus and stockanalysis.com for peer multiples and market data; and SEC Form 4 and 13F filings for the Berkshire position. Figures are point-in-time as of June 29, 2026.
This article is OSINT research for educational purposes only and is not investment advice. I am not a financial advisor, and nothing here is a recommendation to buy, sell, or hold any security. Banks carry credit-cycle, rate, and regulatory risk that can move results faster than a typical company. Figures are point-in-time as of June 29, 2026 and will change. Do your own due diligence and consult a licensed financial advisor before making any decision.