
Research date: June 22, 2026 | OSINT market research on Berkshire Hathaway Inc. (BRK.B, NYSE), its operating engines, its equity book, and a six-month to five-year outlook on the stock.
Important disclaimer. This is OSINT-based research and educational analysis, not investment advice. I am not a financial advisor. Nothing here is a recommendation to buy or sell any security, and the scenarios below are illustrative, not price targets. Berkshire is a diversified holding company and insurance conglomerate, so its risks are insurance-catastrophe and reserve risk, mark-to-market swings on a concentrated equity portfolio, regulated-utility and wildfire-liability exposure, the cyclicality of freight and energy, and key-person and succession-execution risk now that Warren Buffett has handed the CEO seat to Greg Abel. Market caps, prices, valuation multiples, and portfolio figures are point-in-time (June 22, 2026), press-reported where noted, and move fast. Do your own due diligence and consult a licensed advisor.
Where this stock could be in 6 months, 1 year, 3 years, and 5 years
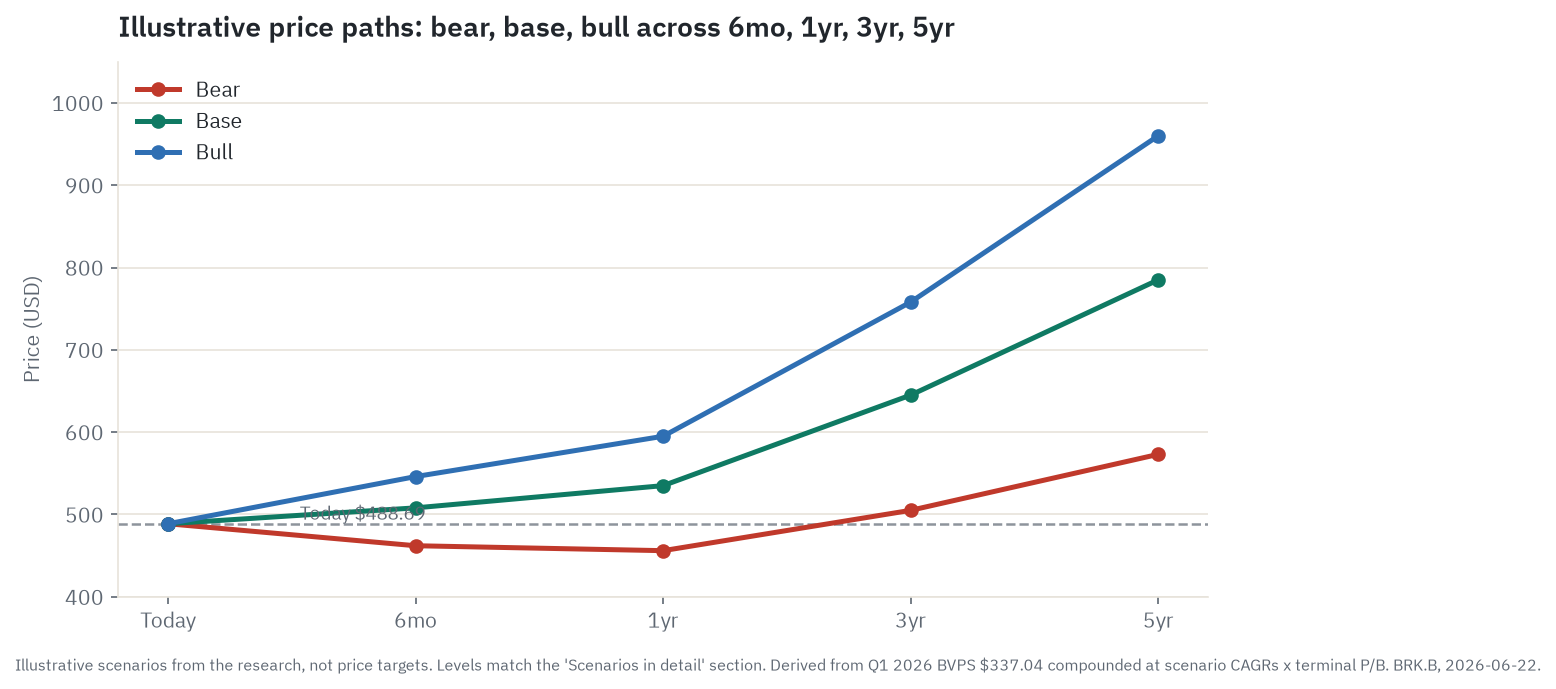
Berkshire trades at $488.69 as of June 22, 2026. Before anything else, notice how tightly the three paths below sit on top of each other. That is not laziness in the modeling. It is the math of a stock with a beta of 0.62, which has historically moved at roughly 60 percent of the broad market’s amplitude. You do not get a triple from this company in a good year, and you do not lose half of it in a bad one. The spread is narrow because the business is built to be narrow.
Six months. The near-term is governed by two earnings prints (the August 2026 Q2 report and the November Q3 report) and by what the Fed signals on rates, because a big chunk of current earnings is interest on a Treasury-bill hoard that reprices in close to real time. The stock sits just below its 200-day moving average near $490, at roughly the 31st percentile of its 52-week range, so the question is whether the fading Buffett premium stops leaking, not whether the business changes. Base case is roughly flat to modestly higher around $508. Bull case is about $546 if a sizeable deal or a clean underwriting quarter re-rates the brand. Bear case is about $462 if rate-cut odds rise and the premium keeps draining toward the level where management buys back stock. The single thing most likely to flip this window is a Fed pivot signal that reprices that T-bill income line.
One year. Book value should accrue another 9 to 10 percent, and the dominant variable becomes whether the market is willing to pay a Buffett-era multiple for an Abel-era Berkshire. Base case is about $535, mostly book-value growth at a steady multiple. Bull case is about $595 if Abel posts a visibly independent, value-accretive capital move that starts to look like a track record. Bear case is about $456, a small drawdown from here, in the slow-bleed setup where rates start falling, T-bill income fades, no large deal appears, and the multiple drifts lower. The flip variable is the pace and quality of cash deployment.
Three years. Now the structural drivers show through the noise. Base case is about $645, assuming roughly 9.5 percent annual book-value compounding at a multiple near its own median, with a softening insurance cycle and any rate normalization offset by railroad efficiency gains and partial cash deployment. Bull case is about $758, layering in an elephant-sized acquisition plus a re-rating as Abel builds a record. Bear case is about $505, which is essentially three years of 6 to 7 percent compounding at a de-rated multiple while the index laps it. The flip variable is whether the $397 billion cash pile finds a return-accretive home or just keeps growing.
Five years. This horizon is almost entirely the durability question: can a fortress that has slowed still compound at a fortress’s required rate without its builder? Base case is about $785, the slowing-but-durable compounder at roughly 10 percent a year total, in line with an 8-to-12-percent intrinsic-value forecast. Bull case is about $960, around 12 percent book-value growth plus a durable premium as the brand re-underwrites cleanly post-Buffett. Bear case is about $573, the law-of-large-numbers outcome where compounding settles near 6.5 percent, the multiple sits at the buyback floor, and return on equity stays stuck near 9 percent. The flip variable is whether return on equity recovers toward 12 percent or stays anchored near 9 percent by the idle cash.
Where the read lands today. On balance the read holds at Hold. This is a genuinely high-quality, low-risk fortress, with a roughly $176.9 billion negative-cost insurance float and a $397 billion cash war chest, compounding book value at a still-respectable but clearly slowing pace. The problem is not the business. It is the price. At about 1.45 times book the stock sits right at its own ten-year median and above the level management itself will pay to repurchase shares, so the most likely path is steady defensive compounding rather than a bargain hunt. The single thing most likely to change that read is the cash: a large, value-accretive deployment at high rates would push the lean toward Buy, while a fast rate-cut cycle that guts the T-bill income or an adverse wildfire ruling would push it toward Sell.
Companion tool
Jump to the interactive dashboard to sort and filter every company in the piece, or download the Excel model to flex the scenarios yourself.
TL;DR
Berkshire is three engines bolted to one capital-allocation node. Insurance subsidiaries hold about $176.9 billion of float that costs less than nothing because underwriting has been profitable; wholly-owned operating businesses (the BNSF railroad, Berkshire Hathaway Energy, and a manufacturing-service-retailing cluster) throw off cash; and a $288 billion public equity book pays dividends and marks up. All of it funnels to headquarters, where one person now decides where each dollar goes. That person is Greg Abel, CEO since January 1, 2026, with Buffett staying on as non-executive Chairman. FY2025 operating earnings were a record $44.49 billion, but GAAP net income of about $67 billion is mostly equity-mark noise that management itself tells you to ignore. The defining tension is the cash: about $397 billion in cash and Treasury bills earning roughly 4 to 5 percent while the operating businesses earn far more, a drag the bulls call optionality and the bears call being cornered by your own size. At about 1.45 times book the stock is near its own median and a premium to peers, and management resumed only a token buyback at this level. The biggest single risk is that combination: a slowing compounder, a key-person transition, and a price that is not cheap. The read lands at Hold.
Explore it yourself: the interactive dashboard
Open the dashboard in a full screen
What Berkshire actually is (the 90-second primer)
Most companies make a thing and sell it. Berkshire does not. It is a holding company, which means its job is to own other businesses and to decide what to do with the cash those businesses produce. Think of it less as a factory and more as a reservoir with three rivers feeding it and one engineer deciding which fields get watered.
The first river is insurance. GEICO sells auto policies, Berkshire Hathaway Reinsurance Group writes the giant catastrophe and specialty risks that few others will touch, and Berkshire Hathaway Primary writes commercial lines. The second river is the wholly-owned operating businesses: BNSF, one of two big freight railroads in the western United States; Berkshire Hathaway Energy, a set of regulated electric and gas utilities serving about 5.4 million customers; and a sprawling collection of manufacturers, service companies, and retailers anchored by Precision Castparts (aerospace parts) and Marmon (more than 150 industrial businesses). The third river is a portfolio of publicly traded stocks, worth about $288 billion at the end of the first quarter of 2026, with Apple, American Express, Coca-Cola, Bank of America, and Chevron at the top.
Berkshire pays no dividend, and has not since 1967. When it returns cash to shareholders at all, it does so by buying back its own stock, and even that is paused most of the time. There are two share classes. Class A shares (BRK.A) traded around $733,610 in mid-June 2026, which is too expensive for most people to buy a single share. Class B shares (BRK.B) exist precisely to solve that. One Class A share equals 1,500 Class B shares economically, a fixed ratio set when the B shares were last split in 2010. The catch is voting: a B share carries only one ten-thousandth of an A share’s vote, so the small base of A holders keeps control.
Here is the one analogy worth holding onto. Insurance float is money other people gave Berkshire that it has not yet had to pay back. An ordinary company that wants to invest with borrowed money pays interest for the privilege. Berkshire’s float works like a loan where the lender pays you to hold their money, because in most years the premiums it collects exceed the claims and expenses it pays out. That is the engine under everything else.
How the money flows
flowchart TD
    PREM["Policyholders\nAuto/P&C/Life premiums\n~$89B earned FY2025"]
    GEICO["GEICO\nAuto insurer, CR 84.7%\n$6.8B underwriting FY2025"]
    BHRG["BH Reinsurance\nGlobal cat & specialty\n$1.9B underwriting FY2025"]
    BHPG["BH Primary\nCommercial lines\n$785M underwriting FY2025"]
    FLOAT["Insurance Float\n$176.9B at Mar 2026\nNegative-cost leverage"]
    TBILLS["T-bill + Equity Portfolio\n$288B equities + $373B T-bills\n$12.5B inv. income FY2025"]
    HQ["BRK HQ - Capital Allocator\nAbel CEO since Jan 2026\n$44.5B operating earnings FY2025"]
    BNSF["BNSF Railway\nDuopoly Class I railroad\n$5.5B after-tax OE FY2025"]
    BHE["BHE Utilities\nRegulated monopoly, 5.4M customers\n$4.0B after-tax OE FY2025"]
    MSR["Mfg/Service/Retail\nPCC, Marmon, McLane, NetJets\n$13.6B after-tax OE FY2025"]
    EQPORT["Public Equity Portfolio\nAAPL, AXP, KO, BAC, GOOGL\n$288B fair value Mar 2026"]
    CASHPILE["T-bill Hoard\n$397B at Mar 2026\n~$12-16B annual interest"]
    DEPLOY["Capital Reallocation\nAcquisitions/Buybacks/Equities/T-bills\nOxyChem $9.7B; Taylor Morrison $8.5B"]

    PREM --> GEICO
    PREM --> BHRG
    PREM --> BHPG
    GEICO --> FLOAT
    BHRG --> FLOAT
    BHPG --> FLOAT
    FLOAT --> TBILLS
    TBILLS --> HQ
    BNSF --> HQ
    BHE --> HQ
    MSR --> HQ
    EQPORT --> HQ
    HQ --> CASHPILE
    HQ --> DEPLOY
    DEPLOY --> BNSF
    DEPLOY --> BHE
    DEPLOY --> MSR
    DEPLOY --> EQPORT
    DEPLOY --> CASHPILE
Read the diagram top to bottom. Premiums come in at the top from policyholders and split across GEICO, the reinsurance group, and the primary group. Because Berkshire pays claims years after it collects premiums, a large pool of investable money builds up in the middle: the float, about $176.9 billion as of March 2026. The insurance subsidiaries pour that float into Treasury bills and into the public equity portfolio, and the income those assets produce flows up to headquarters. So do the cash dividends from BNSF, Berkshire Hathaway Energy, and the manufacturing-service-retailing cluster. So do the dividends from the stock portfolio.
Everything pools at one node: the parent company, where Abel now sits. From there, cash goes to exactly four places. It buys whole businesses (OxyChem closed in January 2026, Taylor Morrison was announced in May). It adds to the stock portfolio (Abel tripled the Alphabet stake and then committed another $10 billion). It buys back Berkshire shares, but only when the stock trades below his estimate of intrinsic value, which is why it is usually paused. Or, when nothing better is available, it sits in Treasury bills, which is where most of it sits now.
The investing point is the shape, not any one number. Float is leverage you get paid to hold, which is a structural advantage almost no one else has at this scale. But the leverage only matters if the cash it generates gets allocated well. The bottleneck is that single decision node at the bottom of the diagram. For sixty years that node was Warren Buffett. Since January it has been Greg Abel. The entire value of Berkshire exits through this one chokepoint, and the quality of the decisions made there is, quite literally, the product.
The insurance operations: GEICO, reinsurance, and the float
Insurance is the engine room. It does two jobs at once. It earns underwriting profit when premiums beat claims, and it generates the float that funds everything else.
GEICO is the auto insurer, the most visible piece, and it has just come through a hard turnaround. Under Todd Combs (who has since left Berkshire for JPMorgan), GEICO went from a $1.9 billion underwriting loss in 2022 to a $7.8 billion pre-tax profit in 2024, a swing of nearly $9.7 billion, achieved by cutting roughly 14,000 jobs, retiring 600 legacy software applications, tightening underwriting, and using telematics to price risk more precisely. The combined ratio (claims plus expenses as a share of premiums, where under 100 percent means a profit) fell from above 100 in 2022 to 81.5 percent in 2024 and 84.7 percent for full-year 2025. GEICO earned about $6.824 billion pre-tax in 2025. The unfinished business is growth: Abel acknowledged at the 2026 annual meeting that GEICO’s policies-in-force grew only 2 percent in the first quarter against Progressive’s 11 percent, and the technology rebuild is described as being in its fifth year. Nancy Pierce replaced Combs as GEICO CEO in December 2025.
Berkshire Hathaway Reinsurance Group is the part that takes on the risks nobody else will, run by Ajit Jain. This is super-catastrophe and specialty cover, plus retroactive reinsurance, where Berkshire accepts long-tail liabilities for an upfront premium. It is lumpy by design. Pre-tax results here were about $1.851 billion in 2025, dragged by more than $1 billion of retroactive run-off losses and $711 million of periodic-payment-annuity losses, which are known structural costs rather than surprises.
Berkshire Hathaway Primary writes commercial lines and earned about $785 million pre-tax in 2025.
Put the segments together and the consolidated property-and-casualty combined ratio was 87.1 percent for 2025, against a five-year average of 90.7 percent and a ten-year average of 93.0 percent. Every one of those is below 100, which is the whole point: the float has cost less than nothing to hold.
That float reached about $176 billion at the end of 2025, up from $171 billion a year earlier and from $88 billion ten years ago, and about $176.9 billion by March 2026. Buffett has framed it directly: Berkshire grew float from roughly $46 billion two decades ago to $171 billion in 2024 while generating about $32 billion in cumulative after-tax underwriting profit along the way. The way Abel explained the mechanics at the 2026 meeting: at a long-run combined ratio near 93 percent, roughly 70 cents of every premium dollar flows into the claims reserve and stays there three to four years in personal and small-commercial lines, longer in long-tail lines. That pool, at Berkshire’s scale, functions as cost-free debt that never has to be repaid, only rolled over as new policies replace old ones.
The income on the float is large and, right now, rate-sensitive. Total insurance investment income was $12.513 billion in 2025, down $1.2 billion (8.5 percent) from 2024, a decline management attributed directly to lower interest rates and dividend income in the second half of the year. That sensitivity matters for the whole thesis, and it comes up again later.
Two cautions on the insurance engine. First, the cycle is rolling over. Commercial property rates fell roughly 9 percent in the fourth quarter of 2025, double-digit declines are projected for 2026, and the industry combined ratio is forecast to rise toward 97 percent from 94. Abel has said plainly that Berkshire “will write less property and casualty business for a period of time,” which is the disciplined response but also means less underwriting profit ahead. Float stays cost-free only while the combined ratio stays below 100; a soft market plus social inflation in casualty lines is exactly the combination that could flip it. Second, Jain is 74 and has no stated retirement date. Charlie Shamieh, the Gen Re chairman, was named his successor in May 2026, but has not formally started. That is a second key-person risk sitting behind the first.
The wholly-owned operating businesses
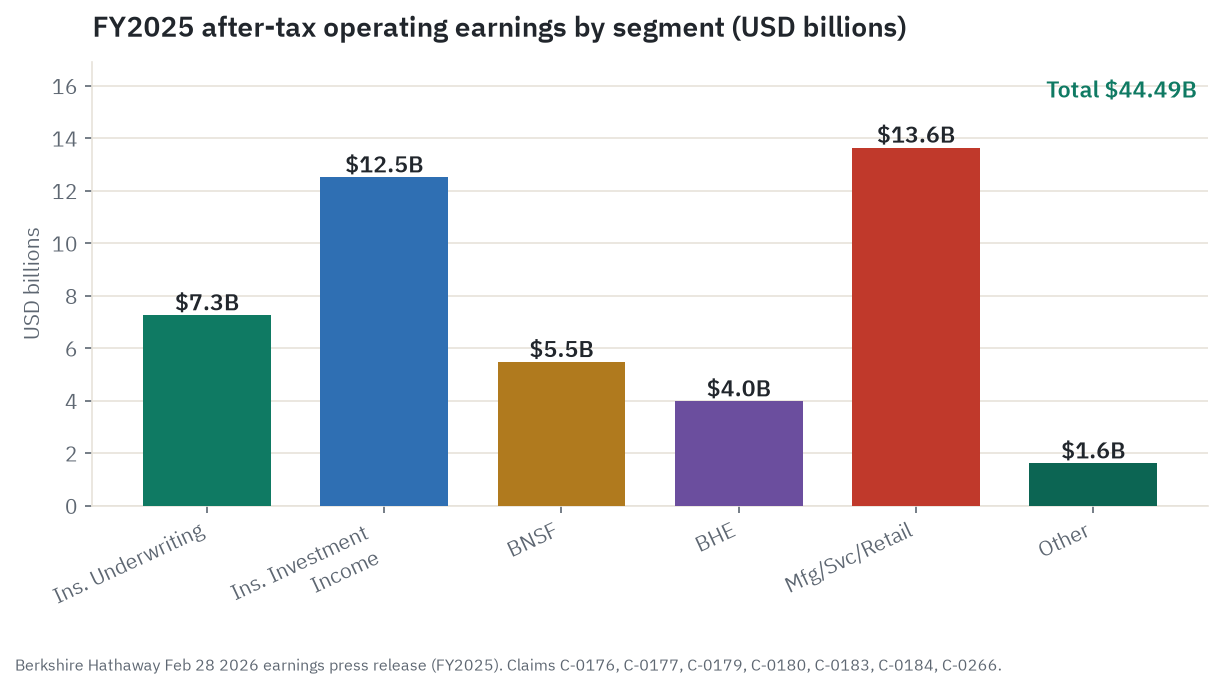
These are the businesses Berkshire owns outright. The chart below shows where the after-tax operating earnings came from in 2025.
BNSF Railway is one of two Class I railroads serving the western United States; Union Pacific is the other. New track does not get built, so western freight rail is effectively a two-player market, and the network itself is the moat. BNSF earned $5.476 billion in segment net earnings in 2025, up 8.8 percent, on roughly $23.3 billion of revenue that was about flat. The number Abel cares about is the operating ratio, which measures costs as a share of revenue, where lower is better. BNSF ran 65.5 percent in 2025, an improvement from 68.0 percent, but still well behind Union Pacific’s roughly 59 to 60 percent. Abel called that gap “too wide” in his first shareholder letter and said the team “will be disappointed if substantial improvement is not delivered.” The stakes are concrete: each one percentage point of operating-ratio improvement is worth about $230 million in incremental cash flow. BNSF returned $4.4 billion in dividends to the parent in 2025 and is a freight business, so a real recession would pressure volumes; industrial carloads already fell 4.6 percent in 2025 in a non-recessionary year.
Berkshire Hathaway Energy is the regulated-utility arm: PacifiCorp, MidAmerican Energy, and NV Energy, serving about 5.4 million customers across six states, plus pipeline assets and one of the largest US wind fleets. BHE earned $3.979 billion in segment operating earnings in 2025, up from $3.730 billion, helped by wildfire accruals falling to $100 million from $346 million the prior year. Utility earnings are durable but capped by regulators, and BHE is in a heavy capital-spending phase, with a roughly $33.3 billion plan for 2026 through 2028, much of it grid and renewables. That capex limits how much cash BHE can send upstream.
The wildfire liability deserves its own careful paragraph, because the headline numbers get misread. PacifiCorp has accrued about $2.85 billion of cumulative probable wildfire losses through year-end 2025 (rising to roughly $2.9 billion by the first quarter of 2026), of which about $1.7 billion has been paid, with insurance recoveries exhausted and none expected going forward. Berkshire states it is “reasonably possible PacifiCorp will incur significant additional losses beyond the amounts currently accrued.” There is also a much larger figure in circulation: plaintiffs in Oregon mass complaints are seeking at least roughly $46 billion in claimed damages, per S&P Global. That $46 billion is a demand, not a liability Berkshire owes or has been ordered to pay. It is what plaintiffs are asking for, not a determined loss. The most-cited case, the James class action, had its verdict reversed and remanded by the Oregon Court of Appeals on April 8, 2026, on a procedural jury-instruction ground, which means substantive liability is not decided; plaintiffs petitioned the Oregon Supreme Court in May 2026. Separately, PacifiCorp settled the US federal government’s wildfire claims for $575 million in February 2026, which bounds the federal piece only; the private litigation remains open-ended. Treat all of this as a contingency with a wide and unresolved range, not as a settled bill.
Manufacturing, Service and Retailing, or MSR, is the catch-all and, at $13.647 billion of operating earnings in 2025 (up 4.4 percent), it is the single largest wholly-owned earnings engine, roughly 31 percent of total operating earnings. Inside it: Precision Castparts, the aerospace-forgings business that has finally recovered, with FY2024 revenue of about $10.4 billion and pre-tax earnings up sharply as Boeing and Airbus production ramped; Marmon, a 150-plus-business industrial group; McLane, a very low-margin food distributor that did about $51 billion of revenue and $676 million of pre-tax earnings; Lubrizol, a specialty-chemicals business that has been declining; Clayton Homes in manufactured housing; and NetJets, FlightSafety, and Pilot in services. The MSR cluster is mixed: Precision Castparts holds strong positions in certain aerospace grades, while McLane and Pilot run on thin commodity margins that swing with fuel.
The marketable equity portfolio
The stock portfolio is worth about $288 billion as of March 31, 2026 (down from $297.778 billion at year-end 2025 as the market eased), all held inside the insurance subsidiaries. The 13F filing, which captures only US holdings, showed $263.1 billion across 29 positions. The gap between the two figures is mostly the five Japanese trading houses, worth about $35 billion, which are not reported in a US 13F.
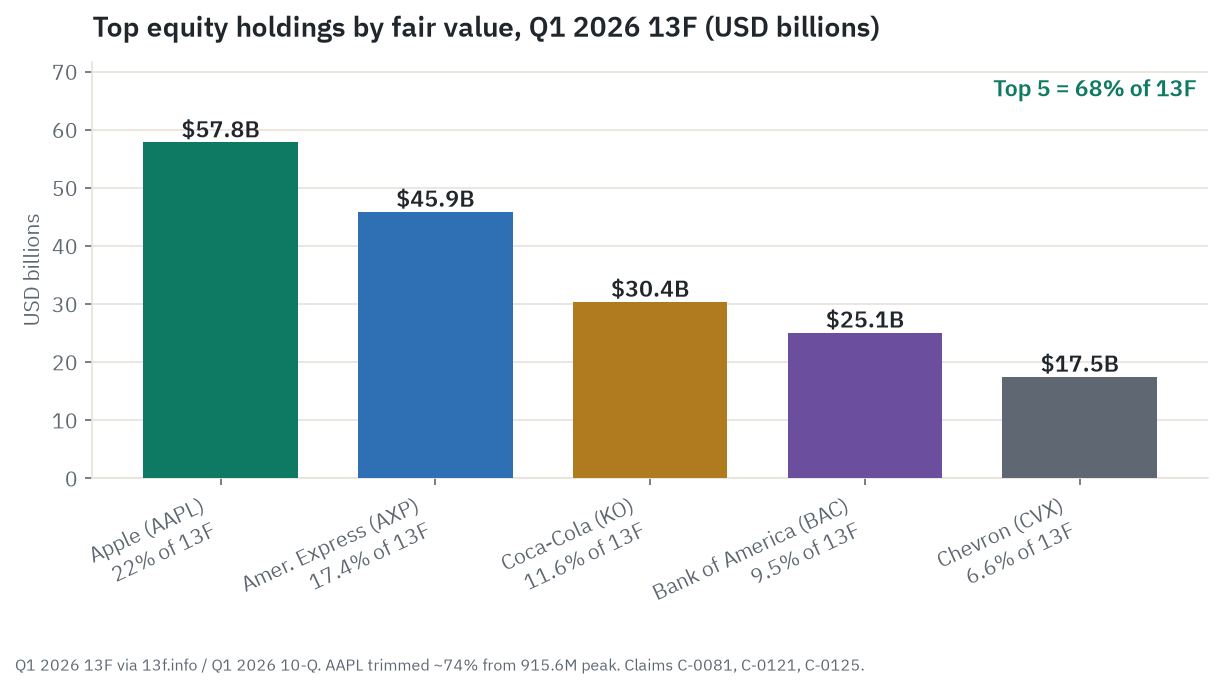
The portfolio is concentrated. The top five names made up about 68 percent of the total at the end of the first quarter, up from 65 percent three months earlier, as the position count fell. Apple alone is about $57.84 billion, or 22 percent of the 13F. American Express is about $45.9 billion, Coca-Cola about $30.4 billion, Bank of America about $25.1 billion, and Chevron about $17.5 billion. The embedded gains are enormous: the core holdings, nearly two-thirds of the portfolio, carry a combined cost basis of only about $24.5 billion and throw off roughly $2.5 billion a year in dividends, which is a yield on original cost of around 10 percent.
The single most important fact about this portfolio is what has been done to it. Berkshire has been a net seller of equities for at least 14 consecutive quarters through the first quarter of 2026, with cumulative net selling press-estimated at about $195 billion. The Apple position is the clearest example: it peaked at 915.6 million shares in the third quarter of 2023 and now stands near 228 million, a cut of about 74 to 75 percent. The selling rationale, per Buffett, was a mix of pre-empting an expected rise in corporate capital-gains tax rates, valuation discipline as Apple’s multiple expanded toward 28 to 32 times earnings, and trimming concentration. The pace of net selling collapsed in 2025 (net selling of about $13.8 billion against $134.2 billion in 2024) and Apple selling appears to have paused under Abel.
There is a debate to be honest about here. Berkshire is arguably the most informed seller of US equities alive, and for years its revealed message was that it would rather hold Treasury bills than own stocks at these prices. You can read that two ways. The bull reads it as discipline and as a defensive posture that protects shareholders in a drawdown. The bear reads it as a no-confidence vote: you cannot sell $195 billion of equities and simultaneously claim the equity book is a great compounding engine. Both readings start from the same disclosed facts. What is not in dispute is that this is a debated interpretation of management’s actions, not a stated Berkshire prediction about the market.
The new wrinkle is Alphabet, and it is Abel’s signature so far. Berkshire started a small Alphabet position in late 2025, then tripled it to about $17 billion in the first quarter of 2026, then committed a further $10 billion in June through a private placement (split $5 billion of Class A at $351.81 and $5 billion of Class C at $348.20) as part of Alphabet’s equity raise for AI infrastructure. That second tranche is not yet in any 13F. The crowd framed this as “Berkshire bets on AI,” but the more Berkshire-like reading is that Abel paid a price he judged fair for a dominant, cash-generative franchise. Abel’s first shareholder letter named four “quasi-forever” holdings: Apple, American Express, Coca-Cola, and Moody’s. Bank of America and Chevron were notably absent, which several observers read as a signal of possible future trims.
The record cash and Treasury-bill pile
This is the number that dominates the Berkshire conversation in 2026, and it is the heart of both the bull and the bear case.
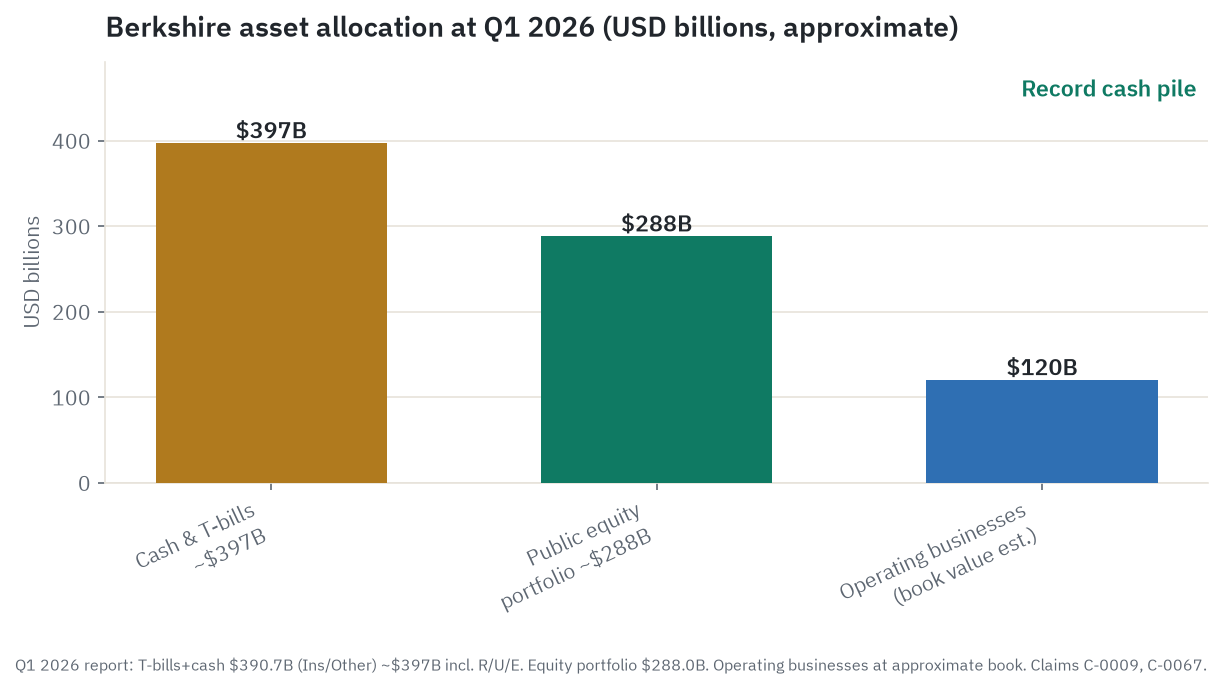
At March 31, 2026, Berkshire held about $397.4 billion in cash and Treasury bills (roughly $51.5 billion cash plus $339.3 billion in T-bills, counting all segments), the highest in its history. The trajectory tells the story: roughly $128 billion at the end of 2022, then $168 billion, then $334 billion, then $373 billion at the end of 2025, then $397 billion. At one point in 2025 Berkshire’s Treasury-bill holdings were estimated at about 5 percent of the entire US T-bill market, which is itself a way of saying the company has more money than it can easily put to work.
How did it get so big? Two things at once. Berkshire generates about $46 billion of operating cash flow a year and pays no dividend, so cash piles up unless it is spent. And the net equity selling described above turned stock into T-bills rather than into other stocks or whole companies, because management judged prices too high.
What does it earn? Less than the operating businesses do. At roughly 4 to 5 percent, about $397 billion produces somewhere in the range of $12 to $16 billion of interest a year, though Berkshire does not report this as a single clean line, so treat that range as an estimate assembled from the insurance investment income and the headquarters “other” income. Compare that to the 10 to 15 percent the operating businesses earn on capital and you see the bear case immediately: cash earning a T-bill yield while the equity base keeps swelling is a drag on return on equity, which ran about 9.3 to 9.7 percent in 2025 against a ten-year median near 12 percent.
The bull case is that the pile is dry powder, not dead weight. Abel called it exactly that in his first letter: capital that supports the insurance operations and protects against extreme scenarios, but also “our dry powder.” Cash does not lose value when markets fall 30 percent, and a true dislocation would let Abel buy at distressed prices in $50-billion-plus increments that almost no one else could write a check for. The catch, and it is a real one, is that the bull case needs two things that usually do not coexist: rates have to stay high enough that the T-bill income holds up, and a dislocation has to arrive while rates are still high so the cash can be deployed cheaply. You generally cannot have both.
Abel has started spending. OxyChem closed for about $9.5 to $9.7 billion in January 2026, Taylor Morrison was announced in May at about $8.5 billion enterprise value (roughly $6.8 billion of equity, $72.50 per share, a 24 percent premium), and the Alphabet commitments total about $27 billion. Add it up and that is around $28 billion deployed in six months, which is real but still less than a single year of operating cash flow. Absent an elephant-sized deal, the pile grows faster than these deals draw it down.
Company by company: who’s who
This piece centers on one stock, but the thesis runs through the names Berkshire owns and the peers it is measured against. Each entry below is dated and point-in-time, with a real bull and a real bear.
Berkshire Hathaway (BRK.B) - NYSE, market cap about $1.05 trillion as of June 22, 2026. The diversified holding conglomerate described throughout this piece: insurance float, wholly-owned businesses, the equity book, and the record cash pile. Q1 2026 operating earnings were $11.35 billion, up about 18 percent year over year. Bull: the $397 billion war chest becomes a once-a-decade weapon if markets dislocate, and Abel’s early deal pace suggests the machine runs without Buffett. Bear: roughly $397 billion in Treasury bills earning about 5 percent while the index compounds faster is structural drag, and the Buffett premium has already compressed under an unproven CEO and may not fully recover.
The structural peers (float-and-invest holding companies)
Markel Group (MKL) - NYSE, about $23.3 billion. The closest structural analog, often called a “baby Berkshire”: specialty insurance float invested in equities and in wholly-owned businesses through Markel Ventures. Q1 2026 adjusted operating income rose 4 percent to $498 million on better underwriting, though a net loss of $273 million reflected mark-to-market investment swings. P/B about 1.28 times, roughly 10 percent below its own ten-year median. Bull: if Berkshire loses its valuation premium, capital can rotate to the next-best float-investing franchise at a cheaper multiple. Bear: premiums are shrinking as the market softens, and there is no Buffett-equivalent to anchor confidence.
Fairfax Financial (FRFHF) - OTC for US investors, primary listing TSX:FFH, about $37 billion. A Canadian property-and-casualty insurer and holding company built explicitly on the float-and-invest model under Prem Watsa. Q1 2026 net premiums written rose 4.2 percent, with an underwriting profit and a combined ratio of 94.1 percent. Bull: insurance earnings are accelerating and the multiple is modest. Bear: Watsa succession is opaque, the balance sheet carries total-return swaps on its own shares, and the US listing is thin.
Loews Corporation (L) - NYSE, about $22.2 billion. A Tisch-family conglomerate: CNA Financial (insurance, the earnings anchor), Boardwalk Pipelines, and Loews Hotels. The cheapest of the three peers at roughly 1.15 times book, a classic holding-company discount. Bull: capital discipline and CNA’s reserve cushion leave room for buybacks to close the discount. Bear: CNA faces reserve-development headwinds, and the discount has no near-term catalyst.
The railroad comparable
Union Pacific (UNP) - NYSE, about $159 billion. The other western Class I railroad, and the cleanest public benchmark for BNSF, which Berkshire owns outright and does not list separately. Q1 2026 revenue of $6.2 billion, up 4 percent, with a record adjusted operating ratio of 59.9 percent. Bull: a western freight duopoly with pricing power and a long efficiency runway. Bear: a freight recession would compress volumes, and auto-related freight is already soft.
The top portfolio holdings (proxies for the equity book)
Apple (AAPL) - NASDAQ, about $4.41 trillion. Berkshire’s largest equity holding at about $57.8 billion, named a quasi-forever holding by Abel even as Berkshire cut the position about 75 percent from its peak. Bull: on-device AI could add a recurring services layer to 2.2 billion active devices. Bear: China exposure to tariffs and local competition, a valuation near 28 times earnings that leaves no room for a stumble, and Berkshire’s own heavy trimming as a price-sensitivity tell.
American Express (AXP) - NYSE, about $213 billion. The number-two holding at about $45.9 billion, and a quasi-forever name. Q1 2026 revenue rose 11 percent and EPS 18 percent on 10 percent card-member spending growth. Bull: a premium, high-income cardholder base that spends resiliently. Bear: the consumer-credit cycle is turning, and a hard recession would hit the revolving book.
Coca-Cola (KO) - NYSE, about $342 billion. Held since 1988, about $30.4 billion, on a roughly $1.3 billion cost basis that makes the yield on cost enormous. Q1 2026 organic revenue rose 10 percent. Bull: pricing power and a 50-percent-plus yield on cost make it effectively a royalty. Bear: GLP-1 drugs and a health shift could reduce cola volumes over a decade.
Bank of America (BAC) - NYSE, about $399 billion. The number-four holding at about $25.1 billion, after Berkshire sold roughly 352.6 million shares in 2024 and 2025. Q1 2026 net income of $8.6 billion, up 17 percent, with net interest income guidance raised. Bull: a multi-year net-interest-income tailwind from asset repricing and an unmatched retail-banking scale. Bear: long-duration bond risk if rates spike, and Berkshire’s selling pressure may return. Abel’s letter omitted BAC from the quasi-forever list.
Chevron (CVX) - NYSE, about $373 billion. The number-five holding at about $17.5 billion. Q1 2026 adjusted EPS of $1.41 beat estimates, with production up sharply on the Hess integration. Bull: Guyana barrels and an aggressive buyback. Bear: Abel excluded CVX from the forever list and Berkshire has trimmed; oil below $65 a barrel cuts free cash flow and may prompt further sales.
Alphabet (GOOGL) - NASDAQ, about $4.22 trillion. Built from scratch under Abel to about $17 billion in the Q1 2026 13F, then augmented by a $10 billion June private placement, the first primary-market equity commitment in Berkshire’s history. Q1 2026 revenue rose 22 percent, with Google Cloud up 63 percent and AI capex guided to $180 to $190 billion. Bull: cloud and AI compounding fast, with Berkshire’s placement struck below the market price. Bear: a bet-the-company capex program and a valuation near 23 times revenue with no margin of safety if AI cloud commoditizes.
What the filings say
Lead with the right number. Berkshire’s GAAP net income swings wildly because accounting rules force it to mark its equity portfolio to market every quarter, and management says so in plain language: investment gains or losses in any quarter are “usually meaningless” and produce per-share figures that “can be extremely misleading.” So the metric to watch is operating earnings, which strips out those marks.
Operating earnings. FY2025 operating earnings were $44.49 billion, down from $47.44 billion in 2024. The first quarter of 2026 came in at $11.346 billion, up 17.7 percent from $9.64 billion a year earlier. The segment split for 2025: insurance underwriting $7.258 billion, insurance investment income $12.513 billion, BNSF $5.476 billion, Berkshire Hathaway Energy $3.979 billion, manufacturing-service-retailing $13.647 billion, and other $1.613 billion (which includes about $3.566 billion of headquarters investment income on T-bills, offset by currency losses and impairments).
GAAP net income, flagged. GAAP net earnings were about $67.0 billion in 2025, $89.0 billion in 2024, and $96.2 billion in 2023. Those figures are dominated by after-tax investment gains ($30.7 billion in 2025, $41.6 billion in 2024, $58.9 billion in 2023), which is exactly the noise management tells you to ignore. Do not read the year-over-year decline in GAAP net income as a business deterioration; it is mostly the market moving.
Revenue. Consolidated GAAP revenue was about $371.4 billion in both 2025 and 2024 and $364.5 billion in 2023, essentially flat. Berkshire does not grow revenue in the conventional sense; book value per share and operating earnings are the metrics that matter.
Cash flow and the balance sheet. Operating cash flow was $46.0 billion in 2025 against $20.9 billion of capex, leaving roughly $25 billion of free cash flow; BHE alone spent $10.589 billion of that capex and BNSF $3.796 billion. Total assets were about $1.222 trillion at year-end 2025 and $1.252 trillion by March 2026. Berkshire shareholders’ equity was $717.419 billion at year-end 2025, rising to $727.181 billion by March 2026, which works out to book value per B-equivalent share of about $337.04. Gross debt is about $129 billion, but most of it sits at BNSF and BHE as standalone obligations that the parent does not guarantee, and against $397 billion of cash the parent’s net debt is deeply negative.
Capital returns and dilution. No dividend since 1967, and none expected. Buybacks were zero in 2025, after $2.918 billion in 2024 and $8.976 billion in 2023; the program resumed at about $235 million in the first quarter of 2026, the first repurchases in roughly 21 months, at about 1.45 times book. There is no buyback cap and no expiration, but Berkshire will not repurchase if doing so would push consolidated cash and T-bills below $30 billion. Share count barely moves; the company does not dilute through stock comp.
The disclosed risks that matter. The 10-K names a short list of risk factors worth taking at face value. Key-person and succession risk is first: the filing states Berkshire is “dependent on a few key people for our major investment and capital allocation decisions,” naming Abel as the primary allocator and Jain on insurance. Catastrophe and reserve risk is second: Berkshire accepts more catastrophe risk than any other insurer, targets no more than $15 billion of pre-tax loss from a single event, and carried $151.8 billion of unpaid property-and-casualty reserves at year-end. The BHE wildfire and utility-regulation risk is third, covered above. Equity concentration is fourth: the filing warns that a sharp decline in its larger holdings could materially reduce consolidated equity. There is also a separate disclosed matter, the HomeServices real-estate-commission antitrust litigation: a jury found against the defendants in the Burnett case in October 2023, all defendants have since settled, and an appeal was pending at the Eighth Circuit with oral argument in January 2026 and a ruling pending. Trebling is possible under federal antitrust law but is not a foregone conclusion.
Ownership. Buffett remains the dominant individual holder through Class A shares, though his steady gifting program (he converts A shares to B shares and donates the B shares, which preserves voting power) has reduced his count over time; mid-2025 figures put him near 32 percent of the vote and 15 to 16 percent of the economics. Institutional ownership is about 52 percent, led by the index giants Vanguard, BlackRock, and State Street. One analyst’s post-death scenario, attributed to RationalWalk, projects his remaining A shares converting and distributing over roughly 12 years, which would keep a hostile governance shift unlikely for decades; that is an analyst projection, not a stated fact.
What the market is paying
The right valuation lens for Berkshire is price-to-book, not price-to-earnings, precisely because GAAP earnings are distorted by those equity marks.
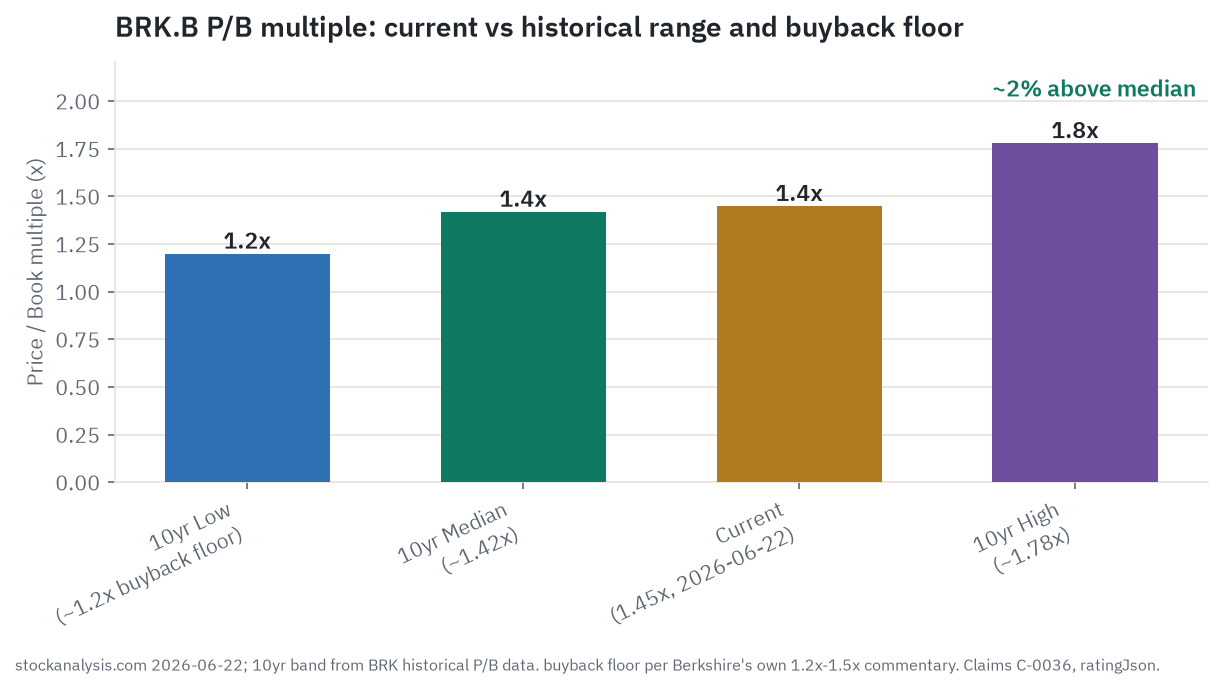
Price-to-book is 1.45 times as of June 22, 2026, confirmed across four data vendors. Book value per B-share is about $337.04. The ten-year P/B band runs from roughly 1.2 times at the low to about 1.78 times at the high, with a median near 1.42. So at 1.45 the stock is about 2 percent above its own median: not cheap, not rich, sitting essentially at the middle of its own ten-year range. The one nuance that tilts it toward “a shade rich” is the buyback signal. Berkshire has historically repurchased stock around 1.2 times book or below; at 1.45 the buyback is essentially paused, and the token $235 million resumption in the first quarter says the most informed buyer of these shares sees this zone as marginal at best.
The earnings multiples need a health warning. Trailing P/E is about 14.55 times, but that is computed on GAAP EPS that includes the equity marks, so it is artificial. Forward P/E is about 23 times, which is higher precisely because analysts forecast lower GAAP EPS ahead as the marks reverse; it embeds the same distortion and should not be read as a clean growth multiple. EV/EBITDA is about 6.7 times, which looks strikingly low until you realize the enterprise-value calculation nets out the roughly $397 billion cash pile, so that low multiple is really just a statement of how much of the market cap is a T-bill fund. The cleaner gauge remains price-to-book.
Relative strength. This has been a weak stretch for the stock. BRK.B is down about 2.67 percent year to date against an S&P 500 up roughly 9 to 10 percent, and it lagged the index by about 37 percentage points over the trailing twelve months, the worst relative showing since 2000. The stock sits just below its 200-day moving average near $490, at about the 31st percentile of its 52-week range of $455.19 to $516.85. The character is calm, though: beta 0.62, 30-day realized volatility under 13 percent, a maximum drawdown of about 10 percent from the May 2025 all-time high near $540. In the 2022 bear market BRK.B fell only 3.3 percent while the S&P fell 18 percent. It protects on the downside and lags in risk-on rallies, which is exactly what happened in the AI-led runs of 2023 through 2026.
Against peers, Berkshire trades at a premium on price-to-book: 1.45 times versus Markel’s roughly 1.28, Loews’ roughly 1.15, and Fairfax’s roughly 1.23 to 1.35 (vendors disagree on Fairfax, so read it as a range). That premium is the Berkshire brand tax, the expectation of capital-allocation superiority and a fortress balance sheet. Whether it survives the Abel era at scale is the open question.
Sell-side coverage is remarkably thin for a trillion-dollar company: about four analysts, consensus Buy, with a mean target near $520 and a range from roughly $481 to $570. UBS sits at $570, the lone Hold (DBS) at $500. With so few opinions, treat any target as the view of a handful of people, not a market verdict. These are analyst opinions, not facts about the business.
What the crowd is saying
The dominant story in 2026 is the Abel transition and whether Berkshire’s brand of patient, capital-allocation-driven compounding survives the departure of its architect. Coverage is heavy and split. One strand follows Abel-the-operator with cautious optimism: the OxyChem close, the tripled-then-augmented Alphabet stake, and the Taylor Morrison deal, which Buffett publicly praised (“Greg did that faster than I could have done it, smoother than I could have done it, and I never talked to the CEO”). That quote traveled widely as a passing of the torch. The other strand is louder and reads the cash pile as a bearish market omen, with headlines about a “30 percent profit plunge” alongside record cash.
That second narrative is where the crowd and the filings diverge most sharply, and it is worth being precise about. The “profit plunge” was GAAP net income falling on equity-mark timing, not operating earnings, which were stable to rising. Operating earnings were actually up 18 percent year over year in the first quarter of 2026. The financial press conflates GAAP volatility with business deterioration almost every quarter the market moves, and a reader relying on headlines would come away materially more negative than the filings support. The cash pile, likewise, gets decoded as a directional market call when management explains it as valuation discipline and a scarcity of attractively priced large targets. The crowd assigns macro prescience to what is, in management’s telling, a capital-allocation constraint.
The retail and social signal is soft and should be read as such. BRK.B is a low-chatter, held-not-traded stock; mention-frequency and search-interest proxies sit below the peer median, and there is no sign of coordinated promotion or thin-float hype, which the share structure and the trillion-dollar cap make structurally unlikely anyway. The recurring “is Berkshire dead money in the AI era?” thread got fresh legs from the underperformance, but it competes with a quieter, better-sourced counterpoint: the business is fine, the multiple expanded elsewhere. The Alphabet buy drew genuine interest in value circles, mostly read as “Abel will buy quality at a fair price” rather than as an AI bet. None of these social reads carries a number you should treat as fact.
Durability: the Greg Abel transition and whether the machine still compounds
This is the section the whole piece has been building toward, because Berkshire’s value collapses to a single dependency: the quality of the decisions made at that one capital-allocation node.
What changed and what did not. Abel became CEO on January 1, 2026, after running Berkshire Hathaway Energy and serving as vice chairman for the non-insurance businesses; he oversaw more than $41 billion of renewable investment at BHE and is, by background, an operator rather than a portfolio manager. Buffett, 95, stayed on as non-executive Chairman, has said he will “go quiet sort of” and leave decisions to Abel, and visits Omaha in an advisory capacity. Jain stays as vice chairman for insurance. The structure was formalized when the board separated the chairman and CEO roles by bylaw in September 2025. What changed in tone: Abel is more hands-on, took on the chief-risk-officer role and the bulk of the portfolio directly (with Ted Weschler still running about 6 percent), and added rotating subsidiary CEOs to the annual meeting. His first letter stressed continuity of the five pillars (decentralization, integrity, financial strength, risk management, operational excellence) and reaffirmed the no-dividend, buy-back-only-below-intrinsic-value posture.
The key-person discount, made concrete. The price-to-book multiple compressed from about 1.8 times to about 1.45 over the year as Buffett stepped back, and the stock lagged the index by 37-plus points. It is tempting to call the whole gap a succession discount, but that would be wrong: the trailing year was dominated by an AI-driven tech rally that Berkshire barely participated in, plus the cash drag in a rising market. The honest framing is that several forces overlap. The Oracle premium has visibly compressed; how much of the underperformance is that versus the AI rotation versus the cash drag cannot be cleanly separated. CFRA’s Cathy Seifert noted Abel “has never professionally managed investment funds,” and UBS’s Brian Meredith said Buffett’s exit “prompted some holders to sell.” Against that, Abel deployed more than $28 billion in his first six months, and Buffett called the leadership choice “100 percent successful.”
The second key-person risk. Beyond Buffett there is Jain, 74, with a named successor (Shamieh) who has not started and no retirement date, and there is the fact that Todd Combs left for JPMorgan in December 2025, leaving Abel personally running most of a $288 billion portfolio he has no public track record managing. The bull case books “Jain stays” as continuity, but that is a 74-year-old continuity.
The structural case versus the bear case. The structural argument is genuinely strong: a negative-cost float, a fortress balance sheet ($717 billion of equity, $397 billion of liquidity), diversified cash-generative engines, and the optionality of the cash pile in a dislocation. The bear case, steel-manned, is just as coherent: the law of large numbers has already bitten, with book-value-per-share growth down to about 12.2 percent over ten years and 11.4 percent over five from a roughly 18-percent lifetime rate (that lifetime figure is widely cited but could not be confirmed from the primary annual report in this pass, so treat it as approximate); the cash is a structural drag, not optionality, until a crash that has not come; rate cuts would gut the one earnings line currently flattering the story; and 1.45 times book is above the only price management itself will pay. The most likely outcome is not a blow-up but a slow bleed: a fortress that protects capital and compounds at a respectable-but-unspectacular rate, with the “defensive in any regime” thesis quietly becoming “defensive in the regime that did not arrive.”
The scenarios in detail
Four variables decide the five-year outcome. Everything below is just different settings of these. Every forward number is an illustrative estimate built on stated assumptions, never a price target, and the dollar levels match the chart at the top of this piece.
The driver tree. First, book-value-per-share compounding, the master variable, with a realistic forward range of 8 to 12 percent a year and the cash drag pulling toward the low end. Second, the short-rate path and its T-bill income: about $339 billion of T-bills reprice in near-real time, each 100 basis points is worth about $3.4 billion pre-tax (roughly 7 to 8 percent of FY2025 operating earnings), the Fed sits at 3.50 to 3.75 percent with cuts pushed to 2027-28, and a cut cycle toward 2 percent is the single biggest downside swing. Third, cash deployment: does the $397 billion find a home that beats T-bills? Fourth, the multiple, the Oracle premium, which compressed from 1.8 to 1.45 over the past year and whose floor is the roughly 1.2-times buyback zone. Secondary modifiers feed the master variable: the softening property-casualty cycle (combined ratio around 87 percent now versus a 93-percent long-run average, so underwriting profit is above run-rate and likely to mean-revert), the BNSF operating-ratio gap to Union Pacific (each point about $230 million), and the PacifiCorp wildfire tail.
Bull (about 12 percent book-value growth). Rates hold above 3.5 percent long enough that the T-bill income persists, and a market dislocation arrives that lets Abel deploy $50 to $100 billion-plus at distressed prices; underwriting stays disciplined; BNSF closes two to three points of the operating-ratio gap; and the multiple re-rates toward 1.6 to 1.65 times as Abel posts a visible record. Operating earnings climb from about $44 billion toward $60 billion-plus by 2030 and return on equity recovers toward 12 percent. Illustrative levels: about $595 in one year, $758 in three, $960 in five. What has to be true is the hard part: the cash gets put to work at high returns while rates are still high, two conditions that rarely coexist. What breaks it: no elephant deal appears, the cash keeps earning T-bill yields, and the re-rating never comes.
Base (about 9.5 percent book-value growth). Rates drift modestly lower but T-bill income stays a meaningful floor through 2027; underwriting mean-reverts toward the 93-percent combined ratio (less profit, offset by growing float); cash deploys at the recent $20 to $30 billion-a-year pace, not transformationally; and the multiple holds near its 1.45-times median. Operating earnings roughly hold in the $42 to $48 billion range, return on equity stays 9 to 10 percent, and book value compounds steadily. Illustrative levels: about $535 in one year, $645 in three, $785 in five, around 10 percent a year total. What has to be true: no rate collapse, no major catastrophe or adverse reserve shock, Abel keeps the franchise intact. What breaks it: a faster-than-expected 2027 rate-cut cycle that pulls $10 to $15 billion a year out of interest income before the cash is redeployed.
Bear (about 6.5 percent book-value growth, the skeptic’s slow bleed). This is not a crash. The Iran-shock inflation fades, the Fed cuts hard in 2027-28, short rates fall toward 1 to 2 percent, and Berkshire loses $10 to $15 billion a year of T-bill income just as the cuts re-rate the broad equity market higher, so the $397 billion never finds a cheap home. At the same time the soft cycle pushes the combined ratio toward 100 percent (float starts to cost something), BNSF freight is flat to down, the Oregon court lets PacifiCorp exposure drift above the reserve, and the premium keeps leaking under an unproven CEO. Operating earnings slide toward $30 to $35 billion by 2028, return on equity stays near 9 percent, and the stock compounds 6 to 8 percent a year while the index does 9 to 11. Illustrative levels: about $456 in one year (a drawdown), $505 in three, $573 in five. What has to be true: rates fall and stay low and no dislocation hands Abel a cheap entry. What breaks the bear, in the bull’s favor, is a genuine market dislocation that finally lets the cash pile do exactly what it is held for.
The catalyst timeline. Near term: Q2 2026 earnings around August 1 to 3 (underwriting combined ratio, T-bill income trend, buyback pace at 1.45 times book, any new equity moves); Q3 around November for the first read on the 2026 hurricane season; the Taylor Morrison close in the second half of 2026; every Fed meeting, which reprices the T-bill income line; and the Oregon Supreme Court’s action on the James petition. Multi-year: the rate-cut cycle whenever it arrives (the largest structural swing on earnings), Abel’s first elephant deal or its continued absence, BNSF operating-ratio improvement, the wildfire resolution, the property-casualty cycle bottoming and re-hardening, and the eventual Jain and Buffett transitions.
Leading indicators to watch. The single most useful real-time tell is the quarterly trend in T-bill and insurance investment income; a sustained decline means the bear’s slow bleed has begun. Then: the cash-and-T-bill balance (falling materially is deployment and bullish, rising past $400 billion means the drag is winning); the buyback dollars and the price-to-book at which they happen (a resumption near 1.2 is a loud value signal, continued token amounts at 1.45-plus is not); the consolidated combined ratio drifting toward 100; the BNSF operating ratio versus Union Pacific; the multiple relative to the 1.42 median and the 1.2 floor; and any swing from net selling to net buying of equities, which would be a genuine change in posture.
Companies to watch (bull / base / bear)
BRK.B - the subject; a low-beta fortress at a fair-to-slightly-rich price in its first post-Buffett year. Bull: the cash pile becomes a once-a-decade weapon and Abel proves the machine runs. Base: steady defensive compounding near a median multiple. Bear: slow bleed of relative return as rates fall, the cash sits idle, and the premium leaks. Watch: the buyback price and the T-bill income trend.
MKL - the closest baby-Berkshire analog at a cheaper multiple. Bull: capital rotates here if Berkshire de-rates. Bear: shrinking premiums and no anchor figure. Watch: underwriting trend and Ventures marks.
FRFHF - the largest non-Berkshire float-invest holding company. Bull: combined ratio inflecting below 95 percent. Bear: opaque succession and own-share swaps. Watch: US-listing liquidity and the swap book.
L - the cheapest structural peer, a classic conglomerate discount. Bull: buybacks close the discount. Bear: CNA reserve headwinds, no catalyst. Watch: CNA development and Tisch buyback pace.
UNP - the BNSF benchmark. Bull: duopoly pricing and efficiency runway. Bear: freight recession. Watch: operating ratio and carload volumes (also the scorecard on Abel’s BNSF mandate).
AAPL - 22 percent of the equity book. Bull: on-device AI services layer. Bear: China and tariff risk at 28 times earnings, with Berkshire’s own 75-percent trim as the tell. Watch: services growth and any further Berkshire sales.
AXP - the number-two holding, quasi-forever. Bull: resilient premium spend. Bear: the credit cycle turning. Watch: card-member spending and credit losses.
KO - a royalty-like permanent holding. Bull: pricing power and yield on cost. Bear: GLP-1 volume risk. Watch: organic volume trend.
BAC - number four, off the quasi-forever list. Bull: net-interest-income tailwind. Bear: duration risk and the return of Berkshire selling. Watch: whether Berkshire resumes trimming.
CVX - number five, also off the forever list. Bull: Guyana barrels and buybacks. Bear: oil below $65 and possible further Berkshire sales. Watch: the oil price and Berkshire’s stake.
GOOGL - Abel’s signature build and first primary-market commitment. Bull: cloud and AI compounding, placement struck below market. Bear: a bet-the-company capex program at 23 times revenue. Watch: cloud margins and the AI-capex payoff.
Risk controls
The honest risk list for Berkshire is specific, not systemic. Equity-portfolio concentration is real: the top five names are about 68 percent of a $288 billion book, and a sharp decline in those holdings would visibly cut consolidated equity, with the GAAP swings on top of that. Insurance carries catastrophe and reserve risk by design; Berkshire deliberately accepts more catastrophe exposure than any other insurer, and a soft pricing cycle plus social inflation could flip the float from negative-cost toward positive-cost. The BHE wildfire and utility-regulation tail is the largest single contingency: about $2.9 billion accrued against an unresolved, much larger plaintiff demand, with a procedural appeal pending. BNSF is cyclical freight. The cash pile is a reinvestment-and-rate risk: it drags on return on equity now and is highly sensitive to a rate-cut cycle. And the whole model rests on key people, with Abel unproven on the portfolio and Jain past typical retirement age. There is no dividend to cushion a flat decade, and the stock is not cheap after a defensive bid.
What would change the read. Toward a more constructive lean: a large, value-accretive deployment while rates stay high, buybacks resuming at scale near 1.2 times book (management voting with capital), BNSF closing two to three points of its operating-ratio gap, or a clean two-to-three-year independent capital-allocation record from Abel. Toward a more cautious lean: a fast 2027 rate-cut cycle pulling $10 to $15 billion a year out of interest income with the cash still idle, the combined ratio crossing 100, an adverse PacifiCorp ruling well above the reserve, the multiple holding above 1.6 with no deployment (pure premium, no engine), or book-value compounding confirmed below 7 percent.
Methodology, sourcing, and data-quality flags
This piece was built from parallel research streams: the value-chain and capital-allocation structure; the SEC filings (10-K FY2025, 10-Q Q1 2026, the February 28 and May 2 2026 earnings releases, and the 13F); insurance and float; the wholly-owned operating businesses; the equity portfolio; the cash pile; succession and governance; market action and valuation; sentiment; and the forward outlook. The source hierarchy is primary first: Berkshire’s own filings and shareholder letters for the financials, the 13F for the portfolio, the company’s disclosures and the court record for the litigation. Analyst and reputable trade press fill in context (segment color, peer multiples, succession reporting), and everything forward-looking is labeled an estimate or a scenario.
The full five-factor read, in plain prose. On valuation, the evidence nets to roughly fair, a shade rich: at 1.45 times book the stock is about 2 percent above its own ten-year median and a premium to its closest peers (Markel about 1.28, Loews about 1.15, Fairfax about 1.23 to 1.35), it is above the roughly 1.2-times historical buyback floor, and management resumed only a token $235 million repurchase at this level, which says the most informed buyer sees it as marginal; the low EV/EBITDA is an artifact of the cash netting out. On growth, this is the weak factor: book-value compounding has slowed to about 12.2 percent over ten years and 11.4 percent over five, with a realistic forward range of 8 to 12 percent and the law of large numbers plus the idle cash pulling toward the low end. On quality, this is the standout: a roughly $176.9 billion negative-cost float, a fortress balance sheet (about $717 billion of equity and $397 billion of liquidity), diversified cash-generative engines, and about $46 billion of annual operating cash flow, among the highest-quality balance sheets in the market. On risk, the read is favorable: low business risk by design, beta 0.62, a defensive mix and no leverage problem, with the genuine risks (the wildfire tail, rate-cut sensitivity, key-person transition, the soft cycle) real but contained and lower than the average large-cap. On momentum and sentiment, the read is soft and mildly negative: down 2.67 percent year to date against the index, lagging by about 37 points over the trailing year, below the 200-day average, with the premium-fade narrative live, only partly offset by thin Buy-skewed coverage and the low-beta resilience. Putting those together, the overall lean is a defensive, durable holding that is not obviously cheap here; the read lands at Hold. It is not advice.
Data-quality flags:
- Dollar-figure handling. The raw claims ledger had a display artifact that stripped leading digits from many dollar values; every figure in this article was taken from the primary sources or the verifier’s corrected notes, not the raw ledger strings.
- GAAP versus operating earnings. GAAP net income (about $67 billion in 2025) is dominated by equity mark-to-market and is, by management’s own account, usually meaningless quarter to quarter. The article leads with operating earnings ($44.49 billion). Trailing P/E (about 14.6 times GAAP) versus forward P/E (about 23 times) is a definition gap; the cleaner gauge is price-to-book.
- Cash definition. The roughly $397 billion figure includes the railroad, utilities, and energy segment cash; the Insurance/Other segment alone was about $390.7 billion at March 31, 2026. One basis is quoted consistently.
- BNSF operating-ratio basis. Standalone BNSF reports 65.5 percent; the segment table on a different basis runs higher. The 65.5-percent standalone figure is used for the Union Pacific comparison.
- 13F versus 10-Q portfolio base. The 13F (US holdings, about $263.1 billion) differs from the 10-Q equity securities ($288 billion, which includes the Japanese trading houses), so concentration percentages differ by base. A minor 26-versus-29 holdings-count discrepancy across vendors reflects multiple share classes.
- Litigation is a contingency, not a determined liability. The roughly $46 billion PacifiCorp figure is what plaintiffs are seeking, not an amount owed; about $2.9 billion is accrued; the James verdict was reversed and remanded on procedural grounds in April 2026 with an Oregon Supreme Court petition pending; the $575 million DOJ settlement covers federal claims only. The HomeServices antitrust matter is a jury finding under appeal, with trebling only a possibility.
- Point-in-time market data. All prices, caps, multiples, betas, and peer figures are as of June 22, 2026 and move daily, single-vendor where a second source was not located.
- Forecasts are not facts. Every analyst target, fair-value estimate, and macro forecast is attribution-verified only; the scenario arithmetic here is illustrative, not a prediction. The roughly 18-percent lifetime book-value CAGR is widely cited but could not be confirmed from the primary annual report in this pass; the verified figure is about 12 percent over ten years.
Key sources: Berkshire Hathaway FY2025 10-K and Q1 2026 10-Q; the February 28, 2026 and May 2, 2026 earnings releases; the Q1 2026 13F-HR; Abel’s 2025 shareholder letter and the 2026 annual meeting transcript; the Alphabet SEC FWP for the private placement; stockanalysis.com, macrotrends, GuruFocus, and Yahoo Finance for point-in-time market data; S&P Global, Carrier Management, and Insurance Journal for the PacifiCorp matter; and CNBC, Fortune, and Reinsurance News for segment and succession coverage.
Prepared June 22, 2026. Figures are point-in-time and will change. This is research and analysis for educational purposes, not investment advice, not a recommendation, and not a solicitation. Berkshire is a diversified holding company and insurance conglomerate; it carries catastrophe and reserve risk, concentrated equity-portfolio mark-to-market risk, regulated-utility and wildfire-liability exposure, freight and energy cyclicality, and key-person and succession risk. Verify all figures independently and consult a licensed financial advisor before making any decision.