
Research date: July 2, 2026 | OSINT research on American Express Company (NYSE: AXP), the one large payments company that is simultaneously the card issuer, the merchant acquirer, and the network, and the Visa, Mastercard, and Capital One comparisons that explain why it trades where it does.
Important disclaimer. This is OSINT-based research and educational analysis, not investment advice. I am not a financial advisor. Nothing here is a recommendation to buy or sell any security, and the scenarios below are illustrative, not price targets. Payments and consumer-lending stocks are exposed to the credit cycle and can move fast when that cycle turns. Market caps, prices, valuation multiples, and market-share figures are point-in-time (July 2, 2026), sourced where noted, and move fast. Do your own due diligence and consult a licensed advisor.
Where this stock could be in 6 months, 1 year, 3 years, and 5 years
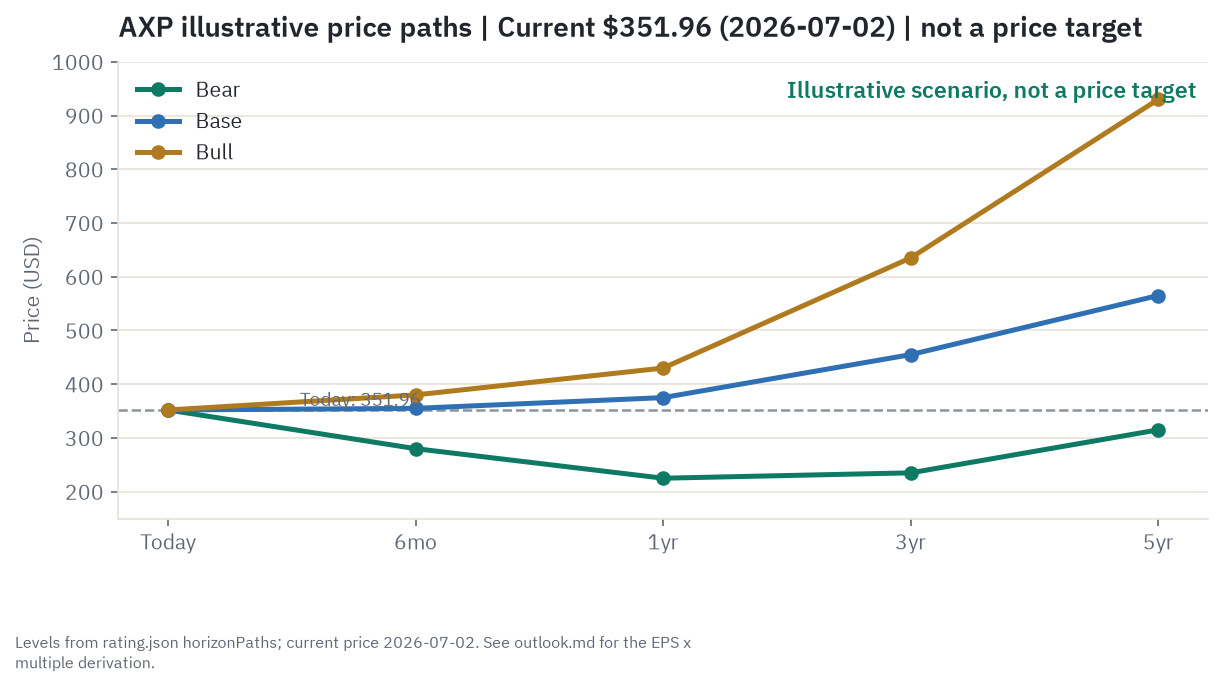
American Express trades at 21.72 times trailing earnings, a real discount to Visa’s and Mastercard’s roughly 30 times. That gap is not an accident and it is not obviously a bargain either: American Express is the only one of the three that lends its own money and carries its own credit risk, and the size of that discount is essentially the market’s price for that extra exposure. Working out whether the discount is fair, too wide, or too narrow is what the rest of this piece does. Every dollar level below is an estimate built on stated assumptions, never a price target.
Six months. The dominant event in this window is the July 24, 2026 earnings release, and inside it one specific pair of numbers: the net write-off rate, which has already drifted from 2.0 percent to 2.3 percent over the past two fiscal years, and the 30-plus-days-past-due rate, which has held flat at 1.3 percent the whole time. If both hold near where they sit now while billed business keeps growing at a high-single-digit pace, the base case drifts modestly higher to around $355. A clean beat with credit quality still flat supports the bull case near $380. A single soft print showing the write-off rate ticking up again, even without a broader downturn, is enough to send the stock toward the bear case near $280, since the market reacts sharply to any credit wobble in a lender. The single thing most likely to flip this horizon is the next quarterly write-off-rate print.
One year. Over a full year the question is whether that write-off-rate drift was a one-time normalization off unusually low post-pandemic levels, or the early stage of something longer. A stabilization alongside continued high-single-digit billed-business growth supports the base case around $375. Credit staying flat, fee income compounding, and International Card Services holding onto its unusually fast growth support the bull case near $430. A genuine consumer-credit downturn, where provisioning rises faster than revenue, is the bear case near $225, a real drawdown that reflects American Express getting hit on both spending and credit at once. The flip here is two or three consecutive quarters of a rising write-off rate.
Three years. By three years out the structural drivers take over from any single quarter. The bull case, near $635, needs the Millennial and Gen-Z acquisition push and International Card Services’ fast growth to prove durable rather than a temporary catch-up, with credit quality staying benign the whole time. The base case, near $455, assumes growth normalizes toward a more mature high-single-digit pace with the valuation multiple holding roughly where it sits today. The bear case, near $235, assumes a credit cycle has played out somewhere in the window and the business is still working through the aftermath, still profitable, just growing much more slowly. The flip is simply whether a recession happened inside the window, and how deep it went.
Five years. This is the durability question in full: does the premium membership flywheel keep pulling in new, high-spending younger cardholders fast enough to replace older cohorts as they age out, and does the market ultimately decide American Express’s credit management deserves a multiple closer to Visa’s and Mastercard’s, the same as today’s, or wider still. The bull case, near $930, needs most of that to break the company’s way, with a real partial re-rating toward the network peers’ multiple. The base case, near $565, is just today’s trend continuing at an unchanged multiple, about 60 percent above today’s price on earnings compounding alone. The bear case, near $315, still below today’s price even five years out, needs a credit cycle to have genuinely reset growth expectations and kept the discount multiple wide. The single thing most likely to change this long-run read is whether the gap to Visa’s and Mastercard’s multiple persists, narrows, or widens across a full cycle.
Where the read lands today. On balance the read holds at Buy: American Express is compounding double-digit revenue and earnings growth on a 30-plus percent return on equity, and even a real, structural credit-risk discount leaves room to like the stock, though not enough room to call it cheap. The single thing most likely to flip that read is the net write-off rate, which has already moved once and bears watching every quarter from here.
Companion tool
Jump to the interactive dashboard to sort and filter American Express against Visa, Mastercard, and Capital One, or download the Excel model to flex the scenarios yourself.
TL;DR
American Express is unusual among the big payments names because it plays every role in a card transaction at once: it is the network that clears the transaction, the acquirer that signs the merchant, and, for the large majority of its volume, the issuer that lends the cardholder the money. Visa and Mastercard only run the network in the middle and leave lending to bank partners, which is exactly why they trade at close to 30 times trailing earnings while American Express trades at 21.72 times: the market prices Visa’s and Mastercard’s earnings as safer, because there is no lending book behind them to go bad in a downturn. American Express’s own numbers explain both sides of that gap. Revenue net of interest expense grew 9.5 percent in fiscal 2025 to $72.2 billion and accelerated to 11.4 percent in the first quarter of 2026, driven by a three-layer model of merchant discount fees, a fast-growing membership-fee business up 18 percent, and net interest income up 12 percent on a $213.9 billion Card Member loan book. Return on average equity has held above 30 percent for three straight years. But that same loan book is the source of the discount: the net write-off rate has climbed from 2.0 percent to 2.3 percent over two years, even during what has, so far, been a broadly benign consumer environment, and a fifth of the company’s Card Member loans sit behind a single airline cobrand partnership with Delta. The honest read is that American Express is a genuine quality compounder trading at a real, structurally earned discount to its purest peers, with the credit cycle as the one variable that decides whether that discount is fair or about to widen.
Explore it yourself: the interactive dashboard
Open the dashboard in a full screen
One company, three jobs: issuer, acquirer, and network
Every other payments comparison a reader is likely to encounter starts from the assumption that a card network and a card issuer are two different businesses, because for Visa and Mastercard, they are. Picture a tollway with three separate operators: one owns the road and collects the toll, one owns the cars that drive on it, and one owns the truck stops along the way. Visa and Mastercard only own the road. American Express owns the road, a large share of the cars, and a chunk of the truck stops directly, which is why it earns more revenue per dollar of spending than a pure network does, and why it is exposed if one of its own cars breaks down in a way the pure toll operator never is.
That structure shows up directly in how American Express makes money. On a typical transaction, American Express withholds a merchant discount rate at settlement the way any network does, but because it is not bound by the interchange-rate caps that regulators apply to bank-issued Visa and Mastercard cards, it prices that discount rate on its own terms, pitching merchants on the idea that American Express cardholders spend more and are more loyal, so the higher fee is worth it. At the same time, because American Express is also the issuer, it earns interest income directly from any cardholder who revolves a balance rather than paying in full, and it can charge an annual membership fee for the card itself, something a pure network has no direct relationship to collect. Three revenue streams from one relationship, instead of one network fee split four ways among four separate companies.
The one payments name close to this same structure is Capital One, which completed its acquisition of Discover Financial Services in May 2025 and, in doing so, became an issuer that also owns its own network (the Discover Network, alongside the PULSE debit network). That makes Capital One arguably a closer structural peer to American Express than either Visa or Mastercard, even though Capital One’s card book skews far more mass-market than American Express’s affluent, premium positioning.
How the money flows
flowchart TD
    CM["Card Member - spends on the card, 1,669.8B billed business FY2025"]
    MER["Merchant - accepts card, pays merchant discount rate"]
    AXP["American Express - simultaneously issuer, acquirer and network"]
    LEND["AXP lending book - Card Member loans 213,863M FY2025"]
    PARTNER["Third-party bank issuer - partner-issued AXP-branded cards"]
    COBRAND["Cobrand partner - Delta and others, pays/earns on miles"]
    GMNS["Global Merchant and Network Services - network + acquiring fees"]

    CM -->|"spends at point of sale"| MER
    MER -->|"merchant discount withheld at settlement"| AXP
    AXP -->|"discount revenue booked, 37,401M FY2025"| AXP
    CM -->|"revolves a balance"| LEND
    LEND -->|"net interest income, 17,364M FY2025"| AXP
    CM -->|"pays annual membership fee"| AXP
    AXP -->|"net card fees, 9,993M FY2025, +18pct"| AXP
    PARTNER -->|"network licensing fee on partner-issued volume"| GMNS
    AXP -->|"miles paid for cobrand spend"| COBRAND
    COBRAND -->|"Delta cobrand, ~13pct of billed business, ~21pct of loans"| AXP
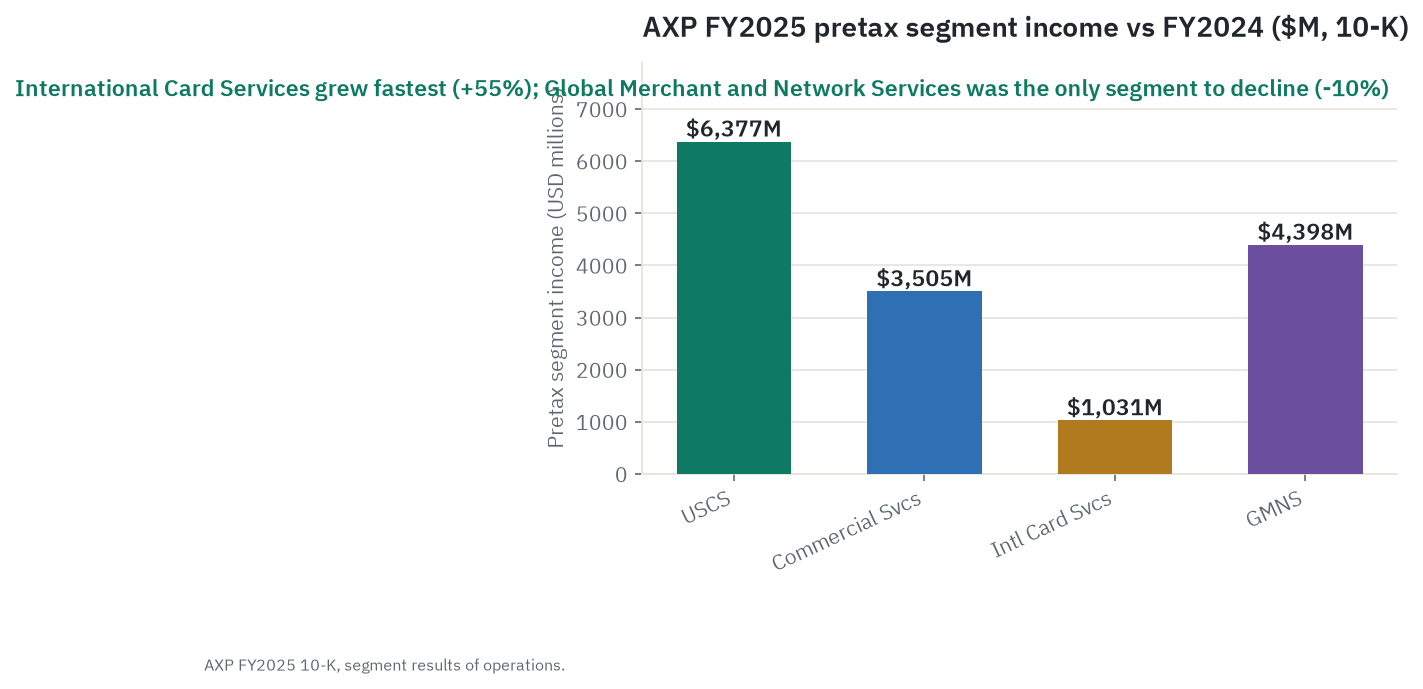
Follow the diagram from the top. A Card Member spends $1,669.8 billion worth of billed business across American Express cards in fiscal 2025, up 8 percent from the prior year. Most of that spend happens at merchants with a direct American Express agreement, so instead of a four-party split (issuer, network, acquirer, merchant), American Express settles directly with the merchant and keeps the whole merchant discount itself: $37.4 billion of discount revenue in fiscal 2025, the single largest line on the income statement.
Two more revenue streams branch off the same relationship. If a Card Member revolves a balance instead of paying it off, that balance sits inside American Express’s own $213.9 billion lending book and generates net interest income, $17.4 billion in fiscal 2025 and the fastest-growing line in dollar terms, up 12 percent. And because American Express also controls the network relationship directly with the cardholder, it can charge an annual membership fee for holding the card at all: $10.0 billion in net card fees in fiscal 2025, up 18 percent, the fastest-growing line in percentage terms, reflecting an active cycle of adding benefits and raising fees on the Platinum and Gold-tier cards.
The one place a third party genuinely enters this flow is the licensing business, where a bank partner issues cards carrying the American Express brand and takes on the credit risk itself while American Express collects a network fee, the same basic economics Visa and Mastercard run at scale. On top of all of this sits the cobrand layer: American Express issues cards jointly with airlines, chiefly Delta, paying the airline for the loyalty miles awarded on cobrand spending while the airline in turn earns fee revenue selling those miles to American Express, typically well above what it costs the airline to fly the passenger who eventually redeems them. The Delta relationship alone accounts for roughly 13 percent of worldwide billed business and roughly 21 percent of worldwide Card Member loans, a concentration worth remembering every time this piece talks about “the loan book” as if it were evenly spread.
The four segments: how American Express actually makes money
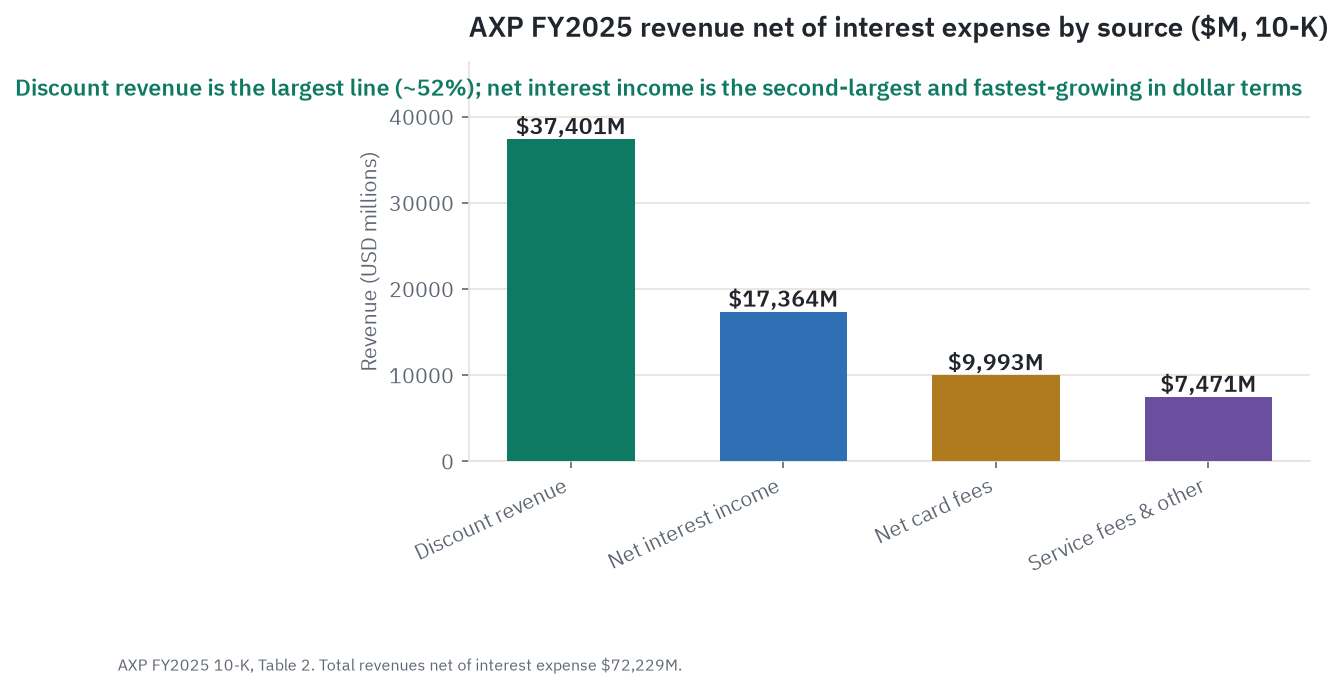
American Express reports four segments, and the fiscal 2025 results show a company where growth is broad but not perfectly even.
U.S. Consumer Services issues the core proprietary consumer cards, runs travel and lifestyle services, and manages the company’s dining and restaurant-reservation platform. It is the largest segment by pretax income, $6.81 billion in fiscal 2025, up 7 percent, on billed-business growth of 8 percent. The 10-K explicitly credits “continued momentum in spending by Millennial and Gen-Z Card Members, our fastest-growing cohorts,” as the driver, which matters because it is the segment replenishing the affluent-spender base that justifies American Express’s above-average merchant pricing in the first place.
Commercial Services covers corporate and small-and-mid-size-enterprise cards and B2B payment products. It grew pretax income 5 percent to $3.67 billion, the slowest-growing of the four segments, reflecting what the company itself calls only “modest” growth from small and mid-size enterprise cardholders. This is the segment most directly tied to the health of business spending broadly, and it is the one growing least, which is worth noting for anyone assuming every part of the franchise is firing at the same rate.
International Card Services issues consumer, small-business, and network cards outside the United States, and it was the standout of the year: pretax income jumped 55 percent to $1.60 billion on 14 percent billed-business growth, driven by strength across geographies and customer types outside the US. That is by far the fastest growth rate in the company, though off the smallest base of the four segments, and the honest question a reader should hold is whether it represents a durable new pace or a catch-up effect after a slower start.
Global Merchant and Network Services runs the network and acquiring side: processing and settling transactions, signing merchants, and licensing the American Express brand to third-party issuers. It is the one segment where pretax income actually fell in fiscal 2025, down 10 percent to $3.97 billion, even as its revenue grew, because expenses jumped 22 percent on higher marketing spend and the loss of a prior-year one-time divestiture gain. The filing also notes average merchant discount rates declined slightly in this segment because of a shift in merchant and geographic mix, a small early sign that American Express’s merchant-facing pricing power is not a one-way ratchet.
Who wins where
The competitive map around American Express splits cleanly along the same structural line the rest of this piece keeps returning to.
The pure networks are Visa and Mastercard: asset-light toll roads that earn a fee on volume run by bank-partner issuers and acquirers, without ever holding a cardholder’s credit risk on their own balance sheet. Their earnings carry a structurally lower risk of a bad-debt shock, which is precisely why the market prices them at close to 30 times trailing earnings, a real premium to American Express’s 21.72 times.
The issuer-plus-network hybrids are American Express and, since May 2025, Capital One, which now owns the Discover Network after completing its acquisition of Discover Financial Services. Both combine card issuing, with all the credit risk that carries, with ownership of the network that clears the transaction. American Express skews affluent and premium; Capital One’s book, even before Discover, skewed more mass-market, and the combined entity is now digesting a large, complex integration, visible in a trailing price-to-earnings ratio of 47.69 times that is really a merger-cost artifact rather than a genuine growth premium (Capital One’s forward P/E of 9.93 times tells the more honest story about what the market expects normalized earnings to look like).
The fintech and installment-lending disruptors, buy-now-pay-later providers and point-of-sale installment lenders chief among them, compete for a specific slice of American Express’s business: the revolving-credit spend that drives net interest income, which happens to be American Express’s fastest-growing revenue layer in dollar terms. These competitors offer 0-percent or low-rate installment plans at the exact moment of purchase, before a cardholder ever revolves a balance the traditional way, which is a genuine, multi-year threat to exactly the part of American Express’s business currently growing fastest.
The rails threat further out is stablecoin settlement and account-to-account real-time payment infrastructure, which route money from a consumer directly to a merchant without a card network toll in the middle at all. This is a threat aimed at the discount-revenue layer specifically, the largest line on American Express’s income statement, and it is a multi-year structural question rather than a next-quarter one. American Express’s own recent moves to integrate with newer digital-payment rails suggest the company is trying to be present on that infrastructure rather than simply defending the old one, though whether that shows up in the numbers is a five-year question, not a six-month one.
Company by company: who’s who
American Express Company (AXP) - NYSE, market cap $240.15 billion. The subject of this piece: a closed-loop payments company that is simultaneously card issuer, merchant acquirer, and network for the large majority of its billed business. Fiscal 2025 revenue net of interest expense was $72.2 billion, up 9.5 percent, with net income of $10.8 billion, diluted EPS of $15.38, and return on average equity of 33.9 percent. Bull: a premium, fee-plus-lending compounder with a 30-plus percent ROE, a membership flywheel actively pulling in the fastest-growing customer cohorts, and Berkshire Hathaway holding roughly 22 percent of the company without ever having sold. Bear: the only large-cap payments major carrying meaningful credit risk of its own, trading at only a modest single-digit implied upside to the sell-side’s own average price target.
Visa Inc. (V) - NYSE, market cap $682.22 billion. The largest global card network by payments volume, running the cleanest possible version of the pure-toll-road model: no cardholder lending, no direct credit-risk exposure. Trades at 30.61 times trailing earnings with a beta of 0.75, both reflecting the market’s view that Visa’s earnings carry less downside risk than American Express’s. The sell-side consensus is Strong Buy with an average target of $398.70, more enthusiastic than the modest single-digit upside implied for American Express. Bull: the widest network moat in payments and no credit exposure at all. Bear: a premium multiple that leaves less room for a growth disappointment.
Mastercard Incorporated (MA) - NYSE, market cap $476.60 billion. The number-two global card network, running essentially the same open-loop economics as Visa and priced similarly at 30.22 times trailing earnings with a Strong Buy consensus and an average target of $643.70. Mastercard and Visa function as a matched pair in this piece: together they show what the market pays for pure network economics with no lending book attached, the benchmark against which American Express’s discount is best understood.
Capital One Financial Corporation (COF) - NYSE, market cap $126.36 billion. The most structurally interesting comparison here, because Capital One completed its acquisition of Discover Financial Services in May 2025, bringing the Discover Network in-house and making Capital One, like American Express, both a card issuer carrying credit risk and the owner of the network that clears its own transactions. Its book skews more mass-market than American Express’s premium positioning. Its trailing P/E of 47.69 times is distorted upward by Discover merger-integration costs depressing reported net income; its forward P/E of 9.93 times, far below the trailing figure, signals the market expects those costs to fade. Bull: Discover Network ownership gives Capital One network-style economics American Express does not fully replicate at Visa or Mastercard scale. Bear: a larger, more mass-market credit book than American Express’s, carrying full credit risk through a complex, still-digesting merger.
Discover Financial Services no longer trades as a standalone stock following the merger close.
What the filings say
American Express’s fiscal 2025 Form 10-K (filed February 6, 2026) and its first-quarter 2026 Form 10-Q (filed April 23, 2026) lay out a company growing faster than it has in several years, with credit quality that has drifted slightly but not alarmingly.
Revenue and growth. Total revenue net of interest expense grew from $52.9 billion in fiscal 2022 to $60.5 billion in fiscal 2023, $65.9 billion in fiscal 2024, and $72.2 billion in fiscal 2025, a compound growth rate in the high single digits that accelerated further to 11.4 percent year over year in the first quarter of 2026 ($18.9 billion versus $17.0 billion a year earlier). Net income followed a similar path: $7.5 billion in fiscal 2022 rising to $10.8 billion in fiscal 2025, with diluted earnings per share climbing from $11.21 in fiscal 2023 to $15.38 in fiscal 2025, and $4.28 in the first quarter of 2026 alone, up 17.6 percent year over year, a growth rate faster than net income’s own 15.0 percent gain because a shrinking share count (buybacks are covered below) adds an extra boost to the per-share number.
Volume metrics. Network volume across all cards carrying the American Express brand, including third-party-issued ones, reached $1,897.0 billion in fiscal 2025, up 7 percent. Billed business on American Express-issued cards specifically reached $1,669.8 billion, up 8 percent, with Goods and Services spending over 70 percent of the total and restaurants the largest single category within Travel and Entertainment.
The lending book and credit quality, in detail. Card Member loans and receivables stood at $213.9 billion at the end of fiscal 2025, up 7 percent from $199.1 billion in fiscal 2024 and $186.4 billion in fiscal 2023. The average net interest yield earned on that book rose from 7.3 percent in fiscal 2023 to 7.9 percent in fiscal 2024 to 8.1 percent in fiscal 2025, meaning American Express has been repricing its loan book upward through a period of shifting interest-rate expectations, evidence of real pricing power over its cardholder base rather than a passive spread business. Credit quality, meanwhile, has drifted only modestly: the net write-off rate covering principal, interest, and fees combined held at 2.3 percent in both fiscal 2024 and fiscal 2025, up from 2.0 percent in fiscal 2023, while the narrower 30-plus-days-past-due rate for consumer and small-business Card Members has stayed exactly flat at 1.3 percent across all three years. Provision for credit losses, the expense that funds the reserve against future write-offs, grew only from $4.9 billion in fiscal 2023 to $5.3 billion in fiscal 2025, growing more slowly than the loan book itself, consistent with a credit book management does not currently see turning.
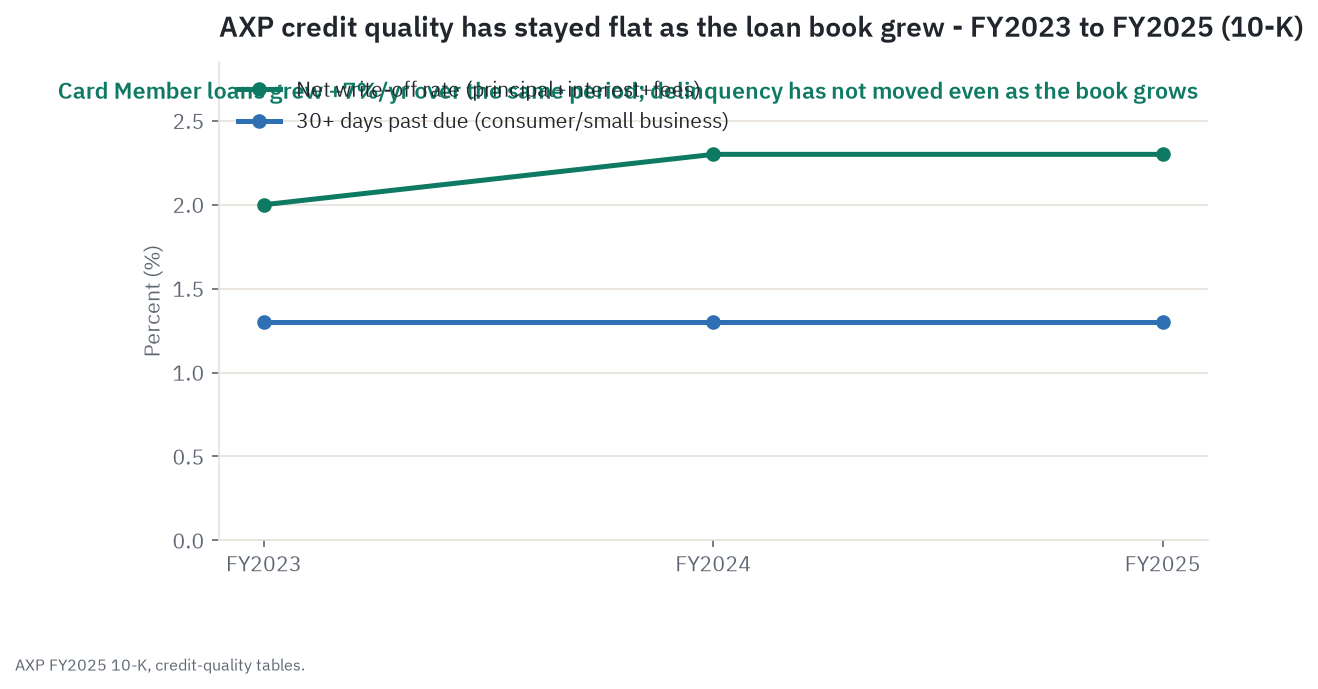
Picture that lending book as a dam holding back a reservoir that keeps filling, since loan balances keep growing 7 percent a year. The write-off rate and the delinquency rate are the gauges on that dam that tell a reader whether the water is close to spilling over the top. Today those gauges read flat, not rising sharply, meaning the water level is climbing, but the dam is holding the line rather than straining against it.
Capital returns. American Express repurchased $5.8 billion of common stock in fiscal 2025, $6.0 billion in fiscal 2024, and $3.7 billion in fiscal 2023, cutting the share count from roughly 743 million shares at the end of fiscal 2022 to 686.6 million at the end of fiscal 2025 and to 682.3 million by the April 2026 10-Q cover page, a reduction of roughly 8 percent in about three and a half years. The declared dividend per share rose from $2.40 in fiscal 2023 to $2.80 in fiscal 2024 to $3.28 in fiscal 2025, growth of roughly 17 percent and 15 percent year over year, running alongside the buyback rather than in place of it.
Concentration and ownership. The Delta Air Lines cobrand portfolio represents approximately 13 percent of worldwide billed business and approximately 21 percent of worldwide Card Member loans as of the end of fiscal 2025, tying a meaningful slice of American Express’s growth and credit exposure to a single airline partnership; the current agreement runs through the end of 2029. On ownership, Berkshire Hathaway’s own Form 13F-HR for the quarter ended March 31, 2026 reported holding 151.6 million American Express shares across its filing entities, roughly 22 percent of shares outstanding, a position it has held for decades without selling. Because American Express’s own buybacks keep shrinking the total share count, Berkshire’s percentage ownership has drifted upward over time without Berkshire needing to buy a single additional share.
Disclosed regulatory risk. Because American Express issues its own cards and holds deposits, it carries bank regulation on top of the payment-network regulation Visa and Mastercard also face, and its 10-K describes an “evolving and extensive” government regulation and supervision regime along with ongoing merchant-contract litigation risk (over non-discrimination and “honor all cards” provisions), a recurring theme across the card-network industry that Visa and Mastercard disclose in similar terms in their own filings.
What the market is paying
At $351.96, American Express carries a market capitalization of approximately $240.15 billion, inside a 52-week range of $288.34 to $387.49, meaning the stock sits roughly 9 percent below its high and about 22 percent above its low: a strong run over the past year with a real pullback somewhere in the middle, not a straight line up. Beta is 1.04, essentially market-like, a touch higher than Visa’s 0.75 or Mastercard’s 0.73, consistent with a company carrying balance-sheet credit risk its purest peers do not.
The valuation gap to those peers is the central fact of this section. American Express trades at 21.72 times trailing earnings (on trailing twelve-month diluted earnings per share of roughly $16.02) and 19.24 times forward earnings, against Visa’s 30.61 times and Mastercard’s 30.22 times, a discount of roughly 40 percent. Capital One’s trailing multiple of 47.69 times looks like the outlier of the group at first glance, but it is an artifact of Discover merger-integration costs depressing trailing net income; its forward multiple of 9.93 times, the lowest of all four names, reflects the market’s expectation that combined earnings power normalizes well above where trailing GAAP earnings currently sit.
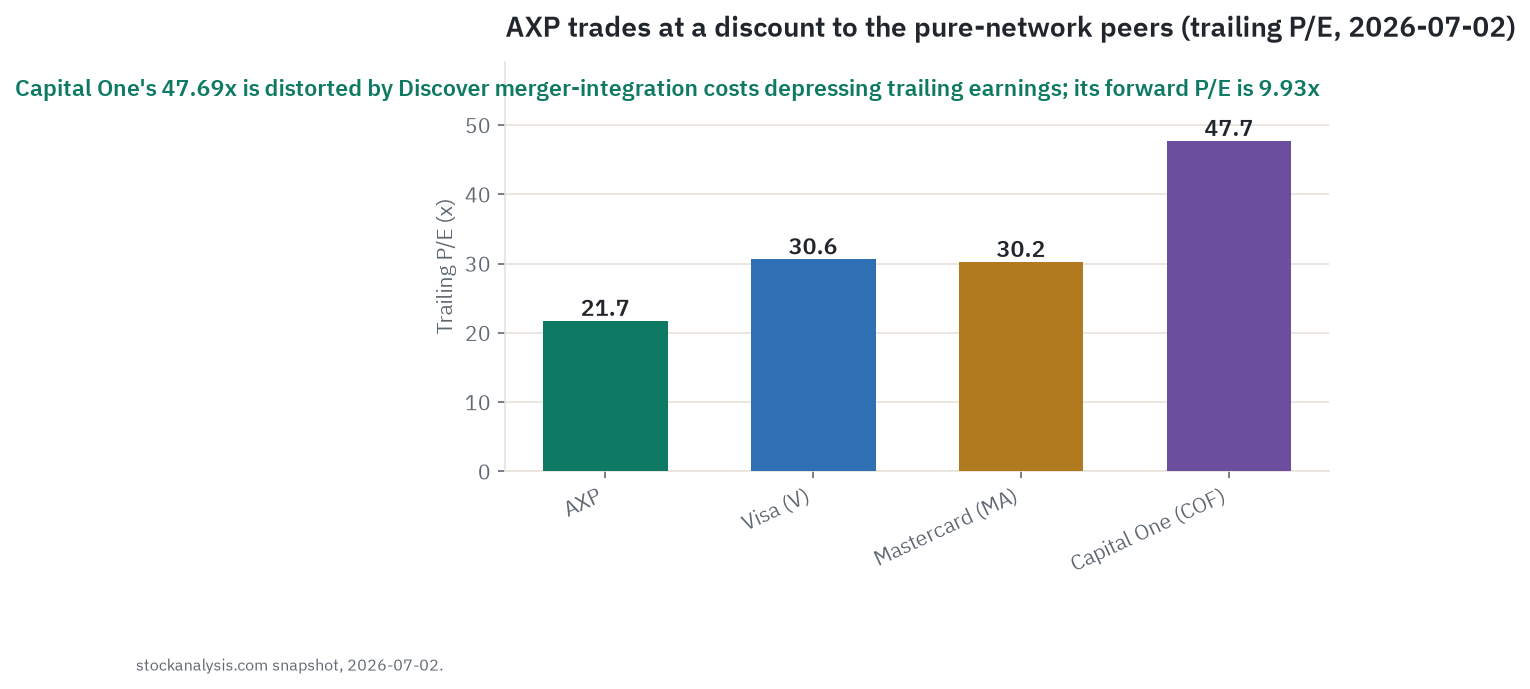
Think of the four names as four vehicles crossing the same bridge. Visa and Mastercard are toll booths that collect a fee on every car and never own a single one, so they carry no risk if a driver crashes. American Express owns some of the cars, collects the toll, and also carries the auto loan on those cars, earning more per car that crosses but also carrying the exposure if a driver defaults. Capital One, since absorbing Discover, now owns a competing bridge outright. The market’s normal instinct is to pay the richest multiple for the toll-booth-only businesses because their earnings are least likely to surprise on the downside, and American Express’s discount to Visa’s and Mastercard’s multiple is compensation for exactly that extra exposure, not an obvious bargain and not an obvious overreaction either.
The sell-side reflects the same split. American Express carries a Buy consensus with an average price target of $365.36, only about 3.8 percent above the current quote, a modest rather than enthusiastic implied upside. Visa and Mastercard are both rated Strong Buy by the same sell-side community, with larger implied upside to their own average targets, mirroring the multiple gap: broadly constructive on American Express, but not pounding the table the way analysts are on the pure-play networks. The next scheduled American Express earnings release is July 24, 2026, the next hard catalyst inside the six-month window discussed above.
What the crowd is saying
Financial media coverage heading into the July 24 earnings print concentrates on the same handful of questions this piece has been working through: whether the premium-card growth engine keeps compounding at its current pace, whether today’s valuation already reflects that, and how American Express stacks up against Mastercard specifically on a risk-adjusted basis. The commentary splits roughly down the middle. Some coverage argues American Express’s “unique growth and resilience” justifies a rich multiple; a separate, more mechanical valuation screen from a retail-facing research site puts fair value meaningfully above the current quote, implying the stock could be undervalued rather than expensive. That split is itself informative: there is no obvious consensus that American Express is cheap or dear, consistent with a sell-side average target sitting only a few percent above the current price rather than signaling a screaming buy or an obvious sell.
A recurring theme in that commentary explicitly frames Mastercard’s “risk-free network fees” against American Express’s balance-sheet exposure, arguing the pure-network model deserves the richer multiple, the same structural point this piece has made in its own words, just voiced as an active investment argument rather than a neutral description. Coverage also continues to frame American Express as “one of Warren Buffett’s oldest stock picks,” a framing that carries real weight with quality-oriented investors even though it says something about the durability of the franchise over a multi-decade look-back, not about whether today’s entry price is attractive. Separately, financial-data aggregators regularly report a steady drumbeat of small and mid-size asset managers initiating or adding to American Express positions, mostly ordinary indexing and rebalancing rather than a directional signal, but the sheer frequency reinforces the stock’s status as a core institutional holding, which tends to dampen realized volatility relative to a more concentrated, story-driven name.
One more thread worth naming: recent coverage flags American Express extending its own rails into newer digital-payment infrastructure, joining an open, bank-led digital-dollar settlement initiative and expanding Apple Pay rewards-redemption integration. The narrative value is that it pushes back on the bear argument that American Express is a legacy plastic-card network exposed to disintermediation by stablecoins and real-time-payment rails; the company’s own actions suggest it is trying to be present on those new rails rather than only defending the old ones, though whether that shows up in the numbers remains a multi-year, not a next-quarter, question.
The fundamentals documented above are unambiguously strong on growth and credit quality. The public narrative, by contrast, is more contested, split between “quality compounder deserving a premium” and “structurally disadvantaged, priced accordingly.” If anything, that is a healthier setup for a long-term holder than a stock where the story has run far ahead of the numbers: here, the narrative is arguably more cautious than the trailing fundamentals alone would justify, with the discount multiple to Visa and Mastercard doing most of the work of keeping expectations in check.
Premium compounder or credit-cycle exposure: the durability case
The structural case for American Express rests on a genuine, durable moat that has almost nothing to do with payment technology and almost everything to do with status and habit. Membership Rewards points, cobrand airline miles, premium travel benefits like lounge access, and the simple social signal of carrying a Platinum card combine into a rewards-and-status flywheel that makes switching costly in a way that is distinct from Visa’s or Mastercard’s pure network-effect moat, where merchants accept the card because cardholders carry it and cardholders carry it because merchants accept it. On the merchant side, the moat is spending power: American Express’s pitch for its above-average discount rate is that its cardholders spend more and are more loyal, a pitch that only holds as long as the cardholder base actually is measurably more valuable, which is exactly why the Millennial and Gen-Z acquisition push matters so much, replenishing the premium-spender base as older, historically high-spending cohorts age out.
The real cyclical case against that structure is the one this piece keeps returning to: American Express is exposed to a consumer slowdown through two channels at once, not one. A downturn would be expected to soften Travel and Entertainment spend, the most discretionary category in the mix, at the very same moment weaker household balance sheets push the net write-off rate, already up from 2.0 percent to 2.3 percent over two years in a still-benign environment, higher still. Visa and Mastercard see a volume slowdown in a downturn; American Express sees a volume slowdown and a credit-loss cycle simultaneously, which is precisely why it trades at a discount to their multiple rather than at parity. Layer onto that the direct competitive threat from buy-now-pay-later and installment lenders, aimed specifically at the revolving-credit spend that drives American Express’s fastest-growing revenue line, and the concentration risk of a fifth of the loan book sitting behind one airline partnership, and the bear case is not a token paragraph, it is a coherent, sourced argument for why this stock is not simply “Visa but cheaper.”
The most likely outcome, on the evidence gathered here, sits closer to the base case than to either extreme: a garden-variety consumer slowdown at some point in the next several years that softens growth and lifts credit costs without threatening the franchise itself, following a company that has demonstrated real pricing power (net interest yield expanding from 7.3 percent to 8.1 percent even through a shifting rate environment) and real customer loyalty (a membership flywheel that has kept delinquency flat for three years even as the loan book grew 7 percent annually). What the market is paying for, in the end, is that combination of quality and exposure together, at a discount that looks earned rather than either a bargain or a trap.
The scenarios in detail
The driver tree. Four variables decide where this stock realistically goes over the next five years. First, billed-business and network-volume growth, the top-line engine, running 8 percent and 7 percent respectively in fiscal 2025 and accelerating to 11.4 percent revenue growth in the first quarter of 2026. Second, credit quality and provisioning, the variable unique to American Express among its most-quoted peers, with the net write-off rate already having drifted from 2.0 percent to 2.3 percent. Third, fee-income mix and buyback pace, since net card fees (up 18 percent) and an 8-percent-smaller share count since fiscal 2022 both lift earnings per share above net-income growth on their own. Fourth, the multiple the market assigns, currently a 40-percent discount to Visa’s and Mastercard’s roughly 30 times, which can narrow, hold, or widen depending on how the market comes to view the credit exposure.
Bull. Billed-business and revenue growth hold in the low double digits, above the fiscal 2023-2025 trend, driven by sustained Millennial, Gen-Z, and international acquisition. The net write-off rate stays at or below 2.3 percent through the period, meaning no credit-cycle reset occurs. Net card fees keep compounding near their fiscal 2025 pace as product refreshes continue, and buybacks continue cutting the share count further. Under those assumptions, diluted earnings per share compound from $16.02 today toward roughly $34 by year five [estimate]. Applying a gradually expanding multiple, from 22 times at six months toward 27 times by year five, still below Visa’s and Mastercard’s roughly 30 times, implies a price path rising from roughly $380 at six months to roughly $930 at five years [estimate, illustrative arithmetic, not a price target]. What has to be true: the credit cycle stays benign for the entire window and the market grows progressively more comfortable ascribing American Express a Visa-or-Mastercard-like multiple despite the credit risk. What breaks it: any multi-quarter rise in the net write-off rate, which would simultaneously slow the earnings trajectory and remove the case for multiple expansion.
Base. Billed-business growth normalizes toward a high-single-digit pace, closer to the fiscal 2023-2025 average than the first-quarter 2026 acceleration. The net write-off rate stabilizes near its current 2.3 percent rather than continuing to climb. Fee income and buybacks continue at a similar cadence, and the multiple holds roughly where it sits today, with no material re-rating in either direction. Under those assumptions, diluted earnings per share compound toward roughly $28 by year five [estimate], and holding the multiple near 20 to 21 times implies a price path from roughly $355 at six months to roughly $565 at five years [estimate]. What has to be true: growth normalizes rather than accelerating or breaking, and credit quality plateaus rather than improving or deteriorating meaningfully. What breaks it: either a sustained acceleration, pushing toward the bull case, or a credit-quality inflection, pushing toward the bear case; the base case is the “nothing changes” scenario and is fragile to either surprise.
Bear, anchored on the skeptic’s strongest case. A garden-variety consumer-led slowdown occurs somewhere within the five-year window: Travel and Entertainment spend softens as discretionary budgets tighten, International Card Services’ unusually fast fiscal 2025 growth proves to have been a catch-up effect rather than a new run rate, and the net write-off rate continues climbing past 2.3 percent into a real, multi-quarter credit-cycle scare, not a 2020-style crisis, before partially normalizing by year five. The multiple compresses into the mid-teens during the scare, roughly where American Express has traded during past credit-worry episodes. Under those assumptions, diluted earnings per share dips from $16.02 to roughly $14.50 within a year before recovering only slowly to roughly $19 by year five [estimate], a multi-year compounding setback rather than merely a slower compounding rate. Applying a compressed multiple, 18 times at six months falling to 15 times at one and three years and recovering only to 16.5 times by year five, implies a price path falling from roughly $280 at six months to roughly $225 at one year before a slow recovery to roughly $315 at five years, still below today’s price even five years out [estimate]. What has to be true: a real consumer-credit downturn occurs within the window and the premium-customer base does not insulate American Express as much as the bull case assumes. What breaks it, meaning what would prevent this scenario: the credit metrics that have stayed essentially flat for three years, including a 30-plus-days-past-due rate that has not moved from 1.3 percent since fiscal 2023, continuing to hold flat rather than inflecting.
Catalysts and timeline. Near term, the July 24, 2026 earnings release is the next hard catalyst, with billed-business growth, the net write-off rate, and any commentary on Delta cobrand economics the specific things to watch, followed by subsequent quarterly prints through year-end that will show whether the credit-quality trend is stabilizing or continuing to climb. Multi-year, the Delta cobrand agreement runs through the end of 2029, so its eventual renewal terms sit as a longer-horizon catalyst, and whether International Card Services sustains its fiscal 2025 growth rate over the next two to three years will reveal whether that growth was a durable inflection or a one-year catch-up.
Leading indicators to watch. The net write-off rate and the 30-plus-days-past-due rate, disclosed every quarter, are the single most useful real-time gauges of which scenario is playing out. Billed-business growth by segment, especially whether International Card Services sustains double-digit growth. Global Merchant and Network Services segment expenses relative to its own revenue, the one segment that already showed expenses outrunning revenue in fiscal 2025. And net card fee growth, the best real-time read on whether the premium-membership flywheel is still working.
What would change the thesis. From bull to bear: two or more consecutive quarters of a rising net write-off rate or past-due rate, especially paired with decelerating billed-business growth, the exact double exposure the bear case is built on. From bear to bull: the write-off rate stabilizing or falling for several consecutive quarters while billed-business growth holds in the high single digits or better, particularly if International Card Services proves its fiscal 2025 growth was durable rather than a catch-up effect.
Companies to watch (bull / base / bear)
American Express (AXP) - the subject of this piece. Bull: the write-off rate stabilizes, International Card Services’ growth proves durable, and the market narrows the discount to Visa and Mastercard. Base: growth normalizes to a high-single-digit pace and the multiple holds. Bear: a consumer-credit downturn hits spending and provisioning at once, exactly the double exposure the skeptic case rests on. Watch: the quarterly net write-off rate and 30-plus-days-past-due disclosures, and whether Global Merchant and Network Services’ expense growth spreads to the larger consumer segments.
Visa (V) and Mastercard (MA) - the pure-network benchmark. Bull: volume growth holds and the premium multiple is sustained by the absence of credit risk. Base: steady toll-road compounding at the current rich multiple. Bear: both carry the same industry-wide merchant-litigation and interchange-regulatory overhang American Express discloses, and their premium multiples leave, if anything, less room for a growth disappointment than American Express’s already-discounted one. Watch: whether the sell-side’s Strong Buy enthusiasm for both names persists through a slower growth quarter.
Capital One (COF) - the structural read-through. Bull: Discover-integration costs fade on the timeline the market’s 9.93 times forward multiple already assumes, and the combined network ownership starts paying off. Base: a longer, messier integration that takes several years to fully show up in earnings. Bear: Discover-integration costs run longer or larger than currently assumed, and a larger, more mass-market credit book proves more exposed than American Express’s premium one in a downturn. Watch: whether the gap between Capital One’s trailing and forward multiples closes on schedule.
Risk controls
The single largest risk this piece has identified is the double exposure to a consumer slowdown: American Express’s Travel and Entertainment-skewed, premium-consumer billed business would be expected to decelerate in a downturn at the same moment its own credit provisioning rises, a combination Visa and Mastercard structurally do not share. A reader sizing a position in this name should size it with that combined exposure in mind, not with the assumption that “premium customers are safer” fully offsets the fact that American Express, unlike its most commonly cited peers, carries real credit risk on its own balance sheet.
The Delta cobrand concentration, roughly a fifth of Card Member loans and roughly an eighth of billed business behind one airline partnership, is a real single-partner risk, even though the current agreement runs through 2029 and is not a near-term renewal concern. The valuation itself is a risk control worth naming plainly: at 21.72 times trailing earnings and only about 3.8 percent of sell-side-implied upside to the average target, the stock is not priced for a large positive surprise, meaning a reader should not expect the current discount to Visa and Mastercard to close quickly without a specific, visible improvement in the credit-quality trend. Liquidity and access are not concerns here: American Express is a large-cap, highly liquid NYSE listing. What would change this risk picture for the worse is exactly what has been repeated throughout this piece: two or more consecutive quarters of a rising net write-off rate. What would change it for the better is that same metric holding flat, or falling, through the next several quarterly prints.
Methodology, sourcing, and data-quality flags
This research is built on 104 recorded claims: 82 drawn directly from American Express’s own SEC filings (the fiscal 2025 Form 10-K and the first-quarter 2026 Form 10-Q, cross-checked between the structured XBRL data and the plain-text filing itself), plus Berkshire Hathaway’s own Form 13F-HR for its ownership stake and Capital One’s own Form 8-K for the Discover merger completion date, and 22 drawn from a market-data aggregator for point-in-time price, valuation, and peer comparison figures, independently cross-checked against a second live quote source. Every one of those 104 claims is verified; none is unverified or in dispute.
Reading the five-factor evidence in plain terms: valuation leans favorable but not dramatically so, a real discount to Visa and Mastercard that is partly structurally earned by the credit risk American Express carries, with the sell-side’s own average target implying only about 3.8 percent upside, meaning the market is not obviously leaving a large amount of value unrecognized even after accounting for that discount. Growth reads strong: revenue growth has been accelerating rather than decelerating, from 9.5 percent in fiscal 2025 to 11.4 percent in the most recent quarter, with net card fees and International Card Services the standout lines, tempered only by the caution that International Card Services’ unusually fast growth may partly reflect catching up from a smaller base rather than a fully sustainable new pace. Quality reads strong: a return on average equity above 30 percent for three straight years, a diversified three-layer revenue model, and a multi-decade Berkshire Hathaway ownership stake all point to a high-quality franchise, with the one counterpoint that Global Merchant and Network Services segment income fell even in a benign year, a reminder that profitability discipline is not automatic across the whole business. Risk is where American Express’s read differs most from Visa’s or Mastercard’s: real credit risk on a $213.9 billion loan book, a net write-off rate that has already drifted up 15 percent in relative terms over two years, and roughly a fifth of Card Member loans concentrated behind one airline cobrand partnership. This is the factor doing the most work to keep the overall read from being stronger than it is. Momentum and sentiment read roughly neutral: the stock sits meaningfully below its 52-week high but well above its low, and public narrative is genuinely split between “quality compounder deserving a premium” and “structurally disadvantaged, priced accordingly,” mirrored in a Buy-rated but only modestly enthusiastic sell-side consensus. On balance, the lean is Buy: a genuine quality compounder trading at a discount that looks earned by real credit exposure rather than by a market mistake, with limited room for that read to improve further without a visible, sustained stabilization in the credit metrics that have already started to drift.
Data-quality flags:
- Market and valuation figures (price, market cap, P/E, 52-week range, sell-side targets) are point-in-time as of July 2, 2026 and move daily; they will be stale within days of publication. The live price and market-cap figures shown above this article update from a separate, real-time quote feed.
- Trailing-twelve-month figures cited here (trailing P/E, TTM EPS) are constructed from the two most recent fiscal-year figures and the two most recent comparable quarters as filed; different data providers can compute a TTM figure slightly differently, which is why this piece prefers the plainly-filed annual and quarterly GAAP figures wherever precision matters.
- Capital One’s trailing P/E of 47.69 times is distorted by one-time Discover merger-integration costs depressing reported trailing net income; this piece flags that context explicitly rather than presenting the multiple in isolation.
- Every forward-looking dollar level in the scenarios above is an estimate, built on stated assumptions and disclosed arithmetic, and none of them is a price target or personalized advice.
- Sentiment content in this piece is presented as narrative signal, attributed to its source, and never asserted as an independent fact about the business.
Key sources: American Express Company Form 10-K for fiscal year 2025 (filed February 6, 2026) and Form 10-Q for the quarter ended March 31, 2026 (filed April 23, 2026), both via SEC EDGAR; SEC XBRL company-facts data for American Express (CIK 0000004962); Berkshire Hathaway Inc. Form 13F-HR for the quarter ended March 31, 2026; Capital One Financial Corporation Form 8-K, Item 2.01, filed May 19, 2025; a market-data aggregator snapshot dated July 2, 2026, for price, valuation-multiple, and peer-comparison figures on American Express, Visa, Mastercard, and Capital One.
Prepared July 2, 2026. Figures are point-in-time and will change. This is research and analysis for educational purposes, not investment advice, not a recommendation, and not a solicitation. Payments and consumer-lending stocks are exposed to the credit cycle and can move fast when that cycle turns. Verify all figures independently and consult a licensed financial advisor before making any decision.