
Research date: June 25, 2026 | OSINT research on Visa Inc. (NYSE: V), a global payment network that earns a toll on roughly $14.2 trillion of annual card spend without carrying a dollar of credit risk, and what the regulatory and litigation overhang means for the price path over the next five years. Live prices; stamped hard.
Important disclaimer. This is OSINT-based research published for educational and informational purposes only. It is not investment advice, a solicitation, or a recommendation to buy or sell any security. I am not a financial advisor. Payment networks face regulatory, litigation, and competitive risks that can materially alter earnings. All figures - prices, market caps, valuation multiples, revenue data, and forward scenarios - are point-in-time as of June 25, 2026, and move continuously. Every bull, base, and bear price level is an illustrative estimate built on stated assumptions, not a price target. Do your own due diligence and consult a licensed financial advisor before making any investment decision.
Where this stock could be in 6 months, 1 year, 3 years, and 5 years
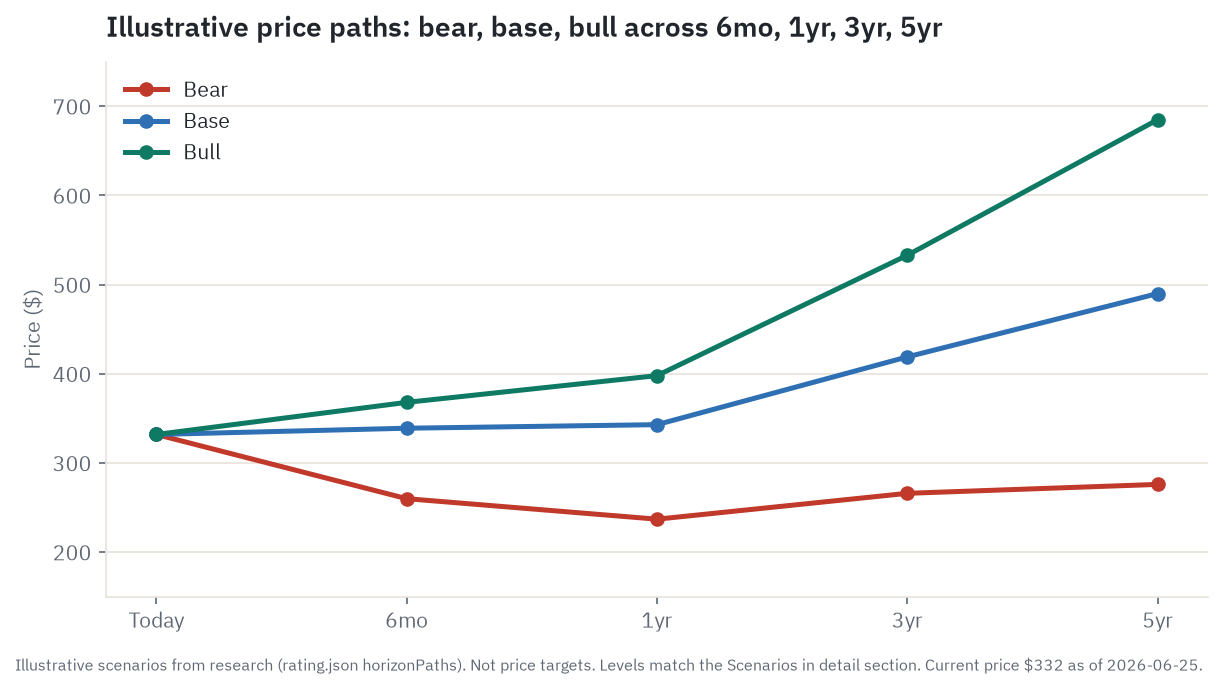
Six months. The next two earnings prints set the narrative for the rest of the year. Management guided “low-double-digit to low-teens” net revenue growth for the second half of FY2026, a deliberate step down from the first half’s 15 to 17 percent pace, and how much it decelerates will define the earnings story heading into 2027. Two other events matter in parallel: the MDL interchange settlement is moving toward a final-approval hearing expected in late 2026, and the CCCA’s sponsors are still searching for a legislative vehicle after three failed attachments. In the base case, the stock drifts slightly higher to roughly $339 as earnings grow into a stable multiple. The bull at roughly $368 requires a Q3 earnings beat and another CCCA attachment failure. The bear at roughly $260 is a double compression - a Q4 miss landing simultaneously with a CCCA attachment to the FY2027 NDAA (the National Defense Authorization Act, the annual must-pass military spending bill that sponsors have used as an attachment vehicle) or a budget reconciliation vehicle - that forces both earnings estimates and the multiple down at once. The most likely single thing that flips the base to bear in this window is a surprise CCCA vehicle, not an earnings miss.
One year. The controlling variable over twelve months is the DOJ debit antitrust case. Fact discovery closes October 16, 2026. Expert discovery runs to April 2027. Summary judgment motions begin around May 2027. A partial adverse ruling on the cliff-pricing claim at that point would be the most significant legal development since the DOJ filed the complaint in September 2024, forcing the market to assign a real probability to a 2028 trial that threatens Visa’s roughly $7 billion of annual US debit network fees. That is the bear’s roughly $237 scenario, reflecting 19x on revised earnings. Base at roughly $343 assumes no adverse DOJ ruling and a stable multiple near 23x on roughly $14.92 estimated FY2027 non-GAAP EPS. Bull at roughly $398 requires the CCCA to fail another vehicle and the DOJ case to produce no adverse summary judgment ruling, letting the market re-rate toward 26x on roughly $15.32 estimated FY2027 EPS. The spread from bear to bull is about $161 and almost entirely a function of the regulatory binary.
Three years. The structural drivers start to dominate. VAS revenue, at $10.9 billion in FY2025 growing at roughly 24 percent, reaches an estimated $17 to $23 billion by FY2029 under different scenarios and becomes a more decisive share of the overall business. Whether the client incentive ratchet - which rose from roughly 17 percent of gross revenues in FY2015 to 28.3 percent in FY2025 - stabilizes or keeps climbing is the central margin-quality question at this horizon. Base at roughly $419 reflects 10.5 percent estimated EPS compounding at a stable 23x multiple in a resolved-but-monitored regulatory environment. Bull at roughly $533 reflects both faster EPS compounding at 13.5 percent and a modest re-rate to 27x as regulatory clarity returns. Bear at roughly $266 reflects a DOJ adverse verdict and some early CCCA routing mandates taking effect, holding EPS growth near 5 percent and compressing the multiple toward 17x. The gap from bear to bull at this horizon is nearly $270 and it is entirely structural.
Five years. At five years the question becomes which of two paths Visa is on. The bull path at roughly $685 is a network that co-opted or survived every regulatory challenge, grew VAS to roughly $22 to $25 billion, and held the right to trade near 27x forward earnings on roughly $25-plus estimated EPS. Base at roughly $490 is steady compounding at 10.5 percent annual EPS growth with the regulatory discount narrowing but not closing, a 22x terminal multiple on roughly $22 estimated EPS. Bear at roughly $276 is a Visa that faced both adverse DOJ debit remedies and partial credit routing competition from a CCCA passage, with EPS growing only 5 percent annually to roughly $17, repriced toward a utility multiple of 16x. Every level here is a scenario estimate derived from stated assumptions, not a target.
Where the read lands today. On balance, the read holds at Buy. This is a business with near-zero credit risk earning roughly 67 percent non-GAAP operating margins on $40 billion of net revenue, trading at a roughly 30 percent discount to its own historical average multiple, where the discount reflects a regulatory and litigation overhang whose timeline is long but whose existential impact on the franchise is, in this research’s assessment, far from guaranteed. The single thing most likely to flip that read downward is a CCCA vehicle - which has failed four times across 2025 and 2026 but has not been definitively foreclosed.
Companion tool
Jump to the interactive dashboard to sort and filter every company in this piece, or download the Excel model to flex the scenarios yourself.
TL;DR
Visa is a pure-play toll road on global commerce. It runs VisaNet, the authorization and settlement rail that clears roughly $14.2 trillion of annual payment volume, and earns an average of about 24 basis points (one basis point is one one-hundredth of a percentage point, so 24 basis points equals 0.24 percent of each dollar processed) of that dollar flow as net revenue without holding a single dollar of credit risk or inventory. The banks that issue Visa cards - JPMorgan, Bank of America, Citigroup, and thousands of others - lend the money, carry the fraud liability, and fund the rewards programs. Visa collects the network fee on every transaction that crosses its rails. That structural position generated $40.0 billion in FY2025 net revenue (after $15.8 billion in client incentives paid back to the ecosystem to defend routing share), a non-GAAP operating margin of roughly 67.7 percent, and roughly $21.6 billion of free cash flow. On top of that core, value-added services growing at 24 percent reached $10.9 billion in FY2025, representing 27.3 percent of net revenue, and Visa Direct processed 12.6 billion push-payment transactions, growing 27 percent. The most consequential risk is not disruption from stablecoins or real-time rails (both of which Visa is actively co-opting) but the combination of the DOJ debit antitrust case (in discovery through October 2026, trial projected 2027 to 2028, injunctive remedies only), the interchange MDL settlement (preliminary approval from Judge Cogan around June 9, 2026 - still awaiting final hearing), and the Credit Card Competition Act, which has failed every legislative vehicle in 2025 and 2026 but has not been declared dead. At roughly $332 on June 25, 2026, the stock trades at approximately 23.8x forward earnings, a meaningful discount to its own five and ten-year averages near 33.6x. On balance, the read is Buy, on the view that the discount reflects an overstated near-term timeline for the regulatory bear case. The bear case in this piece is real; you should read it.
Explore it yourself: the interactive dashboard
Open the dashboard in a full screen
The dashboard holds twelve companies from the payments ecosystem, sortable by market cap, valuation multiples, and revenue growth. Use it to compare Visa’s metrics directly against Mastercard, American Express, PayPal, and the processors as you read. Every level in the scenario tab follows the same stated assumptions as the scenarios in this article.
Prefer a spreadsheet? Download the Excel model for the full company table and an adjustable scoring sheet.
The toll booth on global spending
Think of Visa as the highway authority, not the car company, not the fuel supplier, and not the shipping firm. Every time money flows across a Visa-branded card - at a grocery checkout, an online booking site, a food stall in Jakarta - a digital signal travels over VisaNet, gets authorized in under 100 milliseconds, and returns an approval. Visa charges a small, invisible toll for that transit. The car, meaning the cardholder’s money, keeps moving. The cargo, meaning the goods and services, arrives. Visa clips a few cents on the way through without ever owning the car, the cargo, or the road surface.
The distinction matters for analysis. Visa carries no consumer credit risk. It does not lend money, does not issue cards, and does not fund rewards programs. When a cardholder defaults on a credit card bill, the loss falls on the bank that issued the card - not on Visa. When a fraudulent transaction slips through, the liability sits with the issuing bank or, in some cases, the merchant. The network collects its toll whether the consumer pays their bill next month or not. This is the structural fact that produces the 67 percent operating margin and the near-60 percent free-cash-flow yield on net revenue.
What Visa does own is the rulebook and the rail. VisaNet processed 257.5 billion transactions in FY2025 (the fiscal year ending September 30, 2025), up 10 percent from FY2024. More than 4.9 billion Visa-branded payment credentials circulate globally. There are over 175 million merchant acceptance locations in more than 220 countries and territories. That is the most universal acceptance footprint in the history of money movement, and every tap, swipe, or virtual card number that touches it pays a toll to Visa Inc.
The duopoly context is essential from the start. Visa and Mastercard run the two dominant global card networks. Their combined US purchase volume was roughly $9.99 trillion in calendar 2025 per Nilson Report data (an analyst-tier source). Mastercard is the natural peer: same business model, same margins, same regulatory exposure, virtually identical moat. No other player at scale competes on the network level itself. The rest of the competitive set is sorted by how much of its business rides Visa rails versus bypasses them, and the answers are often surprising.
One number anchors everything that follows: Visa’s net revenue of $40.0 billion in FY2025. That revenue comes from a world where every dollar of the roughly $16.7 trillion in total annual volume processed over Visa’s network (including cash/ATM; payments volume was roughly $14.2 trillion) generated an average of about 24 basis points of network fee income. Small yield on each dollar; $16.7 trillion of annual volume to collect it from; near-zero marginal cost per additional transaction once the network is built and maintained. That is the business.
How the money flows
flowchart TD
    SPEND["Cardholder Spend\n$14.2T payments volume FY2025"]
    ISSUER["Issuing Bank\nJPMorgan, BofA, Citi et al.\nKeeps interchange ~1.75%\nCarries all credit risk"]
    VISANET["VisaNet — Visa Inc.\nAuthorize / clear / settle\nEarns ~0.14% assessment\n+data processing fee/txn\nNet revenue $40.0B FY2025"]
    ACQUIRER["Acquirer / PSP\nGlobal Payments $2.8T vol\nJPMorgan $2.5T, Fiserv $2.2T\nAdyen (enterprise direct)\nStripe, Square (SMB)\nKeeps markup ~0.07-0.54%\nCommodity layer"]
    MERCHANT["Merchant\n175M acceptance locations\nNets ~97.50 per $100 swipe"]
    XBORDER["Cross-Border Premium\nExtra fee + FX spread\n$14.2B intl-tx revenue\nHighest-margin segment"]
    VAS["Value-Added Services\nFraud tools, tokenization,\nopen banking, stablecoin\n$10.9B FY2025 +24% YoY"]
    INCENTIVE["Client Incentives\nRebates to issuers\nand partners\n-$15.8B FY2025\n28.3% of gross"]

    SPEND -->|card authorization request| ISSUER
    ISSUER -->|auth decision across VisaNet| VISANET
    VISANET -->|decision returned to terminal| ACQUIRER
    ACQUIRER -->|settlement to merchant| MERCHANT
    MERCHANT -->|MDR deducted before settlement| ACQUIRER
    ACQUIRER -->|interchange remitted to issuer| ISSUER
    ACQUIRER -->|network/assessment fee| VISANET
    VISANET -->|cross-border transactions| XBORDER
    XBORDER -->|premium revenue| VISANET
    VISANET -->|layers on top of network| VAS
    VISANET -->|to win/retain volume| INCENTIVE
Walk that diagram from the top down and you get the whole business in one picture.
A cardholder taps her phone to pay at a merchant. The authorization request travels across VisaNet to her issuing bank - Chase, Bank of America, Citibank - which approves or declines in milliseconds. The decision returns through the acquiring bank or payment service provider to the merchant’s terminal. Settlement runs separately on a T+1 or T+2 cycle.
When the settlement runs, the merchant’s account receives the sale price minus the merchant discount rate (MDR), which typically runs 2 to 2.5 percent on a standard consumer credit transaction. The MDR is then disaggregated into three flows. About 1.5 to 2.0 percent flows as interchange from the acquirer back to the issuing bank. That is the issuer’s reward for funding the credit, absorbing fraud risk, and running the rewards program that keeps cardholders spending. About 0.14 to 0.16 percent flows to VisaNet as the network/assessment fee - Visa’s direct toll. The remaining strip, anywhere from 0.07 to 0.5 percent depending on the processor and the merchant’s negotiated rate, stays with the acquirer. Global Payments (which closed its Worldpay acquisition on January 9, 2026), JPMorgan Payments, and Fiserv are the three largest US acquirers by volume; Adyen (which serves large global enterprise merchants directly, often processing across multiple geographies without sub-processors - a model that competes on cost and breadth rather than local service), Stripe, and Square compete hard for margin in this layer from different positions.
One thing is critical to keep straight: Visa does not earn interchange. Interchange is set by Visa in its fee schedule but flows from acquirer to issuer. When regulation caps interchange - as the EU’s Interchange Fee Regulation does for European consumer cards, or as the MDL settlement does for US consumer credit at 1.25 percent for eight years - the immediate financial impact falls on issuing banks, not on Visa’s revenue line. The indirect effect on Visa comes through issuer economics: lower interchange constrains the rewards programs and card-issuance incentives that drive volume over Visa rails, and weakens Visa’s pricing position in fee negotiations at contract renewal.
The two lines to watch in the diagram are the cross-border premium and the client incentives flowing back out. Cross-border transactions earn both a higher assessment fee and a currency-conversion premium, yielding roughly 40 to 60 basis points per dollar versus roughly 13 to 14 basis points on a domestic debit transaction. That premium is why international transaction revenue ($14.2 billion in FY2025) carries disproportionate earnings weight. And client incentives - the $15.8 billion paid back to issuers, acquirers, and large merchants to win or renew routing - are the cost of staying the preferred rail in a world where Mastercard is always one contract renewal away from underbidding. The gap between gross revenues ($55.8 billion) and net revenues ($40.0 billion) is that incentive bill, and it is the most load-bearing variable in the five-year model.
The four revenue engines
Visa reports four gross revenue categories, and understanding what drives each one tells you almost everything about the business’s sensitivity to macro, mix, and competitive scenarios.
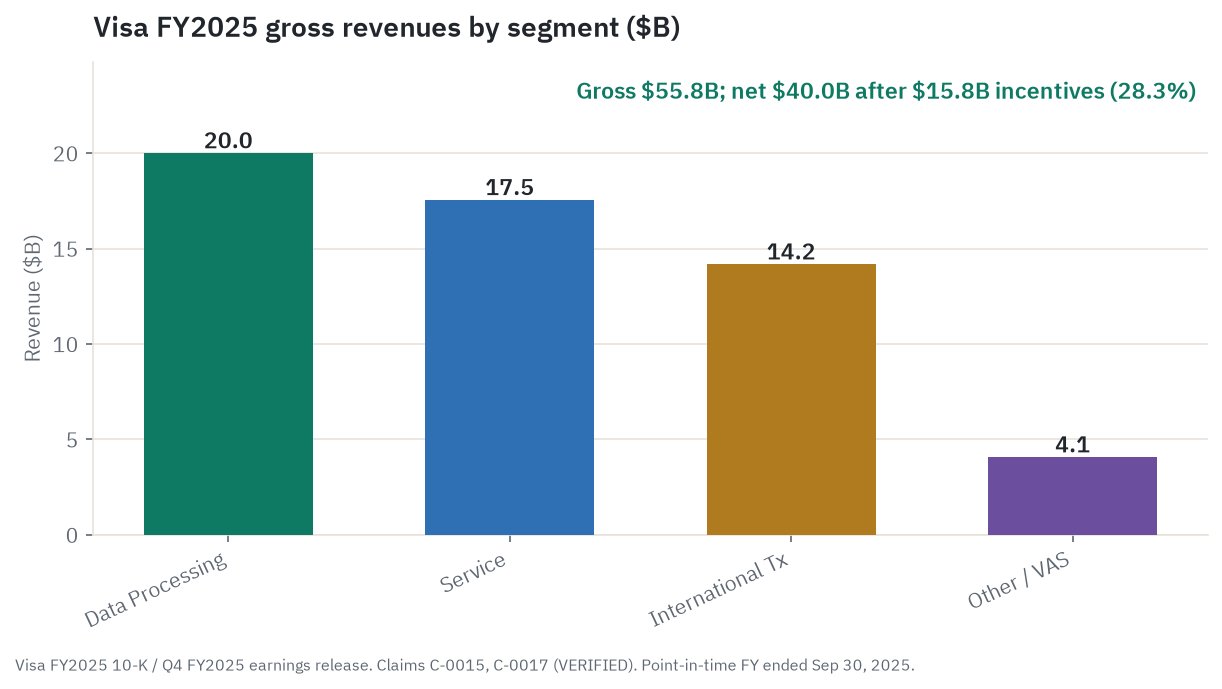
Service revenue ($17.5 billion, FY2025, +9 percent). The oldest and most stable line. Service fees are billed as a percentage of the nominal payments volume from the prior quarter (a one-quarter billing lag), so they grow with consumer spending on Visa cards. US consumer payments volume was $6.8 trillion in the twelve months ending June 30, 2025; international was $7.1 trillion. Service revenue is the broadest measure of that activity in fee income, and it is the line most directly exposed to consumer recession risk.
Data processing revenue ($20.0 billion, FY2025, +13 percent). This line grows with processed transaction count rather than with dollar volume alone. The proliferation of small-ticket contactless and mobile payments - a $3 coffee paid by tap, a $12 delivery order on an app - drives transaction count faster than dollar volume. Visa processed 257.5 billion transactions in FY2025, up 10 percent. Data processing also earns per-transaction fees on card-not-present transactions at a higher rate than card-present, a structural tailwind as e-commerce grows. This is now the largest single revenue category.
International transaction revenue ($14.2 billion, FY2025, +12 percent). When a Visa card issued in one country is used in another - a British tourist in Japan, an American buying from a German online store - Visa charges both a cross-border assessment and a currency-conversion spread on top of its standard network fee. The combined yield on these transactions runs roughly 40 to 60 basis points per dollar, several times the domestic debit rate. Cross-border volume grew 13 percent in constant-dollar terms in FY2025. This is the highest-margin revenue driver, the most cyclically exposed (it fell roughly 19 percent at the COVID trough), and the fastest-recovering since borders reopened. In Q2 FY2026 cross-border ex-intra-Europe grew 11 percent constant-dollar, with e-commerce at 13 percent and travel at 10 percent.
Other revenue / VAS ($4.1 billion reported, FY2025, +27 percent). The “Other” label understates what this line represents. VAS revenue embedded across all four reported lines reached $10.9 billion in FY2025, up 24 percent from $8.8 billion in FY2024. That figure represents 27.3 percent of FY2025 net revenue. The pace is accelerating: in Q2 FY2026, VAS was $3.3 billion for the quarter alone, up 27 percent year-over-year and representing about 30 percent of that quarter’s net revenue.
The incentive wedge. Against $55.8 billion of gross revenue sits the $15.8 billion contra-revenue line for client incentives - volume-based rebates paid to large issuers, acquirers, merchants, and digital wallet operators to win or retain routing share. In FY2025 the incentive rate was 28.3 percent of gross revenues, up from 27.7 percent in FY2024 and from roughly 17.1 percent in FY2015. Ten years; 11-plus percentage points of ratchet.
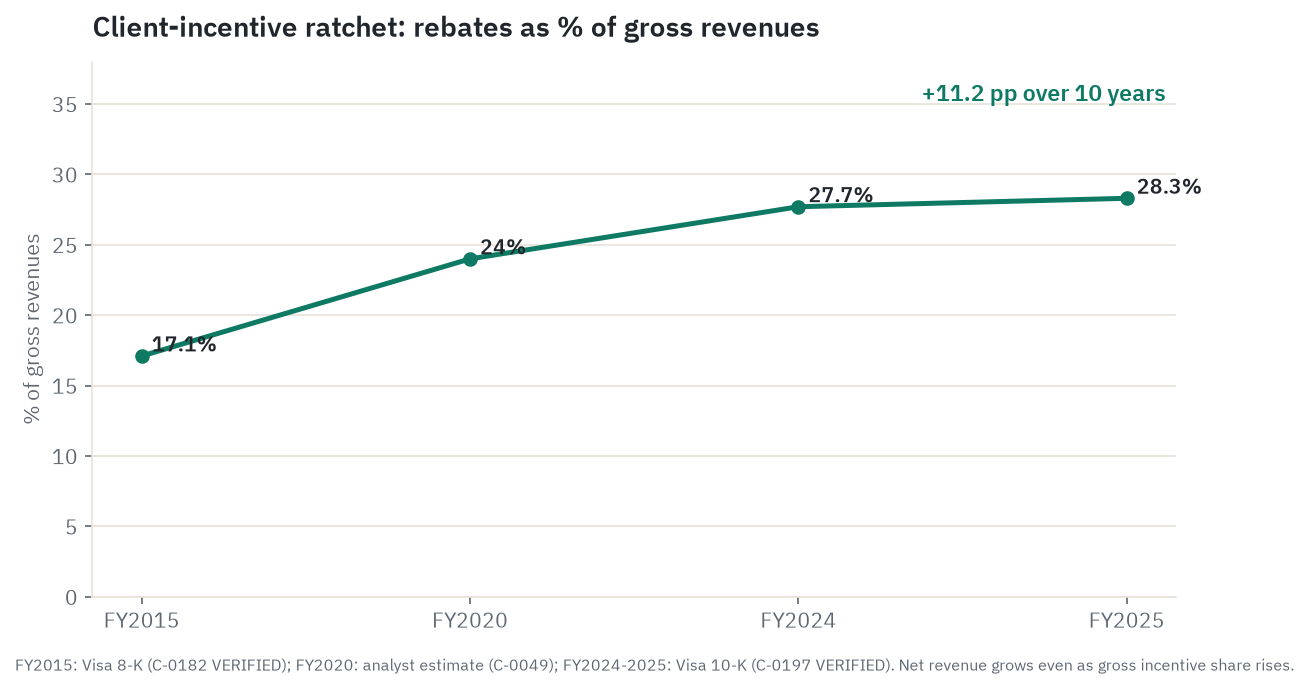
Each 1 percentage point rise in the incentive rate costs Visa roughly $558 million in net revenue at the FY2025 gross revenue base. Management has said FY2026 incentive growth will “mirror 2025 levels” - roughly 14 percent - which means incentives are still outpacing net revenue in normal conditions. The bull case requires VAS and cross-border mix to lift blended net revenue fast enough to stay ahead of that drag. The bear case is that incentives reach 30 to 31 percent of gross before VAS is large enough to compensate, and the gross-to-net conversion permanently narrows.
Unit economics, take-rate, and pricing power
Here is where the business economics become genuinely unusual.
Visa collected $40.0 billion in net revenue against roughly $16.7 trillion in total annual volume, producing a blended net yield of about 24 basis points per dollar processed. Or, expressed differently, Visa collected about 15.5 cents in net revenue on every one of the 257.5 billion transactions it processed. At near-zero marginal cost per additional transaction once the network is built and maintained, those 15.5 cents are almost entirely margin.
The per-transaction economics vary sharply by type. A domestic US debit transaction earns roughly 13 basis points on the dollar plus about $0.0155 per transaction. A cross-border credit transaction in a foreign currency earns the assessment plus the currency conversion premium, yielding closer to 40 to 60 basis points. A VAS contract - a fraud-screening subscription, a tokenization service license - earns a software-like margin with no volume dependency at all. The blended 24 basis points is an average across a portfolio that has been quietly shifting upward toward higher-yield segments.
Pricing power is real but works through an indirect mechanism. Visa cannot unilaterally raise the price of acceptance at the merchant level without issuer response - and the issuer’s willingness to route over Visa’s network rather than Mastercard’s is the commercial relationship that determines whether those gross fee increases actually flow through to net revenue. When Visa raises scheme fees (the European and regulatory term for Visa’s own network and assessment fees - a different name for the same toll Visa collects, not an additional charge on top; it raises them routinely, in October and January of most years), it must negotiate how much of that increase flows back to major issuers as incentives at contract renewal. The incentive ratchet is the footprint of those negotiations. JPMorgan’s 10-year Visa infrastructure deal, as reported by Digital Transactions, is the clearest public example of how that negotiation resolves: long-term routing locked in exchange for a substantial incentive package.
Merchants cannot decline Visa-branded cards without losing the spending power of 4.9 billion credentials. No single large merchant has enough scale to force the issue without losing too much volume. That bilateral lock-in is the source of Visa’s network-level pricing stability.
Where pricing power is most constrained: US debit. The Durbin Amendment (Section 1075 of the 2010 Dodd-Frank Act, which required large bank debit issuers to enable at least two unaffiliated debit networks on every debit card they issue and capped the interchange those banks could earn on debit transactions) created routing mandates that already require merchants to have access to two unaffiliated debit networks. The DOJ case targets the exclusionary contracts that limit that routing in practice. The CCCA would extend analogous routing mandates to credit cards if it passed. Each of those regulatory developments - actual or threatened - compresses the amount of gross fee increase Visa can retain in net revenue on the US domestic side.
Where pricing power is least constrained: cross-border. No regulatory cap exists on Visa’s cross-border assessment fees or FX conversion spread. The bear case for that revenue line depends on volume deceleration rather than fee compression.
The net take-rate has been broadly stable at roughly 23 to 25 basis points over recent years, held steady by the offsetting forces of gross fee increases and rising incentive drag. Whether VAS and new flows can structurally lift the blended yield above that band - by contributing higher-margin software revenue with lower incentive drag than core consumer payments - is the central question for margin trajectory over three to five years.
New flows and value-added services
The phrase “network of networks” is real in Visa’s case, not a tagline. The company has spent five years building a software layer on top of its transaction rail that generates independent revenue whether or not the underlying payment is a Visa-branded card swipe.
Value-added services ($10.9 billion, FY2025, +24 percent). The VAS umbrella covers five distinct sub-businesses. Issuing Solutions includes Visa’s debit-processing service, card lifecycle management, and the Pismo cloud-native core banking platform (acquired January 2024 for $1 billion) that lets any bank or fintech spin up a new card program on Visa infrastructure. Acceptance Solutions encompasses CyberSource, Visa’s payment gateway and fraud-screening platform for merchants, which earns revenue on non-Visa transactions that flow through the gateway. Risk and Identity Solutions now incorporates Featurespace (acquired December 2024), an AI-native transaction monitoring platform that processes over 100 billion payment events per year and protects roughly 500 million consumers. Open Banking runs through Tink (acquired March 2022 for approximately $2.1 billion at deal announcement), a European platform connecting over 6,000 banks and financial institutions across 19 markets, with over 10,000 merchants on Tink’s Pay by Bank product. Advisory and Other covers consulting to issuers on portfolio optimization and co-brand management.
The VAS total addressable market is estimated at $520 billion annually per Visa’s February 2025 Investor Day (a primary source). At $10.9 billion in FY2025, Visa is at roughly 2 percent penetration of that opportunity. The CEO has described VAS margins as “very attractive” - management does not disclose segment operating margins, but the software-and-services nature of these lines implies significantly higher incremental margins than the core network business, which is itself at 67 percent.
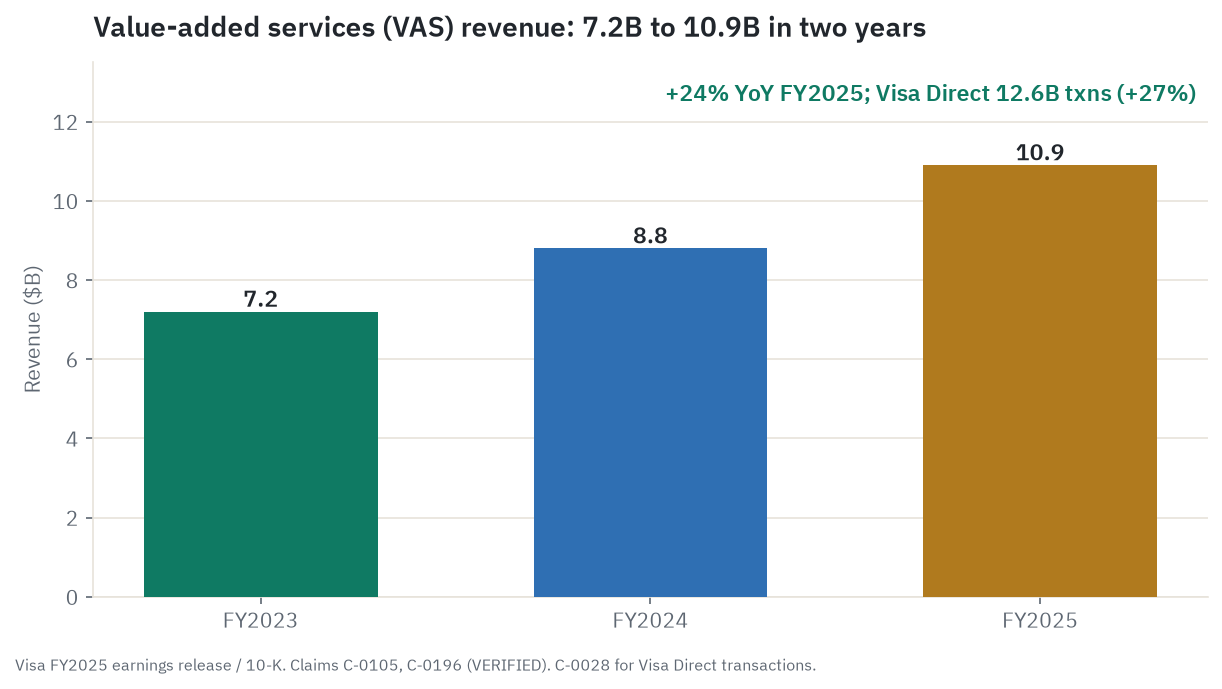
Visa Direct (12.6 billion transactions, FY2025, +27 percent). Visa Direct is the push-payments network - the infrastructure for moving money point-to-point without a card-on-file transaction. It powers gig-economy payouts (a rideshare driver receiving daily earnings to a debit card), insurance disbursements, government-to-consumer payments, payroll, and peer-to-peer remittances across borders. The network reached 18 billion-plus endpoints globally as of Q2 FY2026. In that quarter alone, Visa Direct processed 3.7 billion transactions, up 23 percent year-over-year. The addressable New Flows market - covering B2B, B2C, P2P, and government flows - is estimated at $200 trillion annually per Investor Day (primary source), with commercial cards representing a $35 trillion sub-segment and cross-border B2B representing $25 trillion.
Visa B2B Connect. Separate from Visa Direct’s push-payment model, Visa B2B Connect is a non-card, bilateral network for large-value cross-border business payments between financial institutions. It operates outside the traditional four-party card model - transactions clear directly between participating banks over a shared ledger rather than running through an acquirer-issuer chain. The segment it targets is one of the highest-fee, most friction-laden corridors in global finance, where wire transfers and correspondent banking relationships have historically been slow and expensive. Visa does not disclose B2B Connect volume separately, but it sits within the New Flows pillar management calls out as a long-duration growth opportunity.
Stablecoins: co-option in progress. Visa’s $7 billion annualized stablecoin settlement run rate as of Q2 FY2026 (reported April 28, 2026 in the Q2 FY2026 8-K, a primary source) is the right starting figure. The right context to put it in immediately: that volume is less than 0.05 percent of Visa’s $14.2 trillion annual payments volume. Stablecoin settlement is not displacing card transactions; it is replacing traditional banking settlement channels between Visa and its bank counterparties. The underlying consumer-facing card transaction still runs over VisaNet and still pays Visa’s network fees. Settlement in USDC over Solana or Ethereum is faster and available 24/7 - it positions Visa as a stablecoin infrastructure provider while the card economics stay intact.
As of Q2 FY2026 Visa’s stablecoin settlement network spans nine blockchains and includes 160-plus stablecoin-linked card programs in over 40 countries. The December 2025 Stablecoins Advisory Practice launch (primary source, Visa press release) added a consulting service helping banks, fintechs, and merchants develop stablecoin strategy, with clients including Navy Federal Credit Union.
The genuine stablecoin risk to Visa is not consumer retail bypass (stablecoins lack fraud protection, dispute resolution, and the rewards economics that drive consumer card choice) but the possibility that large-scale merchant adoption of direct stablecoin checkout develops in cross-border B2B - the segment where Visa’s cross-border premium is highest and where Stripe’s stablecoin merchant offering (USDC/USDB acceptance in 70-plus countries as of 2025 to 2026) creates a structural alternative. This is a real but medium-to-long-term risk. The CFO was explicit about it in June 2026: “hesitant to lean into the stablecoin and agentic commerce narratives too much” (Fortune, June 10, 2026).
Tokenization. Over 50 percent of Visa’s global transactions were tokenized as of FY2025, with more than 16 billion network tokens issued (per Q4 FY2025 earnings call, a primary source). Industry projections suggest 85 percent of global e-commerce will be tokenized by 2028 (Glenbrook Partners, analyst tier). Tokenization reduces fraud, improves authorization rates, and is the technical basis for agentic payments where an AI system makes purchases on a consumer’s behalf. Visa’s Intelligent Commerce platform, with 100-plus global commerce partners, is building on this foundation.
What the filings say
Visa’s FY2025 10-K (filed November 2025, CIK 0001403161) and Q2 FY2026 10-Q (filed April 2026) tell a consistent story: the core business is growing faster than consensus expected, the balance sheet is strong, and the material complication is the litigation cluster the company itself identifies as its primary risk factor.
Revenue and margins
Net revenues grew from $32.7 billion in FY2023 to $35.9 billion in FY2024 to $40.0 billion in FY2025, a compound rate of roughly 10.5 percent per year. The pace then accelerated materially through the first half of FY2026.
| Period | Net Revenue | YoY Growth |
|---|---|---|
| FY2023 | $32.7B | +10% |
| FY2024 | $35.9B | +10% |
| FY2025 | $40.0B | +11% |
| Q1 FY2026 (Dec 2025 qtr) | $10.9B | +15% |
| Q2 FY2026 (Mar 2026 qtr) | $11.2B | +17% |
| H1 FY2026 | $22.1B | +16% |
The Q2 FY2026 8-K (filed April 28, 2026) attributed the 17 percent growth - the fastest pace since 2022 - to resilient consumer spending, strong cross-border recovery, VAS acceleration, and pricing.
Non-GAAP operating margin held at approximately 67.7 percent in FY2025. The GAAP operating margin was 60.0 percent. The roughly 7.7-percentage-point gap between the two - worth approximately $2.56 billion in operating income at the FY2025 revenue base - comes almost entirely from the litigation provision recorded for the MDL settlement accrual. Under GAAP, that provision flows through operating income and depresses the reported margin; non-GAAP accounting excludes one-time litigation charges to show the underlying business margin. The provision routes through the Retrospective Responsibility Plan (described in the share structure section below), so the economic cost falls on Class B bank shareholders rather than on Class A public holders. The non-GAAP figure is the more meaningful ongoing measure of what the operating business earns.
Non-GAAP EPS grew from $8.77 in FY2023 to $10.05 in FY2024 to $11.47 in FY2025. Through H1 FY2026, non-GAAP EPS was $6.48, tracking above the full-year consensus of roughly $13.20.
Payments volume and transactions
Visa’s total payments volume for the twelve months ending June 30, 2025 (the period used to calculate service revenue) was approximately $13.9 trillion: consumer credit $5.6 trillion, consumer debit $6.6 trillion, commercial $1.7 trillion. The proxy statement cites $14.2 trillion on a September 30 year-end basis. Consumer debit is the single largest category by volume, which is why the DOJ debit case carries meaningful structural weight.
Processed transactions grew from 212.6 billion in FY2023 to 233.8 billion in FY2024 to 257.5 billion in FY2025, a consistent 10 percent annual pace. Transaction count is growing faster than dollar volume because of the mix shift toward small-ticket contactless transactions, a structural trend that lifts data processing revenue even in periods of modest nominal-spending growth.
Free cash flow and capital returns
Free cash flow was approximately $21.6 billion in FY2025 ($23.1 billion operating cash flow minus $1.5 billion capital expenditures), a 54 percent FCF margin on $40.0 billion of net revenue. The business converted more than half of every dollar of revenue into free cash, with no raw-material cost, no inventory, and no credit exposure. That metric is the clearest expression of what the moat actually produces.
Total capital returned in FY2025 was $22.8 billion ($18.2 billion in buybacks plus $4.6 billion in dividends), exceeding GAAP net income of $20.1 billion. Visa funded the excess from operating cash flow and modest debt. Three buyback authorizations are relevant: the $25 billion October 2023 authorization was completed; the $30 billion April 2025 authorization had $13.2 billion remaining as of March 31, 2026; and a new $20 billion authorization was announced April 2026. The quarterly dividend was raised 14 percent to $0.67 per share in October 2025 (a $2.68 annual run rate, roughly 0.81 percent yield at $332).
Class A shares outstanding declined from 1,691 million at September 30, 2025, to 1,660 million at March 31, 2026 - a reduction of about 2 percent in six months. The H1 FY2026 buyback pace was roughly $11.6 billion, with Q2 alone spending approximately $7.9 billion to repurchase 25 million shares at a weighted average of $320.66.
Balance sheet and debt
Net debt at March 31, 2026, was approximately $11.6 billion ($24.0 billion of total debt minus $12.4 billion in cash and investments). Against $21.6 billion of annual free cash flow, that is roughly 0.5x levered. Visa issued $3.9 billion of Euro senior notes in May 2025 and $3.0 billion of US senior notes in February 2026 at 3.8 to 4.7 percent, refinancing the $4.0 billion December 2025 maturity. Interest expense was $589 million in FY2025, a small fraction of free cash flow.
The litigation escrow balance fell from $3.0 billion at September 30, 2025, to $665 million at March 31, 2026. This reflects escrow payments made through the MDL settlement process. Crucially, these payments flow through the Class B conversion mechanism: the original US bank member institutions (Class B holders) absorb the cost, not Class A public shareholders.
The share class structure and Retrospective Responsibility Plan
Visa Inc. has three classes of common shares, each with different ownership and trading rules.
Class A shares are the publicly traded shares, listed on NYSE and held by retail and institutional investors. All price, market-cap, and EPS references in this piece refer to Class A, unless stated otherwise.
Class B-1 and B-2 shares are held by the original US financial institution members from Visa’s 2008 IPO - the banks that founded and owned the Visa network before it went public. They cannot be freely sold in the public market. Their conversion rate to Class A reduces each time Visa deposits cash into the US litigation escrow, which is the deliberate mechanism that makes B-holders absorb the cost of pre-IPO bank-member litigation while protecting Class A public holders.
That mechanism is the Retrospective Responsibility Plan. It was established at the 2008 IPO specifically to address the fact that Visa was going public while carrying unresolved interchange litigation that was the historical liability of its US member banks. Each escrow deposit reduces the number of Class A shares that B-1 and B-2 shares can convert into, so the economic weight of each settlement installment falls on the original bank members rather than on the public. In FY2025, Visa deposited $875 million into escrow - an amount equivalent to repurchasing roughly 3 million Class A shares at $343 each, all paid by the B-holders, not the public market. In April 2026, Visa launched an exchange offer for all outstanding Class B-1 and B-2 shares (expired May 8, 2026) for Class B-3, Class C, and cash - a structural step toward capital simplification as the MDL litigation approaches final resolution.
Class C shares (8.9 million shares outstanding per the FY2025 10-K) are held by the sellers of Visa Europe when Visa acquired that business in 2016. Like Class B shares, Class C shares carry conversion and resale restrictions and must convert to Class A before being sold publicly. The conversion ratio is 4 Class C shares to 1 Class A share. Class C holders vote on corporate matters on the same basis as Class A. Their existence is a legacy of the Visa Europe integration, not an ongoing issuance program.
Insider and institutional ownership
Vanguard held 8.18 percent of Class A shares and BlackRock held 7.32 percent, both as passive index owners per the December 2025 proxy (citing 13G filings that may reflect positions as of early 2024 - flagged as potentially stale). No activist or concentrated strategic holder appears at 5 percent or above. Insider activity is routine: the CFO sold approximately 10,600 shares at $324.81 in May 2026 (a small open-market sale); the CEO exercised options in April 2026. No unusual insider buying signal was identified in the trailing year.
What the market is paying
Visa closed at approximately $332 on June 25, 2026 (used here as the research anchor; StockAnalysis showed $330.52 at the official 4 PM EDT close while a second source returned $334.19 for the same date - the discrepancy is flagged as DISPUTED in the methodology section). Market cap is approximately $623 billion. The stock sits near the middle of its 52-week range of $293.89 to $359.66.
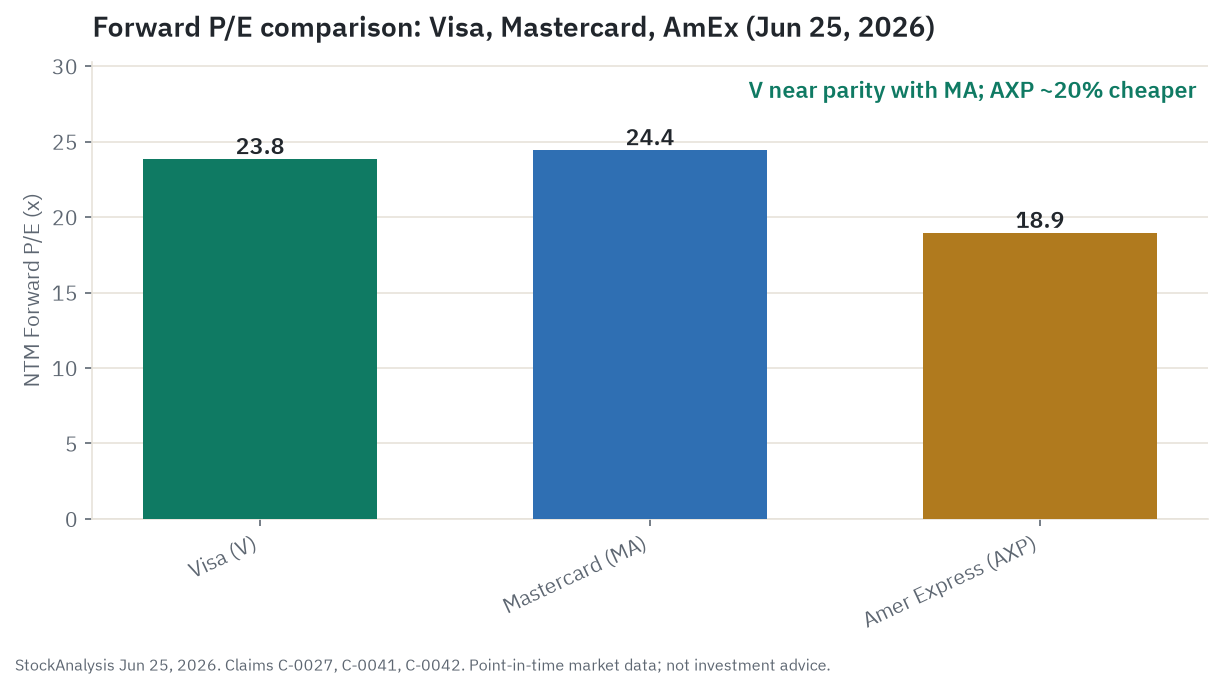
The headline valuation argument is straightforward. Visa trades at roughly 29x trailing P/E and approximately 23.8x forward P/E (StockAnalysis, June 25, 2026). Its five-year and ten-year average P/E has been approximately 33.6x (FinanceCharts / GuruFocus, analyst-tier data, UNVERIFIED at primary tier). The stock is therefore at roughly a 30 percent discount to its own historical average.
Is the discount an opportunity or a structural repricing?
The market has a specific reason for the de-rating: the DOJ debit antitrust case (filed September 2024, motion to dismiss denied as reported by Payments Dive in June 2025), the Credit Card Competition Act (Trump-endorsed January 2026, failed multiple vehicles but not dead), the preliminary-approval-only MDL settlement, and the UK FCA investigation (opened May 2026). All of those were not price risks in 2021, when Visa traded near 47x trailing P/E.
To understand the discount, you have to understand what justified the 33.6x average in the first place. Visa earned that premium because it combined three attributes that rarely coexist in a single large-cap business: near-zero credit risk (unlike banks that lend the money), near-zero marginal cost on each additional transaction (unlike manufacturers or insurers), and consistent double-digit EPS compounding driven by the structural shift from cash to electronic payments. No routing mandate existed for credit cards. The DOJ had not filed a debit antitrust case. Cross-border volumes were in post-COVID recovery, adding a cyclical kicker on top of structural growth. Investors were willing to pay multiples historically reserved for software businesses because the economics were software-like - a toll booth with no variable cost and a network that grew more valuable with each new credential. The current 23.8x multiple is the market’s implicit answer to the question: how permanently has that regime changed? A market that believed nothing had changed would pay closer to 33x; a market that believed Visa was becoming a regulated utility would pay closer to 16x. The current reading is somewhere between those poles, weighted toward “some regulation is coming, not catastrophe.”
The skeptic argues the 33.6x historical average is the artifact of a prior regime - one with expanding cross-border volumes, rising take-rates, and no live routing mandate threat for credit cards - and that the new regulatory environment justifies a permanently lower multiple. That argument has weight. The counter is that prior Visa regulatory scares (the Durbin Amendment in 2010, the EU IFR in 2015, prior DOJ debit probes) all produced fear that outran the eventual financial impact, and the business re-rated back toward its quality premium after each. Neither pattern is a guarantee going forward.
Relative performance
Visa has underperformed the S&P 500 by a wide margin in 2026. Through June 25, the stock is down roughly 7.7 percent while the S&P 500 is up roughly 11 percent (PortfoliosLab / Nasdaq data, press-tier, C-0023 DISPUTED - the range across sources is approximately -5.6 to -12.2 percent; 7.7 percent is used as the primary figure). The trailing twelve-month return is approximately -12.5 percent. The ten-year CAGR for Visa is approximately +16.5 percent versus approximately +13.8 percent for the S&P 500 (PortfoliosLab). The current underperformance is a cycle deviation from a decade of outperformance.
Mastercard has actually underperformed Visa YTD in 2026, down approximately 15.2 percent, which is unusual given MA historically trades at a modest growth premium. American Express has been the relative outperformer within the payments peer group, with its closed-loop model less exposed to the CCCA routing mandate. PayPal is down roughly 42 percent over the trailing twelve months and now trades at single-digit forward P/E multiples - a very different story from the V/MA duopoly.
Short interest and sell-side consensus
Short interest is low and declining: approximately 21.3 million shares (about 1.27 percent of float) as of the mid-June 2026 report date per MarketBeat (C-0077, press-tier), down from a peak above 2.4 percent of float in mid-2024. Days to cover is approximately 3. This is not a crowded short.
Sell-side consensus is decidedly bullish. Among 39 analysts polled by StockAnalysis / S&P Global as of June 25, 2026: 29 Strong Buy, 7 Buy, 3 Hold, 0 Sell. Mean price target in the range of $390 to $403 (two aggregators returned $390.86 and $398.83 - flagged DISPUTED; all within the same broad band). The single most bearish analyst on Wall Street has a $330 target, essentially the current price. Treat consensus as a directional signal, not a forecast: a 36-to-0 Buy/Sell split with a mean target implying roughly 20 percent upside over twelve months is a strong signal of conviction, not of certainty.
Technicals: context only
The stock sits barely above its 200-day moving average of $328.74 (Barchart, June 25, 2026) - a neutral-to-slightly constructive picture. RSI at 56.16 (Barchart, June 25; a second source returned 43.57 for a similar date - DISPUTED) is neutral. Resistance sits in the $349 to $360 band where rallies have capped multiple times in the past year. Support near $310 to $315 is the prior congestion zone. The stock is range-bound, not in a trend.
The competitive set
Mastercard (MA) - the duopoly partner
Mastercard is the natural reference point because the two companies have nearly identical business models, regulatory exposures, and moats. They are not enemies; they are a functioning duopoly that has collectively set the terms of global card acceptance for decades.
Visa holds roughly 70.4 percent of combined Visa and Mastercard US card purchase volume per Nilson Report data (CY2025, analyst-tier). Globally, Visa processed roughly $14.2 trillion in payments volume in FY2025 versus Mastercard’s gross dollar volume of approximately $10.6 trillion in its FY2025 (calendar year). Mastercard’s revenue growth in FY2025 was approximately 16 percent against Visa’s 11 percent, reflecting a higher cross-border volume mix, VAS penetration above 40 percent of revenue, and faster GDV growth.
The most relevant recent development for Mastercard is the Capital One/Discover migration, covered in detail in the scenarios section. Mastercard’s YTD performance of -15.2 percent is steeper than Visa’s -7.7 percent, reflecting the market pricing in a roughly $636 million annual revenue drag (a press-tier estimate from Banking Dive, for Mastercard’s impact, not Visa’s) from the debit migration. Mastercard is not yet covered in this research series; no internal link exists.
American Express (AXP) - the closed-loop rival
American Express runs a three-party model: it is simultaneously the network, the issuer, and (via merchant relationships) the acquirer. This closed-loop structure means it sets its own merchant discount rates and is not subject to the CCCA’s routing mandate, which targets “the two largest networks” - Visa and Mastercard. That CCCA protection is a structural advantage in the current regulatory environment.
AXP trades at approximately 19x forward P/E and 21x trailing (StockAnalysis, June 25, 2026), roughly a 20 to 25 percent discount to Visa. The lower multiple reflects credit risk (AXP issues its own cards, carries its own loan book, and has credit cycle exposure that Visa does not) and a merchant acceptance base that remains narrower than the Visa/Mastercard universal footprint. For investors specifically concerned about CCCA legislative risk, AXP is the cleaner comparison at a lower multiple.
The JPMorgan deep-dive published earlier in this research series is relevant context: JPMorgan is the largest US card issuer and its card volume trends, credit card delinquency data, and issuer-economics disclosures are an advance indicator for what flows over Visa’s rails and how much of it generates Visa’s service revenue.
PayPal and Block - mostly ride the rails
The bear narrative about digital wallets displacing card networks applies far less to Visa than any single PayPal earnings miss might suggest. Apple Pay and Google Pay are tokenization layers sitting on top of Visa rails; when a consumer pays with her iPhone at a merchant, the transaction still routes over VisaNet and still pays Visa’s assessment fee. The Cash App Card is a Visa debit card. Klarna’s US card is built on Visa’s Flexible Credential rails. Affirm’s Card (2.3 million active cardholders as of fiscal year 2025, growing 100 percent year-over-year) is a Visa debit card.
PayPal aggregates multiple rails: card-funded PayPal transactions pay Visa fees; bank-account-funded ACH transactions do not. Venmo P2P funded by bank account is pure ACH. PayPal’s 52-week decline of roughly 42 percent and its current valuation at roughly 8x earnings reflect competitive pressure on PayPal itself, not a strengthening bypass threat to Visa. The DOJ debit complaint names Apple Pay, PayPal, and Cash App as counterparties to Visa’s exclusionary agreements - which is itself evidence that Visa treats them as routing dependencies to manage rather than as peers freely choosing to route through Visa.
Block’s Cash App Card is a Visa debit card. A stablecoin P2P pilot announced by Block could introduce a bypass for P2P transfers, but it remains at pilot stage as of mid-2026.
Real-time rails: the geographic pattern matters enormously
The US domestic real-time rail threat is largely misframed in retail coverage. FedNow processed $853 billion in full-year 2025 - roughly 6 percent of Visa’s $14.2 trillion payments volume - with an average transaction size of over $100,000 per transaction (Federal Reserve data, primary tier). FedNow is a large-value B2B and treasury rail, not a consumer POS competitor. The Clearing House RTP processed about $481 billion in Q2 2025 alone, but again at average transaction sizes reflecting bill payments and business transfers.
The genuine card displacement by real-time rails is happening in emerging markets, and the data is concrete.
Brazil’s Pix instant payments system now processes more daily transactions than Visa and Mastercard combined in Brazil. Brazilian debit card market share fell from roughly 26 percent of payment transactions in late 2020 to roughly 13 percent by late 2023, while Pix went from near zero to over 40 percent. This is confirmed debit card displacement in Visa’s fifth-largest market by payments volume - not cash displacement. Debit volumes in Brazil have been in monthly decline since February 2024 per public data (analyst-tier, C-0130). Estimated cumulative Visa revenue impact from Pix displacement between 2021 and 2024 is reported as roughly R$6.5 billion (~$1.3 billion) in secondary press sources citing Central Bank of Brazil data - not verified at primary tier, flagged accordingly.
India is on a concerning trajectory. UPI processed 228 billion transactions worth $3.4 trillion in calendar 2025. RuPay credit cards - domestic cards on UPI rails with explicit government policy backing - captured 28 percent of all Indian credit card transactions in H1 FY2025, up from 10 percent the prior year (press-tier, C-0127). The RBI banned exclusive network agreements with global networks and granted RuPay exclusive rights to process credit card transactions through UPI. Visa’s addressable share of Indian digital payments is shrinking even as the underlying market grows. Indian credit card absolute volume is growing, but Visa’s capture rate of each incremental dollar of that growth is falling year by year.
In the US and Europe, consumer payment habits remain sticky because cards carry fraud protection, zero-liability policies, rewards programs, and dispute resolution that account-to-account (A2A) transfers - rails like FedNow, Pix, and UPI that move money directly between bank accounts without touching a card network - generally do not. Issuers have no economic incentive to route volume to FedNow (which earns them zero interchange) rather than to a Visa card transaction (which earns them 1.5 to 2.5 percent interchange). That issuer economics fact is the structural floor under Visa’s US domestic volume, and it is also what the DOJ targeted in its debit antitrust case.
BNPL: a Visa ride-along more than a threat
Buy Now Pay Later is not a material bypass threat to Visa for the same reason wallets are not. When Affirm’s Card or Klarna’s US card is used at a merchant, a Visa transaction is generated. Direct-to-merchant BNPL at online checkout (the Affirm/Klarna integration appearing as a payment option without a card being issued) does bypass card networks, but it represents a fraction of total BNPL volume and lacks consumer protection features that constrain its addressable market. BNPL is a Visa ride-along for its card products and a partial bypass risk only in the direct-checkout model.
Regulation and litigation
The regulatory and litigation complex is the primary reason Visa trades at a 30 percent discount to its own historical multiple. Understanding each element in its actual legal posture - not the press-coverage version - is necessary before any assessment of the stock.
The MDL interchange settlement: preliminary approval, not done
The Payment Card Interchange Fee and Merchant Discount Antitrust Litigation (MDL No. 1720, EDNY) has run since 2005. A previous $30 billion settlement was rejected in June 2024 by Judge Margo Brodie, who as reported by CNN described the deal as failing to adequately compensate merchants. In November 2025, Visa filed a revised settlement agreement. On approximately June 9 to 10, 2026, U.S. District Judge Brian Cogan (who took over the case) granted preliminary approval, finding it “fair, reasonable, and adequate” per Payments Dive reporting.
Key settlement terms from Visa’s November 10, 2025 8-K (a primary SEC filing): the US combined average effective credit interchange rate falls by 10 basis points for five years; posted US standard consumer credit interchange is capped at 1.25 percent for eight years (premium rewards cards and commercial cards, representing approximately 85 percent of cards issued, are explicitly not capped); merchants gain category-selection rights; enhanced surcharging rights allow merchants to surcharge Visa/Mastercard credit up to 3 percent.
The $38 billion figure in coverage is the projected cumulative value of merchant savings from rate reductions over the settlement period - it is not a cash payment Visa is making. The costs flow through the Class B conversion mechanism, falling on original US bank member institutions, not Class A public shareholders. Visa has built a litigation escrow (roughly $3.0 billion at fiscal year-end September 2025, falling to roughly $665 million at March 31, 2026 as payments were made in connection with the settlement process).
This is preliminary approval only. Major objectors - Walmart, the National Retail Federation, and the National Association of Convenience Stores - have pledged vigorous objection at the final hearing, expected in late 2026 or early 2027. A 2nd Circuit appeal after any final approval is possible. The prior settlement was rejected at this same court in 2024; the current judicial language is stronger, but final resolution is not guaranteed.
If Judge Cogan rejects the settlement at the final hearing, the case returns to contested MDL litigation. KBW analysts have estimated that rejection path could delay final resolution to approximately 2029, with a potential 2nd Circuit appeal extending the timeline further still. In that scenario, the $665 million in escrow as of March 31, 2026 remains held or is redirected per the court’s instructions. The Retrospective Responsibility Plan continues to route any future settlement costs to Class B holders rather than Class A public shareholders, but the overhang on Visa’s multiple would extend by years rather than months.
The Credit Card Competition Act: failed four times, not foreclosed
The CCCA was reintroduced on January 13, 2026, in Senate (S.3623, sponsors Marshall and Durbin) and House (H.R.7035) versions, backed by President Trump’s public endorsement. The bill would require card issuers with more than $100 billion in consolidated assets to enable at least two unaffiliated credit card networks on their credit cards - creating a routing mandate for credit cards analogous to what the Durbin Amendment did for debit.
As of June 25, 2026, the CCCA has not passed. Specific failures:
- January 30, 2026: Senate Agriculture Committee voted 12 to 11 to advance the Clarity Act (a crypto bill) without the CCCA amendment; the Trump administration itself asked sponsors to remove the attachment.
- March 13, 2026: Sponsors attempted to attach the CCCA to a housing bill; Durbin’s office confirmed the bill passed without it.
- Two competing CCCA versions are circulating, creating coalition confusion.
- The FY2026 NDAA (National Defense Authorization Act, the annual must-pass military spending bill), signed December 18, 2025, passed without any CCCA amendment.
Sponsors say they remain “open to any opportunity” including the FY2027 NDAA and broader economic packages. No confirmed vehicle exists as of this research date. The CCCA is a live legislative risk with more momentum than prior cycles (Trump endorsement, bipartisan Senate sponsorship), but it is correctly reported as pending, not as enacted or imminent.
To see what the CCCA would actually do at the payment level, walk through the mechanism. Any credit card issuer above the $100 billion threshold would be required to enable at least one additional unaffiliated network on every credit card it issues. When a cardholder presents that card at a merchant terminal, the merchant’s acquirer could route the transaction over the second network rather than Visa’s, paying a lower network fee and keeping the cost savings or passing some to the merchant. Visa loses the network fee on that routed slice. The consumer sees no change at checkout; the rewards program and the Visa-branded card remain unchanged. The economic damage to Visa comes from the network-fee loss on redirected volume, not from losing the card itself. Extrapolating from the Durbin debit outcome, a 15-to-20-percentage-point routing share loss on US credit would reduce Visa’s US credit network fees by roughly $700 million to $1 billion annually at current volumes. Rewards-intensive premium segments would be more insulated than standard consumer credit because issuers have stronger economic reasons to keep premium volume on Visa rails. The impact on consumer rewards programs is uncertain; issuers facing lower network-fee income might respond by trimming rewards on standard cards.
The post-Durbin debit precedent: after Visa’s Interlink and Mastercard’s Maestro lost routing share following Durbin routing mandates (effective mid-2012), combined PIN-debit share fell from roughly 67 percent to roughly 49 percent in about a year per research cited by Digital Transactions. That is the bear’s reference scenario for CCCA passage on credit. Credit routing is structurally different from debit - rewards loyalty is more entrenched; issuers hold more contractual routing power - so the initial shock and long-term equilibrium might both differ. No peer-reviewed analysis of credit-specific routing dynamics is available at primary tier.
The DOJ debit antitrust case: in discovery, trial ~2027 to 2028
The Department of Justice filed United States v. Visa Inc. (SDNY, case 1:24-cv-07214) on September 24, 2024, alleging Visa monopolized US debit network services via exclusionary agreements covering more than 75 percent of its debit volume. The core claims: de facto exclusive dealing with merchants and acquirers via cliff pricing structures (fee schedules designed so that routing even a small fraction of debit volume to a competing network causes the acquirer or merchant to forfeit steep discounts on all remaining Visa volume, making defection economically irrational even when a competitor’s headline rate is lower - this is the DOJ’s central theory of exclusion) that penalize routing to competing debit networks; horizontal market-division agreements with Apple Pay, PayPal, and Cash App allegedly paying those counterparties not to route over competing debit networks; and vertical exclusionary agreements with issuers. Remedies sought are injunctive relief only - meaning court orders requiring Visa to change specific business practices, such as eliminating cliff pricing and unwinding exclusionary agreements, rather than paying monetary damages or fines.
Visa’s motion to dismiss was denied in full as reported by Payments Dive (June 2025), with the case docket publicly accessible at CourtListener, 1:24-cv-07214. Fact discovery closes October 16, 2026. Expert discovery runs through April 8, 2027. Summary judgment motions are scheduled to begin around May 6, 2027. Trial is projected in late 2027 or 2028 (a party projection, not a set court date). The Trump DOJ is continuing the Biden-era case without modification - bipartisan enforcement signals no political resolution is coming.
Visa holds no financial reserve for the DOJ case. If behavioral remedies are ordered, Visa would face requirements to eliminate cliff pricing, unwind exclusionary agreements with Apple Pay, PayPal, and Cash App, and restructure exclusionary volume commitments with acquirers and issuers. All of those outcomes could structurally reduce Visa’s roughly $7 billion in annual US debit network fees if competing networks gain routing share. A 10 to 15 percentage point debit share loss would translate to roughly $700 million to $1 billion in annual revenue impact - significant but not catastrophic against $40 billion in net revenue.
EU and UK: indirect, but real on the UK side
The EU Interchange Fee Regulation (effective 2015 to 2016) caps consumer debit interchange at 0.2 percent and credit at 0.3 percent within the EEA. These caps apply to issuing banks, not to Visa’s network fees. The indirect effect on Visa comes through the issuer economics that constrain premium card issuance and weaken Visa’s pricing position in fee negotiations with European issuers.
The UK is a different risk. After Brexit, Visa and Mastercard raised UK-to-EEA card-not-present interchange from 0.2/0.3 percent to 1.15/1.5 percent (debit/credit). On January 15, 2026, the UK High Court rejected Visa and Mastercard’s challenge to the Payment Systems Regulator’s authority to cap these fees, as reported by Lawyer Monthly and FStech. The PSR is now consulting on a permanent cap. If the PSR extends its review to Visa’s own scheme and network fees on UK-EEA transactions (which it has signaled interest in), that would directly reduce Visa’s international transaction revenue from that corridor. No public quantification of that specific exposure exists.
The UK FCA opened a competition investigation on May 6, 2026, covering Visa, Mastercard, and PayPal over alleged anti-competitive conduct in how transactions are prioritized within PayPal’s digital wallet. Visa is being investigated under Chapter II of the Competition Act (abuse of dominance). The FCA has not concluded that any laws were broken. This is early-stage; competition investigations typically run for years. It is a new regulatory headwind, not a current financial impairment.
The macro read
Visa’s revenue is, at its core, a tax on nominal economic activity. Not real activity - nominal. That distinction recurs through the macro analysis.
Inflation is a tailwind, not neutral. When a basket of groceries that cost $100 last year costs $104 this year, the dollar value of every Visa transaction on that purchase grows by 4 percent without any real spending increase. Service revenue is billed as a percentage of nominal payment volume from the prior quarter; every dollar of inflation that passes through a Visa-rails transaction increases Visa’s revenue. May 2026 BEA data (released June 25, 2026, primary source, C-0079) shows the PCE price index up 4.1 percent year-over-year and core PCE up 3.4 percent. In a world where inflation stays above 3 percent, Visa gets a structural 1 to 1.5 percentage point lift to nominal volume growth that many earnings models do not explicitly model.
Cross-border is the cyclical lever. International transaction revenue ($14.2 billion, 35 percent of net revenue) is the highest-margin and most cyclically exposed line. Air passenger traffic is projected to grow 4.4 percent in 2026 per the IATA June 2026 Global Outlook (analyst-tier, C-0088), decelerating from the post-COVID recovery surge. If a recession materializes, business and discretionary travel contract first and fastest. During the COVID recession, Visa’s cross-border volumes fell roughly 19 percent at the worst quarterly trough (primary source, C-0176). A 20 to 25 percent cross-border stress scenario applied to the current $14.2 billion base produces a roughly $2.8 to $3.6 billion revenue hit - 7 to 9 percent of total net revenue - on Visa’s highest-margin line.
The consumer balance sheet is thin. The US personal savings rate was 3.0 percent in May 2026 (BEA, primary, C-0079), down from 6.2 percent in early 2024. Credit card debt reached $1.28 trillion in Q4 2025 (NY Fed, primary, C-0083). The card delinquency transition rate was 2.94 percent in Q4 2025 (NY Fed, primary), above the 2018-2019 baseline near 2.5 percent. Unemployment was 4.3 percent in May 2026 (BLS, primary, C-0081) with EY projecting a rise toward 4.6 percent by late 2026. These figures describe a consumer still spending - nominal PCE grew 0.7 percent month-over-month in May - but with a thinner buffer than at any point in the expansion.
Recession odds are elevated. Goldman Sachs puts twelve-month US recession probability at 30 percent; JPMorgan at 35 percent; Moody’s Analytics at 49 percent (press-tier sources citing analyst research, C-0087 - exact figures UNVERIFIED at primary tier). In a mild recession, domestic Visa volumes likely fall 5 to 10 percent at trough, cross-border falls more sharply, and net revenue contracts 5 to 9 percent from the current run-rate. The business does not break. The 2020 precedent - an extreme mobility shock - produced only roughly 5 percent full-year revenue decline and a full recovery within two quarters of reopening.
Rates bite indirectly. The Federal Reserve held rates at 3.5 to 3.75 percent in June 2026 (primary source, C-0085) with the June dot plot showing nine members projecting at least one hike in 2026. Higher rates increase funding costs and potential credit losses for issuing banks, which tightens card underwriting and slows new-account issuance - each of which reduces the active credential pool on Visa rails over time. The direct rate effect on Visa itself (interest expense of $589 million on $24 billion of debt in FY2025) is negligible at the business level.
The most likely near-term path. Deceleration without contraction. Volume growth slows from the Q2 FY2026 pace of 9 percent constant-dollar toward a 5 to 7 percent range as consumer spending cools. Inflation provides nominal support. Cross-border holds at 8 to 10 percent rather than 11 to 13 percent. Net revenue growth steps down from 15 to 17 percent in H1 FY2026 to around 10 to 12 percent in H2, consistent with management’s “low-double-digit to low-teens” guidance (primary source, C-0093). That deceleration is expected and healthy; it does not change the multi-year structural case unless it persists or deepens into a genuine recession.
What the crowd is saying
The news cycle on Visa in 2026 has been a contest between a darkening regulatory headline sequence in the first quarter and a brightening growth story in the second.
CCCA: cooling. Trump’s January 13 endorsement triggered an immediate selloff in V and Mastercard - the single largest regulatory headline for the stock since the DOJ complaint. Since then the CCCA has failed three attachment attempts, and the press coverage has shifted from “imminent threat” to “persistent but stalling.” The temperature on this story is lower than it was in January, which is itself a signal worth tracking. Each failed attachment costs sponsors political capital and weakens the urgency in the market’s near-term pricing.
Settlement: neutral. Judge Cogan’s preliminary approval, reported around June 9 to 10, 2026, removed the acute near-term uncertainty from that litigation track. Coverage moved from “will there be a settlement” to “will the final hearing go smoothly” - a lower-anxiety frame. The NRF and Walmart remain publicly opposed, but the preliminary approval language is procedurally strong.
UK FCA: new and minor. The May 6, 2026 investigation opening was covered in specialist payments press. It has not driven retail investor attention at scale. A multi-year process, it is currently a small new headwind.
DOJ: slow burn. The motion to dismiss denial in June 2025 generated specialist coverage. The active discovery period produces occasional newsworthy filings, but the story will stay quiet until summary judgment in May 2027.
Growth narrative: warming. Q2 FY2026’s 17 percent net revenue growth generated nine upward EPS revisions in the week after the April 28, 2026 earnings release. The stablecoin story is generating steady fintech coverage. The CFO’s own calibration - “hesitant to lean into the stablecoin and agentic commerce narratives too much” (Fortune, June 2026) - contrasts with the CEO’s more assertive framing. That tension in management messaging is itself informative about how the company is managing the market’s expectations on emerging revenue lines.
Retail sentiment: cautious but interested. Retail discussion of V frames the stock primarily as “quality compounder at a regulatory discount” rather than “disrupted business” or “momentum buy.” One sentiment aggregator cited in a secondary press source (a soft signal, not a primary measurement) placed Visa’s composite score near 55 out of 100 in early 2026. Short interest at 1.27 percent of float and declining (from a peak above 2.4 percent of float in mid-2024, C-0077) is the most reliable quantitative sentiment reading: institutional bears are not building structural positions.
Options positioning. Options market data for Visa was not captured in this research session. Investors tracking implied volatility skew, put-to-call ratios, or options-derived sentiment should consult a live options data source to complement this read; those signals were not analyzed here.
Narrative versus fundamentals. The crowd’s dominant frame is “premium network under structural threat from regulation and disruption.” What the filings actually say: Q2 FY2026 grew 17 percent; non-GAAP operating margins held above 65 percent; VAS grew 27 percent in the quarter; the stablecoin settlement volume is less than 0.05 percent of VisaNet throughput; the CCCA has failed every vehicle. The gap between the cautious crowd narrative and the reported numbers is wide. That gap does not mean the bears are wrong about long-term structural risk - stablecoins and CCCA are real risks - but the timeline and magnitude of disruption implied by the current multiple discount may not match the evidence as of June 2026.
Durability versus the disruptors
The core question for any Visa investment is whether the toll-booth model survives the next decade intact, gets slowly compressed by regulation and competition, or faces genuine disruption. The research here points toward a spectrum that runs from “intact” to “slowly compressed,” with the compression primarily regulatory rather than technological.
Why the moat holds on the technology side. The bilateral acceptance lock-in is the key mechanism - not the brand, not network effects in isolation, but the structural fact that neither issuers nor merchants can opt out of VisaNet for Visa-branded transactions. An issuer cannot issue a Visa card without routing over VisaNet. A merchant cannot accept Visa cards without connecting to VisaNet. No A2A rail or stablecoin network can replicate that for consumer card transactions without rebuilding fraud protection, dispute resolution, rewards, and universal acceptance infrastructure from scratch. Issuers have no economic incentive to route volume to FedNow (zero interchange) over a Visa card transaction (1.5 to 2.5 percent interchange). That economics fact is the structural floor under US domestic debit volume, and it is also the reason the DOJ had to sue rather than relying on market forces.
Where competition is genuinely winning. Brazil and India are honest cases where government-backed real-time rails have taken confirmed Visa card volume - not cash. Pix took Brazilian debit market share from roughly 26 percent to roughly 13 percent in three years. RuPay captured 28 percent of Indian credit card transactions in a single year of accelerated government policy implementation. Both are documented by analyst and press-tier sources with directional support from primary data. Any honest assessment of Visa must include these as confirmed structural headwinds in two fast-growing markets.
The incentive ratchet is the canary. Client incentives rising from roughly 17 percent to 28.3 percent of gross revenues in a decade reflects the cost of maintaining the moat in a two-player market where Mastercard is always available as an alternative. It is not evidence that the moat is eroding from external disruption - it is evidence of how much Visa must pay to defend routing share from a single sophisticated competitor. But a ratchet with no disclosed ceiling and no governor is a risk, and VAS has to permanently outgrow the incentive drag for the net take-rate to stay stable. One quarter of flat incentive rate would be the most positive structural surprise possible for this stock; that has never happened in the FY2015 to FY2025 data.
The regulatory path is the binary. CCCA passage in any form changes the forward multiple more than any technological development. If passed, even in a narrow form covering only issuers above $500 billion in assets, the market would not wait for the five-year equilibrium before repricing Visa’s multiple toward a regulated-utility band. CCCA passage is the single most disruptive near-term catalyst for this stock, and it is also the risk that has failed every attempt to become law.
What actually breaks the model (not merely slows it): CCCA passage into law, combined with an adverse DOJ trial verdict requiring structural unwinding of exclusionary debit agreements, arriving within the same 24-month window. Either event alone is a repricing, not a catastrophe. Both together, in the same environment as a consumer recession compressing cross-border revenue, produce the bear’s $230 to $260 scenario for the 1-year horizon. That is not the base case; it is also not a tail.
The scenarios in detail
The driver tree
Four variables decide Visa’s five-year outcome, in descending order of impact:
1. Regulatory and legal resolution. The DOJ debit case (trial projected 2027 to 2028, injunctive remedies) and the CCCA (not law, failed four vehicles) together control whether Visa’s roughly $7 billion of annual US debit fees and its US credit network economics remain intact. An adverse DOJ outcome or CCCA passage compresses both earnings and the multiple simultaneously. Resolution in Visa’s favor removes the discount and lets the existing growth algorithm flow through to the share price without the penalty.
2. Cross-border volume trajectory. International transaction revenue ($14.2 billion in FY2025, 35 percent of net revenue) is the highest-margin and most cyclical engine. Every 10 percentage points of cross-border volume growth or contraction moves net revenue by roughly $1.4 billion at current scale. A consumer recession with cross-border contracting 15 to 25 percent - the COVID historical range - is the sharpest near-term earnings risk.
3. Client incentive ratchet versus VAS acceleration. Each 1 percentage point increase in the incentive rate costs Visa roughly $558 million in net revenue. VAS growing at 24 percent with lower incentive drag than core volume payments is the offset. Whether VAS permanently stays ahead of the ratchet as incentives approach 29 to 31 percent of gross by FY2028 is the central margin-durability question.
4. Multiple trajectory. Visa at 23.8x forward is roughly 30 percent below its 5- and 10-year average of 33.6x. If regulatory risks resolve favorably, the multiple closes part of that gap and the stock dramatically outperforms earnings growth. If risks materialize, the multiple compresses further toward 16 to 18x - a structural repricing toward a regulated-utility valuation even on still-growing earnings.
Bull case: what has to be true
The CCCA fails the 119th and 120th Congresses. The DOJ case ends with a narrow behavioral consent decree in late 2028 - Visa eliminates specific cliff-pricing provisions and modifies agreements with Apple Pay, PayPal, and Cash App, retaining roughly 60 to 65 percent US debit share because issuer economics without artificial exclusivity still favor Visa rails. The MDL settlement receives final approval in early 2027 and survives 2nd Circuit review, permanently resolving the multi-decade merchant litigation.
VAS reaches roughly $22 to $25 billion by FY2031 (from $10.9 billion in FY2025 at an 18 to 22 percent CAGR), driven by tokenization, Featurespace AI fraud, Tink open banking, and agentic payments. The client incentive rate stabilizes near 29 to 30 percent of gross as VAS mix lifts blended net revenue faster than core-volume incentives rise.
Trajectory estimate: net revenue growing roughly 12 percent annually to approximately $70 to $75 billion by FY2031. Non-GAAP EPS growing roughly 13.5 percent annually, reaching approximately $25-plus by FY2031. Share count declines roughly 2 to 3 percent per year via buybacks.
Illustrative valuation: roughly $25.35 estimated FY2031E EPS x 27x exit multiple = approximately $685. The 27x multiple is below the historical 33.6x average and assumes the regulatory discount never fully closes; it is a “quality compounder at a partially unwound discount” assumption, not a mean-reversion-to-peak call.
What breaks the bull: CCCA passes in any form covering $100 billion-plus issuers. Even a narrow routing mandate collapses the gap between bull and base within 12 months of enactment.
Base case: the most likely path
The CCCA fails the 119th Congress and is reintroduced in the 120th (2028-plus) with the same stalling pattern. The DOJ case goes to trial in late 2027 or 2028. Visa loses on the cliff-pricing and exclusionary agreement claims. The court orders behavioral remedies: elimination of cliff pricing and modification of the most egregious routing-incentive structures. Visa retains roughly 60 percent of US debit market share (down from roughly 70 percent) because issuers still prefer Visa’s network economics without the artificial exclusivity. Annual revenue impact from debit share loss: roughly $500 to $700 million, partially offset by volume growth. MDL settlement receives final approval in 2027.
VAS reaches roughly $17 to $19 billion by FY2031 at an 18 percent CAGR. Client incentives reach roughly 30 percent of gross by FY2027. Net revenue CAGR roughly 10.5 percent. EPS CAGR roughly 10.5 percent.
Illustrative valuation: roughly $22.29 estimated FY2031E EPS x 22x exit multiple = approximately $490. The 22x multiple assumes the regulatory discount narrows but does not close because routing competition for credit cards remains a live political issue.
What breaks it upward: CCCA definitively fails via Senate Parliamentarian ruling, and the multiple re-rates from 22x toward 26 to 27x.
What breaks it downward: three adversities arriving in the same 18-month window - cross-border deceleration to 5 to 7 percent, adverse DOJ summary judgment on cliff-pricing, and a further consumer savings-buffer exhaustion scenario. That is the bear case.
Bear case: the skeptic’s strongest version
The CCCA passes in some form by 2028 to 2029, requiring large issuers to enable a second unaffiliated network on credit cards. Visa’s US credit routing share erodes 15 to 20 percentage points initially (the debit Durbin precedent) before partial recovery. Combined with a DOJ adverse ruling at trial requiring Visa to unwind exclusionary debit agreements, US debit share falls 10 to 15 percentage points from roughly 70 percent, reducing the roughly $7 billion annual US debit fee base by $700 million to $1 billion.
A US consumer recession in late 2026 to 2027 (30 to 49 percent probability per Wall Street estimates) compounds this: cross-border volumes contract 20 to 25 percent at trough, reducing international transaction revenue by roughly $2.8 to $3.6 billion. The client incentive rate reaches 30 to 31 percent of gross before VAS reaches 35 percent of net revenue.
Net revenue CAGR slows to roughly 6 percent. EPS grows at roughly 5 percent annually to an estimated $17 by FY2031. The terminal multiple compresses to 16x as the market reprices Visa toward a regulated network utility.
Illustrative valuation: roughly $17.23 estimated FY2031E EPS x 16x = approximately $276.
This is not a bankruptcy scenario. Visa still generates billions in free cash flow and maintains its global network. It is a scenario where Visa looks more like a US telecom utility after deregulation than like the premium-growth compounder of the 2015 to 2023 era.
A note on the Capital One/Discover migration. The skeptic report raises Capital One’s credit card migration to Discover as a significant Visa bear point. The bearcase-refill research resolves this clearly (C-0172, primary-tier source, confirmed). Capital One’s mass-market credit cards - Venture, Savor, Quicksilver, and all variants - were on Mastercard, not Visa, before the migration. The only significant Capital One credit card on Visa is Venture X (the premium travel card), and it is staying on Visa. The 25 million Capital One debit cards that migrated to Discover were also primarily on Mastercard, not Visa. This migration is primarily a Mastercard bear event (Mastercard’s confirmed revenue drag is roughly $636 million annually per a Banking Dive press-tier estimate). Visa’s direct revenue exposure to the Capital One migration is not quantifiable from public data but is estimated as well below $100 million annually - under 0.25 percent of net revenue.
Catalyst timeline and leading indicators
| Date | Event | Bull read | Bear read |
|---|---|---|---|
| July 2026 | Q3 FY2026 earnings | Cross-border above 10%; VAS beats 27% | Volume decelerates to 8-9%; cross-border misses guidance |
| October 2026 | Q4 FY2026 earnings + MDL final hearing | Revenue +10-12%; FY2027 guide above consensus; final approval granted | Revenue +8% or below; FY2027 guide light; final hearing contested |
| October 16, 2026 | DOJ fact discovery closes | No new bombshell material surfaces | Discovery produces evidence of wider exclusionary conduct |
| May 2027 | DOJ summary judgment motions begin | No adverse SJ ruling on any claim | Partial adverse ruling on cliff-pricing - the most significant legal catalyst to the downside |
| Late 2027 or 2028 | DOJ trial (if no pre-trial settlement) | Narrow consent decree pre-trial | Adverse verdict requiring structural unwinding |
Leading indicators to watch in real time:
Cross-border volume growth constant-dollar (reported quarterly): sustained below 7 percent signals recession threat; holding above 10 percent validates the bull. Client incentive rate as percent of gross revenues: above 29.5 percent before VAS reaches 32 percent of net revenue signals the ratchet is winning over VAS accretion. DOJ docket at SDNY 1:24-cv-07214: any summary judgment order or discovery ruling. CCCA attachment vehicles: Senate floor schedule and the FY2027 NDAA markup calendar. VAS quarterly growth: below 18 percent for two consecutive quarters weakens the core offset argument. Mastercard earnings (one-quarter lead on global volume trends). US consumer delinquency transition rates (NY Fed, quarterly): above 3.5 percent signals issuer credit tightening feeding through to active credential counts.
Companies to watch (bull / base / bear)
Visa (V, ~$332, ~$623B cap). The subject of this analysis. Own for the durable network franchise at a historically wide regulatory discount. Watch cross-border volume growth direction at each quarterly print, every DOJ docket update at SDNY 1:24-cv-07214, and every Senate committee markup where a CCCA attachment might surface.
Mastercard (MA, ~$489, ~$432B cap). The duopoly partner. Same business model, same regulatory exposure, and has absorbed the sharper YTD decline (-15.2 percent) partly from the Capital One/Discover debit migration. MA is the read-through on every Visa earnings event; they track together on macro and diverge on stock-specific migration or deal news.
Bull signal: Both V and MA beat on cross-border in Q3 FY2026. The duopoly multiple re-rates toward historical levels.
Bear signal: DOJ produces adverse summary judgment for either company in May 2027. Both re-rate sharply lower as the market begins pricing trial risk explicitly.
American Express (AXP, ~$342, ~$234B cap). The CCCA-protected alternative. At roughly 19x forward P/E, it trades at a roughly 20 percent discount to Visa with less direct regulatory exposure to the routing mandate. If CCCA legislative risk heats up again in late 2026 or into 2027, AXP is the relative outperformer. JPMorgan’s card-issuing role and consumer credit data provide an indirect read on AXP’s loan book quality.
Bull signal: AXP premium card enrollment accelerates post-settlement (merchants exercising surcharging rights favor AXP’s different fee structure for some segments); AXP outperforms V/MA on a relative basis.
Bear signal: Consumer credit stress above 3.5 percent delinquency transition rates hits AXP’s own loan book; AXP’s credit losses compress earnings in a recession and reverse its near-term regulatory advantage.
Capital One Financial (COF). Capital One completed its acquisition of Discover Financial Services in February 2025, making it the only large US bank issuer that now owns a competing payment network outright. (COF price and market cap are not sourced from this research session; check a live data source before trading.) The mass-market Capital One credit cards - Venture, Savor, Quicksilver, and their variants - were on Mastercard before the migration, not Visa, so the immediate routing shift affects Mastercard far more than Visa (Visa’s Venture X premium card is staying on Visa rails). The longer-run question is whether Capital One’s ownership of Discover creates a template that pressures other large issuers to consider competing routing options - particularly if the CCCA ever passes and mandates a second unaffiliated network. No other large issuer owns a competing network today, which is what makes COF’s structure worth watching as a proxy for where issuer routing strategy might move.
Bull signal for Visa: COF keeps Venture X on Visa rails and does not expand Discover’s network beyond its own cards; the Capital One/Discover integration proves less threatening to Visa than feared.
Bear signal for Visa: COF begins migrating Venture X from Visa to Discover; or COF publicly announces plans to open Discover’s network to other issuers, creating a credible third credit-routing option at scale.
PayPal (PYPL, ~$42, ~$37B cap). Not a bypass threat to Visa. PYPL’s decline of roughly 42 percent over twelve months and its sub-8x forward P/E reflect competitive pressure on PayPal itself. For Visa watchers: PYPL stabilization confirms card-funded digital commerce is holding; PYPL acceleration of PYUSD into merchant checkout (which would bypass card rails) is the specific thing to monitor.
Pix / UPI / RuPay (no direct US equity). Monthly Pix volume versus Brazil card volume, and NPCI’s monthly UPI data, are the leading indicators for whether A2A rail displacement is expanding beyond cash into segments Visa does capture. The trend as of mid-2026 - Pix surpassing combined V/MA in Brazilian daily transaction count, RuPay at 28 percent of Indian credit card transactions - warrants quarterly review against any Visa management commentary on Latin America and Asia-Pacific.
Risk controls
Position sizing discipline matters here beyond what the stock’s low beta (0.76 over five years, per StockAnalysis) would suggest. Unlike a business where every risk is tied to the economic cycle, Visa carries discrete non-cyclical risk: a CCCA vote or an adverse DOJ ruling could move the stock 10 to 20 percent in a single session, independent of earnings. That binary deserves explicit sizing consideration beyond what a simple beta-based approach produces.
Specific catalysts to monitor before sizing up or down:
MDL settlement final approval (expected late 2026 to early 2027): final approval removes one of the three regulatory overhangs and is the single clearest positive catalyst for multiple re-rate.
CCCA attachment to any legislative vehicle (ongoing): each failed attachment weakens the coalition. A successful committee vote on an attachment, even before a floor vote, would be the clearest negative near-term catalyst.
Cross-border volume growth in Q3 FY2026 (July 2026 earnings): holding above 10 percent constant-dollar weakens the macro bear case for FY2027. Below 7 percent raises recession probability in the market’s pricing.
DOJ summary judgment (beginning May 2027): no adverse SJ ruling is the path to clearing the biggest single legal overhang.
On valuation discipline: at 23.8x forward earnings the stock is not a distressed valuation, and a PEG ratio (forward P/E divided by the expected annual earnings growth rate, where 1.0 is considered fairly valued for a business growing in line with its multiple) of roughly 1.78x means you are paying a modest premium for quality. If regulatory risks accelerate and EPS growth slows to 5 to 7 percent, the multiple at which this stock is “cheap” relative to its own history changes substantially. A portfolio buying Visa at the current price should have a clear pre-determined answer to the question “what do I do if the CCCA passes?” - not “sell then,” but “at what position size was I already comfortable with that scenario?”
Methodology, sourcing, and data-quality flags
Research streams and source hierarchy
This piece draws from seven research streams conducted June 25, 2026: SEC filings analysis (the FY2025 10-K, Q2 FY2026 10-Q, and relevant 8-Ks - all primary-tier); market action and valuation (StockAnalysis, PortfoliosLab, Barchart, FinanceCharts - press-tier market data, stamped June 25, 2026); competitive analysis of RTP rails, stablecoins, and peer networks (primary filings, Nilson Report and Flagship Advisory analyst-tier, press-tier coverage); regulatory and litigation status (primary SEC filings, DOJ complaint, and Payments Dive / Lawyer Monthly for procedural facts); macro analysis (BEA, BLS, NY Fed, Federal Reserve - primary government sources); sentiment and OSINT; and the five-year forward outlook built from the verified claims ledger.
Source tiers used throughout: Primary (SEC filings, government statistics, Visa’s own 8-Ks and earnings releases): highest reliability; Analyst (Nilson Report, Flagship Advisory, McKinsey Global Payments, IATA, EY): informative but not independently cross-checked at primary in this session; Press (Payments Dive, Digital Transactions, Lawyer Monthly, CNN for cited judicial quotes): used for procedural litigation facts, always attributed; Estimate (derived arithmetic from reported figures, scenario arithmetic, management TAM guidance): explicitly labeled throughout.
Five-factor research read
Valuation. Visa trades at approximately 23.8x forward earnings and approximately 29x trailing, against a five-year and ten-year average near 33.6x per FinanceCharts/GuruFocus data (analyst-tier, UNVERIFIED at primary tier). The roughly 30 percent discount to own history reflects the regulatory and litigation overhang since the DOJ complaint (September 2024) and the CCCA endorsement (January 2026). American Express at approximately 19x forward carries structural CCCA protection but also credit risk; Mastercard at approximately 24.4x forward is essentially at parity with Visa. On a PEG basis near 1.78x, Visa is priced for solid growth with the discount assigned to regulatory uncertainty. The valuation is modestly favorable relative to Visa’s own history; the discount has real fundamental justification, but markets have historically overshot on regulatory fear for companies with Visa’s structural moat. Valuation nets to a modest positive.
Growth. Net revenue grew 11 percent in FY2025 and accelerated to 15 to 17 percent in H1 FY2026, the fastest pace since 2022. VAS is growing 24 to 27 percent and represents 27.3 percent of FY2025 net revenue. Visa Direct processed 12.6 billion transactions in FY2025, up 27 percent. Management guided 9 to 12 percent annual net revenue CAGR (Investor Day, February 2025, primary source); actual pace is tracking above that range. The VAS TAM of $520 billion (Investor Day, primary) and New Flows TAM of $200 trillion (Investor Day, primary) are at roughly 2 percent and sub-1 percent penetration, providing multi-decade structural runway that is independent of the US regulatory cycle. The cash-to-digital transition in Southeast Asia (Vietnam 54 percent cash at POS, Indonesia 51 percent, Philippines 48 percent per McKinsey, analyst-tier) adds a long-duration organic growth layer. Growth is the strongest single factor.
Quality. Non-GAAP operating margin approximately 67.7 percent in FY2025, among the highest of any large-cap globally. FCF approximately $21.6 billion in FY2025, a 54 percent margin on $40 billion of net revenue. No credit risk, no inventory, near-zero marginal cost per additional transaction. Net debt approximately $11.6 billion versus $21.6 billion annual FCF, roughly 0.5x levered. Total capital returned was $22.8 billion in FY2025, exceeding GAAP net income. Active buyback authorization of $13.2 billion remaining plus a new $20 billion (April 2026). The business structure - a network owned outright with recurring global volume and a software services layer growing on top - describes a franchise with very high returns on incremental investment and no meaningful economic deterioration at current scale. Quality reads as the second-strongest factor.
Risk. The DOJ debit antitrust case (SDNY 1:24-cv-07214): motion to dismiss denied as reported by Payments Dive in June 2025, fact discovery through October 2026, summary judgment motions beginning May 2027, trial projected 2027 to 2028, injunctive remedies only, no financial reserve. Roughly $7 billion in annual US debit network fees are in scope. The CCCA has bipartisan Senate sponsorship and Trump endorsement, and is actively seeking vehicles after four failures. The client incentive ratchet (from roughly 17 percent to 28.3 percent of gross revenues over FY2015 to FY2025 per primary SEC filings, C-0182) has no disclosed ceiling. Brazil Pix and India UPI/RuPay displacement are confirmed structural headwinds in two key growth markets. The MDL settlement remains at preliminary approval only. These risks are layered and multi-vector but are, in this research’s judgment, regulatory-repricing risks for a durable franchise rather than existential threats. Risk reads as a meaningful headwind.
Momentum. Visa is down approximately 7.7 percent YTD 2026 and approximately 12.5 percent over the trailing twelve months versus an S&P 500 up roughly 11 percent YTD (PortfoliosLab, press-tier, C-0023, DISPUTED - range approximately -5.6 to -12.2 percent across sources). The stock sits barely above its 200-day moving average of $328.74 (Barchart, June 25, 2026). RSI at 56.16 (Barchart primary; a second source returned 43.57 for a similar date - DISPUTED) is neutral. Short interest at 1.27 percent of float and declining confirms institutional bears are not building positions. Sell-side consensus is 29 Strong Buy / 7 Buy / 3 Hold with a mean price target in the $390 to $403 range (DISPUTED across aggregators), implying roughly 20 percent upside. Nine EPS upward revisions followed Q2 FY2026. Negative price momentum is offset by positive analyst revision trend and declining short interest. Momentum reads as roughly neutral.
Where the read lands. Five factors together - valuation at a meaningful historical discount, growth accelerating above 20 percent on VAS in the most recent quarter, quality at industry-leading margins and free-cash-flow conversion, risk real but multi-year in timeline, and momentum roughly neutral - produce a Buy signal on this research as of June 25, 2026. The single biggest risk to that read is the CCCA attaching to a legislative vehicle. The single biggest catalyst for strengthening the read is the MDL settlement receiving final approval, removing one of the three regulatory overhangs at once.
Data-quality flags
- Price (C-0016, DISPUTED): StockAnalysis returned $330.52 (4 PM EDT close, June 25, 2026); Capital.com returned $334.19 for the same date. $332 is used as the research anchor (midpoint of the verified $330 to $334 range). Do not treat any single closing price as precise.
- Market cap (DISPUTED): $622.67 billion (StockAnalysis) versus $629.66 billion (Capital.com) for June 25, 2026. Likely reflects different share-count conventions. Approximately $623 billion is used; the cap moves daily with the price.
- Forward P/E (DISPUTED at second decimal): StockAnalysis 23.84x; a second source returned 23.48x. Different consensus EPS periods (CY2026, FY2026, NTM) produce minor variation. Used as “approximately 23.8x.”
- Historical P/E average (UNVERIFIED at primary tier): The approximately 33.6x five and ten-year average is from FinanceCharts/GuruFocus analyst sources, not from a primary Visa filing. Directionally reliable; should not be treated as a precisely audited figure.
- Return figures (C-0023, DISPUTED range): YTD return of -7.69 percent is from PortfoliosLab/Nasdaq; a range of -5.6 to -12.2 percent was observed across sources for the same period. Three-year and five-year Visa returns are UNVERIFIED against matching S&P 500 returns for identical windows.
- Sell-side consensus targets (C-0037, DISPUTED range): Mean price target ranges from $390.86 (one aggregator) to $398.83 (another). Presented as a range throughout; single-figure citations would be misleading.
- Recession probability figures (C-0087, UNVERIFIED): Goldman (30 percent), JPMorgan (35 percent), Moody’s (49 percent) are from press coverage citing analyst research, not primary research notes. Directionally credible.
- RSI (DISPUTED): Barchart returned 56.16 (neutral) and a second source returned 43.57 for a similar date. Barchart figure used as primary.
- Brazil Pix / Visa revenue impact: Estimated at roughly R$6.5 billion (~$1.3 billion) cumulative 2021 to 2024, sourced from secondary press citing Central Bank of Brazil data. Not verified at primary tier; used directionally.
- DOJ case procedural facts (C-0007, press-tier): Motion to dismiss denial is attributed to Payments Dive reporting and the publicly accessible CourtListener docket (1:24-cv-07214). Not sourced to the court’s primary published order in this session.
- UK FCA investigation (C-0084, press-tier): Opening announced May 6, 2026 per trade press. The FCA has not concluded any laws were broken. Any characterization beyond “investigation opened” would be editorial, not sourced.
- Fiserv (FISV) reference: Fiserv’s stock decline (from a 52-week high of $175.92 to approximately $47.53 as of June 25, 2026, per StockAnalysis) is mentioned solely as market context for the payments sector differentiation. No characterization of the cause of that decline is made beyond press-reported CEO departure and investor concerns about the business model.
- VAS sub-segment margin: Management describes VAS margins as “very attractive” (Investor Day 2025, primary source). No segment operating margin is publicly disclosed. Characterizations of VAS as software-like and higher-margin than the core network are directional estimates.
- Options market data: Not captured in this research session. Implied volatility, put-to-call ratios, and options-derived sentiment signals were not analyzed and should not be inferred from this piece.
Key primary sources
Visa FY2025 10-K (CIK 0001403161, filed November 2025); Visa Q2 FY2026 10-Q (filed April 2026); Q2 FY2026 8-K/earnings release (filed April 28, 2026); Q4 FY2025 8-K (October 28, 2025); MDL settlement terms 8-K (November 10, 2025); Visa Investor Day 2025 (February 20, 2025); DOJ v. Visa complaint (SDNY, filed September 24, 2024); Nilson Report Issue 1301 (CY2025 US card volume, analyst-tier); McKinsey Global Payments Report 2025 (analyst-tier); BEA Personal Income and Outlays May 2026 (primary, released June 25, 2026); BLS Employment Situation May 2026 (primary); NY Fed Household Debt and Credit Q1 2026 (primary); FOMC Projections June 2026 (primary); IATA Global Outlook June 2026 (analyst-tier); Payments Dive (litigation procedural coverage, press-tier); StockAnalysis, PortfoliosLab, Barchart (market data, press-tier, June 25, 2026).
Prepared June 25, 2026. All figures are point-in-time as of the research date and will change. This is research and analysis for educational purposes only - not investment advice, not a recommendation to buy or sell any security, and not a solicitation. Payments networks operate in a complex and evolving regulatory environment; outcomes can differ materially from any scenario described here. Verify all figures independently and consult a licensed financial advisor before making any investment decision.