
Research date: July 1, 2026 | OSINT market research on The Goldman Sachs Group, Inc. (NYSE: GS)
Important disclaimer. This is OSINT-based research and educational analysis, not investment advice. I am not a financial advisor. Nothing here is a recommendation to buy or sell any security, and the scenarios below are illustrative, not price targets. Bank and broker-dealer stocks carry cyclical, regulatory, and capital-markets risk that can move a name like this sharply in either direction inside a single quarter. Market caps, prices, valuation multiples, and market-share figures are point-in-time as of June 30, 2026, press-reported where noted, and move fast. Do your own due diligence and consult a licensed advisor.
Where this stock could be in 6 months, 1 year, 3 years, and 5 years
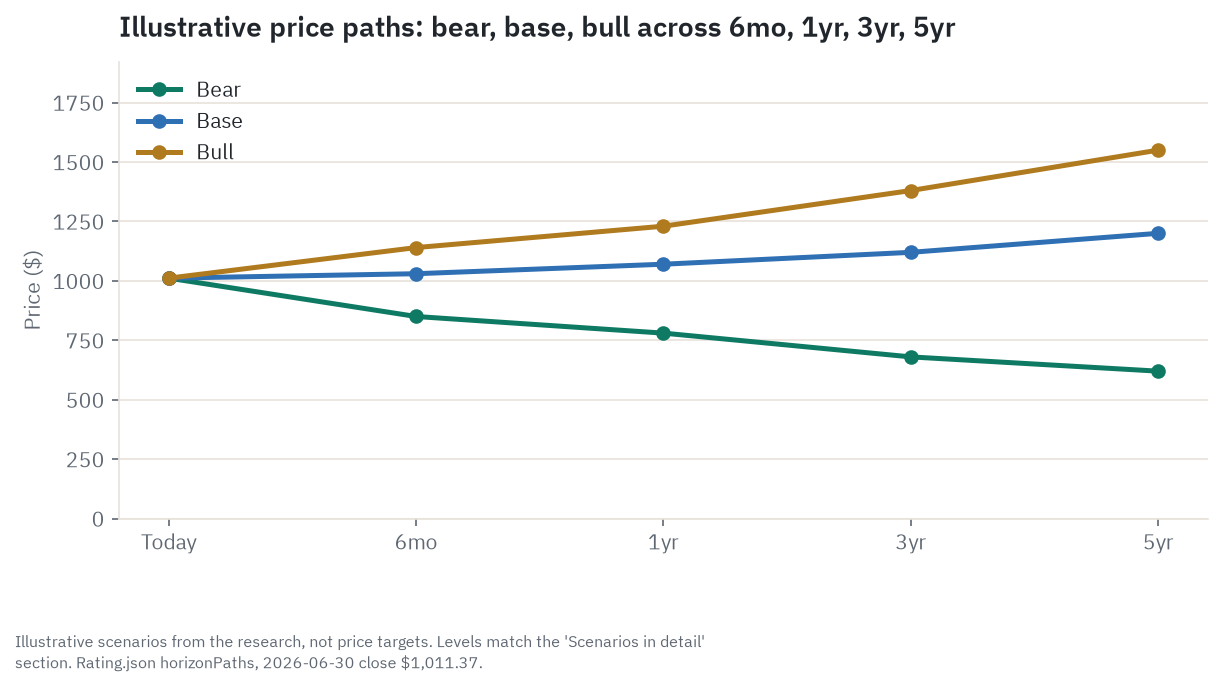
Six months. This window is almost pure cycle and catalyst. It gets decided by the Q2 2026 earnings report due before the open on July 14, then the Q3 print, and by whether the private-credit stress already showing up in the headlines (a Blue Owl fund gating redemptions, rising direct-lending default estimates) stays contained or starts to freeze the deal financing the whole investment-banking recovery depends on. The base case has the stock drifting roughly flat to a little higher, in a $1,000 to $1,050 band, as in-line results and the first payment of the newly announced $5.00 dividend meet a valuation that is already full. The bull case (around $1,140) is another strong trading and dealmaking quarter pushing the stock back toward the $1,100 to $1,125 all-time-high band it touched in late June. The bear case (around $850) is a soft print or a widening credit headline that starts the de-rating early. The single thing that flips this horizon is one bad credit-market headline freezing sponsor financing, because Global Banking & Markets would take that hit on both its dealmaking and trading legs at the same time.
One year. The dominant variable becomes whether the capital-markets upcycle is still running into 2027 and how the next stress-capital-buffer reset lands. In the base case (around $1,070), the cycle holds and earnings stay near their current peak, but the multiple neither expands nor contracts much further, so most of the return is the dividend. The bull case (around $1,230) has the deal backlog continuing to convert into fees, trading staying elevated, and the pending Basel III capital rule landing favorably, which would extend the re-rating further. The bear case (around $780) is the cyclical rollover beginning in earnest, with the multiple starting to give back some of what it has gained. The tell to watch here is the direction of Wall Street’s own earnings revisions for 2027: the first quarter analysts start cutting those numbers is the signal the cycle has turned.
Three years. This is where structure starts to matter more than the calendar. Any full economic cycle contains at least one downturn, and this horizon is the first real test of whether the Asset & Wealth Management build actually makes Goldman’s earnings less cyclical, or whether it is simply riding the same market that everything else rides. The base case (around $1,120) has that division’s returns grinding higher toward the mid-teens, partly earning the premium the stock already carries, while the valuation multiple gives back some of its recent expansion, netting out to modest gains. The bull case (around $1,380) has the wealth and asset-management arm actually hitting the high-teens return target management has set for itself, with the stock defending something close to today’s book-value multiple on a much larger equity base. The bear case (around $680) is the double de-rate described in detail further down largely having played out. The flip here is the trajectory of that division’s return on equity and whether client money actually stays put in a risk-off quarter, since the entire “annuity” argument has never been tested through one.
Five years. At this distance it is purely a question of durability versus reversion to the mean. The base case (around $1,200) is a firm earning something close to its own mid-teens through-cycle target, having half-earned the re-rating it has already been given, compounding at a modest single-digit price rate on top of the dividend. The bull case (around $1,550) is the annuity fully built: per-share earnings compounding into the $70s or $80s and a roughly three-times book multiple defended on a tangible book value that has grown substantially from today’s level. The bear case (around $620) is the cycle simply resetting, the market re-rating Goldman back toward the trading-house multiple it has carried for most of its history, and the durability premium never getting paid for at all. What decides it, five years from now, is nothing more complicated than whether 2025 and 2026 turn out to have been the top of another capital-markets cycle, or the start of something structurally different.
Where the read lands today. On balance, the read holds at a cautious Hold, one notch from a Reduce: this is a best-in-class franchise earning some of the best returns in its history, but the market has already paid a top-of-history multiple for a durability story that Goldman itself says is still three to five years from being delivered, and that multiple sits above where Wall Street’s own analysts, on average, think the stock belongs. Hold here means owning the franchise quality if you already hold it rather than chasing the re-rating at this price; it tips toward Accumulate if the multiple cools on a routine cyclical pullback while the wealth and asset-management arm actually starts closing in on its own return target, and it tips toward Reduce if the trading and dealmaking engine cools back toward normal while the multiple stays parked at the top of its range. The single thing most likely to flip this read in either direction is what happens to that multiple.
Companion tool
Jump to the interactive dashboard to sort and filter Goldman against its peer set, or download the Excel model (/gs-model.xlsx) to flex the scenarios yourself.
TL;DR
Goldman Sachs is the clearest case in all of banking of a stock whose price has moved faster than its story has been proven. The firm just posted its best year in a decade, with net revenue up 9% to $58.28 billion and earnings per share up 27% to $51.32, and its trading and dealmaking arm, which still supplies roughly three-quarters of the firm’s revenue, got even more cycle-dependent in the most recent quarter, not less. At the same time, the stock’s price relative to its own tangible book value has climbed from a ten-year median of about 1.17 times to roughly 3.0 times today, a re-rating the market is granting on the belief that Goldman’s Asset & Wealth Management arm, now managing a record $3.65 trillion, is turning into a Morgan Stanley-style fee annuity durable enough to justify a wealth-manager’s multiple on a trading house’s earnings. Banks get valued this way, as a multiple of tangible book value (shareholder equity minus goodwill and other intangibles), because earnings swing hard with the capital-markets cycle while that equity base holds far steadier; paying close to three times it is the market betting Goldman will keep earning a durably high return on every dollar of that book, not just this year’s cyclically strong one. The trouble is that division’s own return on equity, 12.5% in 2025, sits well below the 17% to 19% target Goldman itself says is three to five years away, and the capital cushion that funds Goldman’s buybacks has thinned from roughly 340 basis points above its regulatory minimum to about 110 in a single quarter. Pull the multiple back toward history and normalize the earnings toward mid-cycle at the same time, which is the ordinary way a capital-markets cycle actually ends, and two independent ways of doing that arithmetic both land in the same $540 to $670 zone, a drawdown of 35% to 50% from today’s price and a range that happens to contain Wall Street’s own lowest published price target. None of that means the story is wrong. It means the price has already assumed the story is right, before the evidence has arrived to prove it.
Explore it yourself: the interactive dashboard
Open the dashboard in a full screen
What Goldman Sachs actually is
Think of Goldman as three different businesses sharing one balance sheet, one brand, and one regulator, each with a completely different rhythm. The first is the deal-and-trading business, called Global Banking & Markets, which is Goldman doing what people picture when they hear the name: advising boards on mergers, underwriting stock and bond offerings, and standing in the middle of client trades in rates, credit, currencies, and equities. It is the temperamental one. It swings from a great year to a mediocre one depending on whether corporate boards feel confident enough to do deals and whether markets are volatile enough to make trading profitable, and in 2025 it produced $41.45 billion of net revenue, about 71% of the whole firm’s total, rising to 74% in the first quarter of 2026. The second is Asset & Wealth Management, the part of Goldman that manages money for pensions, insurers, and wealthy families in exchange for a fee tied to the size of the pool, not to whether a deal happens to close this quarter. It brought in $16.68 billion in 2025, about 29% of revenue, on a record $3.65 trillion of assets under supervision. The third, Platform Solutions, is what remains of Goldman’s failed attempt to become a consumer bank through Marcus and the Apple Card partnership. It is being wound down and now produces essentially no revenue that matters to the investment case, just $151 million in 2025.
The reason this three-way split matters more for Goldman than for almost any other bank is that the entire argument for paying up for the stock rests on the second business growing to matter more than the first. A trading house has always traded at a discount to a wealth manager, because a wealth manager’s fees survive a downturn (they just shrink with the size of the assets) while a trading desk’s revenue can evaporate almost overnight when deals stop happening and markets go quiet. Goldman’s stock price today already assumes the firm is well on its way to becoming the second kind of company. The financial statements say it is still mostly the first kind, with an assist from a fast-growing but still much smaller second engine.
How the money flows
flowchart TD
    TOP["Client demand: corporations, sponsors, institutions, wealthy families -> $58.28B FY2025 net revenue"]
    TOP --> GBM["Global Banking & Markets: $41.45B (71% of revenue)"]
    TOP --> AWM["Asset & Wealth Management: $16.68B on $3.65T of assets under supervision"]
    TOP --> PS["Platform Solutions: $0.15B, winding down"]

    GBM --> ADV["Advisory $4.73B: #1 ranked M&A advisor worldwide"]
    GBM --> UW["Underwriting $4.61B: stock and bond issuance"]
    GBM --> FICC["FICC $14.52B: rates, credit, currencies trading"]
    GBM --> EQ["Equities $16.54B: trading plus financing"]

    AWM --> MGMT["Management fees $11.54B: scale with assets, not deals"]
    AWM --> PBL["Private banking and lending $3.35B"]
    AWM --> INC["Incentive fees $0.49B"]

    FUND["Funding: $501B deposits (YE2025) plus wholesale borrowing"] --> GBM
    FUND --> AWM

    ADV --> REV["Total net revenue $58.28B FY2025"]
    UW --> REV
    FICC --> REV
    EQ --> REV
    MGMT --> REV
    PBL --> REV
    INC --> REV
    PS --> REV

    REV --> COMP["Compensation & benefits $18.9B, about 32% of revenue"]
    REV --> OPEX["Other operating costs, ~64.4% efficiency ratio"]
    REV --> CAP["Retained capital: CET1 14.3% at YE2025, down to 12.5% by Q1 2026"]
    REV --> RETURN["Buybacks and dividends: $16.78B returned in FY2025"]

    REG["Fed CCAR stress test / Basel III endgame proposal"] --> CAP
    REG --> FICC
Every dollar that walks in Goldman’s door starts as somebody else’s confidence: a corporate board’s confidence that a merger will create value, an issuer’s confidence that today is a good day to sell stock or bonds, a trader’s need to reposition a book, or a family office’s decision to hand its money to somebody else to manage. That demand splits into the two flows above and, before it becomes profit for shareholders, passes through three filters in order. First, people: compensation and benefits, at $18.9 billion in 2025, is the single largest expense at the firm and runs at roughly 32% of net revenue, deliberately smoothed by management so that a spectacular quarter doesn’t blow out pay all at once and a weak quarter doesn’t force immediate pay cuts. Second, the regulator: a share of every dollar earned has to be retained as capital against the risk Goldman is carrying on its balance sheet, a requirement set once a year by the Federal Reserve’s stress test (formally CCAR), in which the Fed models a severe recession across every large bank’s balance sheet and uses the resulting hypothetical losses to set each bank’s Stress Capital Buffer, the add-on that gates how much of its own earnings it can hand back to shareholders, and adjusted by the still-pending Basel III capital rulemaking discussed below. Only what’s left after both of those filters, $17.18 billion in 2025, becomes net earnings, and management then chooses how much of that to keep, how much to pay out as dividends, and how much to spend buying back stock.
The shape that matters for an investor is which of the three flows is growing. The trading-and-dealmaking flow is the toll-taker on capital-markets activity itself: it earns the most in absolute dollars and swings the hardest. The fee flow inside Asset & Wealth Management is the toll-taker on the mere existence of the asset pool, whether or not anything happens to it this quarter, which is exactly why it degrades more slowly in a downturn. Goldman’s whole multi-year pitch to the market is that it is quietly reweighting itself from the first kind of toll booth toward the second.
The three engines, in plain terms
Two numbers do most of the work in the paragraphs below. Return on equity (ROE) is net income divided by shareholder equity, a measure of how hard a business turns its capital into profit. Return on tangible equity (ROTE) does the same division after stripping goodwill and other intangibles out of the equity base, which matters more for a bank because tangible equity is the capital that actually absorbs losses. Goldman’s firmwide target is 14% to 16% ROE and 15% to 17% ROTE through a full cycle; the 19.8% ROE and 21.3% ROTE it posted in the first quarter of 2026, cited below, sit well above that band and are a cyclical peak, not the new normal.
Global Banking & Markets (GBM): the cyclical profit machine. This segment is really four businesses bundled together for reporting purposes. Advisory, the pure merger-and-acquisition business, earned Goldman $4.73 billion in 2025 and required almost no balance sheet at all, just senior bankers and relationships; Goldman ranked #1 in the world in announced M&A that year, advising on $1.48 trillion of deals and collecting $4.6 billion in pure advisory fees, ahead of JPMorgan’s $3.1 billion and Morgan Stanley’s $3.0 billion. Underwriting, the business of bringing new stock and bond issuance to market, added $4.61 billion, a more commoditized fee that depends heavily on whether the IPO and bond-issuance windows are open. FICC, the trading desk for rates, credit, currencies, and mortgages, produced $14.52 billion, while Equities, which combines stock trading with financing services like prime brokerage, produced $16.54 billion, a record, helped by unusually high market volatility tied to AI-related repricing and geopolitical shocks in the first quarter of 2026. The segment’s return on equity climbed from 11.3% in 2023 to 16.4% in 2025, and segment net earnings to common were $13.12 billion in 2025, up from $10.68 billion in 2024 and $8.26 billion in 2023, a swing of more than 58% in two years purely from the cycle turning, on top of some genuine market-share gains.
Asset & Wealth Management (AWM): the durability bet, still mostly a promise. This is the fee business, and the one the market is really paying up for. It ended 2025 managing a record $3.606 trillion of client assets, extending to $3.65 trillion by the first quarter of 2026, on the back of 33 consecutive quarters of net client inflows, a streak that has never once broken during this entire bull run. Management fees, the core recurring-revenue line, were $11.54 billion in 2025, growing steadily each year. Goldman has set itself a public target of growing its highest-fee alternatives business, private equity, private credit, and similar strategies, to $750 billion of assets by 2030 from about $420 billion today, and it has been buying its way toward that goal, closing an acquisition of Industry Ventures (a venture-capital secondaries specialist) in early 2026 and Innovator Capital Management (an active exchange-traded-fund sponsor) in the second quarter. The catch, and it is the single most important number in this entire article, is that the segment’s actual 2025 return on equity was 12.5%, below the 14.6% it posted in 2024, and well short of the 17% to 19% medium-term target Goldman itself has now set, a target management describes as three to five years out from the end of 2025. That gap matters beyond the raw arithmetic: the entire re-rating of Goldman’s stock is a bet that this division becomes a high-return, low-volatility annuity, and a 12.5% return on equity, barely above where it stood two years ago, means that durability is still a promise rather than a delivered result, so the market is effectively paying today for returns Goldman has not yet produced. The pre-tax margin tells the same story: about 25% today against a roughly 30% target. The fee line is growing nicely. The overall segment’s profitability, dragged down by the wind-down of older legacy investments and a one-time regulatory fee, has not yet caught up to what the multiple already assumes.
Platform Solutions: the retreat completed. Goldman’s mid-2010s push into consumer banking through the Marcus brand and the Apple Card partnership is now essentially over. Net revenue in this segment collapsed from $2.13 billion in 2024 to just $151 million in 2025, largely because the Apple Card loan book is being marked down and transitioned to another card issuer, a process Goldman itself flags could take longer than planned. This segment is not a growth story for the stock in any direction; it is background noise that has finally quieted down after several years of real losses.
Who wins where
Within the bulge-bracket banking group, the market currently pays the richest multiples to the two firms with the least old-fashioned lending on their balance sheets and the most fee-and-trading-based revenue: Goldman and Morgan Stanley. JPMorgan and Bank of America, the two largest deposit-funded lenders in the country, have lagged both on price and on multiple over the past year despite posting strong results in their own right, because the market treats a diversified, deposit-heavy bank as a slower-growing but steadier animal. Inside the advisory business specifically, a set of boutique firms with no trading balance sheet at all, Evercore, Lazard, and Moelis among them, have been quietly taking share of the highest-prestige, most conflict-sensitive mandates, competing on being an independent voice in the room rather than on having the biggest balance sheet. And in pure asset management, BlackRock sits as the scale reference point for what Goldman’s Asset & Wealth Management arm is trying to become, a business the market already prices as a durable annuity because it has proven, over a much longer stretch, that it behaves like one.
The chokepoints in this business are not physical, they are regulatory and reputational. The Federal Reserve’s annual stress test sets a hard ceiling on how much capital-intensive trading and financing activity any of these firms can run, and the still-unfinished Basel III capital rulemaking discussed below is the single largest swing factor for how expensive that ceiling is going to be. Reputation is the other chokepoint: Goldman’s ability to charge full fees on the most complex advisory mandates depends on being trusted with a company’s most sensitive information, which is a moat that erodes slowly through scandal and rebuilds slowly through a clean track record, which is part of why the 1MDB matter discussed in the filings section below, even though it is now largely behind the firm, took years to work through.
Company by company: who’s who
The Goldman Sachs Group (GS), NYSE. Market cap runs roughly $298 billion to $310 billion as of this writing, depending on which share count you use (see the methodology section). The premier global investment bank: #1-ranked M&A advisor worldwide, a top-tier trading and financing franchise, and a fast-growing Asset & Wealth Management arm now overseeing $3.65 trillion. First-quarter 2026 results were the second-best quarter in the firm’s history: net revenue of $17.23 billion, up 14% year over year, net earnings of $5.63 billion, diluted earnings per share of $17.55, and an annualized return on equity of 19.8%. Bull: the M&A and trading franchise holds the top ranking in its category and the fee-based wealth arm is compounding for real. Bear: roughly three-quarters of revenue is still capital-markets-cyclical, and the stock trades at close to 19 to 20 times trailing earnings, near the top of its own ten-year history, for results that sit at a cyclical high.
Morgan Stanley (MS), NYSE. Market cap around $330 billion. Goldman’s most direct rival, and the bank that built the wealth-management scale years earlier through its acquisitions of Smith Barney, E*Trade, and Eaton Vance, giving it a larger, steadier share of fee-based revenue than Goldman has today. First-quarter 2026 net revenue was $20.6 billion, beating estimates, with return on tangible common equity of 27.1%; its Wealth Management division alone produced $8.5 billion of revenue at a 30.4% pre-tax margin. Morgan Stanley’s steadier, wealth-driven returns are exactly why it earns the peer-high roughly 4.05 times tangible book against Goldman’s own roughly 3.0 times: it is the benchmark Goldman’s re-rating is chasing, and the fact that Goldman still trades at a discount to it is the market’s way of saying the bet that Goldman becomes just as durable is not yet proven. (See the full Morgan Stanley outlook for the proof-of-concept wealth-management model Goldman is pursuing.) Bull: the steadier, wealth-heavy mix is the proof of concept for exactly what Goldman is trying to become, and the market rewards it with the richest multiple in this entire peer set, roughly 4.05 times tangible book value. Bear: that richest multiple also makes Morgan Stanley the single name most exposed if a market correction shrinks wealth-management fees and asset values at once.
JPMorgan Chase (JPM), NYSE. Market cap around $877 billion, the largest bank in the country by both assets and market value. A true universal bank spanning consumer banking, commercial banking, and a top-tier investment bank and trading business that competes directly with Goldman for the largest, most complex deals; JPMorgan actually led the industry in total investment-banking fee wallet share in 2025 and the first quarter of 2026, even though Goldman led specifically in pure M&A advisory. First-quarter 2026 net income was $16.5 billion, up 13% year over year, with a CET1 capital ratio of 14.3%, noticeably higher than Goldman’s 12.5%. (See JPMorgan’s full outlook and capital-fortress perspective for the scale-and-diversification alternative.) Bull: unmatched scale and diversification give it the most resilient earnings base of any bank in the country. Bear: its size and consumer-lending exposure make it a fundamentally different, more credit-cycle-sensitive animal than a pure capital-markets play like Goldman.
Bank of America (BAC), NYSE. Market cap around $404 billion, the country’s second-largest bank, with a large traditional consumer and commercial banking base plus a global banking and markets arm that competes with Goldman in underwriting and trading, though with a smaller share of the fee pool. First-quarter 2026 net income was $8.6 billion, up 17% year over year, with earnings per share the highest in roughly twenty years. It trades at under two times tangible book value and around 12 times forward earnings, the cheapest multiple in this entire peer group. (See Bank of America’s full outlook for what Goldman’s bear case looks like if the cycle turns and valuations mean-revert.) Bull: a re-accelerating net interest income cycle is finally working in its favor after years of rate pressure. Bear: it is the market’s clearest example of how cheaply a bank gets priced once investors decide the capital-markets cycle has turned, which is exactly the multiple compression Goldman’s bear case describes.
Evercore (EVR), NYSE. Market cap around $14.1 billion, a pure advisory boutique with no trading desk and essentially no balance-sheet risk. First-quarter 2026 net revenue more than doubled year over year to $1.39 billion on a record advisory-fee quarter. Bull: a pure-play, high-margin read on a real M&A cycle turn, with none of a big bank’s trading risk. Bear: a quarter where revenue more than doubles is, almost by definition, a cyclical peak, not a sustainable run rate, and the stock has already re-rated hard on the back of it.
Lazard (LAZ), NYSE. Market cap around $4.1 billion, a boutique advisory firm with an unusual second leg in asset management that gives it a fee-based buffer most pure boutiques lack. First-quarter 2026 revenue rose 16% to $756.6 million, with its Asset Management division posting its best quarterly net inflows in almost two decades. Bull: the asset-management diversification, reinforced by its pending Campbell Lutyens acquisition, reduces dependence on lumpy deal fees. Bear: its core Financial Advisory revenue actually declined 4% year over year even as every other advisory peer in this set posted a record quarter, a disconfirming data point worth watching rather than ignoring.
Moelis & Company (MC), NYSE. Market cap around $5.3 billion, a smaller, more US-M&A-concentrated advisory boutique with no trading or asset-management business. First-quarter 2026 revenue was a record $319.8 million, but growth of just 4% year over year badly lagged Evercore’s doubling in the same quarter, and earnings per share of $0.48 missed estimates. Bull: record revenue and a full deal pipeline show the advisory recovery reaches beyond the largest boutiques. Bear: growth this far behind its closest peer, in the same quarter and the same cycle, suggests Moelis is not capturing this upswing as fully as the market may assume.
BlackRock (BLK), NYSE. Market cap around $157 billion, the world’s largest asset manager, included here as the pure-play comparison for Goldman’s Asset & Wealth Management arm rather than as an investment-banking rival. First-quarter 2026 assets under management hit a record $14.04 trillion on $130 billion of net inflows, its best first quarter in five years. Bull: unmatched scale in both passive and alternatives investing gives it durable, fee-based growth a trading-heavy bank cannot match. Bear: BlackRock’s own growth is increasingly tied to the level of markets, not just to new money coming in the door, which is the same vulnerability sitting inside Goldman’s own “the wealth arm makes us drawdown-proof” argument. Even the best fee annuity in the business shrinks when the market it is priced on falls.
What the filings say
Goldman’s 2025 fiscal year, drawn from the audited Form 10-K filed February 25, 2026 and the first-quarter 2026 Form 10-Q filed May 1, 2026, was the strongest in the firm’s recent history on almost every reported measure. Net revenues were $58.283 billion, up 9% from $53.512 billion in 2024 and $46.254 billion in 2023, a clean multi-year climb. Net earnings were $17.176 billion, up from $14.276 billion in 2024 and just $8.516 billion in 2023, and diluted earnings per share reached $51.32, up 27% from $40.54 the year before. Return on equity was 15.0%, up from 12.7%, and return on tangible equity was 16.0%, both already inside the firm’s own long-stated through-cycle target band of 14% to 16% ROE and 15% to 17% ROTE. Momentum kept building into 2026: the first quarter alone produced $17.227 billion of net revenue, up 14% year over year, $5.630 billion of net earnings, and an annualized return on equity of 19.8% (return on tangible equity 21.3%), the second-highest quarterly revenue, earnings, and per-share result in the firm’s history. One notable accounting item flatters the full-year number somewhat: 2025’s provision for credit losses was actually a net benefit of $1.113 billion, almost entirely a one-time reserve release tied to moving the Apple Card loan book to held-for-sale ahead of its handoff to another issuer, not a sign of broadly improving credit quality.
The segment breakdown makes clear how concentrated the profit engine is. Global Banking & Markets produced $41.453 billion of 2025 net revenue, 71% of the firm total and a record, up 18% year over year, at a 16.4% return on equity, up from 13.8% in 2024 and 11.3% in 2023; segment net earnings to common were $13.12 billion. Inside that segment, Advisory brought in $4.73 billion, equity underwriting $1.78 billion, debt underwriting $2.83 billion (combined investment-banking fees of $9.34 billion, up 21% for the year), FICC $14.52 billion, and Equities $16.54 billion. Asset & Wealth Management contributed $16.679 billion, 29% of revenue and up 2% for the year, at a 12.5% return on equity and a 25% pre-tax margin, both down from the year before, hurt by roughly 2.3 percentage points of drag from the wind-down of older, legacy principal-investment positions and a one-time FDIC special-assessment fee. Platform Solutions generated just $151 million, down 93% year over year, after a $2.26 billion revenue markdown tied to the Apple Card transition that was more than offset in the bottom line by the associated reserve release; the segment had posted losses of $2.024 billion and $997 million pre-tax in 2023 and 2024, respectively, before barely turning a $151 million pre-tax profit in 2025, flattered by that one-off. By geography, 63% of 2025 revenue came from the Americas, 24% from Europe, the Middle East, and Africa, and 13% from Asia, with profit even more concentrated in the Americas at 69%. In the first quarter of 2026, the mix shifted further toward the cyclical side, with Global Banking & Markets rising to 74% of net revenue, Asset & Wealth Management falling to 24%, and Platform Solutions at 2%.
On the balance sheet, total assets were $1.809 trillion at year-end 2025, growing to $2.062 trillion by the first quarter of 2026. Deposits, Goldman’s comparatively thin funding base relative to a traditional retail bank, were $501 billion at year-end 2025, rising to $561 billion by the first quarter, split across consumer, private-bank, transaction-banking, brokered-certificate, and deposit-sweep channels. Total loans were $238 billion at year-end, up 21% for the year, roughly 85% secured, with a full-year net charge-off rate of just 0.6%. Total shareholders’ equity stood at $124.972 billion. Book value per share was $357.60 at year-end 2025, and tangible book value per share, the more relevant figure for the valuation discussion below, was $335.49, both rising modestly to $361.19 and $336.28, respectively, by the first quarter of 2026. Basic shares outstanding fell from 307.1 million to 302.0 million over that same window as buybacks continued to outrun new share issuance from employee compensation.
On capital, Goldman’s Standardized Common Equity Tier 1 (CET1) ratio was 14.3% at year-end 2025 (Advanced approach 15.1%) against a required minimum of roughly 10.9%, a buffer of about 340 basis points. CET1 is the bank’s highest-quality, loss-absorbing capital, mostly plain shareholder equity, measured against its risk-weighted assets; regulators set a minimum ratio each bank must hold as a cushion against losses (Goldman’s is roughly 11.4% today), and whatever sits above that floor is the only capital a bank can actually hand back to shareholders, because it cannot distribute the capital it needs to stay above the minimum. By the first quarter of 2026, that ratio had fallen to 12.5% Standardized (Advanced 13.4%), while the required minimum simultaneously rose to roughly 11.4% because of a scheduled increase in Goldman’s global systemically important bank surcharge from 3.0% to 3.5% effective January 1, 2026. The result is that Goldman’s cushion above its own regulatory floor compressed from roughly 340 basis points to roughly 110 basis points in a single quarter, driven mostly by an aggressive pace of share buybacks running ahead of risk-weighted asset growth. In practical terms, a thinner cushion means less room to keep buying back stock at the same pace, and if the pending Basel III rulemaking raises the required minimum further, Goldman would have to choose between slowing buybacks and rebuilding the cushion. That compression sits inside the 50-to-100-basis-point band management itself says it targets holding above the requirement, so it is a deliberate capital-management choice rather than a sign of distress, but it is a materially thinner cushion than a year earlier, and Goldman’s own 10-K risk-factor language states plainly that failing to maintain required capital levels “could limit our ability to… repurchase shares, pay dividends, and make certain discretionary compensation payments.”
On capital returns, Goldman returned $16.78 billion total to common shareholders in 2025, $12.36 billion of buybacks (18.9 million shares repurchased at an average price of $654.45) plus $4.42 billion of dividends. The board approved a new $40 billion buyback authorization in 2025, with $32.0 billion remaining as of the end of that year, and the pace of repurchases has accelerated sharply, from $5.796 billion in 2023 to $8.0 billion in 2024 to $12.36 billion in 2025. On the dividend specifically, there have been two separate and sequential increases and it matters to keep them straight. The board raised the quarterly dividend 12.5%, from $4.00 to $4.50 per share, effective the first quarter of 2026 and already paid. Then, at the June 24, 2026 stress-test results release, Goldman announced its intent to raise the quarterly dividend a further 11%, from $4.50 to $5.00 per share, effective for the quarter beginning July 1, 2026. As of this writing, on June 30, 2026, the dividend actually being paid remains $4.50 per quarter; the $5.00 rate takes effect the very next day and is still subject to formal board approval at the third-quarter 2026 meeting. Dividends of any kind are a board decision, not a guarantee, and remain constrained by the same regulatory capital requirements discussed above.
On guidance, Goldman’s firmwide through-the-cycle targets remain unchanged: 14% to 16% return on equity, 15% to 17% return on tangible equity, and an efficiency ratio (operating expenses as a share of net revenue) of approximately 60%. The firm is currently running above that efficiency target, at 64.4% in 2025, even while its return on equity sits inside or near the top of its target band, meaning the ratio of expenses to revenue is the one firmwide target management has not yet hit. In 2026, Goldman announced new, separate medium-term targets specifically for Asset & Wealth Management: a return on equity in the high teens (roughly 17% to 19%) and a pre-tax margin of roughly 30%, both measured against actual 2025 results of 12.5% and 25%, respectively, a target management itself frames as three to five years out from the end of 2025. Alongside that, management targets double-digit annual growth in fees from alternative investments, $75 billion to $100 billion of annual alternatives fundraising, and $750 billion of alternatives assets under supervision by 2030, up from $438 billion raised cumulatively since 2019 through year-end 2025.
On disclosed risks, Goldman’s own filings flag three that matter most to this thesis. First, regulatory capital volatility: the firm explicitly warns that Basel Committee capital reforms, still being finalized in the United States as discussed below, could raise its capital requirements and, in turn, limit buybacks, dividends, and discretionary pay. Given how much the capital cushion already compressed in a single quarter, this is not a hypothetical risk. Second, market-making and trading concentration: Goldman’s own language notes that decreases in market volatility have reduced, and could again reduce, its trading opportunities, and with Global Banking & Markets now supplying 71% to 74% of revenue, the firm’s results are directly exposed to any cooling in volatility or deal volume. Third, the Apple Card wind-down carries its own execution risk, since Goldman discloses the transition to a new card issuer “may not close on the anticipated timeline or at all,” and the segment’s thin 2025 profit was a product of a one-time accounting benefit rather than durable underlying earnings power.
On insiders and institutional ownership, the largest holders per the March 2026 proxy statement are all passive index managers: Vanguard at 9.68%, BlackRock at 7.80%, and State Street at 6.65%, which is standard for a mega-cap financial and not itself a directional signal. All directors, named executives, and other executive officers as a group held just 1,618,820 shares as of March 2, 2026, a small fraction of roughly 296 million shares outstanding, with CEO David Solomon’s own reported stake at 143,146 shares. Form 4 filings from April and May 2026 show routine, modest sales by Solomon, chief financial officer Denis Coleman, general counsel Kathryn Ruemmler, and other executives, totaling roughly $110 million over the trailing three months with no offsetting open-market buying found in the same window. This pattern is consistent with scheduled tax-withholding sales tied to the vesting of restricted stock, which is routine at every large public company and does not, on its own, imply anyone at Goldman thinks the stock is overpriced; it is stated here as a factual, disclosed data point rather than as an assertion of motive, since the underlying share sales cannot be separated cleanly from ordinary vesting mechanics without more granular disclosure than Goldman provides.
Finally, on 1MDB, the Malaysian sovereign-wealth-fund scandal that dogged Goldman for years: the governmental and regulatory side of that matter is fully resolved and has been for some time, through an August 2020 settlement with Malaysia and October 2020 settlements with the US Department of Justice, the SEC, the Federal Reserve, New York state regulators, and counterparts in the United Kingdom, Singapore, and Hong Kong, with the parent company’s deferred-prosecution-agreement charge formally dismissed in May 2024. What remained open through early 2026 was a private securities class action in Manhattan federal court, in which a class was certified in part in September 2025 and an appellate challenge to that certification was denied in December 2025. As of this writing, that private litigation is also effectively resolved: Goldman agreed in around April 2026 to pay $500 million to settle the remaining claims, pending final court approval. Put together, 1MDB should be read as a historical matter that is now fully settled on every front, not as an ongoing legal exposure, and nothing here implies current wrongdoing at the firm.
What the market is paying
Every figure in this section is a snapshot as of the June 30, 2026 close and will look different within days; treat it as a photograph, not a forecast. Goldman’s shares closed that day at $1,011.37, roughly 74% of the way up a 52-week range that ran from $691.30, touched in July 2025, to an intraday high of $1,125.00 reached around June 22, 2026, meaning the stock sits about 10% below its own recent all-time high. Price returns, dividends not reinvested, have been extraordinary: up 14.4% over six months, up 15.1% year to date, up 42.9% over the trailing year, up 213.5% over three years, and up 166.5% over five years. Add roughly one and a half to two additional points a year on top of those figures for reinvested dividends. Realized volatility has been elevated, running around 36.5% annualized over the trailing 30 days, and the stock’s beta against the S&P 500 sits somewhere between 1.29 and 1.41 depending on the calculation window, meaning it moves noticeably more than the broad market in both directions; the largest drawdown in the trailing two years was 31.2%, running from a February 2025 peak to an April 2025 trough during that year’s tariff-driven selloff, a decline the stock has since fully recovered and gone on to exceed.
Against its peers and the broader market, Goldman and Morgan Stanley have been the standout performers over every window measured, both comfortably beating the S&P 500’s 20.9% trailing one-year return and far outpacing JPMorgan’s 12.9% and Bank of America’s 20.4% over the same period; the Financial Select Sector SPDR fund, the standard sector benchmark, has actually lagged the index, up only 2.4% over the trailing year, dragged down by non-bank components like insurers and card networks that don’t share in the pure capital-markets rally.
The valuation conversation for this stock centers on one number: the multiple of price to tangible book value. Goldman’s tangible book value per share was $336.28 as of March 31, 2026, putting the stock at roughly 3.0 times tangible book at the current price, a figure that has been independently cross-checked against the underlying filings. That is well above Goldman’s own history: per GuruFocus, the stock’s ten-year price-to-tangible-book range runs from a low of 0.61 to a high of 2.95, with a ten-year median of just 1.17, meaning today’s 3.0 sits at or above the very top of the entire historical range. For comparison, using each firm’s own most recent tangible book value per share and current price, Morgan Stanley trades at roughly 4.05 times tangible book, the wealth-management premium multiple, JPMorgan at roughly 3.01 times, and Bank of America at roughly 1.98 times. Goldman has re-rated from being the cheapest name in this group to sitting right alongside JPMorgan’s premium multiple and closing in on Morgan Stanley’s, a genuine structural shift in how the market prices the stock, not simply a rising-tide effect across the whole sector, since Goldman has outrun both JPMorgan and Bank of America on price and multiple expansion together. On more traditional metrics, trailing price-to-earnings sits around 18.5 (some vendor calculations put it closer to 19.5 to 20, depending on the trailing-earnings window used), against a ten-year median closer to 13, and forward price-to-earnings is around 16.7.
On the dividend, the trailing yield is about 1.78% at the $4.50 quarterly rate currently in effect; once the announced $5.00 rate actually takes effect and is paid, the forward yield at today’s price would be roughly 1.98%. The payout ratio is modest, around 31%, leaving room for continued buybacks, and total shareholder yield including repurchases is closer to 6% to 7%. Average daily trading volume is about 2.39 million shares, a large and liquid name with no execution concerns for most investors, and short interest is modest, at roughly 2.1% to 2.2% of shares outstanding, below the peer-group average, so this is not a name with any meaningful short-squeeze dynamic in either direction.
Wall Street’s own consensus rating clusters around Hold, with the average price target sitting close to $975 to $978 across the major data vendors, meaning the stock currently trades above where the average analyst thinks it belongs, implying modest downside on consensus alone. The highest published target is $1,195 (Wells Fargo, dated June 24, 2026), while the lowest credible current target is roughly $600, a figure that sits squarely inside the double-de-rate zone described in the scenarios section below. A note of caution on this particular figure: different data vendors show meaningfully different consensus averages depending on the pull date and how they handle stale entries, with one vendor’s mean landing closer to $880 to $914 rather than $975, so this consensus figure should be read as a rough band, not a precise point. Independent screening services flag the stock as overvalued as well: GuruFocus’s own fair-value estimate puts it at roughly 43% above fair value, and Simply Wall St’s discounted-cash-flow estimate puts fair value near $934, both consistent with the “priced above what the average outside analyst thinks it is worth” read. Oppenheimer downgraded the stock specifically on valuation grounds in 2026, alongside similar downgrades of Bank of America and Citigroup.
What the crowd is saying
The dominant news narrative through the first half of 2026 has been an investment-banking “super-cycle,” and it is warming, not cooling. CEO David Solomon has publicly called for the best year for mergers and acquisitions since 2021 and has described the current environment as a “technology supercycle,” citing artificial-intelligence-related spending, deregulation, and pro-growth policy as tailwinds. Investment-banking revenue was up 48% year over year in the first quarter of 2026, and global M&A activity was up roughly 40% for the same period. Supporting that narrative, the stock is up 42.9% over the trailing year, and retail sentiment on platforms like StockTwits flipped decisively bullish in April 2026 on the back of the strong first-quarter print, described in the underlying research as organic chatter tied to visible earnings strength rather than any coordinated promotion. The story retail investors are telling themselves is straightforward: dealmaking is back, the CEO is bullish, and the dividend keeps rising, so this is the clean way to own a capital-markets recovery. There is no evidence of pump-and-dump behavior or manipulation in any of this activity; it reads as genuine, if increasingly consensus-driven, positioning.
The gap worth naming explicitly is between that story and what the valuation multiples already show. Retail and momentum investors appear to be treating the re-rating as structural, driven by the wealth and asset-management pivot, the CEO’s positioning around AI infrastructure spending, and rising capital returns. But the stock’s trailing price-to-earnings ratio, running somewhere between 18.5 and 19.7 depending on the source, sits 40% to 55% above its own ten-year median of roughly 13, on earnings that are themselves running at a cyclical high. Investment-banking and trading revenue are inherently cyclical businesses that tend to look their best right at the moment the market is most enthusiastic about them, which is exactly when the risk of a turn is highest. That is not a prediction the cycle is about to roll over; it is simply the honest observation that the crowd’s story assumes either the cycle keeps extending or the wealth-management pivot arrives fast enough to justify the price paid today, while the underlying numbers show a premium multiple riding on peak, not average, earnings.
Employee sentiment, drawn from Glassdoor, offers a useful side signal: an overall rating of 3.7 out of 5 across more than 19,000 reviews, essentially flat to slightly down year over year, with strong marks for career opportunities (3.9) but persistently weak marks for work-life balance (2.9), a complaint that has not improved even as business results have. That is a typical pattern for an investment bank in an up-cycle, prestige and pay rising alongside workload, but it is a reminder that the current revenue strength is being extracted, in part, from longer hours rather than purely from better productivity.
The two Goldmans: a trading house’s earnings, priced like a wealth manager’s
Every part of Goldman’s structural bull case is real and checkable, and every part of the cyclical bear case is also real and checkable, and the honest read is that both are true at once, which is exactly why this is such a hard stock to have a strong opinion about.
The structural case rests on three specific, verifiable facts. Goldman is meaningfully less trading-dependent than it was a decade ago, with Asset & Wealth Management now representing roughly 30% of revenue, up from a rounding error years ago, and that fee stream compounds with the size of the asset pool rather than resetting to zero the way a dead deal pipeline does. The investment-banking recovery itself looks early-cycle rather than late-cycle: deal backlog is described as being at a multi-year high, and global M&A and IPO volumes are recovering from a deeply depressed 2022-to-2024 base, which suggests real multi-year runway before this business even revisits its prior 2021 peak, let alone exceeds it. And the regulatory backdrop has turned unusually friendly for a trading-heavy bank, with the pending Basel III capital rulemaking trending toward capital neutrality or modest relief rather than the much tougher treatment originally proposed in 2023, freeing capital that can be redeployed into higher-return lending, financing, and wealth-management activity rather than sitting idle against punitive capital charges.
The cyclical case is just as concrete, and it starts from the observation that cyclicality has not been repealed just because a firm says it is diversifying away from it. The most likely trigger for a downturn here is not a slow fade but a volatility-driven trading air pocket compounding with a credit event. Private-credit stress, which has already shown up in the real world through a Blue Owl fund permanently gating redemptions after a surge in withdrawal requests and rising direct-lending default-rate estimates, is exactly the kind of shock that would simultaneously freeze the sponsor financing the current merger-and-acquisition recovery depends on and pressure Goldman’s own credit exposure to funds it lends against. The mechanics are worth spelling out. Private credit is lending done by non-bank funds rather than banks, and when withdrawal requests surge, a fund can gate redemptions, meaning it stops honoring investor withdrawals to avoid a fire sale of the loans it holds; that freezes the cash those funds would otherwise deploy to finance the leveraged buyouts private-equity sponsors are counting on, so deal financing dries up and the M&A and IPO reopening Goldman’s investment-banking revenue depends on stalls with it. At the same time, credit spreads, the extra yield investors demand to hold riskier debt over safe government bonds, widen when default worries rise, and Goldman marks its own trading positions to those wider spreads, so the same shock that freezes dealmaking can also produce mark-to-market losses on the trading desk, hitting both halves of Global Banking & Markets at once. Layer on a Federal Reserve that has shifted, as of mid-2026, toward holding rates steady or possibly even discussing a hike rather than cutting further, and the “cheap financing keeps the deal window open” assumption behind the bull case gets noticeably shakier. Meanwhile, the very trading strength that powered the first quarter of 2026’s record equities result was substantially a function of unusually high, event-driven volatility tied to AI-disruption repricing and geopolitical shocks. Volatility mean-reverts by its nature; when it normalizes, trading revenue typically gives back a real chunk of its current level even without any broader economic downturn at all.
The most defensible synthesis is a split reading, not a clean call either way. The investment-banking recovery has real multi-year room to run because it is climbing out of a genuine trough, and the current rate backdrop, while less accommodating than markets had hoped, is not yet a shock severe enough to stop deals outright. The trading business, especially the equities-and-fixed-income mix, is very likely running above a sustainable level right now because it is riding an elevated-volatility window that historically does not persist, and some give-back there over coming quarters should be expected regardless of what else happens in the economy. Asset & Wealth Management behaves the most like a structural business of the three and should keep compounding through an ordinary pullback, though a real bear market in equities would still shrink its asset-linked fees along with everything else. The swing factor worth watching above all others is private credit: if the current stress stays contained to retail-distributed lending vehicles, Goldman likely benefits, both from limited direct exposure and from a genuine opportunity to gain share in institutional private lending while weaker competitors retreat; if it migrates into a broader credit event that touches investment-grade spreads or bank balance sheets more widely, it takes the merger-and-acquisition recovery down with it and hits Goldman on both its dealmaking and trading legs simultaneously, which is precisely the mechanism behind the bear case quantified below.
The scenarios in detail
Every forward figure in this section is an estimate, illustrative arithmetic built off stated assumptions, not a forecast and not a price target. All of it is anchored on the verified June 30, 2026 close of $1,011.37 and on Goldman’s own tangible book value per share of $336.28.
The driver tree. Four variables decide where this stock actually lands over the next five years. First, the investment-banking and trading cycle, the master variable in the near term: Global Banking & Markets is 71% to 74% of net revenue and got more trading-heavy, not less, into the first quarter of 2026, so the central question is whether roughly $50 of annual earnings per share is a genuine new run rate or a cyclical peak; Goldman’s own through-cycle target implies a normalized figure closer to the low $40s. Second, the Asset & Wealth Management build, the master variable in the long term: the entire move in the stock’s multiple from a ten-year median of 1.17 times tangible book to today’s 3.0 times is a bet that this division becomes a true fee annuity, and while the growth is real, the actual return on equity, 12.5%, is still well below the 17% to 19% target management itself puts three to five years out. Third, the multiple itself, the most fragile of the four dials: a peak multiple sitting on top of peak earnings, above where Wall Street’s own average target says the stock belongs, is the single largest source of downside risk in this entire thesis. Fourth, capital and the pace of buybacks: the cushion above Goldman’s regulatory minimum collapsed from roughly 340 basis points to roughly 110 in one quarter, and the pending Basel III rulemaking, while currently trending favorable, is not finalized, so the buyback-and-re-rate engine is running on a narrower runway than it was a year ago.
| Horizon | Bear | Base | Bull | What dominates this window |
|---|---|---|---|---|
| Today | $1,011.37 | $1,011.37 | $1,011.37 | reference price, verified close |
| 6 months | $850 | $1,030 | $1,140 | Q2 and Q3 2026 earnings, private-credit headlines, buyback pace |
| 1 year | $780 | $1,070 | $1,230 | whether the cycle persists into 2027, the stress-buffer reset |
| 3 years | $680 | $1,120 | $1,380 | whether Asset & Wealth Management’s return on equity closes toward target |
| 5 years | $620 | $1,200 | $1,550 | structural durability versus cyclical mean reversion |
Bull scenario. The assumption set: the investment-banking and trading cycle normalizes only modestly before re-accelerating on a sustained merger and IPO upcycle, Asset & Wealth Management actually reaches its 17% to 19% return-on-equity target and roughly 30% margin, the alternatives business crosses the $750 billion goal, the efficiency ratio closes toward 60%, and the pending Basel rule is finalized favorably. In this world, net revenue grinds from around $58 billion toward the high $60s or low $70s billion range, per-share earnings compound from around $51 into the $70s or $80s as buybacks continue shrinking the share count and fee income compounds, and tangible book value per share climbs from $336 toward roughly $500. The illustrative math: roughly $500 of tangible book value multiplied by a defended 3.0 times, or cross-checked against roughly $78 of earnings multiplied by 19 to 20 times, both land near a $1,500 to $1,560 five-year level, rounded here to $1,550. What has to be true is that Asset & Wealth Management actually delivers the returns it has promised, not just the assets it has already gathered, and that the earnings mix demonstrably de-risks enough that the multiple survives an actual downturn rather than only a calm market. The most likely thing that breaks this case is the wealth arm’s return on equity stalling in the low teens because the true annuity, the management-fee line, is only a minority of the segment while the principal-investment piece inside it stays just as cyclical as trading.
Base scenario. The assumption set: the capital-markets cycle normalizes toward a genuine mid-cycle level, Goldman earns something close to its own mid-teens through-cycle return target, Asset & Wealth Management’s return on equity improves toward 14% to 16% without fully hitting its target, the efficiency ratio stays modestly above 60%, and the pending capital rulemaking lands broadly neutral. The multiple partly holds but gives back some of its recent expansion, compressing from around 3.0 times tangible book toward roughly 2.3 to 2.5 times as the market splits the difference between pricing Goldman like a trading house and pricing it like a wealth manager. Net revenue runs in the mid-$50s to low-$60s billion range through a full cycle, normalized earnings per share around $50 to $58, and tangible book value compounds to roughly $470 to $490 on retained earnings net of buybacks and the higher dividend. The illustrative math: roughly $480 of tangible book value times 2.4, or roughly $56 of earnings times 21, both land near $1,150 to $1,180, rounded to a $1,200 five-year level, a low-single-digit annual price gain plus the dividend. What has to be true is simply that the franchise holds its share and margin through an ordinary cycle without either a breakthrough or a breakdown. The most likely thing that breaks this case toward the downside is a sharper-than-usual downturn, a recession or a credit event, that pulls results toward the bear path for a stretch before eventually recovering.
Bear scenario, the double de-rate. This is the arithmetic the honest version of this thesis has to show, because it is the one calculation the bull case tends to leave undone: what happens if the cyclical earnings normalize and the rich multiple mean-reverts at the same time, since that combination, not either shock alone, is how a capital-markets cycle has historically ended for this kind of business. Start by normalizing the earnings: take Global Banking & Markets’ net earnings from the 2025 peak of roughly $13.1 billion back about halfway toward the 2023 trough of roughly $8.7 billion, landing around $10.5 billion to $11 billion. Firm-wide net earnings fall from roughly $17.2 billion to roughly $13.5 billion to $14 billion, which on approximately 296 million shares works out to normalized earnings per share of roughly $41 to $42, well below the current $51.32. From there, two independent routes both point to the same zone. The first route holds the price-to-earnings multiple to different levels: at today’s roughly 19.7 times, applied only to the lower earnings, the stock would be worth around $818, an 19% decline; compress the multiple to 15 times, still above the ten-year median, and it lands around $620, a 39% decline; compress it all the way to the 13-times ten-year median and it lands around $540, a 47% decline. The second route cross-checks against tangible book value directly: reverting from today’s 3.0 times to 2.0 times implies roughly $673, a 33% decline; reverting to 1.5 times, close to the stock’s own three-year average of about 1.3, implies roughly $505, a 50% decline. Both independent routes land in the same $540 to $670 zone, a drawdown of roughly 35% to 50% from today’s price, and that range happens to contain Wall Street’s own lowest published price target of roughly $600, meaning the bear case here is not a fringe view; it is close to the low end of the distribution analysts are already publishing. The assumptions behind it: the trading and dealmaking cycle mean-reverts to something closer to mid-cycle levels, the multiple mean-reverts at least partway alongside it, the Asset & Wealth Management durability premium never gets earned because that division’s return on equity stays stuck near 12% to 13%, private-credit stress freezes sponsor financing, and the thin capital cushion caps the defensive buyback exactly when it would be needed most. What has to be true for this outcome is nothing more exotic than the observation that 2025 and 2026 were a cyclical peak and that the 3.0-times multiple was, in effect, cycle-blind, which has historically been the default outcome for a trading-heavy franchise like this one rather than the exception.
Catalysts and the timeline. In the near term: the Q2 2026 earnings report, expected before the market open on July 14, is the first real read on whether the first quarter’s trading record and dealmaking re-acceleration are a run rate or a peak, and the compensation ratio each quarter is worth watching closely, since a creep toward 35% or higher would signal management itself expects the current strength to be temporary. The first actual payment of the $5.00 quarterly dividend, once formally approved by the board in the third quarter, will confirm the increase is real rather than merely announced. The pace of buybacks against the $40 billion authorization, measured against that thin roughly 110-basis-point capital cushion, is a live tell on whether capital constraints are starting to bind. Private-credit headlines through the second half of 2026, further fund redemption gates or rising default-rate data, are the most concrete near-term bear trigger. Over a multi-year horizon, the next stress-capital-buffer reset, due by 2027, will reset the runway for buybacks; finalization of the Basel III capital rulemaking will determine whether the currently favorable direction becomes locked in or shifts again; and the multi-year progress of Asset & Wealth Management’s return on equity toward its 17% to 19% target, along with the alternatives business’s progress toward $750 billion, is the real proof or disproof of the entire durability thesis. The single most informative test of all will simply be the next genuine capital-markets downturn, whenever it arrives, since that is the first moment the wealth-management annuity gets tested against a real drawdown rather than a rising market.
Leading indicators for a reader to track. Asset & Wealth Management’s segment return on equity and pre-tax margin each quarter is the single most important number in this entire thesis; grinding from 12.5% toward the mid-teens and a 30% margin validates the re-rating, while stalling in the low teens for several quarters undermines it. Global Banking & Markets’ share of total net revenue is the mirror image: a falling share, back toward 60% to 65%, is the de-risking the bull case needs, while the first quarter’s rise to 74% was a move in the wrong direction. The compensation ratio is the shock absorber worth watching quarter to quarter, since a ratio drifting into the high 20s signals management’s confidence the current revenue level is sustainable, while a creep toward 35% or more signals the opposite. The capital cushion above the regulatory requirement, currently around 110 basis points, needs to rebuild toward the 50-to-100-basis-point band management targets holding above the floor, and a cushion stuck near today’s level for several quarters would mean the buyback engine stays capped. Net client flows into Asset & Wealth Management during an actual risk-off quarter, something the current 33-quarter streak has never had to face, are the real proof of durability. And direct-lending default rates and fund redemption-gate activity are the live early-warning signal for the credit-event trigger described above.
Companies to watch (bull / base / bear)
Goldman Sachs (GS) - the name itself, and the cleanest read on whether a trading-and-advisory house can permanently earn a wealth manager’s multiple. Bull: Asset & Wealth Management’s return on equity closes the gap to its 17% to 19% target while the dealmaking cycle keeps converting backlog into fees. Base: the cycle holds near current levels for a while and the multiple slowly gives back some of its recent gain as the market waits for proof. Bear: a private-credit shock freezes deal financing just as trading volatility normalizes, and the multiple mean-reverts alongside the earnings. Watch: Q2 2026 earnings on July 14, the compensation ratio, and the capital cushion above the regulatory floor.
Morgan Stanley (MS) - proof of concept for the wealth-management pivot Goldman is chasing, and priced accordingly at a richer multiple. Bull: continued net-new-asset growth in Wealth Management defends its premium multiple through a soft patch elsewhere. Base: steady wealth fee growth offsets a normalizing trading and advisory business. Bear: being the richest multiple in the group, it has the most room to fall if wealth-management fees and asset values shrink together in a broader market correction. Watch: Wealth Management net new assets and pre-tax margin each quarter.
JPMorgan Chase (JPM) - the scale reference point, with a capital cushion Goldman would envy. Bull: diversification across consumer, commercial, and markets businesses smooths any single-segment shock. Base: steady, unspectacular growth across a very large base. Bear: consumer credit quality, not capital markets, is the swing factor to watch here, and it moves on a different clock than Goldman’s cycle. Watch: consumer credit charge-off trends and net interest income guidance.
Bank of America (BAC) - the bear-case anchor for the whole group, showing exactly how cheaply the market prices a bank once it decides the cycle has turned. Bull: a re-accelerating net interest income cycle finally rewards years of balance-sheet discipline. Base: modest, low-multiple compounding. Bear: consumer credit softening in a slower economy. Watch: net interest income growth against its own raised guidance.
Evercore (EVR) - the highest-torque, purest read on whether the deal cycle is real. Bull: the advisory recovery broadens and deepens through 2027. Base: fee growth normalizes off an unusually strong 2025-2026 base. Bear: a quarter where revenue more than doubles is close to the definition of a cyclical top, not a run rate, and the stock has already re-rated on the assumption it repeats. Watch: whether advisory fee growth decelerates from its current pace.
Lazard (LAZ) - the disconfirming data point inside the “broad-based M&A boom” story. Bull: the Campbell Lutyens acquisition and strong asset-management inflows diversify away from lumpy advisory fees. Base: asset management offsets softer advisory results. Bear: Financial Advisory revenue actually fell year over year while every larger peer posted a record, a genuine share-loss signal worth tracking, not dismissing. Watch: whether Financial Advisory revenue stabilizes or keeps lagging peers.
Moelis & Company (MC) - the second disconfirming data point. Bull: record revenue and a full hiring pipeline show the recovery reaches smaller boutiques too. Base: modest, below-peer growth continues. Bear: growth badly lagging Evercore in the same cycle, plus a missed earnings estimate, suggests the recovery is concentrated in the largest houses rather than broad-based, a fragility for the sector story, not just for this one stock. Watch: year-over-year fee growth relative to Evercore’s.
BlackRock (BLK) - the mirror Goldman’s own re-rating leans on, for better and worse. Bull:* scale in both passive and alternatives investing keeps compounding regardless of what the capital-markets cycle does. Base: steady asset and fee growth tracking broad market levels. Bear: even the best fee-based annuity in the business shrinks when the market it is priced against falls, which undercuts the idea that any wealth-management arm, including Goldman’s growing one, makes a firm fully drawdown-proof. Watch: organic base-fee growth and net inflows in a weaker market quarter.
Risk controls
The single largest risk sitting inside this stock is concentration risk dressed up as diversification progress: roughly three-quarters of revenue still depends on the health of capital markets and the willingness of corporate boards to do deals, and that share actually rose, rather than fell, in the most recent quarter, even as the market has been paying an increasing premium for the story that this dependence is shrinking. A reader holding or considering this stock should size the position with that cyclicality in mind, not with the multiple that is currently being paid for a lower-cyclicality story that has not yet arrived in the numbers.
The second risk is valuation risk layered directly on top of the first: paying close to three times tangible book value, near the top of the stock’s own ten-year range, for earnings that are themselves running at a cyclical high, is a double bet, not a single one, and the double de-rate math above shows what happens if both halves of that bet unwind together rather than separately. A reader should have a clear view of what they think Asset & Wealth Management’s return on equity actually does over the next several years, since that single number is doing more work in justifying today’s price than any other figure in this article.
The third risk is capital-cushion risk: the buffer above Goldman’s regulatory minimum thinned from roughly 340 basis points to roughly 110 in a single quarter, which caps how much the buyback program, the tool that has been supporting the stock’s return profile, can keep doing if risk-weighted assets keep growing or if the next stress-test reset comes in tougher than expected. This is a live, disclosed constraint in Goldman’s own filings, not a hypothetical.
The fourth is a live external trigger, and it is already unfolding: stress in the private-credit market, visible today in fund redemption gates and rising default-rate estimates, is the most concrete near-term mechanism by which a broader downturn could actually arrive, since it would hit both the dealmaking side (by freezing sponsor financing) and the trading side (by widening credit spreads) of Goldman’s business at the same time.
Liquidity and access are not meaningful risks here: this is a large, heavily traded stock with modest short interest and no crowded-trade dynamics in either direction, so a reader’s risk here is thesis risk, not execution risk. What would most change this thesis for the better is Asset & Wealth Management’s return on equity closing meaningfully toward its own target while flows hold up through an actual risk-off stretch, something the current multi-year inflow streak has simply never had to prove. What would most change it for the worse is a private-credit event spreading beyond retail-distributed lending vehicles into broader credit markets while the capital cushion stays thin, the combination the bear case above describes in full.
Methodology, sourcing, and data-quality flags
This piece draws on Goldman’s audited fiscal 2025 Form 10-K (filed February 25, 2026), its first-quarter 2026 Form 10-Q (filed May 1, 2026), the associated 8-K earnings-release exhibits, the 2026 annual-meeting proxy statement (filed March 20, 2026), the Federal Reserve’s June 2026 stress-test and March 2026 Basel III capital-rulemaking releases, and each named peer’s own primary quarterly filings, cross-checked where possible against independent data vendors and press coverage. A verification pass re-fetched the primary filings behind every load-bearing figure directly and corrected several transcription errors found in an earlier research batch, all noted below.
The five-factor read. On valuation, the picture is clearly negative and the most load-bearing factor in this entire assessment: the stock trades at roughly 3.0 times tangible book value, at or above the top of its own ten-year range against a 1.17 median, and around 18.5 to 20 times trailing earnings against a roughly 13 ten-year median, on earnings that are themselves cyclically elevated. The stock sits above the consensus average analyst target, and independent screening services flag it as meaningfully overvalued. On growth, the read is real but built off a high base: 2025 net revenue rose 9%, investment-banking fees rose 21%, and assets under supervision hit a record on a 33-quarter inflow streak with a real, credible target to nearly double the alternatives business by 2030, but much of the recent growth is a cyclical recovery in dealmaking and trading that will normalize, while the durable fee engine still has to prove it can compound through an actual drawdown. On quality, the read is positive: this is a best-in-class franchise, the world’s top-ranked merger and acquisition advisor, with a 15% return on equity and 16% return on tangible equity that mark a real structural step up from the pre-2023 years, strong cash generation, and a growing dividend, tempered by an efficiency ratio still above the firm’s own target and a wealth-management return on equity still well below its own goal. On risk, the read is negative: the revenue base remains roughly three-quarters cyclical, the capital cushion has thinned sharply, the pending capital rulemaking is not yet final, the newly announced dividend increase has not yet been paid, and a live credit-market trigger sits in the headlines right now. On momentum and sentiment, a soft factor given low weight in any overall read, the tape has been strongly positive, up sharply over the trailing year and sitting above both its 50-day and 200-day moving averages in a clean uptrend, but the softer signals lean more cautious: consensus sits at Hold, the stock trades above the average price target, insiders have sold with no offsetting open-market buying (with no motive asserted, since this pattern is consistent with routine tax-withholding tied to vesting), and at least one sell-side firm has downgraded the stock specifically on valuation grounds. Weighed together, the positives in growth, quality, and momentum roughly offset the negatives in valuation and risk, and the balance tips to the cautious end: a Hold, one notch from a Reduce, where the swing factor is simply the multiple the market continues to pay.
Data-quality flags.
- The dividend is a two-step increase, and the two steps must not be conflated. The $4.00-to-$4.50 raise took effect in the first quarter of 2026 and has already been paid. The further $4.50-to-$5.00 raise was announced at the June 24, 2026 stress-test results release, takes effect for the quarter beginning July 1, 2026, and had not yet been paid as of this article’s June 30, 2026 research date, and remains subject to formal board approval at the third-quarter meeting.
- Market capitalization and share count carry a genuine, disclosed range rather than a single figure. Goldman’s own balance sheet in the first-quarter 2026 Form 10-Q shows 294.57 million shares legally outstanding, implying a market cap of roughly $298 billion at the June 30, 2026 close. Data vendors report a higher current share count, roughly 303 million to 307 million shares, closer to Goldman’s own “basic shares” denominator used in its earnings-per-share and book-value-per-share math (which includes certain unvested restricted stock units), implying a market cap closer to $308 billion to $310 billion. Both figures are reported here rather than picking one silently.
- Global Banking & Markets segment net earnings for fiscal 2025 were $13.12 billion, not $13.81 billion, a figure that appeared in an earlier draft of the underlying research and has been corrected against the primary 10-K.
- Price-to-tangible-book value and price-to-book value are related but distinct figures, and at least one upstream data source conflated them. This article uses tangible book value per share of $336.28 for the 3.0-times figure that anchors the valuation discussion, and the separate book value per share of $361.19 only for the plain price-to-book calculation of roughly 2.8 times.
- 1MDB is now more fully resolved than Goldman’s own 10-K states. The filing, dated February 25, 2026, still described the remaining private securities litigation as ongoing; by around April 2026, Goldman had agreed to a $500 million settlement of that same litigation, pending final court approval, on top of the governmental and regulatory settlements finalized years earlier. This article treats the matter as effectively resolved, with no implication of ongoing wrongdoing.
- The March 2026 Basel III capital-rulemaking proposal is exactly that, a proposal, not a final or enacted rule. Its comment period closed June 18, 2026 and a final rule was not yet in place as of this research date. The direction is trending favorable for a trading-heavy firm like Goldman, but that outcome is not locked in and could shift.
- Asset & Wealth Management’s medium-term return-on-equity and margin targets are targets, not achieved results. The segment’s actual 2025 return on equity was 12.5% and pre-tax margin 25%, both below the 17% to 19% and roughly 30% figures management has set as goals three to five years out from the end of 2025. This article is explicit throughout that the durability premium the stock’s multiple already reflects has not yet been earned in the reported numbers.
- Ten-year historical price-to-book and price-to-tangible-book ranges (the 1.17 median, the 0.61-to-2.95 range) are sourced to a single data provider (GuruFocus) and were not independently cross-checked against a second historical-multiples source; they are attributed explicitly rather than presented as a bare, universally agreed fact.
- Sell-side consensus price targets are noisy and date-sensitive across vendors. Different data providers show average targets ranging from roughly $880 to $978 depending on the pull date and how stale entries are handled; this article reports a range rather than a single precise figure, while noting the high end of $1,195 (Wells Fargo, dated June 24, 2026) as independently confirmed.
- Insider selling of roughly $110 million over the trailing three months, with no offsetting open-market buying found, is reported here as a factual, disclosed pattern, with no motive asserted. It is consistent with routine tax-withholding sales tied to restricted-stock vesting, which is common at large public companies, and this article does not claim to know whether any portion of it reflects discretionary bearish positioning by any individual insider.
- Total addressable market figures for the global investment-banking fee pool and for global alternative assets under management are sourced to secondary aggregations of industry data (for the fee pool) and to Preqin and PwC industry forecasts (for the roughly $32 trillion to $34 trillion 2030 alternatives figure), not to a primary release fetched directly for this piece, and are presented as attributed estimates rather than settled facts.
Key sources: The Goldman Sachs Group, Inc. Form 10-K for fiscal year 2025 (filed February 25, 2026, SEC EDGAR); Form 10-Q for the quarter ended March 31, 2026 (filed May 1, 2026, SEC EDGAR); 8-K earnings-release exhibits for fourth-quarter/full-year 2025 and first-quarter 2026; the 2026 annual-meeting proxy statement (DEF 14A, filed March 20, 2026); the Federal Reserve’s June 2026 CCAR stress-test results and March 19, 2026 Basel III endgame re-proposal press release; Morgan Stanley, JPMorgan Chase, Bank of America, Evercore, Lazard, Moelis & Company, and BlackRock primary quarterly earnings releases; stockanalysis.com and GuruFocus for market data and historical multiples; Marketbeat and stockanalysis.com for sell-side consensus estimates; LSEG-sourced merger-and-acquisition league-table data as reported across multiple press outlets; and Glassdoor for employee-sentiment data.
Structured data (JSON-LD)
{
  "@context": "https://schema.org",
  "@type": "BlogPosting",
  "headline": "Goldman Sachs (GS): 6-Month to 5-Year Outlook – Peak Multiples Meet Peak Earnings",
  "description": "Deep research on GS: bull/base/bear scenarios across 6 months, 1 year, 3 years, and 5 years; a ~3.0x tangible book multiple on cyclically inflated earnings; the wealth-pivot durability case unproven yet.",
  "author": {
    "@type": "Organization",
    "name": "marketsupplychain.com"
  },
  "datePublished": "2026-07-01",
  "dateModified": "2026-07-01",
  "image": "https://marketsupplychain.com/og/gs-og.png"
}
{
  "@context": "https://schema.org",
  "@type": "FAQPage",
  "mainEntity": [
    {
      "@type": "Question",
      "name": "What is the 6-month outlook for Goldman Sachs (GS) stock?",
      "acceptedAnswer": {
        "@type": "Answer",
        "text": "The base case for 6 months (~$1,000-$1,050) is the stock drifting roughly flat to a little higher, as in-line Q2/Q3 results and the first payment of the $5.00 dividend meet an already-full valuation. The bull case (around $1,140) is another strong trading and dealmaking quarter. The bear case (around $850) is a soft print or widening private-credit stress that starts the de-rating early."
      }
    },
    {
      "@type": "Question",
      "name": "What is the 1-year forecast for Goldman Sachs stock price?",
      "acceptedAnswer": {
        "@type": "Answer",
        "text": "The base case for 1 year (~$1,070) assumes the cycle holds and earnings stay near current peaks, but the multiple does not expand further, so returns are mostly the dividend. The bull case (~$1,230) has deal backlog converting into fees and Basel III landing favorably. The bear case (~$780) is cyclical rollover beginning in earnest, with the multiple giving back its recent gains."
      }
    },
    {
      "@type": "Question",
      "name": "What is the 3-year price forecast for Goldman Sachs (GS)?",
      "acceptedAnswer": {
        "@type": "Answer",
        "text": "The base case for 3 years (~$1,120) has Asset & Wealth Management's returns grinding toward the mid-teens, partly earning the current premium, while the valuation multiple gives back some recent expansion. The bull case (~$1,380) has the wealth arm hitting its high-teens return target. The bear case (~$680) reflects a double de-rate if the durability premium is never earned."
      }
    },
    {
      "@type": "Question",
      "name": "What is the 5-year outlook for Goldman Sachs stock?",
      "acceptedAnswer": {
        "@type": "Answer",
        "text": "The base case for 5 years (~$1,200) is a firm earning its mid-teens through-cycle target, having half-earned the re-rating already, compounding at modest single-digit rates plus the dividend. The bull case (~$1,550) is the wealth annuity fully built with per-share earnings in the $70s-$80s. The bear case (~$620) is market re-rating Goldman back toward its historical trading-house multiple if cyclicality proves durability was never earned."
      }
    }
  ]
}
Prepared July 1, 2026. Figures are point-in-time and will change. This is research and analysis for educational purposes, not investment advice, not a recommendation, and not a solicitation. Bank and broker-dealer stocks carry cyclical, regulatory, and capital-markets risk that can move a name like this sharply in either direction inside a single quarter. Verify all figures independently and consult a licensed financial advisor before making any decision.