
Research date: July 1, 2026 | OSINT market research on Netflix, Inc. (NFLX, Nasdaq), the world’s largest paid video-streaming service, in the middle of the worst year for its stock since the 2022 subscriber-loss crisis even as its underlying numbers keep improving. The most recent reported quarter is Q1 2026 (filed April 17, 2026); the FY2025 10-K was filed January 23, 2026. Q2 2026 results are due July 16, 2026 and are not yet out. All share and per-share figures reflect Netflix’s 10-for-1 forward stock split completed November 14, 2025.
Important disclaimer. This is OSINT-based research and educational analysis, not investment advice. I am not a financial advisor. Nothing here is a recommendation to buy or sell any security, and the scenarios below are illustrative, not price targets. Netflix is a high-beta, single-line-of-business stock (beta around 1.5) that has fallen roughly 45 percent from its mid-2025 all-time high on the back of two failed acquisitions, a leadership transition, and an unresolved proposed US tariff on foreign-produced film content that a Citi analyst estimates could cost the company up to $3 billion a year if implemented near the originally floated rate. Market caps, prices, valuation multiples, and analyst estimates are point-in-time (July 1, 2026), sourced from data vendors that sometimes disagree with each other, and move fast. Do your own due diligence and consult a licensed advisor.
Where this stock could be in 6 months, 1 year, 3 years, and 5 years
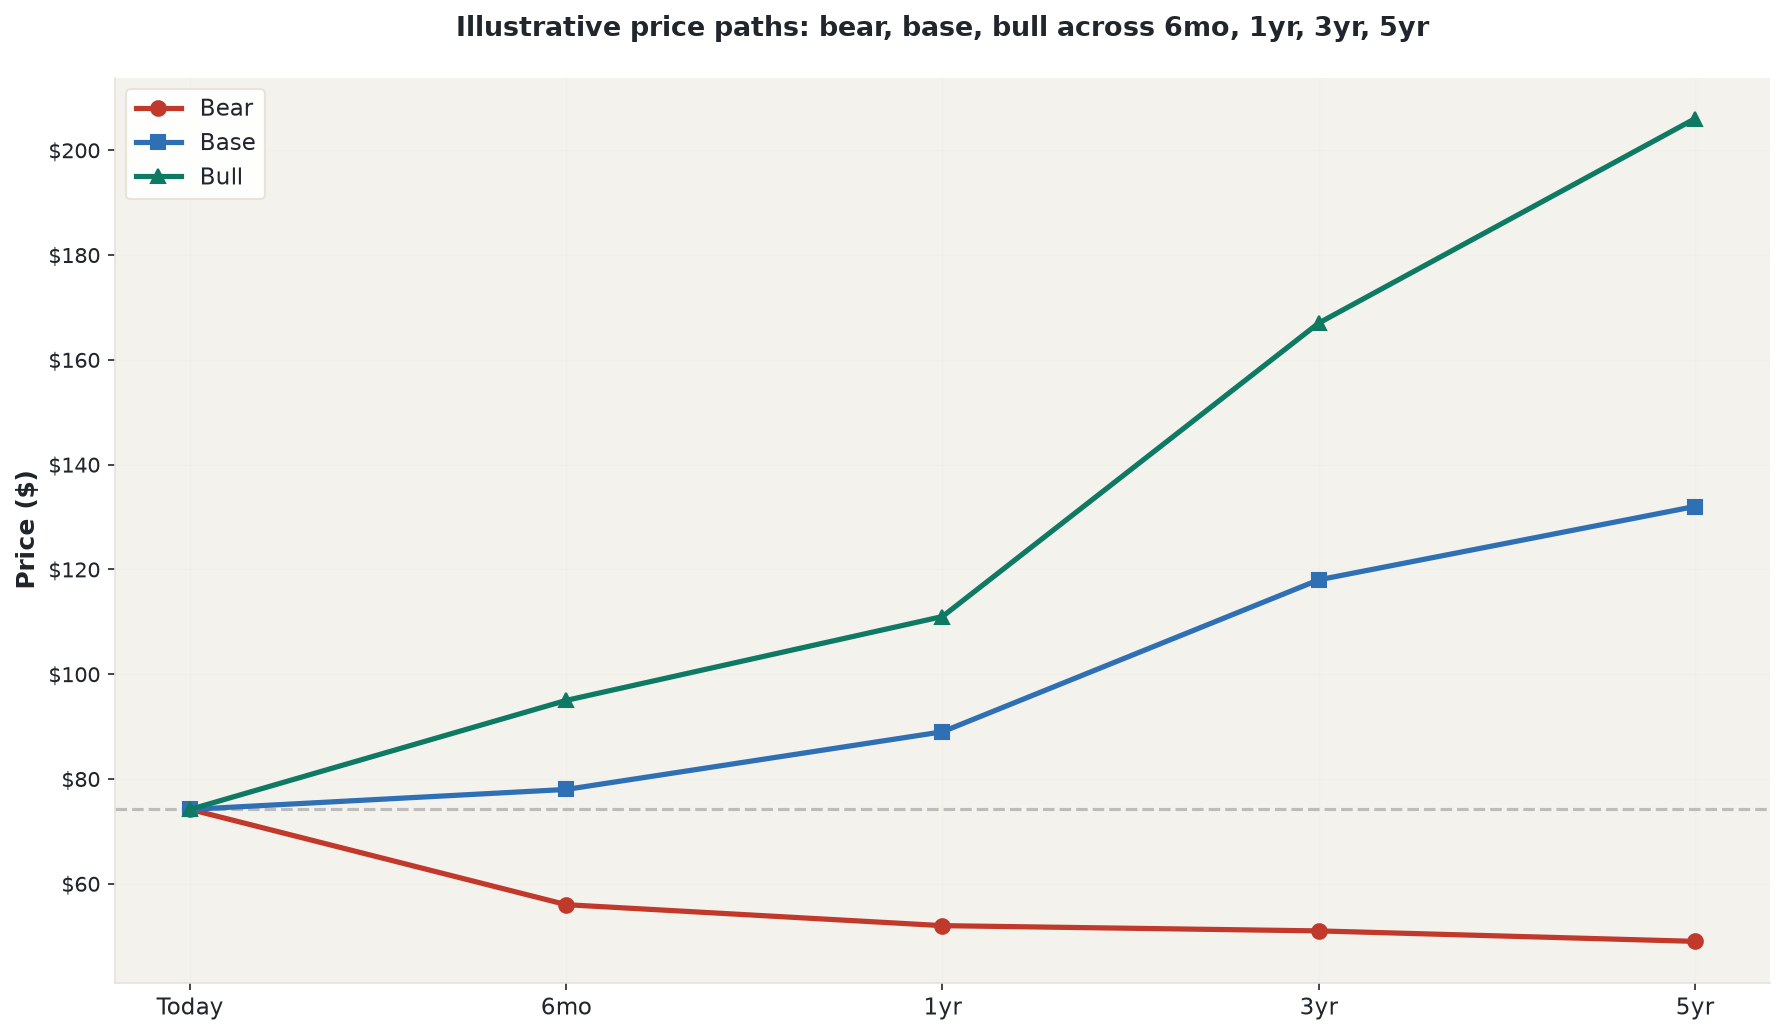
Every dollar range below comes from a stated earnings assumption for that horizon multiplied by a stated exit multiple, net of the buybacks Netflix is already funding. None of it is a price target, and none of it is something to trade on. The stock closed at $74.19 on July 1, 2026, a few dollars above the 52-week low of $70.86 it printed six days earlier and roughly 45 percent below the all-time high near $134 it touched almost exactly a year before that. The quote above is the current number; the figure here is a dated anchor for the math below.
6 months (into early 2027). This window turns on two earnings prints, Q2 on July 16 and Q3 in October, and on whether the proposed foreign-film tariff moves from a headline into an actual policy. In the base case, Netflix delivers roughly what it has already guided for Q2 ($12.6 billion in revenue, a 32.6 percent operating margin) and the ad business keeps tracking toward its $3 billion 2026 target, letting the stock begin a modest re-rating from its depressed forward multiple of roughly 20x toward the low 20s, landing near $78. The bull case, near $95, needs clean beats on both quarters and no tariff news, restoring some confidence in double-digit growth. The bear case, near $56, is a Q2 margin miss, a concrete tariff executive order, or the first visible sign of churn following the March 2026 US price increase. The single thing most likely to flip this window: whether Q2 ad-revenue growth confirms the doubling-to-$3 billion pace or falls short of it.
1 year (mid-2027). By this point FY2026 is fully reported, FY2027 guidance is in hand, and the shape of the newly combined Paramount Skydance-Warner Bros. Discovery entity is becoming visible in its first reported quarters. In the base case, FY2026 lands near the $51 billion midpoint of guidance at a 31.5 percent margin, FY2027 is guided at roughly 10 percent growth, and the stock trades around $89 on a forward multiple near 23x. The bull case, near $111, needs FY2026 at the high end, FY2027 guidance above 12 percent, and the ad business on a $5 billion-plus annualized run rate. The bear case, near $52, plays out if revenue growth breaks below 10 percent, the tariff is implemented, and the merged Paramount-WBD entity starts bidding aggressively for content and sports rights. The key swing variable: FY2027 revenue-growth guidance above 12 percent favors the bull, below 8 percent favors the bear.
3 years (2029). The structural drivers take over here. In the base case, Netflix is generating $62-66 billion in revenue, operating margin has expanded into the 33 percent range, the ad business is contributing $5-6 billion, roughly 10 percent of the share count has been retired through buybacks, and the stock trades near $118 on a P/E around 24x, reflecting a mature, high-quality franchise rather than a hyper-growth story. The bull case, near $167, has the ad business tracking toward its 2030 target of $9 billion ahead of schedule, margin reaching 35 percent-plus, and the multiple re-rating to roughly 28x as the market treats Netflix as a durable entertainment utility. The bear case, near $51, is the content arms race reigniting in earnest, the tariff adding $1-3 billion in annual costs, and growth stalling at 3-5 percent as the stock is repriced at 16x, the multiple of maturing media. The key flip: whether the Paramount-WBD integration produces a genuine pricing-and-content competitor or stumbles the way most media megamergers historically have.
5 years (2031). At this horizon the question is durability, not any single quarter. The base case has Netflix as a $72 billion-revenue franchise growing in the high single digits, 34 percent margins, cumulative buybacks down roughly 15 percent of the share count, EPS approaching $5.75, and a stock near $132 at a 23x multiple. The bull case, near $206, is a $77 billion-plus revenue entertainment utility with 37 percent margins, an $8-9 billion-plus ad business, and a 28x-30x multiple that recognizes Netflix as the dominant, durably profitable platform in a consolidating industry. The bear case, near $49, is the skeptic’s endgame: Netflix repriced as a slow-growth media company at 15x on depressed EPS near $3.26, having lost the content-cost discipline of the last three years to a reignited spending war and a tariff that never got resolved in Netflix’s favor. The key flip: whether the ad-revenue ramp to $9 billion by 2030 proves achievable, or plateaus at $4-5 billion as YouTube and connected-TV rivals keep the dominant share of ad budgets.
Where the read lands today. On balance, the lean is Hold. Margins have expanded for three straight fiscal years, the balance sheet is the strongest it has been in years, and the stock trades near the bottom of its own five-year valuation range even as revenue keeps growing in the double digits. Set against that: growth is visibly decelerating, the company has stopped disclosing the subscriber count that used to anchor the growth story, two consecutive acquisition attempts failed in the same year, and a real, unresolved tariff risk sits over the whole international content pipeline. The quality is genuine and the price is not demanding, but the risk and the momentum are working against it in roughly equal measure to the case for value. What would move this: a resolved tariff question, a Q2 or Q3 beat that reverses the momentum, or the first hard evidence that the March 2026 price increase produced churn survey data has warned about but realized numbers have not yet shown.
Companion tool
Jump to the interactive dashboard to sort and filter NFLX against its streaming and media peer set across valuation, growth, quality, risk, and momentum, or download the Excel model to flex the bull, base, and bear scenarios with your own revenue and margin assumptions.
TL;DR
Netflix’s stock is down roughly 45 percent from its mid-2025 peak while its business, on the numbers that matter most, has gotten better every quarter along the way: operating margin hit a company-record 32.3 percent in Q1 2026, up from 20.6 percent just three years earlier, free cash flow guidance was raised to about $12.5 billion for 2026, and the fast-growing ad tier crossed 250 million monthly viewers on its way to a guided doubling of ad revenue to roughly $3 billion this year. The gap between the stock price and the fundamentals exists because 2026 has been a year of headline damage rather than operating damage: Netflix lost a bidding war for Warner Bros. Discovery to Paramount Skydance (walking away with a $2.8 billion breakup fee rather than overpaying), lost a separate bidding war for Roku to Fox, and watched co-founder Reed Hastings step down from the board, all while revenue growth decelerated from 16 percent to a guided 12-14 percent and the company stopped disclosing the subscriber count that had anchored its growth narrative for a decade. None of that is nothing. A newly combined Paramount-WBD entity is, for the first time, a scale-comparable rival with a deep IP catalog; a proposed 100 percent US tariff on foreign-produced films remains unresolved and could cost an estimated $3 billion a year if implemented near the rate first floated; and Deloitte survey data suggests the subscription-fatigue ceiling is closer than Netflix’s own benign churn numbers currently show. What the read comes down to is whether a company trading near the bottom of its own five-year valuation range, with margins still expanding and a second high-margin revenue stream still in its early innings, is being fairly priced for that basket of risks or is being punished for headlines that will fade once the next two quarters print.
Explore it yourself: the interactive dashboard
What Netflix actually is today
Strip away the M&A headlines and Netflix is a single business doing one thing at enormous scale: it sells access to a library of film and television content, mostly on a recurring monthly basis, to more than 325 million paying households across roughly 190 countries. Netflix reports itself in its own 10-K as a single reportable operating segment - there is no division between “streaming” and something else, no separate studio segment, no cable-network legacy business dragging on the numbers the way there is at Disney, Comcast, or Paramount Skydance. That simplicity is itself a competitive fact: Netflix’s entire cost structure and management attention point at one product.
The revenue comes from two pools. The larger and older pool is subscription fees, still the overwhelming majority of the roughly $45.2 billion Netflix took in during fiscal 2025. The smaller and much faster-growing pool is advertising, sold against the audience on Netflix’s ad-supported tier, which crossed more than 4,000 advertisers in the first quarter of 2026 and is guided to roughly double in revenue this year to about $3 billion. The mechanism behind that doubling is a mix of three things moving together: more advertisers buying into the platform as it proves out (up from a much smaller base a year earlier), rising CPMs (the price paid per thousand ad impressions) as Netflix’s own measurement and targeting tools mature and buyers gain confidence in the audience data, and a still-light ad load of roughly four to five minutes per hour that Netflix has room to raise gradually without matching traditional television’s ad density. None of the three requires a dramatic change in viewer behavior, which is part of why management treats the ad tier as a multi-year ramp rather than a one-time step change. Layered thinly on top are live events (boxing, WWE, NFL games), a small consumer-products business, and an early-stage cloud gaming push, none of which registers as a meaningful revenue line yet but each of which is aimed at the same goal: keeping a household’s attention long enough that it never has a reason to cancel.
Two structural facts explain almost everything else in this article. First, Netflix stopped disclosing its quarterly subscriber count after the Q4 2025 shareholder letter, which put the number at more than 325 million paid memberships. Every “current” subscriber figure a reader sees quoted for mid-2026 is either that stale milestone or a third-party estimate, not a fresh company disclosure, and the article treats it that way throughout. Second, the content library that anchors the whole business is a decade-plus of accumulated production and licensing spend, roughly $20 billion guided for cash content spend in 2026 alone, that behaves economically almost like a fixed cost: once a title exists, the cost of one more household watching it is close to zero. That single fact, more than any single competitive advantage, is why Netflix’s operating margin has expanded every year for three straight years and why the unit economics of this business look more like software than like a traditional studio.
How the money flows
flowchart TD
    SUB["Subscribers: 325M+ paid memberships, $12.25B Q1 2026 revenue"]
    AD["Advertisers: ~$3B 2026 ad revenue guide, 250M+ ad-tier viewers"]
    SUB --> NFLXCO["Netflix Inc: direct-billed, no distributor cut"]
    AD --> ADTECH["Ad-tech partners: Trade Desk, Google DV360, Magnite, Amazon DSP"]
    ADTECH --> NFLXCO
    NFLXCO --> CONTENT["Content budget: ~$20B guided 2026 cash spend"]
    CONTENT --> OWNED["Owned originals: Netflix Studios production hubs"]
    CONTENT --> LICENSED["Licensed libraries: WBD, NBCU, Sony, Paramount (WBD bid lost, $2.8B fee received)"]
    CONTENT --> SPORTS["Live rights: NFL ~$75M/game, WWE Raw $5B/10yr"]
    OWNED --> TALENT["Talent & crews: SAG-AFTRA / WGA / DGA agreements"]
    LICENSED --> STUDIOS["Legacy studio owners: consolidating (Paramount Skydance + WBD)"]
    SPORTS --> LEAGUES["Leagues: NFL, WWE hold monopoly game rights"]
    NFLXCO --> INFRA["Infrastructure spend"]
    INFRA --> AWS["AWS backend: ~$1B/yr, ~4% of revenue"]
    INFRA --> OC["Open Connect CDN: Netflix-owned, carries the large majority of video traffic"]
    OC --> ISP["ISPs: host free Netflix caching appliances"]
    NFLXCO --> DIST["Distribution to screens"]
    DIST --> OEM["Smart TV OEMs: Samsung, LG, Roku, Fire TV, Vizio"]
    DIST --> STORES["App stores: Apple, Google - 15-30% toll avoided via direct billing"]
Read this top to bottom. Money enters at the top from two separate pools: subscribers who pay Netflix directly (no distributor, no cable operator, no affiliate fee sitting between the household and the company) and advertisers who pay for access to the audience on the ad-supported tier, routed through a shrinking set of ad-tech intermediaries as Netflix builds its own ad-serving stack to keep more of that dollar in-house over time. All of that revenue lands in one place, because Netflix runs as a single segment, and from there it is deployed downward into two large cost buckets.
The larger bucket is content: roughly $20 billion in guided 2026 cash spend split between wholly owned productions made through Netflix’s own studios, licensed output deals with legacy studios, and a newer, pricier layer of live sports and events bought to defend engagement and sell unskippable ad inventory around live programming. Content dollars flow onward to talent under SAG-AFTRA, WGA, and DGA agreements, to production and VFX vendors, and to rights-holders like the NFL and WWE, who hold monopoly rights over their own live events and can charge accordingly.
The second bucket is the infrastructure that gets a stream onto a screen. Netflix built and owns its own content-delivery network, Open Connect, which places Netflix-owned caching appliances for free inside internet service provider data centers, carrying the large majority of Netflix’s video traffic without the fees a company renting third-party CDN capacity would pay. AWS handles the backend, compute, encoding, recommendations, at roughly $1 billion a year, about 4 percent of revenue. Distribution to the living room runs through device makers, Samsung, LG, Roku, Amazon Fire TV, Vizio, Apple, Google, but Netflix avoids the standard 15-30 percent app-store toll most subscription apps pay by declining to offer in-app purchase on iOS or Android, billing subscribers directly instead.
The single biggest structural event of the past year was not a supplier deal, it was a failed acquisition. Netflix bid roughly $82-83 billion for Warner Bros. Discovery’s streaming and studio business to buy a large, owned content library outright rather than keep licensing pieces of it, but was outbid by Paramount Skydance’s roughly $110.9 billion all-cash offer. WBD paid Netflix a $2.8 billion termination fee, which Netflix promptly redirected into a fresh $25 billion share-buyback authorization. That episode is a live illustration of the chokepoint sitting at the top of Netflix’s content-input market: there are only a handful of libraries and studios large enough to matter, and as they consolidate around each other, Netflix’s own leverage over which one it can license from, or buy outright, narrows even as its own production scale reduces how dependent it is on any single one of them.
The moat, and where it is being tested
Think of Netflix’s competitive position less like a wall and more like a toll booth on a road most viewers already choose to drive down. The moat rests on four things that reinforce each other: the largest and best-funded content slate in the industry, the lowest subscriber churn among major streamers (roughly 2 percent a month, versus roughly 3 percent at Disney+ and 4 percent at Hulu), a distribution cost structure that no rival can cheaply replicate because Netflix owns its own delivery network instead of renting one, and a decade-plus of viewing history and personalization data that keeps recommendations sharper than a newer entrant’s could be. Netflix has said in years past that a large majority of what members watch is discovered through its personalization system, though that specific figure traces back to company statements from around 2016 and has not been recently reconfirmed, so it should be read as a long-standing directional claim rather than a current, audited statistic.
That moat is real, but it is narrower than a simple subscriber count suggests, and it is being tested from two directions at once. The first is attention share rather than subscriber share: Nielsen’s Gauge measure of total US television viewing time puts YouTube, not Netflix, in first place, with roughly 12.5-13.5 percent of all US TV screen time in early 2026 against Netflix’s 8.8-9.0 percent. Put in the more relevant context, streaming as a whole is 47.5 percent of all US TV viewing time, so Netflix’s roughly 9 percent of total TV works out to close to 19 percent of streaming viewing time specifically, a strong number two behind YouTube’s share of streaming, well ahead of Hulu, Disney+, and every other direct-to-consumer competitor. Netflix leads decisively on paid subscription revenue and on profitability within streaming. It simply does not lead on where people’s eyeballs go across the whole television screen, because YouTube’s free, algorithmically infinite, creator-supplied content is not something Netflix’s content budget, however large, can outspend: YouTube’s marginal cost of adding another hour of video is close to zero and paid by nobody but the platform’s own ad business.
The second test is a genuinely new one: for the first time since the streaming wars began, Netflix faces a scale-comparable single rival. Paramount Skydance’s roughly $110.9 billion all-cash acquisition of Warner Bros. Discovery, the same asset Netflix tried and failed to buy, cleared its final regulatory hurdle (Department of Justice antitrust clearance) on June 12, 2026, and creates a combined entity that deal-model estimates put at roughly $70 billion in annual revenue, roughly $16 billion in EBITDA, and around 207 million combined streaming subscribers across HBO Max and Paramount+, deploying an IP catalog spanning HBO, DC, Harry Potter, Mission Impossible, Top Gun, and CBS’s library. Those figures are pre-close, company-issued projections rather than a reported combined financial statement, so treat them as directional rather than exact until the merged company reports its first full quarter. But directionally, the picture is clear: Netflix now has a rival with the IP depth and financial scale to fight for content, talent, and sports rights in a way no single pre-merger competitor could, at exactly the moment Netflix’s own margin story depends on the content-spending arms race of 2018-2021 staying over rather than reigniting.
Company by company: Netflix and the names it is valued against
Netflix (NFLX, Nasdaq). Market cap roughly $300-312 billion (vendor estimates cluster around $309.4 billion) as of July 1, 2026, at a $74.19 share price. The bull case: a scale leader with the deepest content flywheel in the industry, an expanding ad tier, live-event optionality, and an operating margin still climbing toward its own 31.5 percent 2026 target from a starting point that was already a company record. The bear case: the stock is down roughly 45 percent over the past year and trades on the promise of continued margin expansion even as the password-sharing tailwind laps, content costs stay elevated in absolute dollars, and a newly scaled competitor emerges from the very deal Netflix tried and failed to win.
Disney (DIS, NYSE). Market cap roughly $168.4 billion. Disney+/Hulu/ESPN+ direct-to-consumer streaming turned a real corner in fiscal Q2 2026 (quarter ended around March 2026): revenue of $25.17 billion, up 7 percent year over year, with DTC operating income up 88 percent to $582 million on the back of fall-2025 price increases. The bull case: streaming has flipped from cash-burn to a fast-growing profit center while theme parks and the ESPN sports flagship still anchor cash flow. The bear case: linear cable networks keep shrinking, and DTC profit, while improving fast, is still a small fraction of what the old linear-TV business used to throw off.
Warner Bros. Discovery (WBD, Nasdaq). Market cap roughly $67 billion, trading below the pending $31.00-a-share cash deal price of roughly $110.9 billion from Paramount Skydance. WBD shareholders approved the deal April 23, 2026 and it is expected to close in the third quarter of 2026 pending remaining regulatory clearances. This is now a merger-arbitrage position, not a standalone streaming holding: the bull case is a locked-in cash outcome plus a quarterly ticking fee if the close slips past September 30, 2026; the bear case is that any remaining regulatory hurdle causes the deal to break, which would be a severe negative catalyst for the stock.
Comcast (CMCSA, Nasdaq). Market cap roughly $87.7 billion. Q1 2026 revenue of $31.46 billion. Peacock added 2 million net subscribers to reach 46 million, with revenue up more than 70 percent year over year, but the segment still posted a $432 million EBITDA loss for the quarter. The bull case: Peacock’s growth is finally outrunning its losses inside a parent still generating steady broadband and wireless cash flow. The bear case: Peacock remains the smallest, least profitable major streamer, and Comcast’s core broadband subscriber base is shrinking under wireless and fiber competition, a big reason the stock trades at just 4.6x trailing earnings.
Paramount Skydance (PSKY, Nasdaq). Market cap roughly $10.8 billion, tiny next to the roughly $110.9 billion all-cash bill it is taking on to acquire WBD. Q1 2026 revenue of $7.3 billion, up 2 percent, with adjusted EBITDA up 59 percent to $1.16 billion; Paramount+ revenue grew 17 percent to $1.97 billion on a 14 percent gain in average revenue per user after a January price increase, ending the quarter at 79.6 million subscribers. The bull case: the WBD acquisition creates a scaled, vertically integrated studio-and-streaming rival to Netflix and Disney, with real margin improvement already showing up on its own. The bear case: a $10.8 billion market-cap company absorbing a roughly $110.9 billion acquisition implies heavy new debt and real integration risk, and this is the most leveraged bet in the comparison set.
Amazon (AMZN, Nasdaq). Market cap roughly $2.5 trillion. Prime Video reached roughly 315 million global viewers as of the fourth quarter of 2025 and is bundled into Prime membership rather than reported as a standalone business; Amazon’s total advertising revenue, of which Prime Video is one contributor among several, was $11.8 billion in Q1 2026, up 24 percent year over year. The bull case: the largest ad-supported streaming reach in the world by default distribution through Prime, monetized inside a far larger, highly profitable cloud and advertising business. The bear case: Prime Video’s standalone economics are simply not disclosed, so investors get no visibility into whether it is a profit center or a loss-leading retention tool. For a deeper look at Amazon’s ad-tech and streaming strategy, see the Amazon deep dive.
Roku (ROKU, Nasdaq). Market cap roughly $17.2 billion. Q1 2026 revenue of $1.248 billion, up 22 percent, with net income flipping to $85.7 million from a loss a year earlier. On June 15, 2026, Roku agreed to be acquired by Fox Corporation for roughly $22 billion, or $160 a share in cash and stock, a deal Netflix itself had reportedly pursued and lost, with Roku’s board said to have favored Fox partly on antitrust grounds given Netflix’s position as a rival streaming service distributed on Roku’s own platform. The bull case was a newly and durably profitable ad-and-platform business sitting on the largest US streaming-device install base; that bull case is now largely superseded by the pending Fox deal, making Roku a merger-arbitrage position rather than a standalone streaming-growth story.
Spotify (SPOT, NYSE). Market cap roughly $94-95 billion. Not a video competitor, but the closest analog to Netflix’s subscription-plus-advertising model in a different medium: Q1 2026 revenue of EUR4.533 billion, up 8 percent, with operating margin at a record 15.8 percent and premium subscribers up 9 percent to 293 million. The bull case: Spotify’s structurally improving margins are a template for what a mature subscription-and-ads platform can look like at scale. The bear case: premium subscriber growth is decelerating in mature markets like North America, and the stock trades on continued margin execution with little room for a guidance miss.
What the filings say: financials from the 10-K and 10-Q
Netflix’s FY2025 revenue was $45,183.0 million, up 15.9 percent from FY2024’s $39,001.0 million, which itself was up 15.6 percent from FY2023’s $33,723.3 million. Growth has held in the mid-teens for three straight years even as the revenue base has grown substantially larger, which is itself notable: most businesses see growth rates decay mechanically as the base grows, and Netflix’s has not, at least not yet.
Margins have expanded every one of those same three years. Gross margin ran roughly 48.5 percent in FY2025 (cost of revenues, mostly content amortization, of $23,275.3 million). Operating margin reached 29.5 percent in FY2025 (operating income of $13,326.6 million), up from 26.7 percent in FY2024 and 20.6 percent in FY2023. Net margin reached 24.3 percent in FY2025 (net income of $10,981.2 million), up from 22.3 percent and 16.0 percent in the prior two years. Diluted EPS was $2.53 for FY2025, versus $1.98 in FY2024 and $1.20 in FY2023, all restated for the 10-for-1 forward stock split completed November 14, 2025.
The most recent quarter, Q1 2026 (ended March 31, 2026), needs a specific caveat. Revenue was $12,249.8 million, up 16.2 percent year over year (14 percent on a currency-neutral basis), and operating income was $3,957.0 million, a 32.3 percent operating margin, a company record and up from 31.7 percent in Q1 2025. But net income of $5,282.8 million, a 43.1 percent net margin, is not comparable to any other quarter: it includes a one-time $2.8 billion cash termination fee Netflix received when its Warner Bros. Discovery acquisition fell through, booked below the operating line in “interest and other income.” Strip that fee out and the underlying net margin runs closer to the low 20s percent, consistent with the FY2025 trend. Treating the 43 percent headline net margin as a run-rate figure is the single easiest mistake a reader could make screening this stock on trailing net income alone.
Netflix discloses itself as a single reportable operating segment, so there is no segment-level profit breakout, only revenue by region. FY2025 regional revenue: UCAN (US and Canada) $19,957.2 million, up 15 percent; EMEA $14,514.6 million, up 17 percent; LATAM $5,357.5 million, up 11 percent; APAC $5,353.7 million, up 21 percent, the fastest of the four. UCAN remains the single largest region by dollars at 44 percent of revenue, but EMEA and APAC are growing fastest on a percentage basis. Because Netflix reports only one segment, the filings cannot answer “what drives profit by region,” only “what drives revenue mix by region.” Notably, Netflix discontinued reporting subscriber counts and average revenue per membership entirely during FY2025, guiding now only on revenue and operating margin, with engagement (hours watched) offered as a qualitative satisfaction proxy. Management’s stated rationale, given when the change was first flagged in early 2025, is that the business has matured past the point where a single subscriber number tells the whole story: with multiple price tiers, ad-supported and ad-free plans, and per-title live events all layered into one subscription base, Netflix argues that revenue and operating margin now capture engagement and monetization more completely than a raw headcount does. Spotify made a similar argument when it de-emphasized certain granular subscriber breakdowns as its own ad-and-subscription mix matured, so the shift is not unique to Netflix. Critics read it differently: dropping the one metric that most directly signals whether growth is decelerating, right as growth was in fact decelerating from 16 percent to a guided 12-14 percent, is also convenient for a management team that no longer wants a single headline number available for the market to mark down every quarter. Both readings can be true at once, and a reader has no way to fully resolve which one dominates without the disclosure Netflix has chosen to stop providing. The company’s own framing, from its Q1 2026 shareholder letter, is that it has penetrated under 45 percent of its estimated addressable broadband-household base and captures roughly 5 percent of global television view share, figures that are company estimates rather than audited metrics.
Cash generation has strengthened alongside margin. FY2025 operating cash flow was $10,149.3 million, up from $7,361.4 million in FY2024 and $7,274.3 million in FY2023. Capital expenditure (property and equipment) was just $688.2 million for the year, implying free cash flow of roughly $9,461.1 million, a figure derived by subtracting capex from operating cash flow rather than a single number Netflix states verbatim in the 10-K, though it ties closely to the sum of Netflix’s own quarterly free-cash-flow disclosures in shareholder letters. As of December 31, 2025, Netflix held cash plus short-term investments of $9,062.4 million against total debt of $14,462.8 million (net debt of roughly $5.4 billion), with debt laddered from 2026 out to 2054 at fixed coupons of 3.0 percent to 6.375 percent and no near-term maturity wall; only $1.69 billion of principal and interest is due over the next twelve months. Content obligations are the larger liquidity item: $24,039.2 million in total contractual content commitments, of which $11,528.0 million is due within twelve months, plus $18.4 billion sitting off the balance sheet as unrecognized future-title commitments and an estimated additional $1-4 billion of “unknown future title” obligations over the next three years. By the end of Q1 2026, the balance sheet had flipped meaningfully healthier: cash plus short-term investments rose to $12,288.5 million and net debt fell to roughly $2.07 billion, driven almost entirely by the $2.8 billion WBD termination fee received in cash on February 27, 2026.
Netflix’s board has authorized a combined $25 billion of buybacks with no expiration under two prior authorizations ($10 billion in September 2023, $15 billion in December 2024); FY2025 saw $9.1 billion actually repurchased (86,536,215 shares), leaving $8.0 billion of that prior authorization unused at year-end and roughly $6.8 billion remaining as of March 31, 2026. On April 22, 2026, the board approved a separate, new $25 billion authorization on top of what remained, confirmed by SEC 8-K filing, meaning total repurchase capacity as of that date was roughly $31.8 billion. Netflix has never paid a dividend and states it does not anticipate paying one. Diluted weighted-average shares have shrunk every year despite $368.4 million of stock-based compensation expense in FY2025: from 4,494,966 thousand shares in FY2023, to 4,392,608 thousand in FY2024, to 4,343,863 thousand in FY2025, to 4,298,437 thousand in Q1 2026, meaning buybacks are outrunning dilution. One flag worth watching: Q1 2026 buybacks slowed sharply to $1,309.3 million from $3,583.3 million in Q1 2025, which lines up with the period Netflix was carrying up to $42.2 billion of bridge and term-loan commitments to fund the (ultimately terminated) WBD acquisition, a sign of cash discipline during a pending mega-deal rather than a change in capital-return philosophy.
On guidance: management left full-year 2026 targets unchanged in the April 2026 shareholder letter at revenue of $50.7-51.7 billion (12-14 percent growth, 11-13 percent on a currency-neutral basis) and an operating margin target of 31.5 percent, up from 29.5 percent actual in 2025, driven by “continued healthy membership growth, pricing and a projected rough doubling of our ads revenue.” For Q2 2026 specifically, management guided revenue of $12,574 million (up 13.5 percent year over year, 12 percent currency-neutral), operating income of $4,105 million, and an operating margin of 32.6 percent, down from 34.1 percent in Q2 2025, because content-amortization growth is weighted toward the first half of the year on the timing of title launches; management expects the year-over-year content-amortization growth rate to decelerate to the mid-to-high single digits in the back half of 2026. Management explicitly frames all of this as its own internal forecast at the time of reporting, not a formal GAAP guidance range, and flags currency-neutral figures as non-GAAP.
On disclosed risk: the 10-K’s Item 1A states plainly that in countries where Netflix has operated for many years or is highly penetrated, membership growth is slower than in newer markets, and warns that because content costs are largely fixed, a growth slowdown could squeeze margins and liquidity if pricing and expense levers cannot keep pace. Netflix frames competition broadly, not just against other streamers but against linear television, video gaming, open content platforms, and social media, for what it calls “moments of truth” in how consumers spend their leisure time. The WBD saga is a live illustration of M&A and integration risk: Netflix’s own 10-K risk factors warned that a deal “may not be completed on the currently contemplated timeline or terms, or at all,” and disclosed Netflix’s own exposure to a termination fee of up to $5.8 billion had Netflix been the party to walk away. That risk did not materialize the way the filing anticipated; WBD walked instead, and Netflix collected a fee rather than paying one, a reminder of how quickly a disclosed contingent liability can flip from a cost to a windfall depending on how a deal actually breaks.
On ownership: per the 2026 proxy (beneficial ownership as of April 6, 2026), the largest institutional holders on file are BlackRock (308,989,260 shares, 7.34 percent) and FMR/Fidelity (222,750,326 shares, 5.29 percent). Vanguard’s position is genuinely unclear as of this writing: the proxy cites an 8.65 percent stake from a February 2024 filing, but a March 27, 2026 filing shows Vanguard’s parent entity reporting a position disaggregated to near zero following an internal corporate reorganization in how Vanguard’s affiliated funds report ownership. That is a reporting-structure change, not evidence Vanguard sold its Netflix stake, and the true current aggregate Vanguard position cannot be cleanly reconstructed from a single filing, so no current Vanguard percentage should be treated as fact. All directors and executive officers as a group hold just 1.24 percent of shares outstanding, a small stake typical of a mega-cap with broad institutional ownership. Reed Hastings sold roughly $33.2 million of stock on June 1, 2026 (332,917 shares at $85.8459 and 53,783 shares at $86.7277), a transaction that lines up with his departure from the board rather than reading as an independent bearish signal on its own. Worth noting separately: the 2026 say-on-pay advisory vote passed, but roughly 16 percent of votes cast (517.3 million of 3,178.1 million) went against management’s executive-compensation program, a higher opposition rate than is typical for a company this size and a soft signal of institutional friction with management’s pay decisions.
What the market is paying: action and valuation
Netflix closed at $74.19 on July 1, 2026, essentially at the bottom of its 52-week range of $70.86 to roughly $134, having printed a fresh 52-week low of $70.86 on June 25, just six days before this snapshot, and bounced modestly, roughly 4-5 percent, since. The scale of the decline is not in serious dispute even though the exact percentage is: data vendors cluster the one-year return between negative 42 and negative 47 percent, with one outlier estimate near negative 34 percent that could not be independently re-confirmed. What is not in dispute is the anchor point: Netflix closed within a few dollars of its all-time high near $134 almost exactly one year before this snapshot, on June 30, 2025. Year-to-date 2026 performance is similarly disputed across sources, ranging from roughly negative 12 to negative 24 percent depending on vendor and exact date; treat 2026 year-to-date as a double-digit decline of uncertain but material size rather than a single precise number.
Two failed acquisitions explain a meaningful share of the year’s damage. Netflix bid roughly $82-83 billion for Warner Bros. Discovery’s streaming and studio business but lost to Paramount Skydance’s roughly $110.9 billion all-cash offer; WBD is contractually required to pay Netflix a $2.8 billion termination fee, which flattered Netflix’s Q1 2026 reported numbers. Separately, Netflix also pursued Roku and lost that bidding war too, this time to Fox Corporation, which agreed on June 15, 2026 to acquire Roku for roughly $22 billion; Roku’s board reportedly favored Fox in part on antitrust grounds given Netflix’s position as a competing streaming service on Roku’s own platform. Shares fell on the Roku news. The practical read for the market: the two names in this comparison set with the best one-year returns, Warner Bros. Discovery (up 170.91 percent) and Roku (up 78.82 percent), are exactly the two Netflix tried and failed to buy, both trading up because they are locked-in acquisition targets, not because of organic business improvement. The market has been paying up for merger-arbitrage exposure in those names while marking Netflix down for growth-rate concerns and the optics of two failed large deals inside a single year.
Netflix’s beta is 1.52, meaningfully more volatile than the broad market, and options pricing shows an elevated implied move around the July 16 earnings date, though the exact volatility figure could not be corroborated on a second vendor and should be treated as a single-sourced estimate. This is not a calm stock: it fell from an all-time high near $134 to a 52-week low of $70.86 inside twelve months, a peak-to-trough drawdown on the order of 47 percent.
Against the S&P 500, which was up 9.1 percent year-to-date through June 30, 2026, Netflix’s double-digit decline over the same window is a gap of more than 50 percentage points against the index alone. Against named media peers over the trailing year: Disney down 8.92 percent, Comcast down 19.05 percent, Warner Bros. Discovery up 170.91 percent (merger-driven), Roku up 78.82 percent (merger-driven), Amazon up roughly 7-12 percent. Netflix is the only name in this comparison group down meaningfully across every window measured.
On valuation, trailing P/E sits at roughly 23.96-23.97x, corroborated across two vendors. Forward P/E is genuinely disputed, ranging from about 19.34x to 22.32x depending on which consensus earnings basis a given vendor uses, so treat forward P/E as “roughly 19-22x,” not a single number. EV/EBITDA of 22.18x and price-to-free-cash-flow of 26.26x are each single-sourced and should be read as approximate. Price-to-sales runs around 6.6x and price-to-book around 10.04x, both corroborated across vendors.
The standout finding sits in Netflix’s own history. The company’s five-year annual P/E band has run roughly 26.0x at the 2022 subscriber-loss trough to 52.8x at the 2021 peak, with a five-year median or average near 47x, a figure that could not be independently confirmed on a second source and should be treated cautiously. Against that backdrop, a current trailing P/E near 24x is close to the bottom of Netflix’s own five-year range, essentially back to 2022 crisis-era levels, despite revenue still growing in the double digits and margins expanding rather than contracting the way they were in 2022. Against peers, Netflix’s roughly 24x trailing P/E and 6.6x price-to-sales sit well above cable and legacy media, Comcast trades at 4.63x earnings and 0.68x sales, Disney at 15.3x earnings and 1.7x sales, but below Amazon’s 28.9x earnings multiple and far below Roku’s 105x trailing P/E, which reflects Roku’s depressed near-term earnings against a pending buyout rather than organic growth. The honest read: Netflix is cheap-to-mid relative to its own history, at the bottom of its five-year P/E range, but still a premium multiple against traditional media peers and only modestly below Amazon. The market has de-rated Netflix hard in 2026 but has not yet priced it like a legacy cable business.
Liquidity is not a concern at any position size a retail investor would take: average daily volume runs roughly 41-49 million shares depending on vendor and window. Short interest sits at roughly 101.03 million shares, about 2.41-2.42 percent of float, with 3.0-3.4 days to cover, a modest, unremarkable short position that shows no sign of a building short thesis or a squeeze setup despite the price decline.
Sell-side sentiment remains notably more optimistic than the price action: consensus rating is Buy or Moderate Buy, with 50-52 analysts covering the name depending on vendor, a mean price target around $114.15-114.26, a high target of $151.40 (both figures agree across vendors), and a low target disputed between $80 and $95 depending on source. Both major vendors agree the mean target implies roughly 54 percent upside from the $74.19 close, and that Buy-rated analysts outnumber Hold and Sell ratings by roughly 33 or more to 1. This is sell-side opinion, not a fact, and a gap this wide between consensus target and market price is itself a signal, either that the sell side has been slow to mark down its numbers after a bad year, or that the market is pricing in risks (competitive intensity, tariff exposure, the two failed acquisitions) that analyst models have not yet fully absorbed. Treat it as a data point to weigh, not a forecast to rely on.
Technically, the stock trades below its major moving averages after a persistent 2026 downtrend, with obvious support at the freshly printed 52-week low of $70.86 and no tested level below that in the post-split trading history. On the upside, prior consolidation zones cluster near $102-108, where the stock found support in late November 2025 and again peaked briefly around $107.83 in early April 2026 before the post-earnings slide, with the 52-week high near $133-134 above that. These are simply where buyers and sellers have historically clustered in this data window, not a prediction of where the price goes next.
What the crowd is saying: sentiment and narrative
News flow on Netflix has cooled sharply since the spring of 2026, and the tone shift is worth separating from the underlying business trend, because the two have diverged. The dominant headlines through mid-2026 have been the two failed acquisitions, Reed Hastings’s board departure at the June 4 annual meeting, and a market interpretation that holding FY2026 guidance steady at the April earnings call, rather than raising it, amounted to a disappointment worth a roughly 9-10 percent single-day share-price decline. Overshadowed by that narrative: management simultaneously raised FY2026 free cash flow guidance to about $12.5 billion (from an initial $11 billion) and reported the ad tier crossing 250 million monthly active viewers, up from 190 million just six months earlier, a 31 percent increase, with 60 percent of new sign-ups in ad-eligible markets choosing the ad tier.
Retail and social sentiment has been genuinely volatile and appears to be reactive rather than forward-looking. Message-volume surges on platforms like StockTwits ran as high as 800 percent above baseline during the spring 2026 run-up, alongside extremely bullish retail chatter around a “recovery” narrative; by late May and June, that flipped to bearish sentiment on platforms including Reddit’s WallStreetBets, tracking almost exactly with the stock’s decline toward its 52-week low. This reads as a typical boom-and-bust retail pattern, buying strength, then selling weakness into a low, rather than evidence of any independent, forward-looking conviction about the business.
The sharpest narrative-versus-fundamentals divergence in the data sits at the customer level. Review-platform sentiment on pricing and advertising is genuinely and measurably negative: 88 percent of subscription-related mentions in a sample of social and review data skew negative, the highest of any complaint category tracked, and Trustpilot scores the app at 1.6 out of 5 stars even as the Apple App Store rates it 4.7 out of 5, a stark platform divergence. Content departures (more than 100 Netflix Original titles are leaving the catalog in 2026, alongside major licensed titles) and the removal of Chromecast and AirPlay support on the ad-supported plan have generated real, documented complaints. But actual customer behavior tells a different story: Netflix’s monthly subscriber churn runs around 2 percent, the lowest among major streamers (Disney+ around 3 percent, Hulu around 4 percent), and the 2023 password-sharing crackdown added a net 23 million subscribers over the following twelve months rather than the mass exodus some feared. The likeliest explanation is that the loudest complaints come disproportionately from a vocal, tech-savvy minority who leave reviews, while the much larger base of 325 million-plus subscribers absorbs price increases quietly and keeps its subscription active. Read customer sentiment as evidence of real, measurable annoyance about pricing and ads, not as a leading indicator of business damage; the churn data, the harder and more reliable number, has not confirmed the sentiment.
Search interest, measured through Google Trends, places Netflix in roughly the 91st percentile of search attention against sector peers, a figure consistent with the company’s baseline cultural prominence rather than any acceleration or new event. Employee sentiment on Glassdoor is bimodal: a 4.1-out-of-5 overall rating and 80 percent of reviewers saying they would recommend the company sit alongside recurring complaints about a “culture of fear” tied to tenure-based performance pressure and a median employee tenure of only around two years. Compensation scores strongly (4.6 out of 5) while career development and work-life balance score more modestly, a pattern consistent with a company that pays well but runs hot internally, and one that 77 percent of employees still describe as having a positive business outlook, suggesting the internal read is “demanding, not failing.”
None of the sentiment sources here rise to the level of hard fact; treat retail and social chatter as narrative mood rather than a record of actual positions, treat customer-sentiment percentages as complaints from review-site users rather than population-level truth, and treat analyst consensus as an opinion subject to revision. The hardest, most reliable signals in this section are the ones grounded in actual behavior: churn, the subscriber gains from the password-sharing crackdown, and the ad-tier growth numbers, all of which point in a direction more constructive than the news cycle’s tone in mid-2026 would suggest.
The economics: what is structural, what is cyclical
Netflix’s demand rests on a discretionary household purchase, a monthly entertainment subscription, funded by disposable income spread across more than 325 million households in roughly 190 countries. That breadth is itself a stabilizer: no single national labor market, currency, or election outcome can move the whole business at once. Within that frame, two forces look genuinely structural rather than cyclical. First, the shift away from linear pay-TV is largely complete in the US: pay-TV penetration has fallen from roughly 88 percent of households at cable’s 2010 peak to an estimated 42 percent in 2026, and streaming captured 47.5 percent of all US television viewing time in Nielsen’s December 2025 measurement, the largest share in the measure’s history. Because the average cable bill was materially more expensive than the services replacing it, this reallocation has proven durable through multiple rate-hike and growth-scare periods since 2010, not a temporary substitution that reverses when the economy softens. Second, the advertising tier changes the shape of Netflix’s demand base entirely: a household on the $8.99-a-month ad-supported plan is a much smaller ask on a stressed budget than the $26.99 Premium tier, and a growing share of Netflix’s incremental revenue now comes from an advertiser’s budget line rather than the subscriber’s own wallet, a genuine, if partial, hedge against consumer-spending stress.
What is genuinely cyclical sits on top of that structural base: how much of the reallocated household entertainment budget accrues to Netflix specifically versus a fragmenting field of rivals, and how aggressively Netflix can keep raising price before triggering the churn reaction that has so far stayed muted. Deloitte’s 2025 Digital Media Trends survey found the average US household running 4.5 streaming subscriptions and $69 a month in combined streaming spend, up 13 percent year over year, with 41 percent of consumers reporting subscription fatigue, 71 percent citing price as the top reason for canceling any subscription, and 61 percent saying they would cancel a favorite service outright over a $5 price increase. That last figure defines the practical ceiling on how far Netflix can keep pushing price before the exact churn reaction the crackdown-and-price-hike playbook has so far avoided starts to show up in the numbers.
Streaming as an industry is transitioning from a land-grab phase into a maturity phase: global OTT revenue growth is estimated to be decelerating toward roughly 5 percent in 2026 and under 2 percent by 2030, as most addressable households in developed markets have already made an initial streaming decision. Netflix’s own 32.3 percent operating margin in Q1 2026, near an all-time high for the company, reflects several forces converging: the end of the multi-year subscriber-acquisition arms race, a still-early-innings advertising business, price increases landing with limited churn, and content spend growing more slowly than revenue for several consecutive years. Some of this looks like run-rate quality, especially the pricing lever in mature UCAN and EMEA markets. Some of it, particularly the advertising ramp, is explicitly not yet at cycle-peak; it should still be rising for several more years rather than peaking now. What historically ends cycles like this one: a content-spend arms race reignites (a well-capitalized Paramount-WBD combination, or Amazon, deciding to outspend for exclusive IP or sports rights); advertiser demand softens in a broader ad-market downturn, hitting the fastest-growing, most margin-accretive part of Netflix’s mix hardest; or subscription fatigue crosses a tipping point where price increases stop being absorbed quietly.
Netflix’s own balance sheet carries little rate sensitivity: total debt of $14.46 billion against streaming content obligations of $24.04 billion is manageable against an estimated $11 billion-plus of free cash flow in 2026, and both S&P (upgraded to A from BBB+) and Moody’s (upgraded to Baa1 from Baa2) have raised Netflix’s credit rating in the past two years, lowering its own marginal cost of debt. The more relevant rate channels run through the consumer and the equity multiple rather than through Netflix’s own financing. The effective federal funds rate stood at 3.63 percent as of late June 2026, with futures markets pricing roughly 3.8 percent by September and close to 4 percent by year-end, a “higher for longer” setting rather than an easing one, and Federal Reserve commentary from April 2026 describes consumer spending as resilient in aggregate but bifurcated, with higher-income households still spending while lower-income households pull back. Netflix’s ad-supported tier is precisely engineered to capture the lower-income, more rate-sensitive part of that distribution, a genuine hedge against exactly the bifurcation the Fed is describing. A “higher for longer” rate environment is also a persistent, mechanical headwind to any equity multiple, independent of how well the underlying business performs, and it is one reason Netflix’s own multiple has compressed even as its operating metrics have improved.
Three regulatory threads matter, at very different severities. The largest by far is the proposed US tariff on foreign-produced film content: in May 2025 and reiterated in September 2025, a 100 percent tariff on foreign-produced films entering the US was proposed as a national-security and domestic-film-industry measure. Netflix lost roughly $20.4 billion in market cap on the day of the initial announcement, a reflection of how directly exposed the model is perceived to be, given that Netflix produces more films than any other studio and sources roughly half of its original content from international productions. As of mid-2026, no final policy has been implemented, and open questions remain about whether it would apply to streaming distribution at all, versus theatrical release only, and how existing international co-production incentives would be treated. As of the research date, the proposal has no attached legislative vehicle, no bill number moving through either chamber of Congress, and no stated implementation date; it remains an executive-branch proposal rather than a piece of pending legislation. Opposition has been notably bipartisan and cuts across the entertainment industry itself, including studios, unions, and theater chains that depend on international co-productions and reciprocal trade in film and television content, which is the kind of broad-based resistance that has historically slowed or killed similarly sweeping tariff proposals before implementation. No analyst or political forecaster in the sourcing for this piece has published a quantified probability of passage, so this should be read as a low-probability, high-impact tail risk to underwrite against, not a base-case assumption baked into the scenarios below; none of the bull, base, or modal-bear cases in this piece assumes the tariff is implemented near its originally floated rate, only the most severe end of the bear case does. A Citi analyst estimate puts the worst-case cost at roughly $3 billion in additional annual costs and a 20 percent hit to earnings per share if implemented near the originally floated rate, a labeled analyst estimate rather than a company-confirmed figure, but the single largest unresolved risk on the name precisely because its probability is genuinely unknowable from public information rather than because its arrival is expected. Smaller and more manageable: the EU’s Audiovisual Media Services Directive requires streaming platforms to maintain at least 30 percent European-origin content in their catalog (member states can raise this to 40 percent), a known, priced-in cost of doing business in Europe where Netflix meets the threshold in most markets and is only slightly under in a handful, including the UK, Ireland, and France. And a slower-moving, market-by-market thread: content and speech regulation in individual countries (title removals in Turkey, reported self-censorship in India) shows up as recurring, low-magnitude costs rather than a threat to the overall model, though the direction of travel toward more markets asserting content-sovereignty rules is a persistent, gradual headwind on catalog uniformity and cost.
Roughly 56 percent of Netflix’s revenue comes from outside the US and Canada, a materially higher international share than most US-domiciled consumer-tech peers, and revenue is collected in dozens of local currencies while a large share of content investment and corporate overhead sits in US dollars. A broadly strengthening dollar, which tends to coincide with US rate divergence and global risk-off conditions, the same environment that pressures Netflix’s own equity multiple, mechanically compresses reported international revenue and profit even where local-currency growth stays intact. Netflix’s local-currency pricing strategy is a partial hedge against this, letting management defend margin market by market, but it also means blended average-revenue-per-membership growth is not a clean read on any single market’s underlying health.
At the unit-economics level, the mechanism behind Netflix’s margin expansion is straightforward once isolated. Content is a largely fixed cost per title regardless of how many of the 325 million-plus subscribers watch it, so the marginal cost of one more household streaming an existing title is close to the cost of bandwidth (mostly internalized through Open Connect) plus a small allocation of payment processing and support. There is no incremental royalty typically owed per additional viewer under most of Netflix’s content deals, unlike, say, music streaming’s per-stream royalty structure. Divided across the subscriber base, Netflix’s roughly $20 billion in guided 2026 cash content spend works out to something on the order of $60-65 per subscriber per year, against blended revenue per member that runs materially higher in the company’s largest markets. That gap, content cost per member against revenue per member, has widened for several consecutive years, which is the entire story behind operating margin moving from the low 20s percent a few years ago to 32.3 percent in Q1 2026. The risk to that widening trend sits on the revenue side, not the cost side, in the near term: if a future price increase finally triggers the churn response survey data has flagged as closer to the surface than realized numbers currently show, the gap could stop widening or start to narrow.
Durability and synthesis: what has to be true
Put the pieces together and the durability read is genuinely two-sided, not a simple story in either direction. Three things look structurally durable. The subscription relationship itself, built on more than a decade of accumulated viewing history, personalization, and habit, is the only stage of Netflix’s value chain with real switching costs for the end customer, and Netflix, not a supplier or platform partner, sets the price at that stage. The distribution cost advantage from owning Open Connect rather than renting third-party CDN capacity is real and structural, even if the precise per-unit cost figures cited by some analysts could not be independently verified and are best treated as directional. And the content-production layer is a buyer’s market with Netflix as the largest single global buyer, meaning the company, not its suppliers, generally sets the terms, except at the very top of the talent market where marquee showrunners and franchise IP holders retain real leverage.
But the honest framing, consistent with what Netflix’s own competitive posture reveals, is that the moat sits on retention economics and cost discipline more than on outright attention-share dominance, and both are being tested by concrete, observable forces rather than abstract ones. YouTube already leads Netflix in total US television viewing time and cannot be outspent given its cost structure. A newly merged Paramount-WBD entity is, for the first time, a scale-comparable rival with deep IP and real financing capacity. And two structural pillars of the bull case, continued pricing power and continued content-cost discipline, both depend on decisions (subscriber tolerance for the next price increase, competitive response from a bigger rival) that are not fully within Netflix’s own control.
What the market is effectively paying for at a roughly 24x trailing multiple, near the bottom of Netflix’s own five-year range, is a bet that the content-cost-to-revenue gap keeps widening (validated so far by two consecutive price increases landing with limited churn, and by management’s decision to walk away from the WBD bidding war rather than overpay) and that the advertising layer scales without cannibalizing higher-tier subscriptions (currently supported by the ad tier representing 60 percent of new sign-ups rather than a wave of downgrades from existing subscribers, though Netflix does not disclose tier-migration data that would let an outside reader verify this directly). What would break the thesis, in order of how directly observable each one is: a churn response to the next price increase that has so far shown up in survey data but not in realized numbers; the foreign-film tariff implemented anywhere near the originally proposed rate; and the Paramount-WBD combination successfully deploying its IP catalog to reignite the content-spending arms race Netflix’s margin story depends on staying over. None of these is the base case as of mid-2026. Each is individually plausible, specific, and trackable rather than a generic warning, which is exactly why the bear case here deserves to be taken seriously rather than dismissed as noise around a clearly improving business.
The scenarios in detail
Four variables decide where Netflix and its stock are in five years, and the bull, base, and bear cases below are different settings of the same four dials: the revenue-growth trajectory (subscription, pricing, and ads combined), the operating-margin trajectory, the intensity of competition and content-cost dynamics, and regulatory or tariff risk. Every dollar figure below is a labeled estimate derived from a stated FY2030 earnings assumption multiplied by a stated exit price-to-earnings multiple, adjusted for buyback-driven share-count reduction. None of it is a price target.
Bull case (illustrative five-year range $181-$206, midpoint near $206). Revenue growth runs 14 percent in FY2026 then steps down gradually to 10 percent by FY2030, reaching roughly $77 billion. Operating margin expands from the guided 31.5 percent in FY2026 to roughly 36.5 percent by FY2030 as the ad tier scales toward $8-9 billion with very high incremental margin and content spend keeps growing more slowly than revenue. The Paramount-WBD integration stumbles, the way most media megamergers historically have, limiting the combined entity’s ability to reignite a content-spending war; no foreign-film tariff is implemented; and aggressive buybacks reduce the diluted share count from roughly 4,300 million to roughly 3,590 million by FY2030. The market re-rates Netflix to a 28-30x multiple as it comes to be seen as the dominant, durably profitable global entertainment platform, implying roughly $6.46 of FY2030 EPS and a valuation range of $181-206. What has to be true: ad revenue roughly triples from 2026’s guided $3 billion to $8-9 billion by 2030, pricing power survives at least two more US price increases without material churn, and the Paramount-WBD rival fails to execute a coherent, well-funded counter-strategy. What most likely breaks it: a well-executed Paramount-WBD integration that deploys HBO and DC IP aggressively to bid for subscribers, ad share, and sports rights, forcing Netflix back into an arms-race spending posture that compresses margins from the mid-30s back toward 30 percent.
Base case (illustrative five-year range $128-$133, midpoint near $132). Revenue growth runs 13 percent in FY2026, near the guided midpoint, then decelerates gradually to roughly 7.5 percent by FY2030, reaching approximately $72 billion. Operating margin expands from 31.5 percent in FY2026 to roughly 34 percent by FY2030 as ad revenue scales to $6-7 billion and content spend grows at roughly 7-8 percent annually, below revenue growth. Paramount-WBD becomes a real competitor without dominating or reigniting a full arms race; YouTube’s attention-share gains continue slowly but Netflix retains its position as the largest paid subscription streaming service globally. The foreign-film tariff either dies quietly in proposal limbo or is implemented in a modified, less severe form. Steady buybacks of roughly $9 billion a year reduce the diluted share count to roughly 3,750 million by FY2030, and the market settles Netflix at a 23-25x multiple, above legacy media but below high-growth tech, implying roughly $5.33 of FY2030 EPS and a valuation of $128-133. What has to be true: revenue growth stays in the high single digits as ad revenue scales and pricing power holds, content-cost discipline is maintained, and the tariff either does not materialize or arrives in softened form. What most likely breaks it in either direction: faster-than-assumed ad-tier scaling pushes this toward the bull, while a churn response confirming subscription fatigue has crossed its tipping point pushes this toward the bear.
Bear case (illustrative five-year range $49-$52, midpoint near $50, anchored on the skeptic’s strongest arguments). Revenue growth comes in at 10 percent in FY2026, below the guided range on Q2/Q3 misses, then decelerates sharply to just 3 percent by FY2030, reaching roughly $58 billion. Operating margin peaks at 31 percent in FY2026 and compresses to roughly 27 percent by FY2030 as the foreign-film tariff adds $1-3 billion in annual content costs, the Paramount-WBD entity reignites a content and sports-rights arms race, and the ad tier disappoints, reaching only $4 billion by 2030 against the $9 billion target, as YouTube and Amazon absorb the majority of connected-TV ad-budget growth. Subscriber growth stalls at 3-4 percent per third-party estimates; churn begins rising after the next price increase; YouTube’s connected-TV share keeps climbing from roughly 35 percent toward 40 percent-plus. Buybacks continue but are increasingly executed at declining prices, a value-destructive pattern if fundamentals keep deteriorating, and the share count falls only to roughly 3,860 million. The market re-rates Netflix from its current roughly 20x multiple to a 15-16x multiple, pricing it as a maturing media company rather than a growth-tech franchise, implying roughly $3.26 of FY2030 EPS and a valuation of $49-52. What has to be true: several of these headwinds materialize simultaneously, subscription fatigue crossing its tipping point, the tariff landing near its original proposed rate, and the Paramount-WBD combination executing well, each individually plausible and currently observable in the data, but the bear case requires more than one to land together. What most likely breaks the bear case: Netflix’s demonstrated operational resilience through prior crises (the 2022 subscriber-loss scare, the 2023 password-sharing transition, the 2026 failed M&A) without any of them proving permanently destructive; if management adapts production to tariff risk and the Paramount-WBD integration proves as difficult as most megamergers historically have, the bear case loses its two heaviest pillars.
Catalysts and timeline. Near term: Q2 2026 earnings on July 16 (guided revenue of $12.574 billion, operating margin of 32.6 percent, down year over year on first-half-weighted content amortization); a mid-year check on whether ad revenue is tracking to the $3 billion full-year target; the NFL’s first international game of the expanded Netflix deal on September 11, 2026, in Melbourne; Q3 earnings in October, when content-amortization growth is guided to decelerate into the back half of the year; and any concrete legislative or executive action on the foreign-film tariff proposal, the single highest-impact binary catalyst on the name. Multi-year: the Paramount-WBD combined entity’s first full reporting period, expected in the third or fourth quarter of 2026, which will show whether the merger’s pro-forma estimates hold up; a new SAG-AFTRA/AMPTP negotiating cycle beginning in 2026; ad-tier revenue milestones at $5 billion, $7 billion, and $9 billion through 2030 that would validate or undercut the ad-business bull case; and the next US price increase, likely in late 2026 or 2027, which will be the real-world test of whether subscription fatigue has crossed its tipping point.
Companies to watch (bull / base / bear)
These are the names whose own numbers confirm or undercut the Netflix thesis before Netflix’s own results do.
- Paramount Skydance (PSKY) and the combined WBD entity. Watch: their first combined reporting period, expected in the third or fourth quarter of 2026 or the first quarter of 2027, will be the earliest real evidence of whether this deal is working. Four concrete things define success versus failure at that print. First, subscriber trend on the combined HBO Max-Paramount+ base during platform migration: net adds or accelerating growth signal a successful integration, while elevated churn as subscribers are moved between apps and bundles signals a stumbling one. Second, content and sports-rights spending relative to the pro-forma baseline: a disciplined ramp suggests the combined entity is prioritizing margin, while aggressive, above-baseline bidding for marquee IP or sports packages signals the arms-race scenario the Netflix bear case depends on. Third, whether cable-downgrade and cost-synergy savings actually show up as reinvested content budget or instead go toward debt paydown and dividends, a signal for how aggressively the combined entity intends to compete rather than simply integrate. Fourth, and most direct for Netflix specifically, whether the combined entity’s operating margin starts closing the gap to Netflix’s own low-30s percent margin, or stays stuck in the high single digits to low teens that WBD and Paramount have separately run in recent years; a fast-closing margin gap would mean the combined company can fund an aggressive content push out of its own cash flow rather than debt, which is the scenario Netflix’s bull case needs to not happen. A stumbling integration on any of these four is a Netflix bull signal; a coherent, well-funded counter-strategy across all four is a bear signal, and this is the single most important competitive tell in the comparison set.
- YouTube (Alphabet/GOOGL). Bear tell: Nielsen’s Gauge measure of connected-TV attention share. YouTube already leads Netflix in total US TV viewing time and its share has been rising; if that gap widens further, it signals Netflix is losing the structural attention war regardless of its own subscriber trends. Learn more about Alphabet’s strategy in the Alphabet deep dive.
- Disney (DIS). Base/bull tell: whether Disney+/Hulu’s newly profitable direct-to-consumer segment keeps improving margin without a renewed content-spend escalation. A disciplined Disney is consistent with an industry that has moved past the 2018-2021 arms race; an aggressive Disney content push would be an early warning the discipline is breaking down industry-wide.
- Comcast/Peacock (CMCSA). Context tell: whether Peacock’s revenue growth finally outruns its EBITDA losses. A profitable Peacock adds another well-funded, if smaller, competitor for ad dollars and content rights.
- Amazon (AMZN). Bear tell: Prime Video’s role as the dominant connected-TV ad competitor and a well-funded potential bidder for live-sports rights that could outspend Netflix on marquee packages, even though Amazon does not disclose Prime Video’s standalone economics.
- Roku (ROKU) under Fox ownership. Context tell, post-acquisition: once folded into Fox, Roku’s platform-ad economics and device reach become part of a media-company-owned distribution layer rather than an independent one, worth watching for how it reshapes the connected-TV ad market Netflix’s own ad tier competes in.
Risk controls
The honest risk list, and what would change the read. Netflix is a beta-1.5 single-line-of-business stock trading near the bottom of its own five-year valuation range but still at a real premium to legacy media, so the position sizing consideration is less about liquidity (there is essentially none; average daily volume runs 41-49 million shares) and more about concentration in a name whose near-term catalysts are genuinely binary. The specific things that would tip the read more bearish: a Q2 or Q3 2026 miss on revenue growth or operating margin; any concrete move toward implementing the foreign-film tariff near its originally proposed rate; the first hard evidence of rising churn following the March 2026 US price increase; or early signs the Paramount-WBD combination is executing a coherent, well-funded competitive strategy rather than struggling with integration. The things that would tip the read more bullish: a formal decision to shelve the tariff proposal; ad revenue tracking meaningfully ahead of the $3 billion 2026 guide; and a stumbling Paramount-WBD integration that widens Netflix’s competitive moat by default. On process, Netflix’s discontinuation of quarterly subscriber disclosure removes a metric investors used for a decade to gauge underlying demand; a reader relying on this stock should track revenue growth, operating margin, ad-tier metrics, and churn data from third-party trackers like Antenna as substitutes, rather than assume “subscriber growth is fine” simply because the company has stopped reporting a number that might show otherwise.
Methodology, sourcing, and data-quality flags
This is a single-company deep dive built from Netflix’s own primary filings (the FY2025 10-K filed January 23, 2026; the Q1 2026 10-Q filed April 17, 2026; the Q1 2026 shareholder letter and 8-K; multiple deal-related 8-Ks covering the WBD termination and the buyback authorization; the 2026 DEF 14A proxy), cross-checked point-in-time market data from multiple vendors, and analyst and trade-press sourcing for competitive and macroeconomic context. The source hierarchy is primary filings first, then analyst-tier estimates (Citi, JPMorgan, S&P, Moody’s), then reputable trade and business press, then explicitly labeled estimates. Every load-bearing figure traces to the claims ledger.
Data-quality flags:
- A claims-recording pipeline bug corrupted nine numeric figures during research (a literal dollar sign followed by a digit was silently stripped in a batch of claims, turning, for example, “$12.25B” into “2.25B” and, in two cases, mangling “$0.12” and “$0.75” into fragments of a shell interpreter path). All nine were independently re-derived from primary sources during verification and corrected before this draft was written; every figure quoted above uses the corrected value, not the corrupted raw text. This was a recording-pipeline defect, not a sourcing problem, but it is disclosed here for transparency.
- Market data is vendor- and definition-dependent. The 52-week range, forward P/E, analyst count, price targets, and one-year total return all show material disagreement across data vendors (stockanalysis.com, finviz, marketbeat, tradingview). These are presented as ranges throughout, with the point-in-time, moves-daily framing applied consistently, rather than as single precise numbers.
- Forecasts are forecasts. FY2026 revenue and margin guidance, the $3 billion 2026 ad-revenue target, the roughly $12.5 billion free-cash-flow guide, and the Paramount-WBD combined pro-forma figures (~$70 billion revenue, ~$16 billion EBITDA, ~207 million subscribers) are management or deal-model projections, not reported actuals, and are labeled as such everywhere they appear.
- Ownership disclosure is in flux. Vanguard’s widely cited 8.65 percent stake traces to a 2024 filing; a 2026 reporting-structure reorganization means the current aggregate Vanguard position cannot be cleanly confirmed from a single filing, so no current Vanguard percentage is stated as fact anywhere in this piece.
- Two claims were cut or heavily hedged rather than presented as current fact. The commonly repeated figure that more than 80 percent of Netflix viewing is driven by its recommendation algorithm traces to company statements from around 2016 and has not been recently reconfirmed; it appears above only as a hedged, historical reference. A third-party estimate of Netflix’s per-unit content-delivery cost advantage over commercial CDN providers (cited by one investment firm) could not be independently corroborated and its specific figures were cut from this draft; only the directional, well-documented claim that Open Connect provides Netflix a real cost advantage is retained.
- Netflix stopped quarterly subscriber disclosure after Q4 2025. Every “325 million-plus” reference in this piece is the last-disclosed figure as of the January 2026 shareholder letter, not a live count as of the July 2026 research date, and is labeled that way wherever it appears.
On the full five-factor read, in plain prose:
Valuation is the most constructive factor. Netflix trades at a trailing P/E of roughly 24x and a forward P/E of roughly 19-22x (disputed across vendors), near the bottom of its own five-year range (median around 47x, a figure that could not be independently confirmed on a second source) and at roughly the same level it traded during the 2022 subscriber-loss crisis, despite meaningfully better operating metrics today: revenue growing 16 percent, operating margin at 32.3 percent, and free cash flow around $9.5 billion for the year. Against peers, it remains a premium to legacy media but trades roughly in line with or below Amazon’s forward multiple. One inconsistency worth flagging: the price-to-sales ratio, near 6.6x, has not compressed nearly as far as the trailing P/E has, which tempers how cheap the stock really is on a revenue basis even as the earnings multiple looks historically low.
Growth is healthy but clearly decelerating. Revenue is guided to grow 12-14 percent in FY2026, down from 16 percent in each of the prior three fiscal years, the first clear step-down in three years. The ad tier is the strongest near-term lever, guided to double to $3 billion in 2026 with a company ambition of roughly $9 billion by 2030, and international markets (APAC up 21 percent, LATAM up 11 percent in FY2025) are growing meaningfully faster than the mature UCAN market. But the password-sharing tailwind has fully lapped, and the broader OTT industry itself is maturing, which supports a modestly positive but not emphatic read on growth.
Quality is Netflix’s strongest dimension by a clear margin. Operating margin has expanded every year for three consecutive years, from 20.6 percent to 26.7 percent to 29.5 percent, with a further step to a guided 31.5 percent in 2026. Free cash flow was roughly $9.5 billion in FY2025 and is guided to about $12.5 billion in FY2026 (though that figure includes the one-time WBD termination fee; the underlying recurring figure is closer to $9.7 billion). The balance sheet improved meaningfully in Q1 2026, net debt fell to roughly $2.07 billion, and both major credit-rating agencies have upgraded Netflix in the past two years. Subscriber churn at roughly 2 percent is the lowest among major streaming peers, and pricing power has been demonstrated through two consecutive US price increases with limited churn impact. This dimension is unambiguously strong.
Risk nets negative. The unresolved foreign-film tariff represents an estimated $3 billion cost and 20 percent EPS-impact tail risk in a worst-case scenario, according to a Citi analyst, a labeled estimate rather than a certainty. The Paramount-WBD merger creates the first genuinely scale-comparable rival Netflix has faced. Netflix’s own decision to stop disclosing subscriber counts reduces investor visibility into the core historical growth metric. YouTube continues gaining living-room attention share at Netflix’s expense. Two failed large acquisitions inside a single year raise legitimate questions about M&A strategy and capital-allocation discipline. The balance sheet is strong enough to absorb most of these individually, but the combination of an unresolved tariff, a new scale competitor, and reduced disclosure transparency is a real, not a theoretical, set of risks.
Momentum and sentiment are clearly negative in the near term. The stock is down roughly 42-47 percent over the past year, trading near its 52-week low and below all major moving averages, with retail sentiment having flipped from bullish to bearish and a news cycle dominated by two failed acquisitions rather than the underlying operating improvement. Sell-side consensus remains Buy-rated with a mean target implying roughly 54 percent upside, and the fundamentals, free cash flow, margin, and revenue growth, remain solidly positive, a genuine narrative-versus-fundamentals divergence worth weighing rather than dismissing in either direction.
The overall lean, on balance, is Hold. This is a labeled, rules-based research signal, not personalized investment advice. See the disclaimer.
Key sources: Netflix FY2025 Form 10-K and Q1 2026 Form 10-Q (SEC EDGAR, CIK 0001065280); Netflix Q1 2026 and Q4/FY2025 shareholder letters and earnings-call transcripts; Netflix 8-Ks covering the WBD merger agreement (January 2026), the WBD termination and $2.8 billion fee (February 27, 2026, accession 0001193125-26-082247), the $25 billion buyback authorization (April 22-23, 2026, accession 0001065280-26-000139), and the June 2026 annual-meeting/chairman-change filing; the 2026 DEF 14A proxy statement; S&P Global Ratings and Moody’s rating actions; stockanalysis.com, finviz.com, and marketbeat.com for point-in-time market data (July 1, 2026); Nielsen’s Gauge for US TV viewing-time share; Deloitte’s 2025 Digital Media Trends survey; Antenna for churn benchmarking; Citi (Jason Bazinet) for the foreign-film-tariff cost estimate; JPMorgan for the March 2026 price-increase revenue impact; SEC 8-K filings and press coverage (Reuters, Bloomberg, Variety, The Hollywood Reporter, TheWrap) for Disney, Warner Bros. Discovery, Comcast, Paramount Skydance, Amazon, Roku, and Spotify peer comparisons.
Prepared July 1, 2026. Figures are point-in-time and will change. This is research and analysis for educational purposes, not investment advice, not a recommendation, and not a solicitation. Netflix is a high-beta, single-line-of-business stock that has fallen sharply on headline events even as its operating metrics have improved, with a real, unresolved tariff risk and a newly scale-comparable competitor both still unresolved as of this writing. Verify all figures independently and consult a licensed financial advisor before making any decision.
Structured data
{
  "@context": "https://schema.org",
  "@type": "BlogPosting",
  "headline": "Netflix (NFLX) stock forecast: bear, base, and bull to 2031",
  "description": "Netflix (NFLX) stock analysis: bear/base/bull forecast across 6 months, 1 year, 3 years, and 5 years, with margin expansion and ad-tier growth amid tariff risk.",
  "image": "/og/nflx.png",
  "datePublished": "2026-07-01T00:00:00Z",
  "dateModified": "2026-07-01T00:00:00Z",
  "author": {
    "@type": "Organization",
    "name": "Market Supply Chain Research"
  },
  "publisher": {
    "@type": "Organization",
    "name": "Market Supply Chain"
  },
  "articleBody": "Deep research on Netflix (NFLX): bear/base/bull scenarios across 6 months, 1 year, 3 years, and 5 years. Hold rating at $74.19. Operating margins expanding, ad tier scaling fast. Key risks: unresolved tariff on foreign-produced content, new scale rival from Paramount-WBD merger."
}
{
  "@context": "https://schema.org",
  "@type": "FAQPage",
  "mainEntity": [
    {
      "@type": "Question",
      "@id": "nflx-6-month-forecast",
      "name": "What is the 6-month outlook for Netflix (NFLX) stock?",
      "acceptedAnswer": {
        "@type": "Answer",
        "text": "The 6-month outlook (into early 2027) depends on two earnings prints, Q2 (July 16) and Q3 (October), and whether the proposed foreign-film tariff moves into policy. Base case near $78 (modest re-rating as ad business tracks to $3B target). Bull case near $95 (clean earnings beats, no tariff). Bear case near $56 (margin miss, tariff executive order, or churn from March 2026 price increase). Key swing: whether Q2 ad-revenue growth confirms the doubling-to-$3B pace."
      }
    },
    {
      "@type": "Question",
      "@id": "nflx-1-year-forecast",
      "name": "What is the 1-year forecast for Netflix (NFLX) stock?",
      "acceptedAnswer": {
        "@type": "Answer",
        "text": "The 1-year outlook (mid-2027) shows FY2026 fully reported and FY2027 guidance in hand. Base case around $89 (FY2026 near $51B at 31.5% margin, FY2027 guided at 10% growth). Bull case near $111 (FY2026 at high end, FY2027 above 12% growth, ad business at $5B-plus run rate). Bear case near $52 (revenue growth below 10%, tariff implemented, Paramount-WBD aggressive on content). Key flip: FY2027 guidance above 12% favors bull, below 8% favors bear."
      }
    },
    {
      "@type": "Question",
      "@id": "nflx-3-year-forecast",
      "name": "What is the 3-year forecast for Netflix (NFLX) stock?",
      "acceptedAnswer": {
        "@type": "Answer",
        "text": "The 3-year outlook (2029) focuses on structural durability. Base case near $118 ($62-66B revenue, 33% margins, $5-6B ad business). Bull case near $167 (ad business toward $9B ahead of schedule, 35%+ margin, stock re-rated to 28x). Bear case near $51 (content arms race reignites, tariff adds $1-3B costs, growth stalls at 3-5%). Key flip: whether Paramount-WBD integration produces genuine competitor or stumbles like typical media megamergers."
      }
    },
    {
      "@type": "Question",
      "@id": "nflx-5-year-forecast",
      "name": "What is the 5-year forecast for Netflix (NFLX) stock?",
      "acceptedAnswer": {
        "@type": "Answer",
        "text": "The 5-year outlook (2031) is a durability question. Base case near $132 ($72B revenue, 34% margins, EPS near $5.75, 23x multiple). Bull case near $206 ($77B-plus revenue, 37% margins, $8-9B ad business, 28-30x multiple as dominant platform). Bear case near $49 (slow growth at 15x, $3.26 EPS, tariff never resolved, content-cost discipline lost). Key flip: whether ad-revenue ramp to $9B by 2030 proves achievable, or plateaus at $4-5B as YouTube and connected-TV rivals keep ad-budget dominance."
      }
    }
  ]
}