
Research date: June 22, 2026 | OSINT market research on Amazon.com, Inc. (Nasdaq: AMZN), the four revenue engines that share its infrastructure, the cloud and advertising businesses that carry almost all of its profit, and a five-year outlook. Live prices, stamped hard.
Important disclaimer. This is OSINT-based research and educational analysis, not investment advice. I am not a financial advisor. Nothing here is a recommendation to buy or sell any security, and the scenarios below are illustrative, not price targets. AMZN is a high-beta (1.44) name tied to a single, fast-moving AI-capex cycle, and it can fall hard in a session, as it did on the research date. Market caps, prices, valuation multiples, and market-share figures are point-in-time (June 22, 2026), press-reported where noted, and move fast. Do your own due diligence and consult a licensed advisor.
Where this stock could be in 6 months, 1 year, 3 years, and 5 years
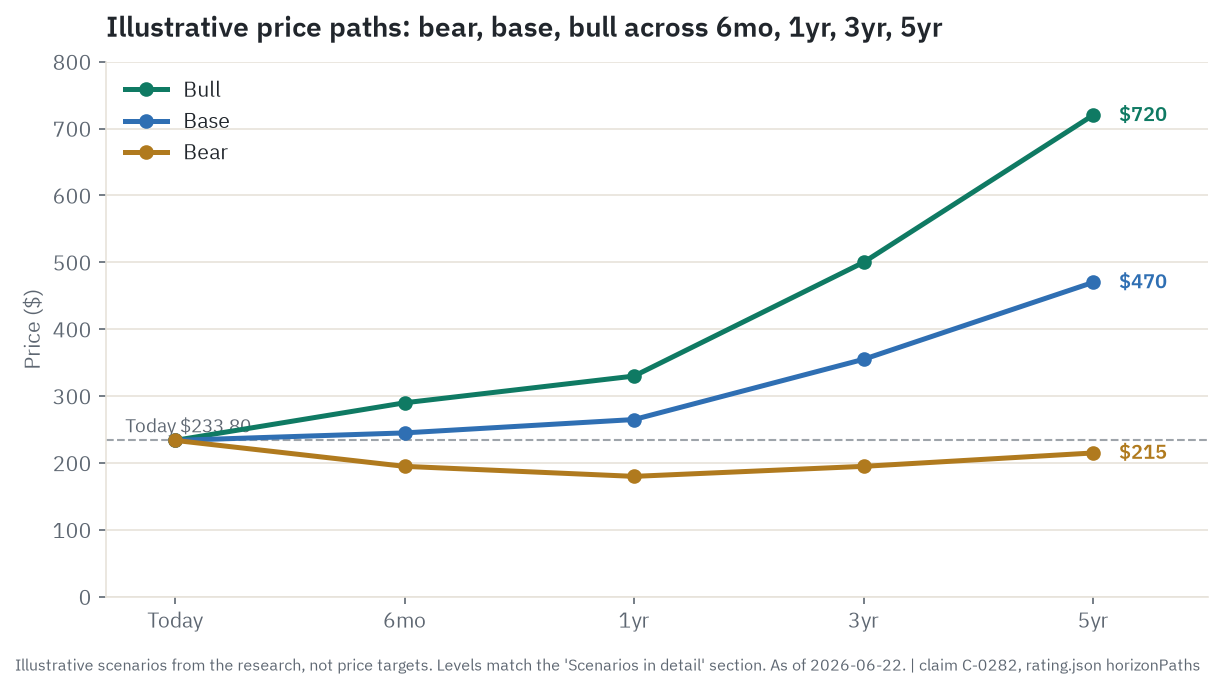
Start with the answer, because it is what you came for. The four windows below are scenarios, not promises. Each one is a different setting of the same handful of variables: how fast AWS grows, whether AWS margin holds while depreciation rises, whether free cash flow stops falling, and whether the advertising and marketplace engine survives the regulators intact. Every dollar figure here is an estimate derived from those assumptions and anchored on the verified June 22, 2026 close of $233.80. None of them is a price target.
6 months. This window belongs to two earnings prints, estimated for July 30 and late October, against a hyperscaler-capex mood that on the research date was souring (the five biggest AI spenders are on track for roughly $452 billion of combined 2026 capex, and the market re-prices that number often). The bear case runs to about $195, near the 52-week low, if AWS operating margin slips toward the low 30s and the market reads that as the depreciation wave arriving. The base case is roughly $245, a high-quality franchise holding near its 100-day and 200-day moving-average cluster around $233 to $235. The bull case reaches about $290 on a clean AWS beat plus a capex line that reassures on returns. The single thing that flips this window is the AWS operating-margin number versus the 37.7 percent it printed last quarter.
1 year. Over twelve months the story is the race between AWS margin and a rising depreciation bill, and whether reported free cash flow stops falling. The bear case is about $180, the skeptic’s slow grind, where AWS decelerates while depreciation steps up, reported free cash flow stays near zero or goes negative, and a roughly zero free-cash-flow yield forces the multiple down. The base case is about $265, with AWS holding mid-to-high-20s growth, margin compressing but staying in the low-to-mid 30s, and the multiple roughly intact. The bull case is about $330, near the sell-side average, if the AI run-rate keeps compounding with visible operating leverage. Flip signal: the direction of trailing free cash flow across the next two prints.
3 years. By 2029 the structural questions start to resolve. The market should be able to judge whether the 2026 and 2027 capex earned its cost of capital, and whether the FTC remedy (trial scheduled for March 29, 2027, with any remedy coming later) reshaped the advertising and marketplace engine. The bear case is about $195: the build is underwater on returns, the AI premium is gone, the advertising and third-party engine is trimmed by a remedy, and only the franchise floor holds. The base case is about $355, steady earnings compounding at a fair multiple. The bull case is about $500, with the capex proven accretive and AWS re-rated as a durable AI platform. Flip signal: AWS segment operating margin recovering above the high 30s versus stalling in the low 30s.
5 years. The far horizon is a pure durability question. The bear case is about $215, roughly flat-to-down in nominal terms, a world where AI compute stayed capital-hungry and margin-diluting and free cash flow never normalized. That is a de-rating, not a bankruptcy: the franchise still has real value at the floor. The base case is about $470, the software-like AWS and advertising profit pool compounding while free cash flow normalizes back to tens of billions. The bull case is about $720, AWS-AI matured into a clearly higher-return franchise with a re-rating toward the top of the sum-of-the-parts range. Flip signal: whether annual free cash flow has durably crossed back above roughly $50 billion.
Where the read lands today. On balance the read lands at Hold: this is a high-quality, reaccelerating franchise priced roughly fairly, with a genuine free-cash-flow-and-depreciation overhang that the bull case has not yet disproved. The single thing most likely to flip it is a clean free-cash-flow inflection in 2027 that proves the monetization lag was real, which would turn the lean toward a Buy; a confirmed AWS-margin slide into the high 20s, or a structural FTC remedy, would push it the other way.
Companion tool - jump to the interactive dashboard to sort and filter every company in this piece, or download the Excel model to flex the scenarios yourself.
TL;DR
Amazon is, financially, a low-margin retail and logistics machine with two high-margin engines bolted inside it. In fiscal 2025 it earned $716.9 billion of revenue and $80.0 billion of operating income, an 11.2 percent margin that has widened by 480 basis points in two years. The reason to own the stock is not the retail body. It is AWS, which at $128.7 billion of revenue is only 18 percent of the top line but generated 57 percent of the operating income at a 35.4 percent segment margin, and advertising, a roughly $69 billion business growing about 22 percent at an estimated 60-percent-plus incremental margin that quietly subsidizes the thin retail underneath it. The swing variable is the AI build. Amazon spent $131.8 billion of capex in 2025 and has guided to roughly $200 billion in 2026, which has driven trailing free cash flow down to about $1.2 billion on a $2.51 trillion market cap, a roughly zero free-cash-flow yield, and pushed the balance sheet from about $54 billion net cash to about $20 billion net debt. The bull case is that a $364 billion AWS backlog converts on the 6-to-24-month lag management describes and free cash flow normalizes by 2027 or 2028. The biggest single risk is that monetization arrives a year late while depreciation arrives on time, so the cost line compresses margins and free cash flow with no cushion to absorb it. All figures below carry a date stamp and move fast.
Explore it yourself: the interactive dashboard
Open the dashboard in a full screen
One company, four businesses
Most people picture Amazon as a store. That picture is the body, not the heart. A useful way to hold it in your head is a freight company that happens to own a toll booth and a power plant. The trucks (retail and fulfillment) move more than $460 billion of goods a year at razor-thin margins and barely cover their own diesel. The toll booth (advertising) charges every seller who wants to be seen, at almost no extra cost to Amazon. The power plant (AWS) sells a utility that the whole economy now needs, at a margin a retailer can only dream of. The trucks are why everyone shows up. The toll booth and the power plant are why the enterprise makes money.
That split is the entire investing point, and it is why headline revenue is misleading. Amazon ran $716.9 billion of revenue in fiscal 2025, but if you only look at the top line you would conclude it is a giant retailer with a cloud side-hustle. Look at where profit is captured and the picture inverts. AWS is 18 percent of revenue and 57 percent of operating income. Advertising is under 10 percent of revenue and, by every credible estimate, a large slice of the rest of the profit. The two retail segments generate the majority of the revenue and most of the thin-margin volume that funds the flywheel.
So the right questions are not “is e-commerce growing.” They are: can AWS keep growing in the high 20s while the depreciation from the AI build floods the cost line; how durable is the advertising toll; and does the retail body throw off enough cash, once the capex wave passes, to make the whole thing worth $2.5 trillion. The rest of this piece works through each engine in turn, then puts them back together.
How the money flows
flowchart TD
    CON["Consumers\n~$464B commerce GMV"]
    ENT["Enterprises & Developers\nAWS ~$150B annualized Q1 2026"]
    ADV["Advertisers & Sellers\n~$68.6B ad spend FY2025"]
    SUB["Prime Members\n~220-240M global est."]

    CON --> RETAIL["1P Online + Physical Stores\n$291.9B revenue; thin margin"]
    CON --> MKT["3P Marketplace\n$172.2B fees on ~$575B GMV"]
    ADV --> ADS["Advertising Services\n$68.6B FY2025; ~75-80% incr. margin est."]
    ENT --> AWS["AWS Cloud\n$128.7B FY2025; 35.4% op. margin"]
    SUB --> PRIME["Subscriptions + Content\n$49.6B FY2025; $22.4B content spend"]

    RETAIL --> NA["North America Segment\n$426.3B revenue; 6.9% op. margin"]
    MKT --> NA
    ADS --> NA
    ADS --> INTL["International Segment\n$161.9B revenue; 2.9% op. margin"]
    RETAIL --> INTL

    NA --> OPINC["Consolidated Op. Income\n$79.975B FY2025"]
    INTL --> OPINC
    AWS --> OPINC

    AWS --> CHIP["Custom Silicon\nTrainium2/3; Graviton; >$20B ARR"]
    CHIP --> TSMC["TSMC 3nm fab\nCHOKEPOINT: shared with Nvidia"]
    CHIP --> HBM["HBM Memory\nSK Hynix ~62% AI-chip HBM"]

    OPINC --> CAPEX["AI Infra Capex\n$131.8B FY2025; ~$200B guided 2026"]
    CAPEX --> DC["Data Centers + Power\n3.8 GW added Oct 2024-Oct 2025"]
    CAPEX --> CHIP

    PRIME --> ADS
    MKT --> ADS

    OPCINC2["AWS Op. Income\n$45.6B = 57% of total"]
    AWS --> OPCINC2
Read the diagram top to bottom. Money enters from four sources. Consumers spend roughly $464 billion across the first-party store and the third-party marketplace. Enterprises and developers pay AWS, running at about $150 billion annualized as of the first quarter of 2026. Advertisers and sellers paid $68.6 billion in 2025 to be seen. Prime members pay subscription fees that buy free shipping, video, and music.
In the middle, the costs sit on the retail side. Cost of sales was $356.4 billion in 2025, just under half of all revenue, and fulfillment added $109.1 billion. The two together eat about 65 percent of revenue before a dollar of technology, marketing, or overhead. That is why the North America segment ran a 6.9 percent operating margin in 2025 and International ran 2.9 percent, and those numbers are flattered, because advertising revenue is reported inside those segments. Strip advertising out and the underlying retail margin is negligible or negative.
At the bottom, profit pools in two places. AWS produced $45.6 billion of operating income, which is 57 percent of the consolidated $80.0 billion, and advertising contributes most of the rest. The shape is the investing point: a vast, low-margin commerce body that exists partly to generate the traffic and the purchase data that feed a near-zero-marginal-cost advertising toll, and a separate cloud utility that earns the kind of margin that justifies the whole valuation. The bottom of the diagram also shows where the cash goes back out: into roughly $200 billion of guided 2026 capex for data centers, power, and Amazon’s own AI chips. That is the tension in one image. The profit pools at the bottom are real; the question is whether the capex flowing back out of them earns its keep.
The business, segment by segment
Amazon reports three segments (North America, International, and AWS) and discloses revenue by product line underneath them. Here is the field guide, with each line sized from the 2025 10-K and its margin role spelled out.
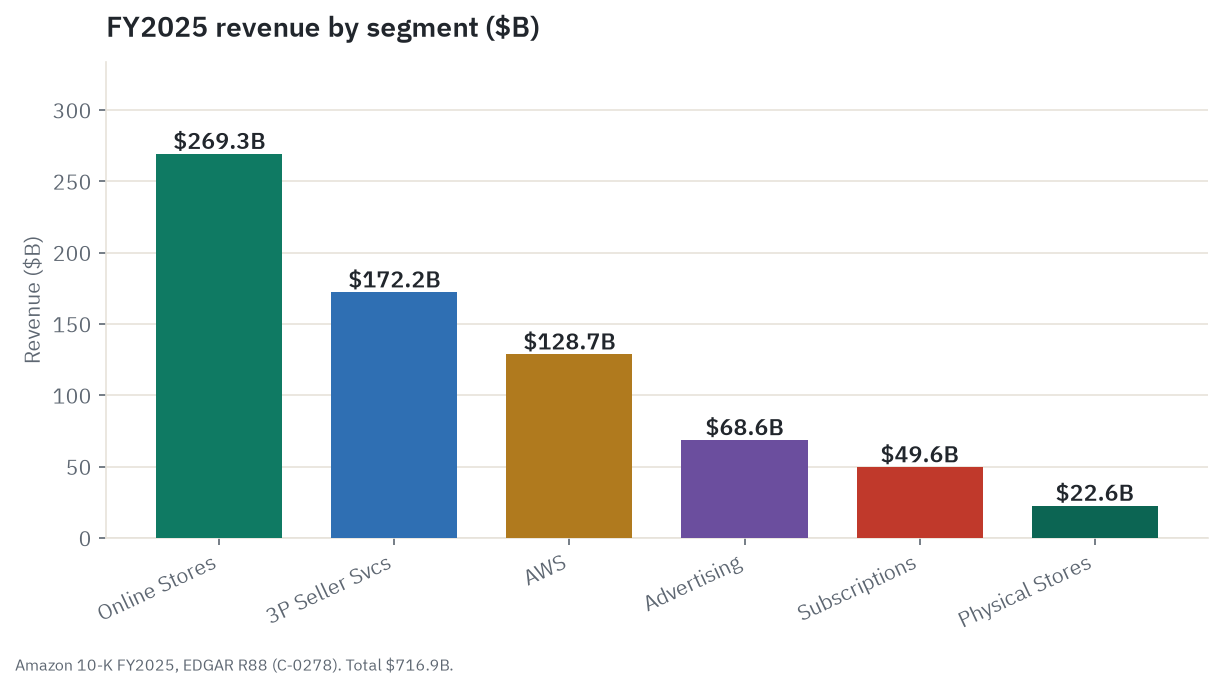
- Online stores (first-party retail): $269.3 billion, up 9 percent. Goods Amazon buys and resells. The biggest line, and close to break-even on its own. This is a price-taker business against Walmart and Target; it competes on speed and the Prime flywheel, not on price leadership.
- Third-party seller services: $172.2 billion, up 10 percent. Referral commissions, fulfillment fees, storage, and shipping charged to the roughly two million active sellers on the marketplace. Sellers were 61 to 62 percent of paid units in late 2025. Margin is thin once real fulfillment costs are netted, but at $172 billion the line is large and it is the data engine that feeds advertising.
- AWS: $128.7 billion, up 20 percent (28 percent in the first quarter of 2026). The cloud utility. The profit center, covered in its own section below.
- Advertising services: $68.6 billion, up 22 percent. Sponsored products, sponsored brands, display, the demand-side platform, and Prime Video ads. The highest-margin revenue Amazon runs. Covered below.
- Subscription services: $49.6 billion, up 12 percent (15 percent in the first quarter of 2026). Mostly Prime membership fees, plus music and audiobooks. Content spend of $22.4 billion eats roughly 45 percent of the line, capping its margin, but Prime is the glue that holds the flywheel together.
- Physical stores: $22.6 billion, up 6 percent. Whole Foods and Amazon Fresh. Small and slow-growing; no meaningful pricing moat against Kroger or specialty grocers.
The geography is a US story with a few large satellites. The United States is 68.3 percent of revenue ($489.7 billion), Germany 6.4 percent, the United Kingdom 6.0 percent, and Japan 4.3 percent. Those four markets are roughly 85 percent of the total. International turned an operating profit for the first time in its modern history in 2024, after a $2.7 billion loss in 2023, and reached $4.75 billion of operating income in 2025. That turn matters, because it shows the North America playbook (regionalized fulfillment plus an advertising mix shift) travels.
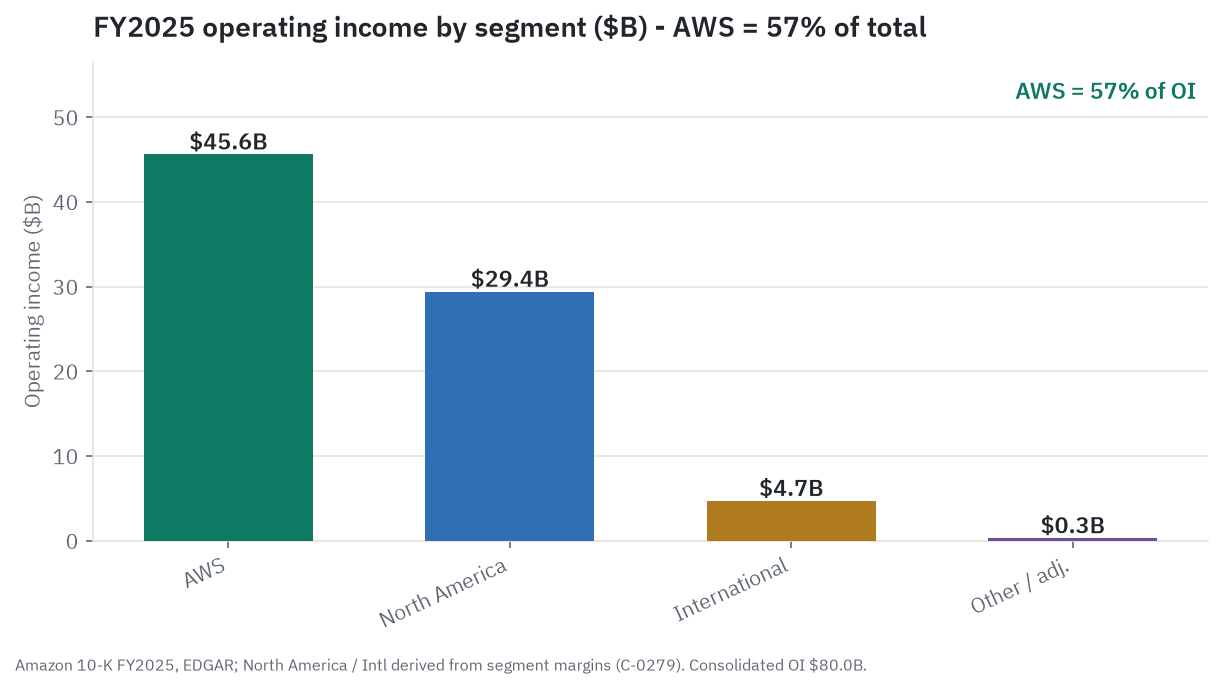
The operating-income chart is the one to internalize. AWS is a minority of revenue and a majority of profit. That single fact is why a slowdown or a margin slip in one 18-percent-of-revenue segment can move the whole stock.
AWS: the profit engine
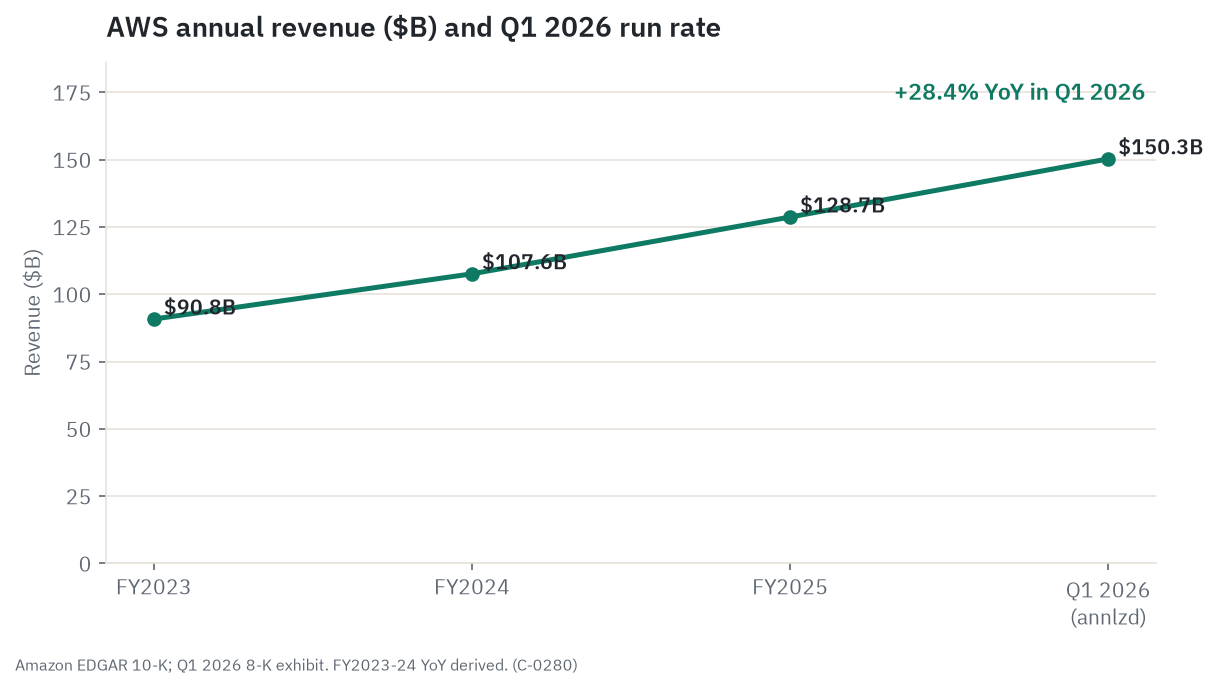
AWS is the reason to do this work, so it gets the most space. It sells cloud computing, storage, databases, and now AI model access through Bedrock to enterprises and developers. In 2025 it earned $128.7 billion of revenue at a 35.4 percent operating margin, which is $45.6 billion of operating income, more than the entire company’s consolidated operating income as recently as 2023.
The growth story is a genuine reacceleration, not a recovery bounce. AWS grew 17 percent in the first quarter of 2025, then 17.5, 20, 24, and 28 percent in the four quarters since, the fastest pace in 15 quarters. The quarterly run rate is now about $150 billion annualized. The thing that makes this different from the 2022-to-2023 cloud-optimization slump is the cause: management says the binding constraint through the first half of 2025 was capacity, not demand. AWS was consuming new data-center capacity as fast as it could deploy it. The reacceleration since reflects capacity coming online, not customers returning.
The demand is locked in at a scale that is unusual even for enterprise contracting. Remaining performance obligations, which are contracted future revenue not yet recognized, reached $364 billion as of March 31, 2026, up about 49 percent in a single quarter from $244 billion at the end of 2025, with a weighted-average remaining life of 5.5 years. That figure is stamped to the end of the quarter and it excludes the Anthropic and OpenAI expansions announced after quarter-end. Named anchor customers include Anthropic, OpenAI, Meta, Apple, and Uber. Management frames the backlog as evidence that AWS has a conversion problem (it cannot build fast enough), not a demand problem.
There is a hinge in that backlog, and it deserves to be named plainly. A material part of it traces to AI model labs that are themselves burning cash. Amazon has put roughly $33 billion into Anthropic, which then committed more than $100 billion back to AWS over a decade. Amazon committed $50 billion to OpenAI (an initial $15 billion plus $35 billion contingent), and OpenAI expanded its AWS consumption by $100 billion over eight years and committed to roughly 2 gigawatts of Amazon’s Trainium chips. Critics, including the investment firm GMO and the investor Michael Burry, have characterized this pattern of investment flowing one way and committed spend flowing back as reminiscent of the circular financing of the dot-com era. That is a characterization, an analytical opinion, not an established fact, and there is no finding that any of these arrangements are improper. But it is the honest version of the risk: the value of a slice of the $364 billion backlog depends on the AI capital cycle continuing and on those customers staying creditworthy.
The margin is the live battle. AWS margin peaked at 39.5 percent in the first quarter of 2025, dipped to the mid-30s through the year, and printed 37.7 percent in the first quarter of 2026. Three forces pull on it. The headwind is depreciation: in January 2025 Amazon shortened the useful life it assumes for a subset of servers from six years back to five, citing the faster pace of AI development, which cost roughly $700 million of 2025 operating income, on top of $920 million of accelerated retirement charges. The tailwinds are utilization (new capacity earns high incremental margin once it fills) and mix (AI workloads carry higher prices). The near-term math is unavoidable: capacity deploys ahead of the revenue it will eventually earn, so margin compresses before it recovers.
Underneath AWS sits a custom-silicon business that has become genuinely large. Amazon’s chips (Trainium for AI training, Graviton for general compute, Nitro for networking) crossed a $20 billion annualized revenue run rate in the first quarter of 2026, growing triple digits year over year. Management calls it one of the top three data-center chip businesses in the world, and puts total Trainium revenue commitments above $225 billion. Trainium2 is described as roughly 30 percent better on price-performance than comparable Nvidia GPUs and “largely sold out”; Trainium3, on TSMC’s 3-nanometer process, is “nearly fully subscribed” before volume launch. The strategic logic is two-fold: Trainium cuts AWS’s own compute cost for Bedrock, and it frees AWS from competing with everyone else for Nvidia’s allocation. The catch is upstream. Trainium is fabricated by TSMC on the same advanced nodes Nvidia uses, and the high-bandwidth memory it needs is dominated by SK Hynix, so Amazon’s silicon independence has its own chokepoints.
One caution on AWS competitively, which the bears press hard. AWS is the largest cloud by far, but it is being out-grown. Per Synergy Research, AWS held about 28 percent of the global cloud infrastructure market in the first quarter of 2026, down from roughly 33 percent in 2020, while Azure (21 percent) grew 40 percent and Google Cloud (14 percent) grew 63 percent off smaller bases. Both rivals also reported larger backlogs than AWS: Microsoft’s commercial remaining performance obligations were about $627 billion and Google Cloud’s about $460 billion, though Microsoft’s figure is company-wide and reportedly concentrated in OpenAI. The fair read is that AWS is the incumbent defending share, reaccelerating in absolute dollars, and out-grown in percentage terms by two competent and well-capitalized rivals. “Amazon is winning AI” is too strong; “AWS is a durable, reaccelerating leader losing slow share to faster-growing peers” is the accurate version.
For how the AI-compute economics and the Nvidia supply dynamic fit into this picture, see the NVIDIA deep dive.
Advertising: the quiet second engine
If AWS is the power plant, advertising is the toll booth, and it is the most attractive part of the business model. Amazon charged $68.6 billion for advertising services in 2025, up 22 percent, and trailing revenue crossed $70 billion in the first quarter of 2026. Amazon does not disclose the segment’s operating margin, because the costs are spread across the retail segments rather than reported separately. The widely cited estimate is an incremental contribution margin of 75 to 80 percent, and a blended operating margin north of 60 percent. That figure is an estimate, not a disclosed fact, and no named analyst house publishes a verifiable segment-level margin, so treat it as the best available approximation rather than a number.
The mechanism is what makes it durable. Sponsored products, which industry estimates put at roughly 80 percent of the ad line, are not optional marketing for most of the two million active sellers. They are the cost of being found. A seller already pays a referral fee (typically 8 to 15 percent by category) and fulfillment fees; the sponsored-products bid sits on top, and it is close to non-discretionary because organic visibility without it is thin. The infrastructure that serves those ads (the storefront, the audience, the purchase-data pipes) already exists for the retail business, so the marginal cost of one more ad is near zero. That is why each dollar of ad revenue bypasses most of the retail cost base and flows almost straight to operating income, and why analysts describe advertising as the engine that subsidizes the retail business.
The moat is the data. Amazon does not just know who saw or clicked an ad. It knows who bought, what they bought, and what they bought before and after, at the level of individual products, and Amazon Marketing Cloud now lets advertisers query five years of that purchase history. Google knows search intent and Meta knows social engagement, but neither can close the loop to a physical-commerce purchase the way Amazon can. That closed loop is why Amazon holds roughly three-quarters of US retail-media ad spend by eMarketer’s 2025 estimate, with Walmart Connect a distant second at around $4.4 billion, roughly 15 times smaller. Those share and competitor figures are analyst estimates from a single research house, so read them as directional.
Prime Video is the newer overlay. Ads launched on Prime Video in early 2024, and Amazon disclosed 315 million global ad-supported viewers as of the fourth quarter of 2025. The revenue it adds flows into the advertising line, not the subscription line. Analyst estimates of how much vary widely, from roughly $2 billion to $4 billion in 2025 depending on whether they count only Prime Video inventory or also demand-side-platform buys against it, so any single number is an estimate. Live sports (Thursday Night Football, NBA) anchor premium ad pricing and viewer retention. The honest summary on advertising: exceptional, structural economics, with the single real disruption vector being a regulator that forces the marketplace search ranking apart from paid placement.
The retail and logistics flywheel
The retail body is not where the profit is, but it is where the scale is, and the scale is what makes everything else work. The flywheel logic is old and it still runs: Prime members and organic traffic attract third-party sellers, who add selection and price competition, which drives more purchases, which generates the data that powers advertising, which subsidizes lower prices and faster shipping, which brings more members. Prime is the connective tissue. According to a third-party consumer-research estimate widely cited in the industry, Prime members spend roughly two and a half times what non-members spend; Amazon does not publish this figure itself, so treat the ratio as directional rather than precise. The subscription fee buys the shipping, video, and music that lock in the habit. Amazon has not disclosed a Prime membership count since 2021; the widely cited figure of roughly 230 million globally is an analyst estimate, not a company number.
The economics of the retail engine are improving in a way that matters. North America operating margin went from negative 0.9 percent in 2022 to 6.9 percent in 2025 and 7.9 percent in the first quarter of 2026. Two things drove that. The first is the advertising mix shift, where high-margin ad revenue grows faster than low-margin retail. The second is real operating leverage in fulfillment: Amazon regionalized its US network (so goods ship from closer warehouses), and it has automated heavily, crossing one million robots in its facilities in 2025. In the first quarter of 2026, fulfillment expense grew 9 percent while units grew 15 percent, which is the signature of automation delivering leverage. International is on the same path, three to four points behind, held back by lower advertising penetration and higher localization cost.
The competitive scare of 2024, the Chinese cross-border players Temu and Shein, turned out to be largely self-limiting. Temu went from under 1 percent of US cross-border e-commerce in 2022 to about 24 percent by 2025, concentrated in ultra-cheap, unbranded goods rather than Amazon’s core marketplace. Then US trade policy closed the de minimis exemption that let sub-$800 packages enter duty-free, effective May 2025, and Temu’s US app ranking collapsed from number 3 to number 85 almost overnight. Amazon’s own low-cost answer, Amazon Haul, is a containment play rather than a growth engine. The structural read is that Amazon’s moat (fulfillment speed, Prime loyalty, deep reviews, and advertised selection) held for everything above the bargain-bin tier.
One stress signal is worth flagging, because it sits at the source of the advertising profit. In April 2026, CNBC reported a seller boycott of sponsored ads, with sellers saying they were “running out of margin.” Amazon has been raising fulfillment fees gradually (small increases in January 2026 after freezing them in 2025). The take-rate lever is real but slow, and pushing it too hard risks the health of the seller base that funds the ad engine. That is a genuine tension, not a crisis, but it is the kind of thing that compounds quietly.
Who wins where
Amazon competes in four arenas at once, and it does not win all of them outright.
- Cloud. AWS leads on absolute size and is reaccelerating, but Azure and Google Cloud are growing faster in percentage terms, and Oracle is a fast-rising fourth on aggressive AI-infrastructure pricing. The economics stay with whoever owns the customer’s architecture and the lowest cost of compute, which is why AWS’s custom silicon matters.
- Retail and e-commerce. Amazon is the dominant US player at roughly 36 to 40 percent of online retail depending on the source, with Walmart a distant second. Walmart is growing e-commerce faster off a smaller base and has a real second flywheel in its stores and Sam’s Club. Shopify powers roughly 10 percent of US e-commerce by enabling independent merchants, and Costco has its own direct-to-member loyalty that does not touch the Amazon marketplace at all. PDD’s Temu attacked the bottom and was blunted by tariffs.
- Advertising. Amazon owns retail media, but it is the number-three digital advertiser overall behind Meta and Google, which together still dwarf it. The prize Amazon is taking is the budget that wants closed-loop commerce attribution.
- AI infrastructure. Every hyperscaler is both Nvidia’s customer and its would-be replacement. Amazon’s Trainium is the most-committed custom alternative by dollar value, but Nvidia’s CUDA software ecosystem remains the default, and Amazon, like everyone, still depends on TSMC to fabricate its chips.
For the wider AI-compute picture and where the economics actually sit, the toll-taker view is laid out in the NVIDIA deep dive; for the cloud-and-advertising twin of this story, see the Alphabet deep dive.
Company by company: who’s who in the AMZN orbit
Each name below carries one dated, sourced result and a one-line bull and bear. Market caps and prices are point-in-time as of June 22, 2026 and move fast.
Amazon.com, Inc. (AMZN), the subject. The world’s largest e-commerce marketplace, the leading cloud platform in AWS, a fast-growing advertising business, the Prime bundle, and a set of emerging bets - One Medical in healthcare, Amazon Pharmacy, Project Kuiper in satellite broadband, and Zoox in autonomous vehicles. These bets are not separately valued here; they are optionality on top of the four core engines, collectively meaningful in the long run but not load-bearing in the near-term thesis. First quarter of 2026: revenue up 17 percent to $181.5 billion, AWS up 28 percent to $37.6 billion, advertising up 24 percent to $17.2 billion, operating income up 30 percent to $23.9 billion at a record 13.1 percent margin. Market cap about $2.51 trillion. Bull: AWS reacceleration plus high-margin advertising at scale set up durable margin expansion as the retail cost base shrinks on robotics and regionalization. Bear: roughly $200 billion of annual capex creates a multi-year depreciation headwind at a near-zero free-cash-flow yield, and the AI-lab-heavy backlog may convert slowly.
Microsoft (MSFT), cloud peer. Office, Azure, GitHub, LinkedIn, and a deep AI layer in Copilot. Third quarter of fiscal 2026: revenue up 19 percent to $82.9 billion, Azure up 40 percent, AI run rate past $37 billion. Market cap about $2.74 trillion. For a fuller read on where Microsoft’s AI capex bet stands, the Microsoft deep dive covers the Azure-versus-AWS cloud-wars dynamic in detail. Bull: Azure reaccelerated to 40 percent with the clearest paid-AI conversion path of any hyperscaler. Bear: its roughly $627 billion commercial backlog is heavily concentrated in OpenAI, and the data-center build weighs on cash for years.
Alphabet (GOOGL), cloud and advertising peer. Search, YouTube, Google Cloud, Android, Waymo, and the Gemini model family. First quarter of 2026: revenue up 22 percent to $109.9 billion, Google Cloud up 63 percent to $20.0 billion with backlog near $460 billion, 2026 capex guided to $180 to $190 billion. Market cap about $4.24 trillion (vendor figures for the period vary). For how a similarly large-scale advertising franchise navigates the AI transition and antitrust overhang, the Alphabet deep dive runs those scenarios side by side. Bull: two high-margin engines, Search and a 63-percent-growth cloud, compounding at once. Bear: AI-generated answers risk eroding Search clicks over time, and a DOJ remedy could reshape Search distribution.
Walmart (WMT), retail peer. The largest retailer by revenue, with a fast-scaling Walmart Connect ad network and growing marketplace. First quarter of fiscal 2027: revenue up 4.5 percent to $177.8 billion, global e-commerce up 26 percent, advertising up 37 percent. Market cap about $0.93 trillion. Bull: store density plus an accelerating ad business give it a second flywheel Amazon cannot easily copy in brick-and-mortar. Bear: it trades at the richest forward multiple in this set (around 39 times), which leaves no room for an ad or e-commerce stumble.
Meta Platforms (META), advertising peer. Facebook, Instagram, WhatsApp, with about 99 percent of revenue from advertising. First quarter of 2026: revenue up 33 percent to $56.3 billion, operating margin 41 percent. Market cap about $1.59 trillion. Bull: AI-driven ad ranking is lifting both price per ad and volume, funding its own AI build. Bear: near-total reliance on one ad segment makes it acutely exposed to any budget pullback or targeting regulation.
PDD Holdings (PDD), e-commerce threat. Pinduoduo in China and Temu cross-border. Fourth quarter of 2025: revenue up 12 percent, with operating profit down on Temu expansion costs. Market cap about $121 billion. Bull: the low-cost model forced Amazon and Walmart to launch their own value tiers. Bear: US de minimis changes directly attacked Temu’s cross-border pricing, and its US momentum has already been blunted.
Oracle (ORCL), cloud-infrastructure peer. Enterprise databases plus a fast-growing Oracle Cloud Infrastructure. Third quarter of fiscal 2026: revenue up 22 percent, cloud up 44 percent, AI-infrastructure revenue up 243 percent. Market cap about $530 billion. Bull: aggressive pricing and GPU availability let OCI capture AI demand the big three cannot satisfy on price. Bear: OCI is still a fraction of the top three and its backlog is concentrated in a few AI mega-deals, the same circular-financing risk that hangs over the sector.
NVIDIA (NVDA), AI-infrastructure supplier. The dominant GPU and AI-networking vendor, and the CUDA software ecosystem. First quarter of fiscal 2027 (ended April 2026): record revenue up 85 percent to $81.6 billion, Data Center up 92 percent. Both a key AWS supplier and a competitor through Trainium. Market cap about $5.14 trillion. Bull: the CUDA moat and a performance lead leave hyperscalers no credible near-term alternative for frontier training. Bear: every hyperscaler, AWS included, is building custom silicon to cut its Nvidia dependence.
What the filings say
The 10-K for 2025 and the 10-Q for the first quarter of 2026 tell a consistent story: extraordinary scale, widening margins, and a cash flow statement bent almost in half by capex.
Revenue and margins. Revenue grew from $574.8 billion in 2023 to $638.0 billion in 2024 to $716.9 billion in 2025, then 16.6 percent year over year in the first quarter of 2026 to $181.5 billion. Operating income widened from $36.9 billion (6.4 percent) in 2023 to $80.0 billion (11.2 percent) in 2025, and hit a record 13.1 percent in the first quarter of 2026. The margin expansion is the AWS-and-advertising mix shift showing up at the consolidated line. The one cost line worth watching is technology and infrastructure, which jumped about $20 billion in 2025 to $108.5 billion, partly the depreciation of the build starting to land.
A quality-of-earnings flag on net income. GAAP net income was $77.7 billion in 2025 (diluted EPS $7.17) and $30.3 billion in the first quarter of 2026. Read those carefully. First-quarter net income included a $16.8 billion pre-tax unrealized gain from marking up Amazon’s Anthropic stake to fair value, a non-cash item that has nothing to do with operating performance. The clean way to judge profitability is segment operating income, not headline net income, because mark-to-market swings on the Anthropic position can dominate a quarter in either direction.
Cash flow, the crux. Operating cash flow rose to $139.5 billion in 2025 and $148.5 billion on a trailing basis through the first quarter of 2026. Capex went the other way and up: $52.7 billion in 2023, $83.0 billion in 2024, $131.8 billion in 2025, and a roughly $147 billion trailing pace. The result is that reported free cash flow, which Amazon defines as operating cash flow minus capex, collapsed from about $32 billion in 2023 and 2024 to roughly $1.2 billion on a trailing basis through the first quarter of 2026. Capex consumed more than 99 percent of operating cash. Management calls this deliberate timing rather than impairment, and quoted the dynamic directly: in periods of very high growth, when capex outpaces revenue, the early years’ free cash flow is challenged.
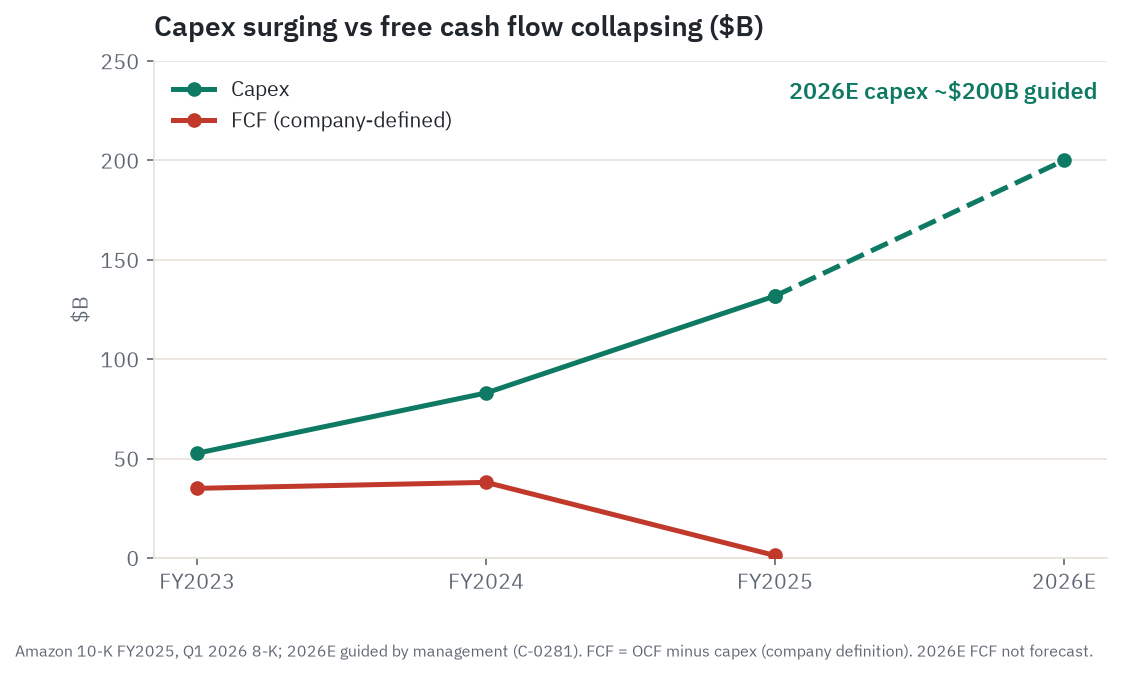
Depreciation, the mechanical part of the bear case. Depreciation and amortization rose from $52.8 billion in 2024 to $65.8 billion in 2025, and the first quarter of 2026 annualizes to roughly $75 to $76 billion, before the $200 billion of 2026 assets are even placed in service. Depreciation hits the income statement whether or not the matching revenue has arrived, which is exactly why the margin-versus-depreciation race is the thing to watch.
Balance sheet and the shift to net debt. At the end of 2025 Amazon had about $123 billion of cash and securities against $68.8 billion of long-term debt, roughly $54 billion net cash, a fortress. Then in March 2026 it issued about $53.8 billion of new notes ($37 billion in dollars, about $16.8 billion in euros) for general corporate purposes, including to fund the $50 billion OpenAI commitment. That took long-term debt to $122.6 billion and flipped the balance sheet to roughly $20.5 billion net debt for the first time in years. The debt is well-structured (a 14-year weighted-average maturity, no financial covenants), but the posture has changed.
Capital returns and dilution. Amazon has never paid a dividend and has not repurchased a single share in 2023, 2024, or 2025, with about $6.1 billion of buyback authorization sitting unused. The diluted share count grew by roughly 335 million shares over two years, entirely from stock-based-compensation vesting, though that expense is declining ($24.0 billion in 2023 to $19.5 billion in 2025).
Guidance. For the second quarter of 2026, management guided revenue of $194 to $199 billion (16 to 19 percent growth) and operating income of $20 to $24 billion. The 2026 capex guide of roughly $200 billion is the single most important forward number management has given, and it is what triggered the early-2026 selloff.
Ownership. Jeff Bezos holds about 8.8 percent and is no longer an officer or director; CEO Andy Jassy holds well under 1 percent, with pay that is mostly stock. Vanguard (7.2 percent) and BlackRock (5.9 percent) are the typical large-cap passive holders. There was no insider buying or selling of consequence in the record reviewed.
What Amazon itself flags as risk. The 10-K is candid that investments in new technologies may not pay off, with explicit language that the value of those investments could be written down. It flags tariffs and trade policy as a risk to results, and it names intensifying competition across cloud, retail, advertising, and AI infrastructure at once.
What the market is paying
Everything in this section is point-in-time as of June 22, 2026 and moves daily.
Price and recent action. AMZN closed at $233.80, down 4.36 percent on the day, extending a rough stretch driven by AI-capex anxiety. The 52-week range is roughly $196 to $278.56, so the stock sits just below the midpoint and about 16 percent off its high. It fell roughly 21 percent from that high to a February 2026 low near $196 after the $200 billion capex guide. This is a high-beta stock (1.44), more volatile than Alphabet or Meta and in a different league from Walmart (0.60). It is not a calm holding.
Relative strength. AMZN returned about 1.2 percent year-to-date and about 11 percent over one year, lagging both the broad index and its mega-cap peers over those windows. Over three years it is up about 89 percent, a strong outperformer reflecting the recovery from the 2023 trough. The near-term picture is the laggard of its group; the multi-year picture is a winner. The capex narrative is why the market has discounted the AWS earnings power: free cash flow near zero makes the stock screen badly on the most-watched cash metric.
Valuation multiples. The figures bounce by vendor, so read them as ranges. Trailing price-to-earnings is roughly 29 to 30 times, forward roughly 29 to 31 times, and EV/EBITDA roughly 15 to 17 times (the spread there is mostly how each vendor treats Amazon’s large lease obligations). Price-to-sales is around 3.5 to 3.9 times. Price-to-free-cash-flow is not a usable metric while capex runs this hot, since trailing free cash flow is near zero.
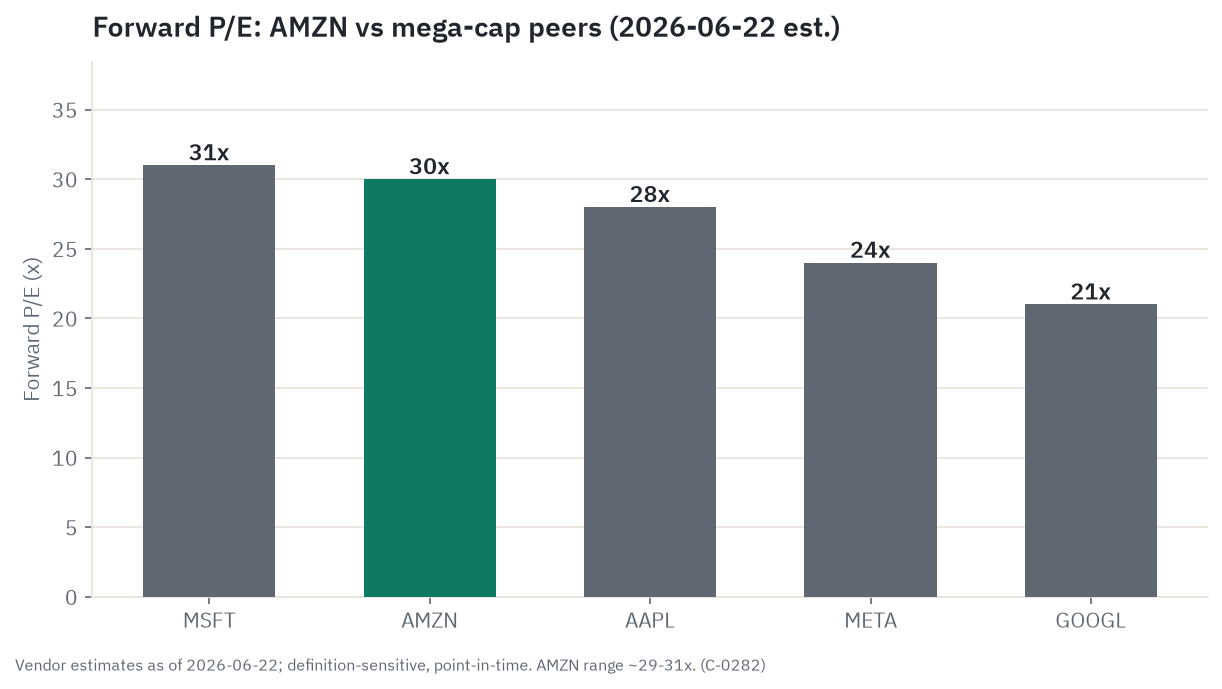
Cheap versus its own history, but that anchor is broken. Amazon’s 10-year median price-to-earnings is roughly 79 times, so today’s roughly 29 times is about 63 percent below it, the lowest in well over a decade. That comparison is misleading. The business changed regime, from suppressing earnings through reinvestment to actually reporting large GAAP profit, so the historical median is the wrong anchor. The real question is whether 29 to 31 times forward earnings is right for a business growing revenue around 14 percent with AWS at 28 percent and advertising in the low 20s. Against the peer set it is mid-to-slightly-rich (Microsoft trades around 20 times forward, Meta around 18), and it carries that near-zero free-cash-flow yield. For how a similar “cheap on the multiple, expensive on the cash” debate plays out at another mega-cap, the Apple deep dive frames the valuation question well.
The sum-of-the-parts argument. The bull case leans on valuing the engines separately. Roughly: AWS at $150 billion annualized and 28 percent growth might be worth $1.5 to $1.95 trillion at cloud multiples; advertising at over $70 billion might be worth $0.5 to $0.63 trillion; the retail, subscription, and other businesses at low multiples might add $0.2 to $0.36 trillion; net of debt and leases that frames an equity value of roughly $2.0 to $2.74 trillion against the current $2.51 trillion market cap. This is illustrative arithmetic using observable peer multiples, not a sourced valuation model and not a price target. At $233.80 the stock sits in the middle of that rough range: not obviously cheap, not obviously expensive.
Liquidity and short interest. AMZN is among the most liquid stocks on earth, trading $10 to $11 billion a day. Short interest is under 1 percent of float and falling, so there is no squeeze dynamic and no heavy bearish positioning.
Sell-side, as opinion not fact. As of June 2026, aggregated consensus was Strong Buy, with an average price target around $313 (high $370, low $207). That average implies the Street thinks AMZN should trade around 38 to 40 times forward earnings, a re-rating from here. Treat this as a data point with a known buy-side bias on large-cap coverage. The single most useful tell is that the lone bear’s target ($207) is below the current price, and consensus is about as one-sided as it gets.
What the crowd is saying
Sentiment is signal, not fact, and it is soft. The honest summary is that the dominant 2026 story is a single tension: AWS reacceleration against AI-capex-driven free-cash-flow compression, and on the research date the mood was cooling toward the bear side.
The narrative arc is datable. The 2024-into-2025 frame was “Amazon is winning AI.” After the February 2026 capex guide, which sent the stock down roughly 11 percent in after-hours on the spending number rather than the AWS beat, the frame shifted to “can Amazon afford to win AI.” By late May the market had largely shrugged off the free-cash-flow collapse, then re-engaged with it on June 22 when the combined hyperscaler capex burden (about $452 billion across five companies) became a sector-wide story and AMZN fell roughly 4 percent alongside Alphabet.
Retail and social chatter is moderate, not meme-stock heavy, and reads as organic, with a February spike that tracks cleanly to the earnings catalyst rather than any coordinated campaign. The stock is far too large and too institutionally owned for retail-driven manipulation to matter. Third-party sentiment scores put AMZN in a constructively divided range rather than euphoric.
The sharpest divergence the sentiment data surfaces is real and worth holding onto. The crowd’s bull narrative prices in AWS monetization speed that the free cash flow does not yet confirm. The sell-side is near-unanimous (Strong Buy, average target around $313), and unanimity that extreme into an unproven capex cycle is a soft warning, not a comfort. A secondary divergence sits inside the company: management sells an efficiency-and-margin story the market accepts, while the ground-level signal (a contested return-to-office mandate, rolling layoffs, and an April 2026 seller boycott of sponsored ads) tells a story of internal friction. None of that obviously moves the stock this quarter, but it is a latent risk to seller-ecosystem health and innovation pace. And the FTC trial is underweighted in the crowd’s attention relative to the AI-capex debate. Readers should not mistake “unanimous analysts plus a coherent AI story” for “low risk.”
Is the machine durable?
Put the macro and micro together and the durability question splits cleanly.
The structural case. AWS sits on a deep switching-cost moat (re-architecting workloads off AWS primitives is expensive in engineering time and risk), a custom-silicon cost advantage, a $364 billion contracted backlog, and an AI tailwind that pushes compute intensity up rather than down. Advertising sits on a first-party purchase-data moat that Google and Meta cannot replicate at the SKU level, with three-quarters of US retail media. The retail body is finally throwing off operating leverage as regionalization and one million robots compress cost-to-serve. Cloud demand is secular, advertising is a structural toll, and retail is at a margin inflection. That is a strong franchise by any measure.
The cyclical and structural bear. The trigger does not require a recession. It is a slow grind: depreciation steps from $66 billion toward $90 billion as the 2026 assets are placed in service, AWS margin compresses from 37 percent back toward the low 30s, one or two AI-lab anchor tenants renegotiate or under-consume committed capacity (their own losses forcing discipline), so a slice of the backlog never converts, reported free cash flow stays near zero or negative into 2027 and 2028, and the market re-rates AWS from a 10-to-13-times revenue multiple toward 6 to 8 times. The timing risk is concrete: monetization arrives a year late while depreciation arrives on time. Layer in the FTC remedy (trial scheduled for March 29, 2027) and the EU’s Digital Markets Act, both aimed at the exact Buy Box, fulfillment-tying, and self-preferencing mechanics that make the advertising and marketplace engine work, and the two businesses carrying the valuation both have an unpriced structural overhang. Amazon denies the FTC allegations; there has been no finding of liability.
The most-likely split. The franchise is durable; the cash generation is temporarily not. The base case is that AWS keeps growing 20-percent-plus on reported revenue while its margin troughs and recovers, advertising compounds in the high teens to low 20s, capex peaks in 2026, and free cash flow inflects to meaningfully positive by 2028 or 2029. That is a fair-value compounding story, not a screaming bargain and not a value trap, which is why the read lands where it does.
The scenarios in detail
The whole five-year outcome reduces to four variables, and every scenario below is just a different setting of them.
- AWS revenue growth and the monetization lag. AWS is about 18 percent of revenue and 57 percent of operating income, so the bull case rests on the $364 billion backlog and the more-than-$15 billion AI run-rate converting on management’s stated 6-to-24-month lag. Bull: 28 to 30 percent sustained. Base: decelerating from 28 percent toward the low 20s. Bear: sliding to the high teens as the backlog converts slowly or partly fails to convert.
- AWS operating margin versus the depreciation ramp. Bull: margin holds in the high 30s as utilization fills ahead of the depreciation curve. Base: compresses to the low 30s for two or three years, then recovers. Bear: compresses into the high 20s as depreciation outruns revenue.
- Free cash flow and capital intensity. Trailing free cash flow is about $1.2 billion on a $2.5 trillion market cap. The driver is when it inflects back to tens of billions: bull in 2027, base in 2028 to 2029, bear not within the horizon. (Whether 2026 reported free cash flow goes outright negative depends on a roughly $155 billion operating-cash-flow estimate that management has not guided, so treat a negative 2026 figure as a scenario, not a fact.)
- The advertising and marketplace engine and its regulatory overhang. Advertising (about $69 billion) plus third-party services ($172 billion) carry the non-AWS profit. Bull: regulation is a slow nuisance. Base: narrow remedies trim but do not break it. Bear: a structural remedy redirects $20 to $40 billion of ad revenue.
Behind all four sits the multiple. The base case assumes it drifts toward the high 20s as earnings grow into it; the bull assumes a re-rating as free cash flow inflects; the bear assumes compression as the capex returns disappoint.
Bull, “the capex earns out.” AWS sustains 28 to 30 percent as the backlog converts on schedule, margin holds in the high 30s, advertising compounds above 20 percent, and free cash flow inflects to tens of billions by 2027 as capex growth moderates off the 2026 peak. Revenue compounds toward $1.1 to $1.2 trillion by 2030, operating income roughly doubles toward $160 billion-plus, and GAAP EPS reaches roughly $16. Illustrative value around $720 by year five (about $16 EPS at a 40-to-44-times multiple, or the top of the sum-of-the-parts range), an estimate, not a target. What must be true: the monetization lag is real and short, and Trainium-led AI compute is genuinely accretive. Most likely to break it: the backlog is partly double-ordered or concentrated in cash-burning labs that under-consume their committed capacity.
Base, “steady compounding, free cash flow normalizes late.” AWS decelerates gracefully from 28 percent toward the low 20s, margin compresses to the low 30s for two or three years then recovers, advertising compounds in the high teens to low 20s, capex peaks around $200 billion in 2026, and free cash flow inflects to meaningfully positive by 2028 or 2029. Revenue reaches roughly $1.0 to $1.1 trillion by 2030, operating income toward $120 to $130 billion, GAAP EPS (excluding one-off Anthropic marks) toward $13 to $14. Illustrative value around $470 by year five (about $13 to $14 EPS at roughly 33 times), $355 at year three, $265 at year one. What must be true: AWS keeps growing 20-percent-plus while margin troughs and recovers, and free cash flow inflects on a believable, if delayed, timeline. Most likely to break it: depreciation steps to $90 billion-plus faster than utilization fills, holding margin and cash down a year or two longer than modeled.
Bear, “the slow grind” (the skeptic’s case). AWS reported revenue still grows but margin compresses toward the high 20s as depreciation outpaces it; one or two AI-lab anchor tenants renegotiate or under-consume, so a slice of the $364 billion backlog never converts; reported free cash flow stays near zero or negative into 2027 and 2028 from a roughly zero starting yield; the FTC remedy plus the EU’s rules trim the self-preferencing engine; and the market re-rates AWS from 10-to-13-times revenue toward 6 to 8 times. No recession is required, only monetization arriving a year late while depreciation arrives on time. Revenue still grows (roughly $900 billion to $1.0 trillion by 2030) but operating income stagnates, and the equity de-rates 30 to 45 percent on multiple compression rather than an earnings collapse. Illustrative value around $215 by year five, $195 at year three, $180 at year one. A de-rating, not an impairment: the franchise still has real value at the floor. What must be true for the bear to win: the capex-to-revenue bridge cracks on demand, depreciation, utilization, or anchor-customer creditworthiness. What rescues the bull: a clean free-cash-flow inflection in 2027 that proves the lag was real.
Catalyst timeline. Near term: Q2 2026 earnings (estimated July 30), the single biggest near-term mover, watched for AWS growth and margin versus 37.7 percent and any read on free cash flow; Q3 2026 in late October; the holiday-quarter print in early February 2027, which carries the 2027 capex guide (the 2025 equivalent of that guide is what triggered the selloff). Multi-year: the FTC monopolization trial (scheduled March 29, 2027; Amazon denies the allegations; no finding of liability); the 2027-to-2029 free-cash-flow inflection window, the load-bearing event; and ongoing EU Digital Markets Act enforcement.
Leading indicators to watch. AWS segment operating margin quarter by quarter is the single most important read (above the high 30s is bull, stuck in the low 30s is base, drifting to the high 20s is bear). Then AWS revenue growth, trailing free cash flow, the forward capex guide, depreciation as a share of AWS revenue, backlog growth and any disclosed customer concentration, and advertising growth against the FTC docket.
Companies to watch (bull / base / bear)
Amazon (AMZN), the subject. Bull: AWS holds high-20s growth, margin recovers above the high 30s, free cash flow inflects in 2027, FTC remedy is narrow. Base: AWS decelerates to the low 20s, margin troughs in the low 30s then recovers, free cash flow normalizes by 2028 or 2029. Bear: margin slides to the high 20s, an anchor lab renegotiates, free cash flow stays near zero through 2027, a structural FTC remedy bites. Watch: the AWS-margin print, trailing free cash flow, the 2027 capex guide.
Microsoft (MSFT), the cloud read-across. Bull: Azure holds 40 percent with Copilot monetizing. Base: Azure stays in the 30s, the build weighs on cash. Bear: the backlog’s OpenAI concentration unwinds (ex-OpenAI it grew about 26 percent, not 99). Watch: Azure growth ex-OpenAI, capex versus cash.
Alphabet (GOOGL), the cloud-and-ad twin. Bull: 63-percent cloud growth and a $460 billion backlog compound alongside Search. Base: cloud stays strong, Search holds despite AI answers. Bear: AI Overviews erode Search clicks, a DOJ remedy reshapes distribution. Watch: Search ad revenue trend, the DOJ docket.
NVIDIA (NVDA), the supplier and the canary. Bull: CUDA and the performance lead hold, hyperscaler demand stays strong. Base: growth decelerates off a peak but stays high. Bear: a capex pause across the hyperscalers re-rates a low multiple against falling forward earnings. Watch: hyperscaler capex guides (Amazon’s $200 billion is part of NVIDIA’s order book), custom-silicon share.
Risk controls
The honest risk list, in rough order of how much it matters.
- A near-zero free-cash-flow yield with no cushion. Trailing free cash flow is about $1.2 billion on a $2.51 trillion market cap. If 2026 capex lands near $200 billion against roughly $155 billion of estimated operating cash flow, reported free cash flow could be negative for the year. That is a scenario built on an unguided estimate, not a fact, but it is the central risk: there is no spare cash to absorb a monetization miss.
- The depreciation wave is mechanical. Depreciation rose from $66 billion to a roughly $76 billion annualized pace and will keep climbing as the 2026 assets go live. It hits the income statement regardless of revenue.
- Profit concentration in AWS. A single 18-percent-of-revenue segment produces 57 percent of operating income. A margin slip or growth stall there moves the whole stock.
- Backlog concentration and creditworthiness. A material slice of the $364 billion backlog traces to AI labs that are themselves burning cash, which is the substance behind the circular-financing characterization that critics raise.
- Regulation aimed at the profit engine. The FTC monopolization trial is scheduled for March 29, 2027; Amazon denies the allegations, and there has been no finding of liability. The EU’s Digital Markets Act targets the same Buy Box, fulfillment-tying, and self-preferencing mechanics behind the advertising and marketplace profit. Both are pending matters with uncertain outcomes.
- Consumer cyclicality and tariffs. Most revenue is US consumer spend, and the marketplace leans on Chinese-origin third-party inventory exposed to trade policy.
- Valuation after a regime change. “Cheap versus its own history” is the wrong frame; against peers and on free-cash-flow yield the stock is not cheap.
- Key-person and labor. A contested return-to-office mandate, rolling layoffs, and a seller-ad boycott are latent risks to seller-ecosystem health and execution.
What changes the thesis, in one line: a clean, durable free-cash-flow inflection in 2027 (toward a Buy) or a confirmed AWS-margin slide into the high 20s, or a structural FTC remedy (toward a Sell).
Methodology, sourcing, and data-quality flags
This piece is built from Amazon’s own filings (the 2025 10-K, the first-quarter 2026 10-Q, recent 8-Ks, and the 2026 proxy, all on SEC EDGAR), the company’s earnings releases and call transcripts, third-party market data (stockanalysis.com, Yahoo Finance, Barchart), analyst-house research where named (Synergy Research for cloud share, eMarketer for advertising and retail-media share), and reputable trade press. Every load-bearing figure traces to a recorded claim with a source and a tier (primary filing, named analyst house, press, or estimate). Forward scenarios are arithmetic from stated assumptions and are labeled estimates, never price targets.
The five-factor read, in plain prose.
Valuation nets to mildly cheap with an asterisk. AMZN trades at roughly 29 to 31 times forward earnings (an estimate that varies by vendor), about 63 percent below its own 10-year median, though that median is a misleading anchor because the business changed regime from reinvestment to profitability. It is mid-to-slightly-rich against mega-cap peers and carries a near-zero free-cash-flow yield. The genuine anomaly is EV/EBITDA around 15 to 17 times for a business with roughly $150 billion of annualized AWS revenue growing 28 percent. Net: roughly fair, with a real re-rating option if free cash flow inflects.
Growth is clearly strong. Revenue grew 12.4 percent in 2025 and 16.6 percent in the first quarter of 2026; AWS reaccelerated to 28 percent (the fastest in 15 quarters) on a $364 billion backlog and a more-than-$15 billion AI run-rate; advertising is compounding around 22 percent. The runway in cloud, retail media, and AI compute is large.
Quality is high on the franchise, low on the cash. Operating margin expanded 480 basis points from 2023 to 2025; AWS runs a 35.4 percent segment margin; advertising is an exceptional, roughly 60-percent-plus-margin engine. The blemish is real: company-defined free cash flow collapsed to about $1.2 billion trailing, and the balance sheet swung from about $54 billion net cash to about $20 billion net debt to fund the build.
Risk is clearly negative, and it is where the bear lives. A near-zero free-cash-flow yield, free cash flow plausibly negative in 2026 on roughly $200 billion of capex, a depreciation ramp that hits the income statement regardless of revenue, backlog concentration in cash-burning AI labs, the FTC trial and EU rules aimed at the advertising and marketplace engine, and a 1.44 beta. This factor is what keeps the overall read at Hold rather than higher.
Momentum is roughly neutral. AMZN is the laggard of its mega-cap group year-to-date and over one year, below its 20-day and 50-day moving averages on a souring capex narrative, but sitting on the 100-day and 200-day cluster around $233 to $235 with short interest under 1 percent of float. The Strong-Buy consensus near $313 has not followed the stock down, which is a stale-bull divergence rather than confirmation.
Taken together, the evidence describes a high-quality, reaccelerating franchise priced roughly fairly with a real free-cash-flow-and-depreciation overhang. On balance the read lands at Hold, voiced here as a transparent research signal and not as advice. A clean free-cash-flow inflection plus any multiple recovery would lift the lean toward a Buy; a confirmed AWS-margin slide into the high 20s or an adverse FTC remedy would push it toward a Sell.
Data-quality flags:
- Corrected source figures. A batch of absolute-dollar values in the raw research ledger were corrupted on write (a leading digit dropped). The figures used here are the corrected values confirmed against SEC EDGAR and the prose research, not the raw stored strings. Key anchors verified to EDGAR: 2025 revenue $716.9 billion, operating income $80.0 billion, AWS revenue $128.7 billion and operating income $45.6 billion, advertising $68.6 billion, and the $364 billion AWS backlog from the first-quarter 2026 earnings call.
- Valuation multiples are point-in-time and vendor-dependent. Trailing P/E is shown as roughly 29 to 30 times, forward as roughly 29 to 31 times, and EV/EBITDA as roughly 15 to 17 times, because vendors disagree (the EV/EBITDA spread is mostly lease treatment). All multiples and peer market caps are as of June 22, 2026 and move fast.
- Forecasts are labeled, not stated as fact. eMarketer advertising and retail-media share, Synergy cloud share, and any third-party 2026 capex totals are named-house forecasts or estimates, not facts.
- Estimates that cannot reach primary tier. Prime membership (about 230 million globally), the advertising segment’s operating margin (an estimated 60-percent-plus, 75-to-80-percent incremental), the 3P take rate (about 30 percent), GMV (about $830 billion total, $575 billion third-party), Prime Video ad revenue, and US retail-media share (about three-quarters) are all attributed estimates with the uncertainty stated, because Amazon does not disclose them. The Prime member spend ratio (roughly 2.5 times non-members) is a third-party consumer-research estimate; Amazon does not publish it.
- A quality-of-earnings flag. First-quarter 2026 GAAP net income includes a $16.8 billion non-cash Anthropic mark-to-fair-value gain. Segment operating income is the clean profitability metric.
- Litigation framing. The FTC monopolization trial is scheduled for March 29, 2027; Amazon denies the allegations and there has been no finding of liability. The separate $2.5 billion FTC Prime dark-patterns settlement (September 2025) is closed and primary-sourced; a settlement is not an admission of liability.
- The 2026 negative-free-cash-flow figure is a scenario. It rests on an unguided operating-cash-flow estimate, not company guidance.
Key sources: Amazon 10-K (FY2025) and 10-Q (Q1 2026) on SEC EDGAR (CIK 0001018724); Amazon Q4 2025 and Q1 2026 earnings releases and call transcripts; Synergy Research Group (cloud market share); eMarketer (advertising and retail-media share); stockanalysis.com, Yahoo Finance, and Barchart (point-in-time market data); FTC press releases; and reputable trade press (CNBC, GeekWire, TechCrunch, Marketplace Pulse).
This is OSINT and educational research, not investment advice or a recommendation. Figures are point-in-time as of June 22, 2026 and change quickly. AMZN is a high-beta name inside an active AI-capex cycle and can move sharply on a single earnings print. Verify all figures independently and consult a licensed financial advisor before making any decision.