
Research date: June 22, 2026 | OSINT market research on Meta Platforms, Inc. (META, Nasdaq), its advertising engine, its AI capital-spending cycle, and a five-year bull/base/bear on the stock.
Important disclaimer. This is OSINT-based research and educational analysis, not investment advice. I am not a financial advisor. Nothing here is a recommendation to buy or sell any security, and the scenarios below are illustrative, not price targets. Meta is a single, advertising-concentrated mega-cap with a large and rising capital-spending program; its share price has been volatile and can fall sharply. Market caps, prices, valuation multiples, and market-share figures are point-in-time (June 22, 2026), press-reported where noted, and move fast. Do your own due diligence and consult a licensed advisor.
Where this stock could be in 6 months, 1 year, 3 years, and 5 years
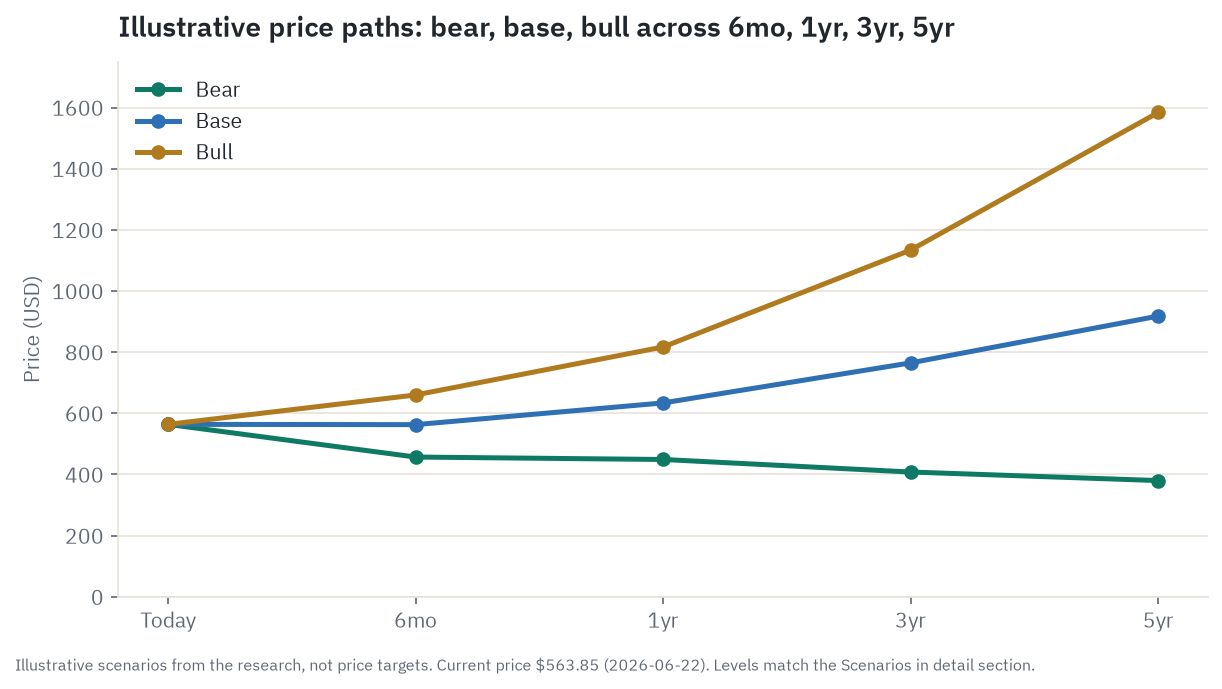
Meta closed at $563.85 on June 22, 2026, down about 17 percent over the trailing year and roughly 29 percent below its August 2025 peak near $796. The scenarios below are illustrative arithmetic - an estimated earnings path times an exit multiple kept inside Meta’s own historical range - and every number is an estimate, not a target.
Six months. This window is the cycle and the next one or two earnings prints, not the long story. Meta guided second-quarter 2026 revenue to $58-61 billion, and the question is simply whether the ad engine keeps printing while management gives investors anything at all on what the capex is buying. The base case is roughly sideways near a multi-year-low valuation, around $563. A clean ad beat plus reassurance on cash flow or a restarted buyback could push it toward $660 (the bull). A soft print, or more likely confirmation of the equity raise the company floated in June, could re-price the balance-sheet leg toward $457 (the bear). The single thing most likely to flip the read: a concrete signpost on capex return, or its conspicuous absence.
One year. The dominant variable is the full-year capex and free-cash-flow reality colliding with ad-growth durability. The base case has ad growth decelerating gracefully toward the high teens, free cash flow going negative as guided but troughing without dilution, and the multiple recovering modestly toward roughly 17.5 times forward earnings: about $634. The bull case is ad growth holding above 20 percent, no equity raise, and a re-rate toward the low-20s multiple, near $817 (which happens to land near where sell-side analysts already sit). The bear is the skeptic’s case arriving early: ad deceleration plus an equity raise plus multiple compression, around $449. The flip: does free cash flow trough shallow, with no new shares issued.
Three years. Now the structural drivers start to show, because the 2026-2027 capex vintage hits the income statement in full through depreciation. The base case is earnings compounding around 11 percent a year at a fair multiple while the AI build slowly earns out: roughly $765. The bull, with capex proven to be returning more than it costs and ad-share gains holding, runs toward $1,134. The bear, with the depreciation wave landing on stalled ad growth and the stock going dead money while Alphabet keeps its premium, sits near $408, below today’s price. The flip: a dated, hit return metric on the spend.
Five years. Pure durability. The base case is the advertising moat compounding, the developing-market revenue runway intact, AI a positive-but-modest contributor, and glasses a small option, landing around $918. The bull is the AI flywheel maturing into a genuine second high-return surface (an AI assistant that monetizes, WhatsApp business messaging at scale, glasses at 20-30 million units a year) with cash flow re-accelerating, toward $1,584. The bear is AI compute staying a capital-hungry, margin-diluting commodity with depreciation permanently weighing on earnings, a de-rate rather than a collapse because the ad franchise still holds a floor, near $380. The flip: did the capex ever prove it was causing the revenue, or did conversational AI quietly disrupt the feed Meta does not yet monetize that way.
Where the read lands today. On balance the read holds at Hold. Meta is the cheapest mega-cap on forward earnings, a roughly 52-percent-margin advertising machine still growing revenue 33 percent, with a net-cash balance sheet, and that is genuinely attractive. But the cheap multiple sits on an earnings number flattered by an accounting choice on server life, while free cash flow inverts into a $125-145 billion spending year that has not yet proven it is causing the revenue it is buying. The one thing most likely to move the read up or down is the same in both directions: whether Meta can show that the AI spend is earning out before the depreciation lands.
Companion tool
Jump to the interactive dashboard to sort and filter every company in the piece, or download the Excel model to flex the scenarios yourself.
TL;DR
Almost all of Meta’s money - 97.6 percent of FY2025 revenue - comes from one place: an advertising auction running across Facebook, Instagram, WhatsApp, and Threads, where about 3.56 billion people a day generate the attention that advertisers bid for. That auction threw off $102.5 billion of segment operating income in 2025 at roughly a 52 percent margin, and in the first quarter of 2026 it accelerated, with ad impressions up 19 percent and price per ad up 12 percent at the same time, the cleanest health signal an ad business can give. The cash is funding three very different bets at once: a $125-145 billion AI capital-spending year, a persistent Reality Labs loss running near $19 billion a year, and a talent-and-model arms race. The stock is the cheapest mega-cap at about 17 to 18 times forward earnings, a wide discount to Alphabet’s roughly 29 times. The single biggest risk is that the cheap multiple is cheap for a reason: free cash flow is guided to turn negative, the earnings number is flattered by a 5.5-year server-life election, and management has not shown that the enormous capex is causing the revenue it is paying for. The base case is a high-quality engine that out-grows its own spending, slowly. The whole bull-bear gap lives in whether the AI spend earns out before the depreciation wave arrives.
Explore it yourself: the interactive dashboard
Open the dashboard in a full screen
The cash machine and the three bets
Picture a single toll booth on the busiest road in the world. Roughly 3.56 billion people drive through it every day, and every time one of them passes, an advertiser somewhere pays a few cents for the chance to put a message in front of them. That toll booth is Meta’s advertising auction, and it collected about $196 billion in 2025. It is one of the most profitable operations of its kind ever built, because once the road exists the cost of letting one more car through is close to zero.
Here is the tension that defines the stock. The toll booth prints cash, and Meta is spending that cash on three things that look nothing like a toll booth. The first is a construction megaproject: data centers and AI chips at a scale of $125-145 billion guided for 2026 alone, more than the company spent in 2024 and 2025 combined. The second is a research arms race, paying frontier prices for AI talent and building proprietary models. The third is a long-shot hardware lab, Reality Labs, that has lost more than $83 billion since 2020 chasing smart glasses and the metaverse. The booth funds all three. The investing question is whether the booth is strong and durable enough to justify the spend, and whether any of the three bets turns into a second booth. That is the analogy; now the money.
How the money flows
flowchart TD
    ADV["Advertisers\n~10M+ active; $196B FY2025 ad spend"]
    AGY["Agencies & Measurement\nWPP/Publicis/IPG; Appsflyer/Adjust\ntake 10-15% on managed buys"]
    AUC["Meta Ad Auction (Advantage+)\nLattice/GEM AI stack; real-time price-per-impression\n97.6% of all Meta revenue"]
    FOA["Family of Apps\nFacebook/Instagram/WhatsApp/Threads\n$102.5B operating income FY2025; 51.6% margin"]
    USR["3.56B Daily Active People\ntime-on-platform = ad inventory\n+4% YoY Q1 2026"]
    OTH["Other Revenue\nWhatsApp paid messaging $2B+ run rate\nMeta Verified; developer fees; $2.6B FY2025"]
    RL["Reality Labs\nRay-Ban glasses 7M units 2025\n$(19.2)B operating loss FY2025"]
    AICAPEX["AI & Data Center Capex\n$72.2B FY2025; guided $125-145B FY2026"]
    NVDA["NVIDIA\nBlackwell GPUs - pre-training dominant\nchokepoint for frontier workloads"]
    AMD["AMD\nInstinct MI450 custom 6GW deal\nest. $60B multi-year"]
    AVGO["Broadcom + Meta MTIA\nco-designed inference ASIC\n>1GW initial; multi-GW roadmap to 2029"]
    TSMC["TSMC (Taiwan)\nfabricates MTIA, NVIDIA, AMD chips\nSINGLE GEOGRAPHIC CHOKEPOINT"]
    HBM["HBM Memory\nSK Hynix (lead), Samsung, Micron\nshortages drove capex raise"]
    DC["Power & Data Centers\nEntergy/Hyperion 5GW Louisiana ~2030\nNebius $27B off-balance-sheet\nWilliams gas; nuclear TBD"]

    ADV -->|"auction bids"| AGY
    ADV -->|"self-serve budgets"| AUC
    AGY -->|"managed spend"| AUC
    USR -->|"attention/impressions"| AUC
    AUC -->|"advertising revenue"| FOA
    FOA -->|"other revenue lines"| OTH
    FOA -->|"subsidizes losses"| RL
    FOA -->|"funds buildout"| AICAPEX
    AICAPEX -->|"GPU procurement"| NVDA
    AICAPEX -->|"custom GPU deal"| AMD
    AICAPEX -->|"ASIC co-design"| AVGO
    AICAPEX -->|"facilities & power"| DC
    NVDA -->|"manufactured at"| TSMC
    AMD -->|"manufactured at"| TSMC
    AVGO -->|"MTIA manufactured at"| TSMC
    NVDA -->|"requires"| HBM
    AMD -->|"requires"| HBM
    AVGO -->|"requires"| HBM
    DC -->|"hosts"| NVDA
    DC -->|"hosts"| AMD
    DC -->|"hosts"| AVGO
    AUC -->|"AI ranking improves inventory"| USR
Read the diagram top to bottom. The money starts with advertisers, ranging from Fortune 500 brands down to a small business running an Advantage+ campaign on a $50 budget. They do not buy fixed slots; they set objectives and budgets, and Meta’s auction decides in real time which ad goes in front of which person at what price. Meta is the toll-taker here, not a price-setter: it owns the road, the targeting data, and the measurement, so it clears the market and takes its cut without holding inventory risk. Large brand spend still routes partly through agencies that take a 10-to-15-percent fee, but Meta increasingly funnels small businesses straight through self-serve tools.
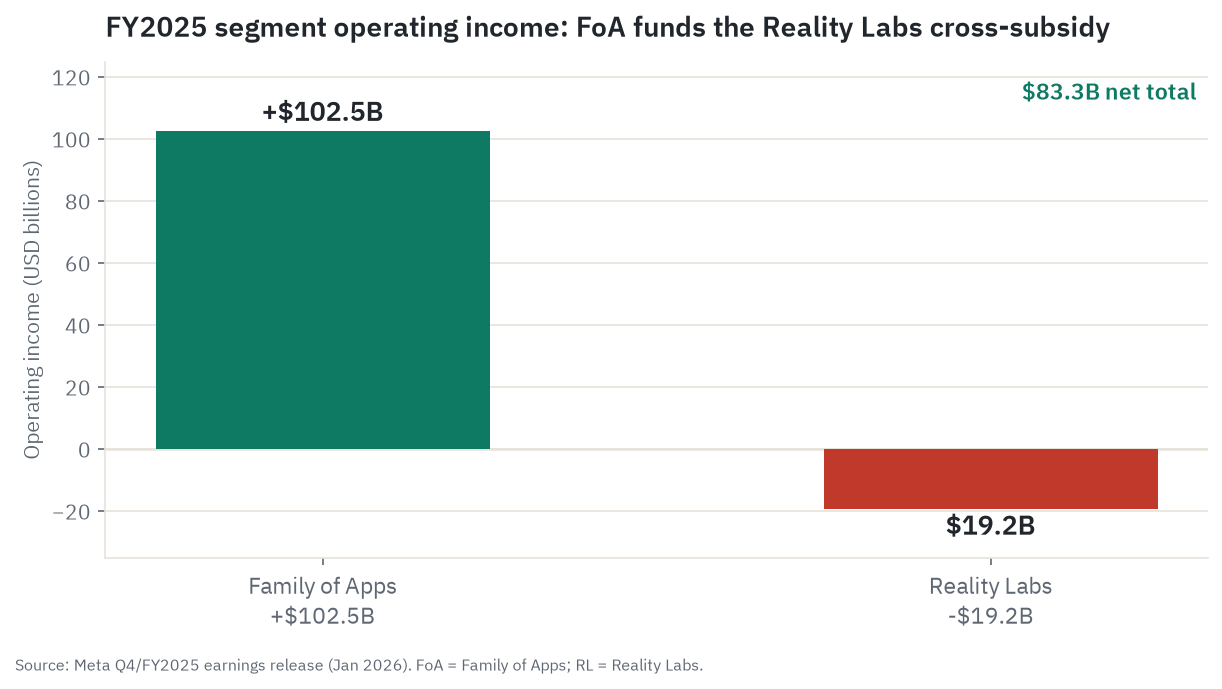
That advertising revenue lands in the Family of Apps segment, which generated $102.5 billion of operating income in 2025 at about a 51.6 percent margin. A small and fast-growing “other revenue” line, $2.6 billion for the year, covers WhatsApp paid business messaging, Meta Verified subscriptions, and developer fees. From there the cash drains outward in two directions that consume it rather than compound it. A modest but expensive stream funds Reality Labs, which lost $19.2 billion in 2025 on $2.2 billion of revenue. The far larger stream funds the AI and data-center buildout, $72.2 billion in 2025 and guided to $125-145 billion in 2026, which flows downstream into a hardware supply chain: NVIDIA GPUs for frontier training, AMD and Meta’s own Broadcom-co-designed MTIA chips (the Meta Training and Inference Accelerator, Meta’s in-house inference silicon built to cut its NVIDIA dependence) for scale and inference, all fabricated by TSMC in Taiwan, all stacked with high-bandwidth memory from SK Hynix and peers, all sitting in data centers that need gigawatts of power.
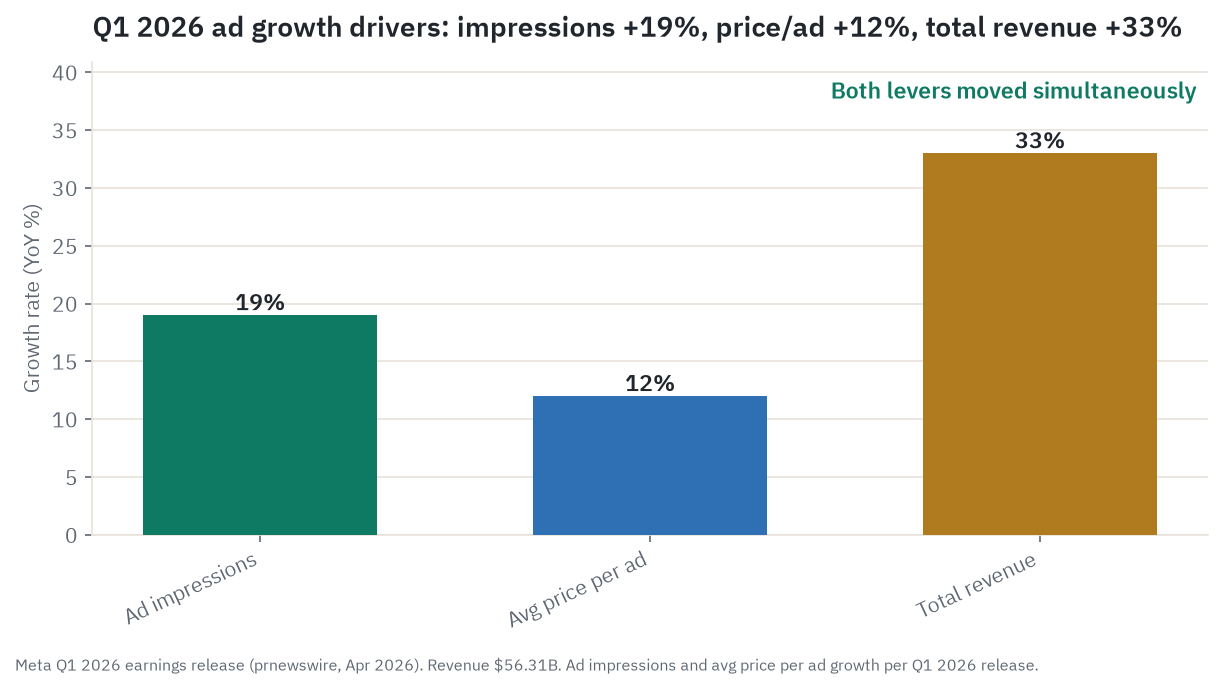
The shape is the whole investing point. There is one engine and several drains. The single most concentrated risk in the chain sits at one node: TSMC’s fabs in Taiwan make the chips for NVIDIA, AMD, and Meta’s MTIA alike, so a Taiwan Strait disruption would constrain every part of Meta’s compute expansion at once. And the logic that justifies the drains is a flywheel: AI capex improves feed and Reels ranking, users spend more time, more ad inventory is created, more advertisers compete, price per ad rises, revenue rises, and that funds more capex. In the first quarter of 2026 both levers moved together for the first time in recent memory, impressions up 19 percent and price up 12 percent, which is the bull’s best evidence that the flywheel is real. Whether it is causal or merely coincident with normal ad-load recovery is the question the rest of this piece keeps returning to.
The advertising engine, up close
Almost everything that matters about Meta runs through this one business, so it is worth taking apart.
The two levers. Advertising revenue is the product of how many ads Meta shows (impressions) and what each one fetches (price per ad). For most of 2025 impressions did the heavy lifting, growing 12 percent for the year while price grew 9 percent, because Meta was expanding inventory faster than it was lifting prices. In the first quarter of 2026 that changed: impressions accelerated to plus 19 percent and price to plus 12 percent, both at once. When both levers rise together it means inventory is growing and advertisers are paying more per unit anyway, which is demand outrunning supply. That is why the quarter mattered so much to the bull case.
Where the revenue comes from. By the location of the user who saw the ad, US and Canada produced $78.9 billion in 2025, about 39 percent of revenue, at by far the highest revenue per person. Asia-Pacific was 27 percent, Europe 23 percent, and the rest of the world 11 percent. Worldwide revenue per person reached $57.03 for 2025 and $15.66 in the first quarter of 2026, up 27 percent year over year. Estimates compiled from Meta’s annual disclosures put a US-and-Canada user at roughly $233 of revenue a year in 2024 versus about $14 in the rest of the world, a gap near 17 times. Those regional per-user figures are third-party estimates, not numbers Meta reports at that granularity, so treat them as directional. The point they make is structural: most of the 3.56 billion daily users sit in regions that are barely monetized, which is the multi-decade runway, but it also means new users add far less revenue than developed-market saturation removes.
The AI targeting story. When Apple’s App Tracking Transparency landed in 2021, it cost Meta a self-reported revenue hit of around $10 billion by destroying the third-party signal that powered targeting. Meta rebuilt the entire stack around its own modeled conversions and on-device inference, and by 2025 the ad trajectory had passed where it would have been without the hit. The current tools carry the Advantage+ brand, and Zuckerberg said on the third-quarter 2025 call that the annual run rate flowing through Meta’s end-to-end AI ad tools had passed $60 billion. By the first quarter of 2026 more than 8 million advertisers were using at least one AI creative tool, roughly double the level at the end of 2024, and most of them were small businesses. The company reports specific lifts from its ranking systems, such as a conversion-rate increase of more than 6 percent from one system upgrade in the first quarter of 2026 and 14 percent lower cost per lead on certain Advantage+ campaigns. These are company-reported figures, useful as direction but not independently audited.
Reels and the deferred upside. Short-form video now accounts for roughly half of combined time spent on Facebook and Instagram, and Reels passed a $50 billion annual revenue run rate by late 2025. The catch, which is actually an opportunity, is that Reels ads have historically priced below Feed ads. Advertiser-facing benchmarks (press estimates, not Meta disclosures) put Feed around $16 CPM (cost per thousand impressions) and Reels closer to $5-7. As advertiser demand fills in that inventory, the gap closes, which lifts revenue independent of any user or impression growth. It is deferred monetization, not a risk.
WhatsApp and messaging. This is the most nascent high-growth surface. WhatsApp paid business messaging crossed a $2 billion annual run rate in late 2025, and click-to-message ads (an ad that opens a WhatsApp chat with a business) grew more than 50 to 60 percent year over year through 2025. Business AI conversations grew roughly tenfold in a single quarter to over 10 million a week. The long bet is that conversational commerce becomes a real ad surface across the billion-plus daily threads between people and businesses.
Threads. Global ad rollout began in January 2026 against about 400 million monthly users, and management is explicit that it is not expected to be a meaningful 2026 revenue driver. It shares the same Advantage+ inventory pool, so advertisers reach Threads users without dedicating separate budgets.
The China concentration. China-based advertisers, mostly cross-border sellers like Temu and Shein, were estimated at about 11 percent of ad spend in 2024, with Temu alone near $1.4 billion. This is invisible in the standard tables because Meta reports revenue by where the user is, not where the advertiser bills. MoffettNathanson put the at-risk tariff exposure as high as $7 billion in a worst case. That worst case has not arrived: Temu reportedly halved its Meta spend since March 2026 and Shein has moved toward exiting the auction, yet the first quarter of 2026 still grew 33 percent because small-business diversification and non-China sellers filled the gap. The risk is managed, not gone, and the de-minimis and tariff status for the second half of 2026 is the live thread to watch.
The AI strategy and the capex bill
This is where the cash goes and where the controversy lives.
The talent war. In June 2025 Meta paid $14.3 billion for a 49 percent non-voting stake in Scale AI, which valued that company around $29 billion, and installed its 28-year-old founder Alexandr Wang as chief AI officer leading the new Meta Superintelligence Labs. Press reports describe compensation packages for top AI hires running into the hundreds of millions, with one reported figure as high as $1.5 billion over six years; those packages are press-reported and not confirmed in filings. The organization has been turbulent. Meta cut roughly 600 roles from its long-horizon research group FAIR in October 2025, and in November Yann LeCun, the 12-year chief AI scientist, left after being asked to report to Wang, going on to raise about $1 billion for his own venture. The signal investors read is that Meta is buying prestige and reorganizing under stress, not obviously winning.
The model strategy. Meta’s logic on models is “commoditize the complement.” It does not sell the model; it sells advertising. By open-weighting its Llama models (over a billion cumulative downloads, tens of thousands of derivatives) it keeps AI infrastructure cheap and commoditized, which drives AI-native apps to build on Meta surfaces and denies rivals an AI moat. In April 2026 it shifted partly proprietary with Muse Spark, the first closed model from the new lab, which now powers the Meta AI assistant across the apps. The competitive read is sober: by year-end 2025 Llama held only about 9 percent of enterprise large-language-model spending against Anthropic near 40 percent, OpenAI near 27 percent, and Google near 21 percent, and Muse Spark ranked outside the top three on public model indices. Those are analyst estimates. Meta AI itself reached an estimated 1.2 billion monthly users by the first quarter of 2026, second only to ChatGPT, so the consumer distribution is real even where the frontier-model position lags.
Custom silicon. To reduce its dependence on NVIDIA, Meta runs a three-vendor strategy. NVIDIA’s Blackwell remains the dominant supplier for frontier pre-training. Meta’s own MTIA chips, co-designed with Broadcom and fabricated by TSMC, handle inference, with a deployment of more than a gigawatt initially and a roadmap extended through 2029. And in February 2026 Meta signed a 6-gigawatt deal for custom AMD Instinct MI450 GPUs, with a warrant for roughly 10 percent of AMD; the headline $60 billion value is a press estimate, while the verifiable cores are the 6-gigawatt capacity and the warrant. The point of three vendors is bargaining power on price and supply.
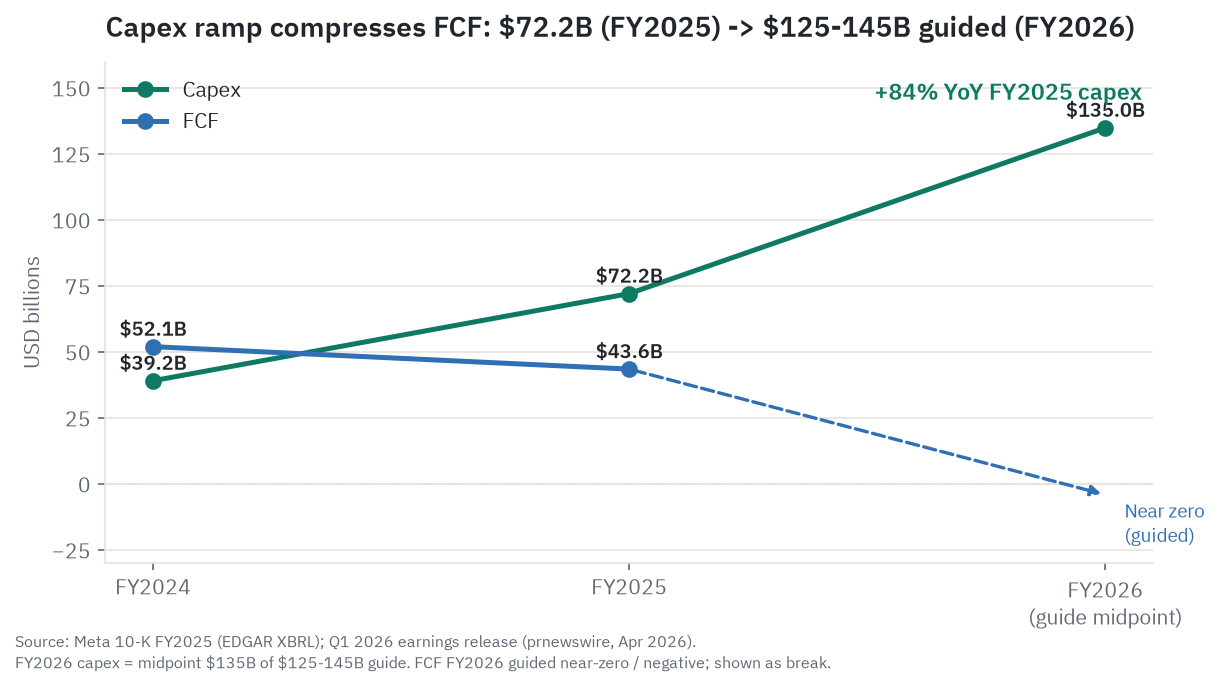
The data-center and power buildout, and what it does to cash. The physical footprint runs to multiple gigawatts: a gigawatt cluster in Ohio coming online in 2026, a Louisiana site (Hyperion) targeting up to 5 gigawatts of compute around 2030 with a reported $200 billion-plus total commitment, and a $27 billion off-balance-sheet capacity agreement with Nebius. The figures behind those individual sites are press and estimate-tier, so the structures matter more than the dollar headlines. What is verifiable is the aggregate effect. Capex was $72.2 billion in 2025, up 84 percent in a year, and is guided to $125-145 billion in 2026, with the midpoint near $135 billion roughly double. Free cash flow was $43.6 billion in 2025, down 16 percent from 2024 as capex outgrew operating cash flow, and it is guided into near-zero or negative territory for 2026. Sell-side estimates for 2027 free cash flow disagree sharply, ranging from about negative $4 billion to about negative $24 billion, so the honest statement is that it could turn negative, not a precise number.
That last point is the fulcrum of the whole stock. The bull says the same models that power the feed are already returning the spend through higher ad revenue, so the capex is partly self-monetizing the moment it is installed, unlike a cloud build that needs external customers. The bear says the return-to-capex ratio across all hyperscalers is still about 0.2 to 1, meaning the AI build is generating roughly 20 cents of incremental revenue for every dollar of capital sunk into it where a healthy, self-funding project would clear at least 1-to-1; that capex is growing roughly 46 percent faster than revenue, a wider gap than the 2001 telecom overbuild, the episode when carriers laid far more fiber than demand could fill, left most of it dark, and saw their equity wiped out; and that a model-efficiency shock like DeepSeek’s reported training-cost cut, the early-2025 scare in which a Chinese lab claimed to train a competitive model for a fraction of the usual cost, shows the required compute can fall faster than usage rises, which would leave a $135 billion build oversized. Asked directly for a return signpost over the next year or two, Zuckerberg called it “a very technical question,” and the market did not love the non-answer.
The capex-versus-return debate is not unique to Meta. Microsoft went through a version of exactly this argument in 2025 and 2026, with Azure growth and Copilot monetization doing the work Cloud does for Alphabet. See the Microsoft AI-battle deep dive for the comparison.
Reality Labs: the long bet that keeps losing money
Reality Labs is the clearest drain in the diagram. It has lost about $83.5 billion since late 2020 on roughly $11.8 billion of cumulative revenue, and the annual loss has widened every year: $13.7 billion in 2022, $16.1 billion in 2023, $17.7 billion in 2024, $19.2 billion in 2025. Management guides 2026 to be “on par” with 2025, with VR investment shrinking and the spending shifting toward wearables. Zuckerberg has said glasses will be “extremely profitable” when they reach hundreds of millions of users, and has explicitly declined to name a year.
There is one genuine bright spot. Ray-Ban Meta glasses sold about 7 million units in 2025, against cumulative sales near 2 million through early 2025, meaning nearly all of it came in roughly ten months. EssilorLuxottica, the manufacturing partner Meta has taken a roughly 3 percent stake in, called the glasses the dominant driver of its wholesale growth. A higher-end Ray-Ban Display model launched in the US at $799 with demand described as unprecedented, though the international rollout was paused on inventory constraints. Discussions reported by Bloomberg point to doubling or tripling capacity toward 20-30 million units a year, which is a target under discussion, not a commitment.
Set against the burn, the bright spot is still small. Quest VR headsets are in structural decline; Meta stopped selling them to business customers in February 2026, shut several VR features, and removed the Horizon Worlds creation tools in June 2026. The competitive clock is also ticking: Apple’s N50 glasses are targeted for a 2027 launch at $200-500, and Android XR devices arrive in late 2026, both threatening to commoditize Meta’s first-mover lead before it scales. No analyst house publishes a positive standalone value for Reality Labs; the consensus treats it as a drag and the glasses as an unpriced option. The honest framing is that it is a call option on the next computing platform that costs $19 billion a year to hold, with an open-ended timeline.
User engagement and revenue per person (ARPU)
The engine needs attention, and the attention picture is mixed in an important way. The metric that ties the two together is revenue per person, what the industry calls ARPU (average revenue per user) or ARPP (average revenue per person, Meta’s family-wide version): total revenue divided by the user base, the cleanest measure of how hard each user is monetized. Family daily active people reached 3.56 billion in the first quarter of 2026, but that was a sequential decline from 3.58 billion the prior quarter, the first in Meta’s history. Management attributed it to internet disruptions in Iran and WhatsApp restrictions in Russia rather than organic softness, and the year-over-year figure was still up 4 percent. But the trend in that growth rate is the thing to watch: it has decelerated from 8 percent to 7 percent to 4 percent over three quarters. Meta is now a monetization-intensity story, not a user-growth story. The arithmetic of the first quarter makes that plain: 4 percent more people times 27 percent more revenue per person produced the 33 percent revenue growth.
What is driving the intensity is AI ranking. Time spent rose across the apps on recommendation improvements, video time was up 8 percent quarter over quarter, and Reels time was up 10 percent. Roughly 54 percent of the average Facebook feed now comes from accounts the user does not follow, up from 50 percent, which is the platform quietly shifting from a social-graph model to an AI-discovery model. That shift matters because it makes the supply of content effectively unlimited, so Meta can lift both time spent and ad load without exhausting the social graph. The bear reading is that this same mechanism has a ceiling, and that attention is migrating toward conversational AI, a surface Meta does not yet monetize with ads, while TikTok still carries a structurally higher engagement rate (about 3.70 percent versus Instagram’s 0.48 percent). The bull reading is that Meta’s edge was never the highest engagement; it was the most complete cross-app social graph plus the best direct-response conversion machine, and on the advertiser metric that pays the bills Meta still drives the majority of conversions.
Company by company: who’s who
From the research set, grouped by role. Figures are point-in-time as of June 22, 2026 and traced to the claims ledger.
The subject.
Meta Platforms (META). Owns Facebook, Instagram, WhatsApp, and Messenger, and sells advertising against that attention; Reality Labs makes Quest and Ray-Ban Meta glasses; Meta Superintelligence Labs builds the models. Per eMarketer it is now the number-one digital advertiser globally in 2026 at an estimated 26.8 percent share, overtaking Google for the first time, with the Family of Apps about 97 percent of revenue and Zuckerberg holding roughly 61 percent of the votes on about 14 percent of the economics. First quarter 2026: revenue $56.3 billion, up 33 percent. Bull: cheapest mega-cap on forward earnings with a self-reinforcing ad flywheel already showing in the numbers and an $81 billion liquid-asset cushion. Bear: nearly all revenue is advertising and therefore fully cyclical, the capex is compressing free cash flow with unproven return, the regulatory stack is live, and Reality Labs burns about $5 billion a quarter.
The advertising and AI-model rivals.
Alphabet (GOOGL). Google Search, YouTube, and Google Cloud, plus DeepMind’s Gemini models. It is the other half of the ad duopoly Meta just passed, and the closest direct comparison: ad-funded, AI-capex-obligated, regulator-watched. First quarter 2026 revenue $109.9 billion, up 22 percent, with Cloud up 63 percent. Bull: Cloud at plus 63 percent gives it a high-margin earnings driver independent of the ad cycle, the thing Meta lacks. Bear: it trades near 29 times forward, almost a 70 percent premium to Meta, with little room for AI disruption to search. Alphabet is the live counter-thesis to Meta: when both raised capex on the same evening in April, Alphabet rose 7 percent and Meta fell 6 to 7 percent, because Alphabet could point to Cloud as visible return and Meta could not. It is the control for the question “is it the capex, or is it Meta.” See the Alphabet deep dive.
Amazon (AMZN). Retail, AWS, and the number-three ad platform at roughly $70 billion trailing. First quarter 2026 advertising revenue $17.2 billion, up 24 percent. Bull: commerce-intent data is a moat advertisers cannot replicate, and streaming ads add inventory. Bear: ad growth is tied to retail volume, so a consumer slowdown hits both at once. Amazon is both an ad-budget rival and an AI-capex peer. See the Amazon deep dive.
The compute suppliers Meta pays.
NVIDIA (NVDA). The dominant AI-chip supplier and the substrate for frontier training; Meta is among its largest data-center customers. Quarter ended April 2026: revenue $81.6 billion, up 85 percent, data center up 92 percent. Bull: Blackwell demand exceeds supply and the CUDA ecosystem locks customers in. Bear: a roughly $5 trillion market cap prices near-perfection, and its annual product cadence is precisely what makes Meta’s 5.5-year depreciation election look aggressive. See the NVIDIA deep dive.
Broadcom (AVGO). Designs custom AI accelerators for hyperscalers and the Ethernet networking that competes with NVIDIA’s interconnect; Meta’s MTIA chip is co-designed with Broadcom. Quarter ended May 2026: revenue $22.2 billion, up 48 percent, AI semis up 143 percent. Bull: the custom-silicon route for hyperscalers is structural, and Broadcom has the two biggest spenders. Bear: revenue is concentrated in a few hyperscaler programs, so its bull case partly depends on Meta’s capex not being cut, which is circular with the Meta free-cash-flow bear. See the Broadcom deep dive.
The platform gatekeeper.
Apple (AAPL). Not an ad competitor but the gatekeeper whose App Tracking Transparency policy still caps Meta’s iOS targeting, and whose N50 glasses are the most credible threat to Ray-Ban Meta. Bull for Apple, bear for Meta: if N50 succeeds, Apple captures the wearable-AI attention layer Meta is building toward. Bear for Apple: Vision Pro is still a luxury niche and Apple Intelligence is iterating slowly.
The fringe and the private rival.
Snap (SNAP) runs Snapchat at roughly 2 percent of global ad share; first quarter 2026 ad revenue grew only 3 percent, close to stall speed, and its small-business ad growth is a useful leading read on SMB ad health. The Trade Desk (TTD) is the leading independent demand-side platform, a proxy for programmatic health more than a Meta competitor; its first quarter 2026 revenue grew 12 percent, below expectations. ByteDance / TikTok is private; its last public valuation near $300 billion is stale and should not be treated as current. After the January 2026 US divestiture to an Oracle-led consortium, the existential ban risk is gone, which cuts both ways for Meta: less advertiser caution, but a stabilized TikTok with structurally higher engagement could pull budgets back. The bull narrative treats TikTok disruption as a settled Meta tailwind; it is not settled.
What the filings say
Every figure here is from a Meta filing, dated, and rendered at full precision from the audited values rather than any truncated intermediate.
The income statement. FY2025 revenue was $200.97 billion, up 22 percent, the third straight year of acceleration after the 2022 reset. Advertising was $196.18 billion of that, 97.6 percent, with “other revenue” just $2.58 billion. Operating income was $83.28 billion at a 41 percent margin. Net income, oddly, fell 3 percent to $60.46 billion, not because the business weakened but because income tax expense jumped from $8.3 billion to $25.5 billion year over year, a $17 billion swing that overwhelmed operating-income growth. Diluted earnings were $23.49 per share. The first quarter of 2026 then accelerated: revenue $56.31 billion up 33 percent, operating income $22.87 billion at a 41 percent margin, and net income $26.77 billion (helped by an $8.0 billion tax benefit tied to the One Big Beautiful Bill Act), for $10.44 in diluted earnings.
The two segments. Family of Apps did $198.76 billion of revenue in 2025 and $102.47 billion of operating income, a roughly 51.6 percent segment margin that is among the highest of any large business anywhere. Reality Labs did $2.21 billion of revenue and lost $19.19 billion. That is the cross-subsidy in one line: the apps fund the lab. In the first quarter of 2026 the Family of Apps margin slipped to about 48 percent as research spending for the new AI lab ramped.
Cash flow and the capex ramp. Operating cash flow was a genuinely massive $115.8 billion in 2025, up 27 percent. The problem is what sits below it. Capex (including finance leases) was $72.2 billion, up about 84 percent, which pulled free cash flow down to $43.6 billion from $52.1 billion the year before. The first quarter of 2026 spent only about $19.8 billion of capex, which annualizes well below the $125-145 billion full-year guide, confirming the spend is heavily back-half loaded. That cadence is exactly why free cash flow can look fine early in the year and invert later.
The balance sheet, and the end of the fortress. At year-end 2025 Meta held $81.6 billion in cash and marketable securities against $58.7 billion of long-term debt, a net-cash position of about $22.8 billion, the thinnest cushion since the 2012-2013 era. Long-term debt nearly doubled in a year, and the company issued about $30 billion of senior notes in November 2025 and another roughly $25 billion in May 2026. Operating cash flow of $116 billion dwarfs the interest bill, so this is not a solvency question; it is the quiet end of the zero-debt, fortress-balance-sheet story the stock was partly valued on.
Capital returns and dilution. Meta repurchased $26.2 billion of stock in 2025, but the buyback went to zero in the fourth quarter of 2025 and the first quarter of 2026, paused to preserve cash for capex and after the bond issuance. The $0.50 quarterly dividend, begun in 2024, has not been raised. Stock-based compensation was $20.4 billion in 2025, a real dilution headwind that buybacks have to outrun, and with buybacks paused the share-count reduction slows.
Governance. A dual-class structure gives Zuckerberg roughly 57 to 61 percent of the votes on about 13 to 14 percent of the economics. No shareholder vote passes without him. That is a structural feature, not a signal, but it is a discount factor for some institutional mandates.
What management itself flags. The 10-K names three risks as genuinely material. First, advertising concentration with platform dependency: it states plainly that Apple’s tracking changes have hurt and are expected to keep hurting advertiser budgets, on a business that is 97.6 percent advertising. Second, AI capex and Reality Labs uncertainty: management writes that “our investments in AI could be unsuccessful or fail to produce the expected returns,” on a capex line guided up 74 to 101 percent in one year. Third, the regulatory stack, including the consent order with the FTC and the rising trend of fines calculated on global revenue.
What the market is paying
All figures point-in-time as of the June 22, 2026 close. Prices and multiples move daily, and the forward multiple in particular is disputed across vendors.
Price and performance. Meta closed at $563.85, in the lower third of a 52-week range of roughly $520 to $796, about 29 percent below that 2025 peak. The returns tell a sharp story of relative weakness: down about 15 percent year to date and 17 percent over the trailing year, while the Nasdaq-100 was up roughly 19 percent and Alphabet up about 110 percent over comparable windows. Meta is the only name in its peer set with a materially negative 2026 return. It trades about 23.5 percent below its 200-day moving average, a meaningful technical dislocation, though not yet at a forced-liquidation reading. This is not a calm stock: it fell 64 percent in 2022 and rose 194 percent in 2023.
The valuation, and why it is cheap. On trailing earnings Meta is about 20.5 times, the cheapest mega-cap. On forward earnings it is roughly 17 to 20 times depending on the vendor and the denominator (stockanalysis.com showed 17.18, Yahoo 18.35, another vendor near 20), so the honest framing is a range, not a single figure. On enterprise value to EBITDA it is about 13 to 14 times, roughly a quarter below its own ten-year median near 18 times, a level it has rarely seen outside the 2022 crash. Against peers the discount is stark: Alphabet trades near 29 times forward, Amazon near 29, NVIDIA near 21, Microsoft near 20. Alphabet’s roughly 70 percent forward premium to Meta is the widest in recent memory between two businesses that are both ad-led, both AI-capex-heavy, and both regulator-watched.
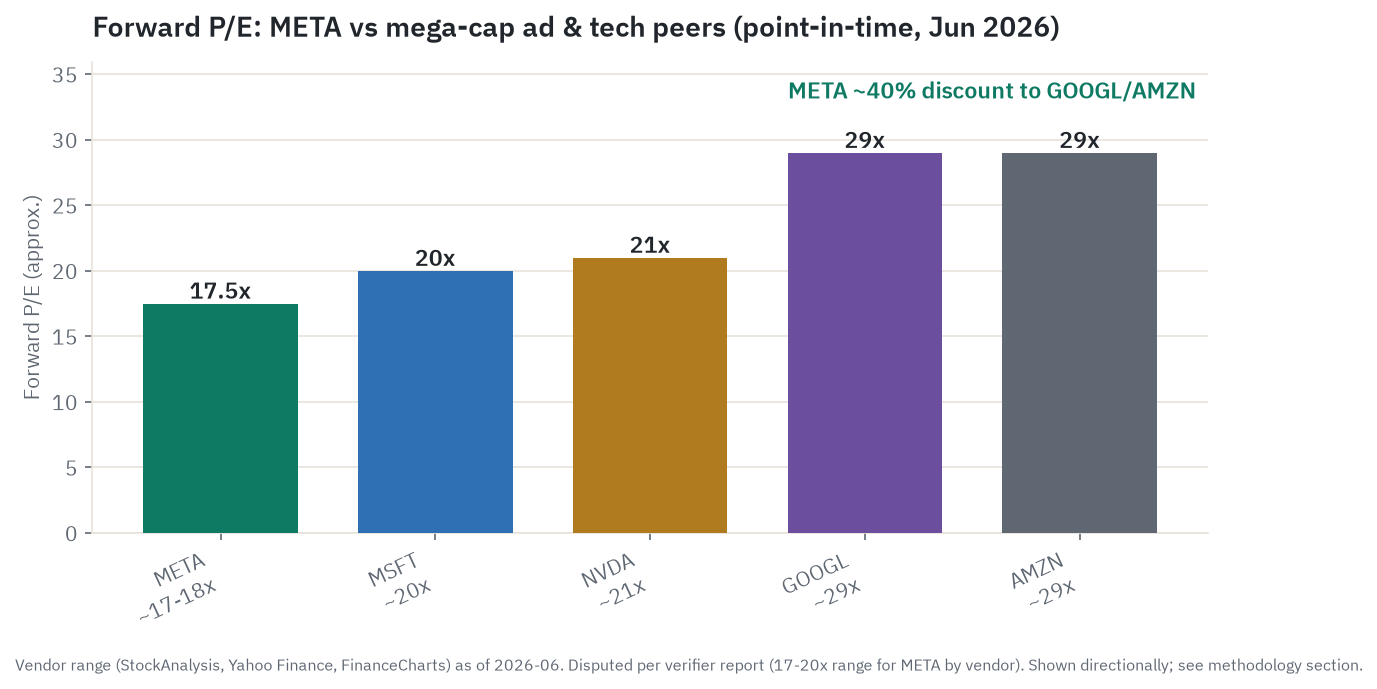
The caveat that matters. The cheapness is real, but it carries an asterisk the bull case tends to skip. The earnings figure that makes Meta “17 times” is flattered by an accounting choice. Effective January 2025 Meta extended the useful life of its servers and network gear to 5.5 years from three, which reduced 2025 depreciation by roughly $2.9 billion and lifted reported profit by a similar amount. It did this in the same period Amazon shortened its own server lives, citing AI obsolescence, and took a charge. NVIDIA’s roughly annual chip cadence implies real frontier-GPU economic life closer to two or three years. If the policy ever normalizes toward that economic reality, the “E” in the P/E falls and the multiple is quietly higher than it looks. On free cash flow the stock is no bargain at all: about 30 times, near its own ten-year median, and that ratio rises as capex eats cash. So Meta is cheap on flattered earnings and fully valued on cash flow, which is exactly the tension the price is wrestling with.
Liquidity, shorts, and the sell-side. Meta is among the most liquid equities on earth; short interest is only about 1.48 percent of float with 2.2 days to cover, so there is no fundamentals-driven bear positioning of any size. The sell-side consensus is a Strong Buy with a mean price target near $827, roughly 47 percent above the price, and 58 of 64 tracked analysts at Buy with zero Sells. That gap is unusually wide. It reflects targets that have not been revised down to match a changed market view of capex risk as much as it reflects conviction. It is reported here as what analysts say, attributed, and it is not the house view and not a destination; price targets lag price.
What the crowd is saying
Treat this section as signal, not fact; the social data in particular is soft.
The dominant story in the financial press is a single tension: the ad business is accelerating while the capex bill grows faster than the near-term return case can justify, and management cannot yet articulate a clear framework for the spend. Coverage shifted from cautiously optimistic after the fourth-quarter 2025 print to openly skeptical after the April 29, 2026 call, the one where Zuckerberg called the ROI-signpost question “a very technical question” while raising the capex guide. Meta fell 6 to 7 percent after hours that night; Alphabet raised capex the same evening and rose 7 percent. A second datable event followed on June 5, 2026, when the stock fell 6.6 percent on a report that Meta was exploring tens of billions in fresh equity or equity-linked capital. Two big single-day drops in 2026, both driven by capital-allocation signals rather than ad misses.
The retail signal is split and softer. StockTwits commentary stayed bullish and high-volume through the selloff, consistent with long holders defending a position; aggregator readings of Reddit sentiment cooled from bullish toward bearish through the spring. Those specific sentiment scores come from third-party aggregators with opaque methods and should be read as directional only. There is no manipulation flag: the float runs to 2.19 billion shares, short interest is only about 1.48 percent of it, and the bearish narrative is well-reasoned and consistent with the disclosed financials rather than a coordinated campaign.
The useful part is the divergence. The crowd’s story is that Meta is losing the AI race and the ad engine is at risk. The filings show the opposite on the core business: the ad engine is accelerating, margins are 41 percent, both ad levers are rising, and the first-quarter earnings beat was the largest in six quarters. The crowd has the core business directionally backward while correctly identifying a real forward risk on capex return that management has not resolved. The Alphabet-versus-Meta valuation gap is the clearest market expression of that divergence, and the hardest to justify purely on fundamentals: it reflects Alphabet’s visible Cloud return as a narrative advantage, not an obvious difference in the quality of the two ad businesses.
The economics and durability
Put the structural case and the bear case side by side, because the honest answer is a split.
The structural case. Meta sits at the intersection of two reinforcing forces. The first is the decades-long migration of ad budgets from legacy media to digital: global digital ad spend is near $740 billion in 2026, about 73 percent of all media spend, up from under half a decade ago, and linear TV is shrinking while social video grows double digits. The second is an AI-targeting advantage that raises Meta’s share within digital, because Advantage+ demonstrably delivers better return for advertisers, so they rationally route more budget to Meta even if their total budget does not grow. The demand is funded by the broadest possible base, millions of small businesses whose budgets track the economy but depend on no single customer. And critically, unlike a cloud build that needs outside customers, Meta’s AI capex is partly self-monetizing the moment it is installed, because the same models that rank the feed lift ad revenue.
The cyclical and structural bear. The counter is equally specific. Advertising is 97.6 percent of revenue, so a demand shock hits essentially the whole company at once. Meta is not immune to that: a demand pause plus the Apple tracking hit cut its revenue year over year in 2022 and the stock fell 64 percent. The current pressures are real if so far managed: China advertisers pulling back, a possible second-half de-minimis drag, and the first-ever sequential decline in daily users. On top of the cycle sits the capex-and-depreciation squeeze. As the $135 billion-midpoint 2026 vintage flows into depreciation over 2027 and 2028, D&A could climb from $18.6 billion toward an estimated $40-45 billion, and margins hold only if revenue outruns it. The skeptic’s most important point is that the earnings quality and the cash flow are both deteriorating at once: the “E” is flattered by the depreciation election, and free cash flow is guided negative, with an equity raise floated that would introduce dilution to a story whose bull case rested on a fortress balance sheet and buybacks. There is also a model-efficiency tail risk, the chance that compute-per-task falls faster than usage grows and the build looks oversized. And the regulatory overhang, covered below, stays live.
The most likely outcome. A split. The structural demand is durable; digital keeps taking share and Meta keeps taking share within digital. The timing of the capex payback is the real uncertainty. If the next couple of prints confirm revenue is outrunning the depreciation wave, the multiple re-rates and today’s price was a compressed entry. If the China pullback spreads, or a macro slowdown hits small-business budgets, the 2027 cash-flow squeeze becomes consensus and the stock stays heavy. The hinge, in both directions, is the one thing the research cannot yet prove: whether the incremental $100 billion-plus of capex is causing durable, monetizable ad revenue fast enough to outrun its own depreciation.
The regulatory overhang, stated precisely. Four threads, framed exactly as the record supports. The FTC monopolization case is the binary tail: Meta prevailed at trial on November 18, 2025, when Judge Boasberg found the FTC had not proved monopoly power and declined to order any divestiture, but the FTC appealed to the D.C. Circuit on January 20, 2026, and that appeal is pending, with Instagram and WhatsApp divestiture the stated remedy if the FTC wins on appeal. No foregone conclusion either way. In the EU, the only assessed fine is the EUR 200 million penalty from April 2025 under the Digital Markets Act (DMA), the bloc’s gatekeeper-competition law, over the “pay or consent” model; Meta has since introduced a three-tier ad model. The April 2026 findings under the Digital Services Act (DSA), the EU’s online-safety regime, on under-13 access are preliminary, not a fine; Meta has the right to respond before any decision, and the 6 percent of worldwide turnover figure (around $9.9 billion on 2024 revenue) is a statutory ceiling, not an assessed amount, with actual EU fines historically landing well below the maximum. The US teen-safety multidistrict litigation is pending; the first bellwether verdict, in a California state court in March 2026, found Meta and Google liable on a single plaintiff’s negligent-design claim, but a single verdict does not establish company-wide liability and aggregate exposure is not quantifiable. A newly filed publishers’ copyright suit over Llama training data is a pending allegation that Meta denies; an earlier Llama case went Meta’s way on fair use in 2025. A Massachusetts high-court ruling in April 2026 was a procedural decision that Section 230 does not bar the state’s claims, not a finding of liability.
The scenarios in detail
The deep version of the lede chart. Four variables decide the next five years, and each scenario is just a different setting of them: the ad-revenue growth rate (about 98 percent of the story), the margin trajectory against the depreciation wave, the free-cash-flow and capital-return path, and whether the AI capex proves causal. Every dollar figure below is illustrative arithmetic, an estimated earnings path times an exit multiple inside Meta’s own historical band, and is an estimate, not a price target. The levels match the chart at the top of the article.
Bull: the discount was the opportunity. Ad revenue compounds roughly 18 to 22 percent a year as impressions, price, and AI share-of-wallet gains all contribute and the developing-market runway opens; margins hold around 40 percent because revenue outruns the depreciation wave; a dated, hit return metric on the capex appears before the 2027 depreciation peak; free cash flow troughs shallow and re-accelerates with no equity dilution; glasses inflect toward 20-30 million units with services attached, turning Reality Labs from drag to sized option; the D.C. Circuit affirms the FTC loss and the EU items land light. Illustrative earnings reach roughly $72 by 2031, the exit multiple re-rates toward 22 times as the capex looks like a moat rather than a money pit, and the five-year level is about $1,584 (the arithmetic is $72 of earnings times a 22-times multiple). What has to be true: the capex causality is proven, not asserted. What most likely breaks it: the depreciation lands faster than the incremental revenue, or the equity raise happens and reframes the fortress thesis.
Base: a high-quality machine that out-grows its own capex, slowly. Ad revenue decelerates gracefully from 33 percent toward the high teens and then low double digits as developed-market revenue per user saturates and China trims the edges; margins compress modestly but stay in the high 30s to low 40s as the depreciation is absorbed; free cash flow goes negative in 2026 and stays thin into 2027 but troughs without material dilution; the capex earns out slowly through the flywheel; Reality Labs stays a roughly $19 billion-a-year drag with glasses a real-but-small bright spot; the regulatory items resolve as cost of doing business. Illustrative earnings move from about $32 in 2026 to $36 in 2027 (consensus) to roughly $54 by 2031 at about 11 percent a year, at a fair 17 times, for a five-year level near $918 (the arithmetic is $54 of earnings times a 17-times multiple). What has to be true: ad growth stays double-digit and the cash-flow inversion is temporary. What most likely breaks it: an ad-cycle pause hitting 98 percent of the company at once while depreciation is rising.
Bear: anchored on the skeptic’s strongest case. This is the mundane, quantitative base bear, not a crash. Through the second half of 2026 into 2027, ad growth decelerates from the AI-juiced 33 percent back toward the high teens and lower (saturation, China drag, some feed-to-chatbot attention leakage, with daily users already having posted their first sequential decline) at the exact moment the depreciation wave from $135 billion-plus of capex lands. Operating-income growth stalls; free cash flow goes negative as guided, at the worse end roughly negative $24 billion in 2027; Meta funds the gap with the equity raise it floated in June 2026, introducing dilution. The market re-rates not because Meta got cheaper but because the earnings were revealed as both lower-quality (flattered by the 5.5-year election) and lower-growth than 17 times implied. The multiple compresses toward 12 times on a lower number, roughly $32 of earnings that fails to compound, putting the five-year level near $380 (the arithmetic is about $32 of stalled earnings times a 12-times multiple) and the one-year level near $449. The low-probability tail beneath that is the D.C. Circuit reversing the FTC loss and forcing a divestiture, existential but unlikely. What has to be true: capex causality is never proven and depreciation normalizes. What most likely breaks the bear: a clean, dated capex-return signpost Meta names and hits.
The catalyst timeline. Near term: the second-quarter 2026 earnings in late July or early August (ad growth against the $58-61 billion guide, the capex cadence, any cash-flow or buyback signal, and whether the equity-raise exploration is confirmed or dropped); the equity-raise decision itself in the second half of 2026, the single highest-signal near-term event; the China and de-minimis status through the second half; the FTC D.C. Circuit ruling in late 2026 or 2027; the EU DSA final decision; and the teen-safety federal bellwethers that began in June 2026. Multi-year: the 2027-2028 depreciation cliff, the test of whether revenue outruns D&A; AI ad-surface monetization through the Meta AI assistant and WhatsApp messaging; the glasses inflection against Apple and Android XR; and whether the model position closes the gap or keeps bleeding talent.
Leading indicators to watch. The single most important number is the ad-revenue growth rate and its split between impressions and price: holding above roughly 18 percent with both contributing favors the base and bull; a slide toward low double digits with price decelerating signals the bear. Then the free-cash-flow line and the buyback: a restart or a positive surprise keeps the bull leg intact, a confirmed equity raise confirms the bear leg. Then any named return metric on the capex; any further server-life extension (flatters earnings, raises the quality flag) or a normalization or write-down (cuts earnings, validates the skeptic); a second sequential decline in daily users; and small-business ad health, for which Snap’s ad growth is a useful read.
Companies to watch (bull / base / bear)
Meta Platforms (META) - the subject; a ~52-percent-margin ad machine funding a $125-145B capex year.
- Bull: both ad levers rising, cheapest mega-cap on forward earnings, AI flywheel showing in 33 percent growth.
- Base: ad growth decelerates gracefully, free cash flow inverts temporarily, multiple holds near 17 times.
- Bear: the “17 times” is on earnings flattered by a 5.5-year depreciation election, and free cash flow (not just margin) is projected negative by 2027; the $81 billion cash cushion is undercut by the same company exploring an equity raise. If the war chest were enough, why raise.
- Watch: the ad-growth split, the free-cash-flow print, and any concrete capex-return metric.
Alphabet (GOOGL) - the live counter-thesis and the control variable.
- Bull: Cloud at plus 63 percent is the diversification Meta lacks.
- Bear: a roughly 29 times forward multiple, near a 70 percent premium to Meta.
- Watch: whether the market keeps paying for Cloud as visible AI return while it does not for Meta.
Amazon (AMZN) - the number-three ad platform and an AI-capex peer.
- Bull: commerce-intent advertising is early innings.
- Bear: ad revenue is tied to retail volume.
NVIDIA (NVDA) - the compute Meta buys.
- Bull: Blackwell demand exceeds supply.
- Bear: a roughly $5 trillion cap prices near-perfection, and its annual cadence is what makes Meta’s depreciation election look aggressive.
Broadcom (AVGO) - Meta’s MTIA custom-silicon partner.
- Bull: hyperscaler custom silicon is structural, with the two biggest spenders as customers.
- Bear: customer concentration; its bull case partly needs Meta’s capex not to be cut, which is circular with the Meta cash-flow bear.
Snap (SNAP) - not material to Meta, but a useful canary.
- Watch: small-business ad growth (only 3 percent in the first quarter of 2026) as a read on SMB ad-budget health.
Risk controls
The honest risk paragraph. The biggest structural risk is concentration: nearly all revenue is advertising, so a demand shock, a macro recession, or a regulatory hit to targeting strikes essentially the whole company at once, and history (2022, down 64 percent) shows the stock does not absorb that gently. The second is the capex-and-depreciation drag: free cash flow is guided to turn negative, the earnings quality is flattered by the server-life election, and an equity raise has been floated that would dilute a thesis built on a fortress balance sheet. The third is valuation context: cheap on flattered earnings, but about 30 times free cash flow and rising, so “cheapest mega-cap” depends on which line you anchor to. The fourth is governance: Zuckerberg’s voting control means no external check on capital allocation, which matters most precisely when the spend is this large and the return this unproven. The fifth is the regulatory stack, live on multiple fronts as described above. What would change the read for the better is a dated, hit return metric on the capex and a free-cash-flow trough without dilution; what would change it for the worse is an executed equity raise plus ad deceleration with the depreciation wave landing. This is a single, volatile, advertising-concentrated stock; size any position accordingly and against your own circumstances, which only a licensed advisor can assess.
Methodology, sourcing, and data-quality flags
This piece was built from parallel research streams: the SEC filings (FY2025 10-K, the Q1 2026 10-Q, and the relevant 8-Ks, cross-checked against EDGAR XBRL), the advertising engine, the AI strategy and capex, Reality Labs, user engagement and ARPU, regulation and antitrust, the competitive set, the market action and valuation, the sentiment and OSINT signal, the macro and micro economics, the value-chain map, and the forward outlook. The source hierarchy ran primary (company filings and regulator or court records) first, then named analyst houses (MoffettNathanson, eMarketer, Menlo Ventures), then reputable trade press, then explicitly labeled estimates. A skeptic attacked the thesis and a compliance pass enforced the disclaimers and the litigation framing.
The five-factor read, in plain prose.
Valuation nets to mildly cheap with an asterisk. Meta is the cheapest mega-cap on trailing earnings (about 20.5 times) and forward earnings (about 17 to 20 times across vendors), at roughly 13 to 14 times enterprise value to EBITDA against its own ten-year median near 18, and at the widest forward-earnings discount to Alphabet in memory. The asterisk is that the cheapness is partly an artifact of an earnings number flattered by the 5.5-year server-life election, while free cash flow at about 30 times is no bargain and rising as capex eats cash. Lean: modestly positive.
Growth is clearly positive. Revenue grew 33 percent in the first quarter of 2026 with impressions up 19 percent and price up 12 percent at once, the cleanest ad-health signal a business can give, on top of a multi-decade developing-market runway and AI share-of-wallet gains. The asterisk is durability: developed-market saturation, the China drag, and the first sequential decline in daily users. Lean: clearly positive.
Quality is positive with a real flag. The Family of Apps margin is about 51.6 percent, operating cash flow of roughly $116 billion is among the highest of any company on earth, the balance sheet is net-cash, and the marginal cost of an impression is near zero. It is dragged by the roughly $19-billion-a-year Reality Labs loss, the depreciation-policy earnings-quality question, and free cash flow inverting into the capex cycle. Lean: positive, with the earnings-quality flag attached.
Risk is negative. There is the roughly 98 percent single-engine advertising concentration, the roughly 11 percent China-advertiser exposure, free cash flow guided negative with a floated equity raise that would introduce dilution, a destabilized AI organization after the LeCun departure and FAIR cuts, and a live regulatory stack (FTC on appeal, EU DSA preliminary, teen-safety litigation unquantified). Lean: negative.
Momentum and sentiment is net negative. The price is down about 17 percent over the trailing year, 15 percent year to date, and 29 percent off the 2025 peak, below every major moving average and about 23.5 percent under the 200-day, with two capex-driven single-day drops in 2026. The only offset is a stale Strong-Buy consensus near an $827 mean that has not followed the stock down, which is divergence, not confirmation. Lean: net negative.
Putting those together, the overall lean is a cheap, high-quality, fast-growing advertising franchise whose discount is real but earned by genuine capex, free-cash-flow, and earnings-quality risk: a modest positive tilt that lands the read at Hold as a transparent, rules-based research signal, not personalized advice. A clean, dated capex-return signpost or a free-cash-flow trough without dilution would push the read toward Buy; a forced equity raise plus ad deceleration with the depreciation wave landing would push it toward Sell.
Data-quality flags:
- Storage artifact in the raw claims. An early batch of recorded claims had dollar signs and adjacent digits stripped by a shell-truncation issue. The underlying research was correct; all currency figures in this article are rendered from the full-precision, XBRL-confirmed filings batch and the verifier’s corrected values, not the truncated strings.
- Point-in-time market data. Price, market cap, multiples, and returns are stamped June 22, 2026 and move daily; a different vendor showed roughly $577 and $1.5 trillion four days earlier, which is date drift, not disagreement. The forward P/E spans about 17 to 20 times by vendor and definition and is presented as a range.
- Forecasts are not facts. The eMarketer ad-share projection, the sell-side consensus and price targets (about $827 mean, roughly 47 percent implied upside), the 2027 free-cash-flow estimates (which conflict materially, from about negative $4 billion to negative $24 billion), and the depreciation-wave numbers are projections, attributed and labeled.
- Legal claims are live and hedged. The FTC case is on appeal with no final outcome; the EU DSA finding is preliminary and the 6 percent figure is a statutory ceiling, not a fine; the only assessed EU fine is the EUR 200 million DMA penalty; the teen-safety litigation is pending with one attributed bellwether verdict and no aggregate liability figure; the Llama copyright suit is a pending allegation Meta denies; the Massachusetts ruling was procedural. None reads as settled liability.
- Third-party and derived metrics. Regional ARPU figures, engagement-rate benchmarks, Reels-versus-Feed CPMs, deal headline values (the $60 billion AMD, $200 billion-plus Hyperion, $27 billion Nebius), and the Reality Labs cumulative-loss total are analyst or press derivations, labeled estimate or attributed, not Meta-disclosed at that precision.
- Soft sentiment signal. Retail and social readings (StockTwits, Reddit scores) are from aggregators with opaque methods and are directional only.
Key sources: Meta FY2025 10-K and Q1 2026 10-Q (SEC EDGAR, with XBRL cross-check); Meta Q4/FY2025 and Q1 2026 earnings releases and call transcripts; FTC and European Commission press releases and court records; EssilorLuxottica earnings (Ray-Ban Meta units); eMarketer (digital ad share); MoffettNathanson (China-advertiser exposure); Menlo Ventures (enterprise LLM share); stockanalysis.com, Yahoo Finance, GuruFocus, Barchart, and MarketBeat (point-in-time market data); CNBC and Fortune (datable sentiment events).
Prepared June 22, 2026. Figures are point-in-time and will change. This is research and analysis for educational purposes - not investment advice, not a recommendation, and not a solicitation. Meta is a single, advertising-concentrated mega-cap with a large and rising capital-spending program and a volatile share price. Verify all figures independently and consult a licensed financial advisor before making any decision.