
Research date: June 30, 2026 | OSINT research on Procter & Gamble Co (NYSE: PG), the maker of Tide, Pampers, Gillette, Crest, and Olay, its fiscal-2026 margin fight against tariffs and private label, and the household and personal-care peer set it trades against. PG’s fiscal year ends June 30, so figures below are dated FY2025, FY2026 guidance, or the most recent quarter, Q3 FY2026.
Important disclaimer. This is OSINT-based research and educational analysis, not investment advice. I am not a financial advisor. Nothing here is a recommendation to buy or sell any security, and the scenarios below are illustrative, not price targets. Consumer-staples stocks like PG carry lower business-cycle risk than most sectors but are not risk-free, and PG’s stock price behaves in part like a bond substitute, meaning it can move on interest-rate expectations that have nothing to do with how many boxes of Tide the company sold. Market caps, prices, valuation multiples, and market-share figures are point-in-time as of June 30, 2026, press-reported where noted, and move fast. Do your own due diligence and consult a licensed advisor.
Where this stock could be in 6 months, 1 year, 3 years, and 5 years
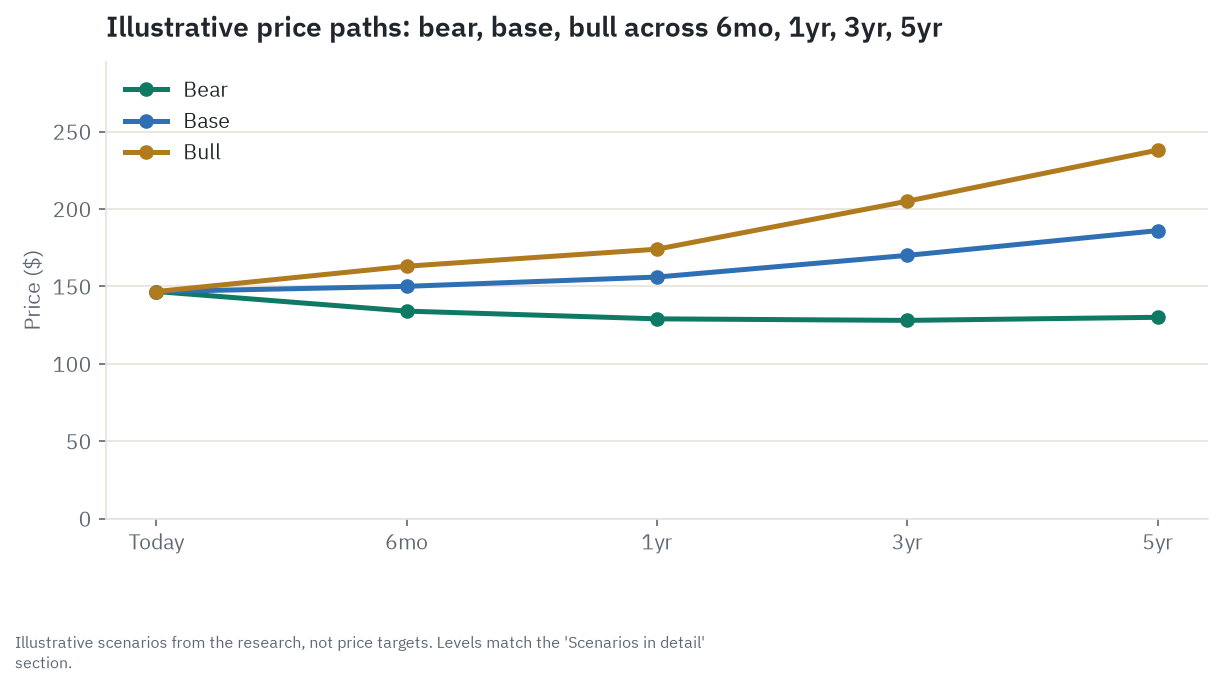
Six months. This window belongs to the calendar. Procter & Gamble reports its fiscal fourth quarter and full-year results on August 4, 2026, before the market opens, and that print carries the first look at fiscal 2027 guidance, the number the market has nothing else to trade on right now. Management has already signaled that fiscal 2026 will land toward the low end of its guided range, so the surprise, if there is one, sits in what comes next rather than in the quarter just closing. The base case is a modest drift toward the low $150s as the market absorbs an already-known low-end result and takes its cue from a cautious first FY2027 guide, landing near $150. The bull case is a clean quarter, a second straight quarter of volume growth, and a benign FY2027 guide alongside any hint that the Federal Reserve is done hiking, carrying the stock back toward the analyst-mean zone near $163. The bear case is a miss at the low end, a soft FY2027 guide, and a dollar that keeps strengthening, pushing PG back toward its 52-week low near $134. The single line item most likely to decide this window is whether the volume number in the August print holds positive.
One year. Over twelve months the question becomes whether the volume growth Procter & Gamble reported in its third fiscal quarter was the start of something or a one-quarter blip against an easy comparison, and that question gets refereed by where interest rates go. The base case has low-to-mid single-digit Core EPS growth (Core EPS is Procter & Gamble’s preferred earnings measure, GAAP profit with one-time items like restructuring charges and past impairments stripped out to show what the ongoing business actually earns) carrying the stock to roughly $156, close to the current analyst consensus target in the $161 to $164 range. The bull case has the volume trend broadening across more categories, the foreign-exchange line turning friendly again, and a Federal Reserve pivot toward cutting rates, all of which would let a bond-proxy stock like this one re-rate toward and past its 52-week high, near $174. The bear case has volume reverting back to a price-led pattern, the tariff and commodity costs proving stickier than guided, the currency tailwind flipping into a headwind, and the valuation multiple sliding toward the high teens, a “dead money” outcome near $129 that the dividend alone does not rescue. The flip factor here is two more quarters of the volume-versus-price breakdown in the earnings release.
Three years. By this point the structural forces in the business start to matter more than any single quarter. The base case has Procter & Gamble delivering something close to its guided 2 to 4 percent organic growth algorithm, its gross-margin decline arrested as restructuring savings fully land, earnings in the high $7 range, and the multiple roughly where it sits today, near $170. The bull case has volume-led growth spreading across categories, the productivity program finally running ahead of costs instead of just keeping pace, and a multiple re-rating as rates ease, near $205. The bear case has private label continuing its slow grind through Procter & Gamble’s largest segment, productivity spent defending margin rather than expanding it, growth stalling near 1 to 2 percent, and the market deciding that a company growing that slowly does not deserve the second-richest multiple in its peer group, landing near $128. The tell to watch is whether the Fabric & Home Care share trend and the gross-margin bridge finally turn the company’s way.
Five years. This far out, it is almost entirely a question of durability and what multiple the market is willing to pay for it. The base case is a fortress-quality compounder growing low-to-mid single digits, with earnings near $8.70 a share against a multiple near 21.5 times, landing near $186, a total return that is roughly the earnings growth plus the current dividend. The bull case has the growth algorithm return to a healthier balance of volume and price, and the valuation multiple hold or expand as rates normalize, landing near $238. The bear case has the premium simply leak away because growth no longer justifies it, with the multiple settling in the mid-teens where Kimberly-Clark, Kenvue, and Unilever already trade, landing near $130, which is close to flat on price with only the dividend as the return. The question that decides which of these plays out is whether five years of productivity investment bought Procter & Gamble real growth, or just defended a shrinking margin.
Where the read lands today. On balance the read holds at Hold. Procter & Gamble is a fortress-quality Dividend King (Wall Street’s label for a handful of companies that have raised their dividend every year for at least 50 consecutive years, a track record of management’s cash discipline and confidence, not a legal promise, since a board can still cut a dividend under severe enough distress) that has genuinely de-rated, trading near 21 times forward earnings against its own approximate historical range in the mid-20s to high-20s, yet a company growing organic sales only 2 to 3 percent a year, with gross margin slipping in every recent period despite a record productivity effort, and still the second-richest multiple in a five-name peer set that grows no slower than it does. That reads as fair value for what the business is today, not cheap and not expensive. Practically, Hold means treating PG as a low-beta defensive holding and an income anchor, not a name to expect meaningful price appreciation from at the current entry point. A cheaper entry combined with a real, volume-led growth reacceleration would be the case for moving up to Accumulate; a stubbornly rich multiple against 2 to 3 percent growth while interest rates stay elevated is the case for moving down to Reduce. The single biggest swing factor over the next year or two is not anything in Procter & Gamble’s own control. It is the direction of interest rates. Here is why that matters for a company whose earnings barely move quarter to quarter: a stock with stable, predictable, decades-long cash flows gets priced the way a long-duration bond does, as a stream of future payments discounted back to today’s dollars. Raise the discount rate, meaning raise interest rates, and the present value of those far-off cash flows falls even if the cash flows themselves are unchanged, which is exactly how a steady business can still see its multiple compress from the mid-20s toward 21 times on rates alone, with nothing wrong with Tide or Pampers at all.
Companion tool
Jump to the interactive dashboard to sort and filter PG against the household and personal-care peer set on valuation, growth, quality, risk, and momentum, or download the Excel model to flex the bull, base, and bear scenarios with your own growth and multiple assumptions.
TL;DR
Procter & Gamble sells the stuff five billion people restock out of habit rather than desire: Tide, Pampers, Gillette, Crest, Olay, Charmin. That non-discretionary repeat purchase is the whole foundation of an $84.3 billion-a-year business with a 51 percent gross margin and a 70-year streak of raising its dividend. But the read has shifted because two things are true at once. First, growth has downshifted to the low single digits, price-led more often than volume-led, and a genuine volume inflection in the most recent quarter is one data point, not yet a trend. The distinction matters because the two kinds of growth are not equally durable: a rival can match a price increase within a quarter, and once you lap the increase in next year’s comparison the growth it produced simply disappears, but winning actual unit volume means a household chose Tide over the store brand at the point of purchase, a harder thing to copy and a harder thing to reverse. Price-led growth can flatter the top line for a while without proving the brand is actually winning. Second, gross margin has fallen in every recent reporting period, not because Procter & Gamble lost pricing power exactly, but because mix shifts, a newly material tariff bill, and reinvestment spending are outrunning a productivity program that is already running at 180 to 210 basis points a period, the largest such effort in years. Layer on a structural, slow-moving private-label drain concentrated in the company’s largest segment, a customer base where Walmart alone is one dollar in six of revenue, and a stock that trades like a bond substitute in a higher-for-longer rate environment, and you get why PG has badly lagged both the S&P 500 and its own sector over the past year even though nothing in the underlying business actually broke. The valuation has come in to compensate, but it has not come in enough to be obviously cheap: at roughly 21 times forward earnings, PG is still the second-priciest name in its peer set, for growth that is no faster than the group.
Explore it yourself: the interactive dashboard
The dashboard carries Procter & Gamble and the peer set covered in this piece side by side, sortable on the same five factors behind the rating above: valuation, growth, quality, risk, and momentum. Use it to check where any single peer sits before you read the company-by-company section below.
Prefer a spreadsheet? The Excel model holds the segment revenue build, the peer valuation table, and the scenario math behind the horizon chart above, so you can substitute your own growth-rate or multiple assumptions and see where the price paths move.
The pantry that never stays empty, and the shelf that stands between
Procter & Gamble does not sell anything anyone actively wants to buy. Nobody wakes up excited to purchase laundry detergent. What they do is run out of it, on a schedule set by how much laundry a household does, and then buy more, almost without thinking about the decision. That habitual, low-consideration repurchase cycle, repeated across roughly five billion people and dozens of categories, is what lets a company with no storefront of its own generate $84.3 billion a year in net sales.
The twist is that “the category is non-discretionary” and “the brand is non-discretionary” are two different claims, and only the first one is true for Procter & Gamble. A household that runs out of detergent will buy detergent. Whether it reaches for Tide or a store brand half the price is a live decision every single trip, and that is exactly where the company’s economics are being tested right now. The business is not shrinking. Its margin of choice is.
Standing between that household decision and Procter & Gamble’s income statement is a second structural fact worth holding in mind for the rest of this piece: the company does not sell to consumers, it sells to retailers who sell to consumers, and one retailer, Walmart, represents roughly 16 percent of Procter & Gamble’s entire global revenue on its own, more than the next several biggest customers combined. Retailers extract their share of the pie through trade spend (the money Procter & Gamble pays a retailer for better shelf placement, a promotional price, or a featured display, effectively a toll for getting the product in front of the shopper), promotional funding, and the constant, credible threat of pushing their own private-label alternative onto the same shelf. That is why Procter & Gamble’s reported gross margin, at 51.2 percent, sits below what you would expect from a company that genuinely dominates the categories it competes in. The shelf is a toll booth, and the toll has been rising.
How the money flows
flowchart TD
    TOP["Consumer demand: ~$84.3B FY2025 net sales, daily-use repeat buys"]
    TOP --> RETAIL["Retail & e-commerce channel"]
    RETAIL --> WMT["Walmart: ~16% of PG total net sales, no other customer >10%"]
    RETAIL --> OTHER_RETAIL["Amazon, Costco, Kroger, Target, club/dollar/e-comm"]
    WMT --> PG["P&G brands & manufacturing: 5 segments"]
    OTHER_RETAIL --> PG
    PG --> SEG1["Fabric & Home Care: $29.6B (Tide, Dawn)"]
    PG --> SEG2["Baby/Feminine/Family Care: $20.2B (Pampers, Always)"]
    PG --> SEG3["Beauty: $15.0B (Olay, SK-II)"]
    PG --> SEG4["Health Care: $12.0B (Oral-B, Crest)"]
    PG --> SEG5["Grooming: $6.7B (Gillette)"]
    INPUTS["Commodity inputs: resins, surfactants, pulp/paper, petrochemicals"] --> PG
    GEO["Geographic mix: NA ~52%, Europe ~22%, Greater China ~7% (swing market)"] --> PG
    POLICY["Tariffs ~$400M + commodities ~$150M after-tax headwind FY26, FX ~$200M tailwind"] --> PG
    PG --> OCF["Operating cash flow: $17.8B FY2025"]
    OCF --> CAPEX["Capex: $3.8B"]
    OCF --> DIV["Dividend: $9.9B, 70-yr increase streak"]
    OCF --> BUYBACK["Buybacks: $6.5B, the flexible lever"]
Read the chain top to bottom and the whole business shows up in one picture. It starts, upstream, with genuinely fungible commodities: petroleum-derived resins and surfactants, fragrance chemicals, and pulp and paper for diapers and tissue. These are globally-priced inputs with no Procter & Gamble-specific advantage attached to them, and the company’s main edge here is simply being one of the largest single buyers in the world, which gives it purchasing leverage a smaller rival cannot match.
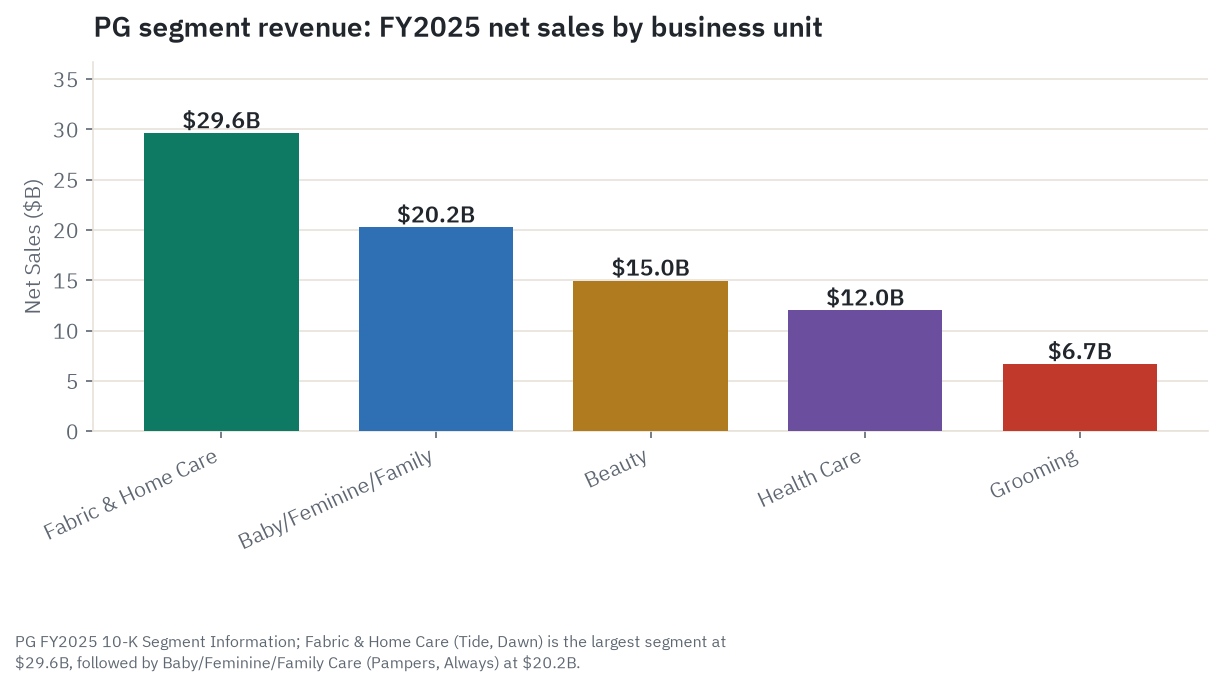
The middle of the chain is where Procter & Gamble actually earns its keep: five product segments, built on decades of brand-building and formulation work, funded by roughly $9.2 billion of annual advertising and $2.1 billion of annual research and development, both larger in absolute dollars than any single-category competitor can spend. Fabric & Home Care, home to Tide and Dawn, is the largest of the five at $29.6 billion. Baby, Feminine & Family Care, home to Pampers and Always, is next at $20.2 billion. Beauty (Olay, SK-II), Health Care (Crest, Oral-B), and Grooming (Gillette) round out the rest.
From there the product has to cross the retail shelf to reach a consumer, and that is the chokepoint described above: Walmart’s roughly 16 percent share of total revenue and the top ten customers’ combined 43 percent give retailers real, structural leverage in every trade-term negotiation, a leverage that grows every time private label gives a retailer a more credible in-house alternative to threaten Procter & Gamble with.
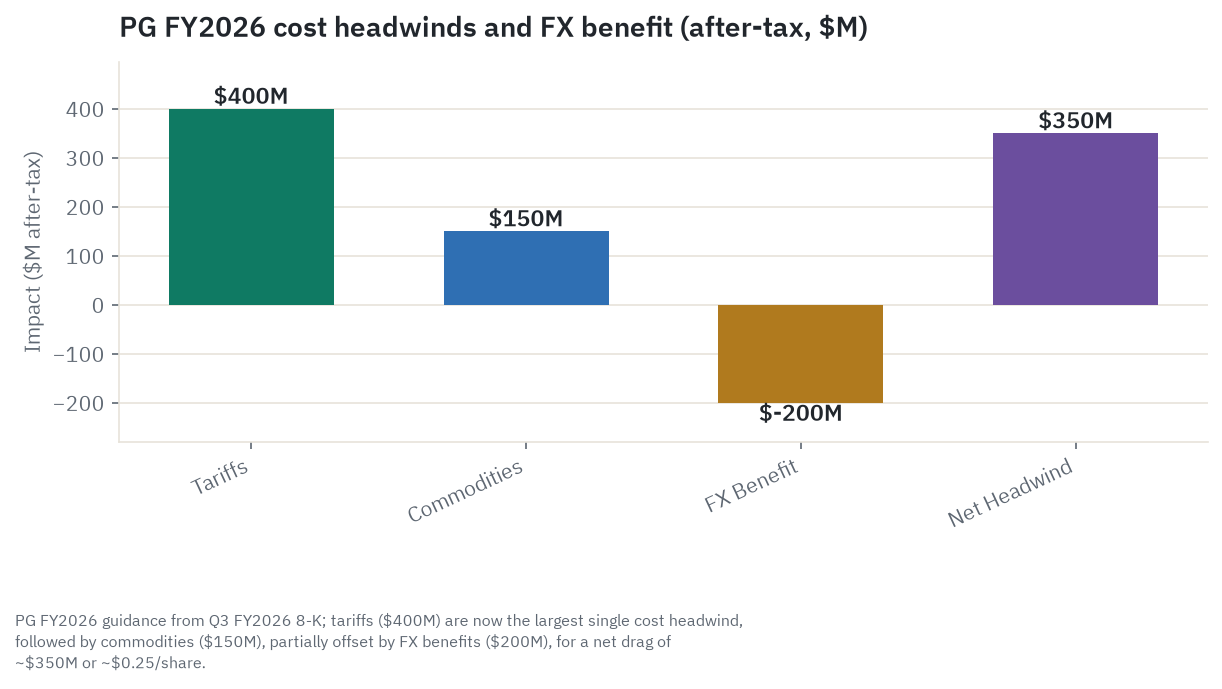
What comes back in cash follows a strict, almost sacred order. Fiscal 2025 operating cash flow was $17.8 billion. Capital expenditure of $3.8 billion keeps the plants running. After that, the dividend is paid first, $9.9 billion in fiscal 2025, backed by a 70-year streak of annual increases that makes Procter & Gamble one of only five US companies with a streak that long. Share buybacks, $6.5 billion in fiscal 2025, are the flexible lever management can turn up or down depending on how much cash is left over. Layered on top of all of it, as the diagram shows, is a policy overlay that barely existed a few years ago: roughly $400 million after-tax of tariff cost, which works out to roughly $0.16 to $0.17 a share against Procter & Gamble’s approximately 2.34 billion shares outstanding, a real but not existential drag, and $150 million of commodity cost guided for fiscal 2026, offset in part by a foreign-exchange tailwind that is itself at risk of flipping.
The five segments, in plain terms
Fabric & Home Care ($29.6 billion in net sales, about 36 percent of the company, the largest segment) is Tide, Ariel, Downy, Dawn, and Cascade. This is the segment with the least product differentiation at the chemistry level, meaning a store-brand detergent can get close to Tide’s actual cleaning performance more easily than a store brand can replicate, say, a razor’s blade-coating technology. That is precisely why this segment carries the most private-label exposure of the five, even though it earns a healthy earnings-before-tax margin near 25 percent.
Baby, Feminine & Family Care ($20.2 billion, about 24 percent of the company) covers Pampers, Always, Luvs, Bounty, and Charmin. High brand loyalty and habitual, high-frequency purchase support a durable earnings-before-tax margin near 26 percent, but the segment’s single biggest long-run risk is demographic, not competitive: fewer babies mean fewer diapers, a trend discussed in more detail below.
Beauty ($15.0 billion, about 18 percent of the company) is Olay and SK-II. This is the most premium-positioned of the five segments and, in fiscal 2025, the weakest, with reported net sales down 2 percent, driven mainly by softness in the ultra-premium SK-II skincare line tied to demand conditions in Greater China. The picture has since improved: in the third fiscal quarter of 2026, Beauty organic sales grew 7 percent, with SK-II up 18 percent in China specifically, the strongest turn of any segment in the most recent print, though it carries the thinnest earnings-before-tax margin of the five at about 23 percent.
Health Care ($12.0 billion, about 14 percent of the company) is Crest, Oral-B, and Vicks, benefiting from a less commoditized competitive set than home care and a favorable geographic mix, with an earnings-before-tax margin near 26 percent.
Grooming ($6.7 billion, about 8 percent of the company) is Gillette, Venus, and Braun, and it is the highest-margin segment of the five at just under 30 percent earnings before tax, reflecting the narrowest competitive set in the portfolio: Procter & Gamble holds more than 45 percent of the global blades-and-razors market and more than 60 percent of the razor category specifically. It is also the segment carrying the biggest single balance-sheet tail risk, discussed in the filings section below.
Procter & Gamble’s own strategy language, taken from its 10-K, is built around five vectors of “superiority”: product performance, packaging, brand communication, retail execution, and value. Paired with a long-term growth algorithm the company has stated for years, organic sales growth above market rates, Core EPS growth in the mid-to-high single digits, and adjusted free cash flow productivity above 90 percent (the share of net earnings that converts into free cash flow after the business has funded its own capital spending, so 90 percent means 90 cents of every profit dollar comes out the other end as cash the company can actually send to shareholders), that is the template the whole business is measured against. The honest read, laid out across the rest of this piece, is that the company is currently delivering on roughly half of that algorithm: the margin structure and cash generation remain excellent, but organic growth is tracking below, not above, market rates, and free cash flow productivity has fallen short of the 90 percent target for two straight years.
Who wins where
Group the household and personal-care industry by role and a clear pattern emerges. The premium-branded leaders, Procter & Gamble and Colgate-Palmolive, still command real category share and real pricing power, but they are also the two names the market has paid the richest multiples for, which means the bar for continued outperformance is set correspondingly high. The value-priced global scale player, Unilever, has leaned into a simplified “Power Brands” portfolio and posted genuinely volume-led growth, but its stock is only accessible to US investors as a foreign-primary-listed ADR carrying currency-translation noise, and it has been the worst-performing name in this peer set on a year-to-date basis even as its underlying growth has looked healthy.
The consolidating middle, Kimberly-Clark and Kenvue, is in the middle of an unusual, unfinished transaction: Kimberly-Clark’s roughly $48.7 billion agreed acquisition of Kenvue, approved by both companies’ shareholders in January 2026 but still sitting in a Federal Trade Commission second-request review, with a close expected in the second half of 2026 that is not guaranteed on the current terms or timeline. If it closes as structured, it creates a roughly $32 billion consumer-health and wellness competitor that overlaps directly with Procter & Gamble’s Health Care segment (Listerine against Crest and Oral-B) and its Beauty segment (Neutrogena and Aveeno against Olay and SK-II). Until it closes, both stocks trade partly as a merger-arbitrage situation.
The smaller, faster-growing focused player, Church & Dwight, posted the strongest organic growth and the clearest margin expansion of anyone in this group this quarter, built on an acquire-and-innovate model around brands like Arm & Hammer and OxiClean, but it is also the smallest of the branded peers by a wide margin, with less retailer leverage than Procter & Gamble’s scale provides. The single-category name in visible trouble, Clorox, is guiding to a full-year organic sales decline near 9 percent and an earnings-per-share decline in the mid-20s percent range, the weakest print in the entire peer set this cycle, even as its GOJO and Purell hygiene acquisition adds a potentially durable long-run adjacency.
Rounding out the picture are two much larger, foreign-primary-listed names, Nestle and Reckitt Benckiser, that are broader food-and-nutrition or hygiene-and-health conglomerates rather than direct household-and-personal-care comparables. Neither company’s current-period results were independently verified in this research pass, so neither is treated as a like-for-like data point below; both are flagged here only for completeness and access context.
Company by company: who’s who
Procter & Gamble (PG), NYSE, market cap approximately $341.5 billion as of June 30, 2026. The largest household and personal-care company in this group by scale, with premium-priced share leadership across most of the categories it competes in. Fiscal third-quarter 2026 (quarter ended roughly March 2026): net sales up 7 percent to $21.2 billion, organic sales up 3 percent (volume up 2 percent, price up 1 percent), ten of ten categories and seven of seven regions growing organically, Core EPS $1.59 (up 3 percent), diluted EPS $1.63 (up 6 percent), and the 70th consecutive annual dividend increase declared in April 2026. Bull: unmatched scale, pricing power, and an innovation and productivity pipeline keep organic growth positive and broad-based even as global category volumes grow only modestly. Bear: growth has slowed to the low single digits and leans on price and mix more than volume, gross margin has fallen in every recent period despite record productivity, and private-label and tariff-driven input costs are a persistent, structural drag on the company’s largest segment.
Unilever (UL), NYSE-listed ADR of a primary Amsterdam and London listing, market cap approximately $129.9 billion. Procter & Gamble’s closest global-scale peer by revenue, running a leaner, simplified “Power Brands” strategy across Dove, Knorr, Vaseline, Domestos, and Hellmann’s. First-quarter 2026 underlying sales growth was 3.8 percent, split 2.9 points of volume and 0.9 points of price, with full-year guidance held at the bottom of a 4 to 6 percent underlying sales growth range. Bull: emerging-market weighting, led by India, and a simplified brand portfolio are delivering volume-led growth that is outpacing several US peers. Bear: US investors only hold an ADR of a foreign-primary-listed stock, carrying pound and euro translation noise, and the stock was the worst year-to-date performer in this peer set even as its underlying growth looked healthy.
Colgate-Palmolive (CL), NYSE, market cap approximately $73.4 billion. The global oral-care category leader, with Colgate toothpaste holding roughly 40 percent-plus global share by most trade estimates, plus the faster-growing Hill’s Pet Nutrition adjacency. First-quarter 2026 net sales rose 8.4 percent to $5.32 billion, but GAAP diluted earnings per share actually fell to $0.80 from $0.85 even as non-GAAP EPS rose, and full-year gross-margin guidance was cut mid-year on tariffs and input-cost inflation. Bull: category leadership in oral care plus Hill’s give Colgate pricing power most single-category peers lack. Bear: at roughly 22.7 times forward earnings, the richest multiple in this peer set, Colgate’s growth story already looks priced in, and its own gross-margin guidance cut shows real cost pressure reaching the bottom line even as headline sales grow.
Kimberly-Clark (KMB), NASDAQ, market cap approximately $36.4 billion. The maker of Huggies, Kleenex, Cottonelle, and Scott, currently reshaping its own portfolio on two fronts at once: divesting its International Family Care and Professional unit while simultaneously pursuing the pending Kenvue acquisition described above. First-quarter 2026 net sales were $4.2 billion, up 2.7 percent, with adjusted earnings per share of $1.97 beating estimates. Bull: if the Kenvue deal closes as structured, Kimberly-Clark becomes a roughly $32 billion global health-and-wellness leader with meaningful targeted cost synergies. Bear: the deal remains pending an active Federal Trade Commission second-request review, ties Kenvue shareholders’ ultimate value to Kimberly-Clark’s own share price at close, and Kimberly-Clark was the worst one-year price performer in this entire peer set even before accounting for deal-completion risk.
Church & Dwight (CHD), NYSE, market cap approximately $23.0 billion. Maker of Arm & Hammer, Trojan, OxiClean, and Waterpik, historically the fastest organic grower in this group through an acquire-and-innovate model. First-quarter 2026 organic sales grew 5 percent, beating the company’s own 3 percent guide, with adjusted gross margin up 130 basis points to 46.4 percent. Bull: the strongest organic growth and clearest margin expansion of any peer in this group this quarter, driven by volume rather than price. Bear: small scale means less retailer and supplier leverage than Procter & Gamble, and reported top-line revenue is actually shrinking as legacy brands are divested even while organic sales grow.
Clorox (CLX), NYSE, market cap approximately $11.5 billion. Maker of Clorox bleach, Pine-Sol, Kingsford, Brita, and the recently acquired GOJO and Purell hand-hygiene business. Fiscal third-quarter 2026 net sales were flat at $1.67 billion with organic sales down 1 percent and gross margin down 140 basis points, and full-year guidance was cut sharply: organic sales now guided down roughly 9 percent and diluted earnings per share down 24 to 27 percent, with shares falling about 9.7 percent on the print. Bull: the GOJO and Purell hygiene adjacency adds a durable brand and a fast-growing category for whenever underlying demand stabilizes. Bear: demand is actively falling while margins compress at the same time, the opposite of the trend at every other peer in this group.
Kenvue (KVUE), NYSE, market cap approximately $36.7 billion. The consumer-health maker of Tylenol, Band-Aid, Listerine, and Neutrogena, spun off from Johnson & Johnson in 2023 and now the subject of the pending Kimberly-Clark acquisition described above. Bull: the fixed cash-and-stock deal terms provide a locked-in takeover premium and downside support if the acquisition closes on current terms. Bear: regulatory risk is real. The Federal Trade Commission’s second-request review means closing is not guaranteed on the current terms or timeline, and the stock portion of the deal ties Kenvue holders’ ultimate value to Kimberly-Clark’s own share price at close.
Nestle (NSRGY), thinly-traded OTC ADR of a primary Swiss Exchange listing, market cap approximately $264.5 billion. The world’s largest packaged food and beverage company by revenue, several times Procter & Gamble’s size but only partially comparable given its food, coffee, and pet-care weighting versus Procter & Gamble’s home-and-personal-care focus. Current-period results were not independently verified in this research pass. Bull, qualitatively: unmatched global scale and category diversification reduce single-category risk relative to the pure-play staples names above. Bear, qualitatively: the ADR trades thin relative to the underlying float, a real access consideration for US investors, separate from any operating question.
Reckitt Benckiser (RBGLY), thinly-traded OTC ADR of a primary London Stock Exchange listing, market cap approximately £31.2 billion, roughly $41 billion to $45 billion depending on the quoting source. Maker of Lysol, Dettol, Durex, and Nurofen, a broader hygiene, health, and nutrition portfolio than the pure household-and-personal-care peers above. Current-period results were not independently verified in this research pass. Bull, qualitatively: a multi-year portfolio simplification toward hygiene and health could support a re-rating if organic growth stabilizes. Bear, qualitatively: growth has trailed most peers in this set in recent years, and the thin OTC ADR is a real access consideration for US investors separate from any operating question.
What the filings say
Procter & Gamble’s fiscal 2025 (year ended June 30, 2025) net sales were $84,284 million, essentially flat versus fiscal 2024’s $84,039 million on a reported basis, but organic sales, which strip out currency and portfolio changes, grew 2 percent, with all five segments posting low-single-digit organic growth. Operating income rose 10 percent to $20,451 million and operating margin expanded 220 basis points to 24.3 percent, though that comparison is flattered by a one-time, non-cash $1.3 billion Gillette intangible impairment the company took the prior year that depressed the fiscal 2024 base. Diluted earnings per share were $6.51, up 8 percent, and Core EPS, the company’s preferred non-GAAP measure that strips out restructuring costs and the prior-year impairment, was $6.83, up 4 percent.
The headline number that matters most, though, is one that went the wrong way: gross margin actually declined 20 basis points to 51.2 percent in fiscal 2025, even with productivity savings adding 180 basis points and pricing adding another 30. Unfavorable product mix cost 110 basis points, higher product and packaging investment cost 50, commodities cost 30, unfavorable currency cost 20, and tariffs, a new and growing line item, cost 10. The pattern only intensified into fiscal 2026: in the third fiscal quarter (ended March 31, 2026), net sales rose 7 percent to $21,235 million on 3 percent organic growth (2 points volume, 1 point price), but gross margin fell a sharper 150 basis points on a reported basis, or 100 basis points on a core basis, as mix, tariffs, and reinvestment spending outran an even larger 210-basis-point productivity contribution. Picture a treadmill that keeps speeding up: Procter & Gamble is running harder on cost efficiency every single period, and still losing ground, because the costs stacked against it are growing faster than the belt can be outrun. Nine-month fiscal 2026 net sales were $65,828 million (up 4 percent, up 2 percent organic), with gross margin down 110 basis points to 50.7 percent and Core EPS of $5.46, up 2 percent.
Cash flow and the balance sheet. Fiscal 2025 operating cash flow was $17.8 billion, down 10 percent year over year, and adjusted free cash flow, the company’s preferred cash-generation metric, was $14.6 billion, down 14 percent, with adjusted free cash flow productivity falling to 87 percent from 105 percent the year before, below the company’s long-stated 90 percent-plus target. Nine-month fiscal 2026 adjusted free cash flow productivity came in around 92 percent on a year-to-date basis, though the single third fiscal quarter’s own figure, reported separately, ran closer to 82 percent; guidance for the full 2026 fiscal year is 85 to 90 percent, and that guide, rather than any single quarter’s figure, is the most reliable anchor. Capital expenditure was $3,773 million in fiscal 2025. On the balance sheet as of June 30, 2025, cash was $9,556 million against total debt of approximately $34.51 billion (current maturities of $9,513 million plus long-term debt of $24,995 million), for net debt of approximately $25.0 billion. Goodwill was $41,650 million, heavily Gillette-related, other intangibles net were $21,910 million, total assets were $125,231 million, and total equity was $52,284 million. By March 31, 2026, cash had built to $12,306 million against total debt of $37,026 million, putting net debt closer to $24.7 billion on the most recent quarter’s figures. Procter & Gamble carries Aa3 and AA- credit ratings from Moody’s and S&P respectively and maintains billions of dollars in undrawn credit facilities as a backstop, an investment-grade profile that gives the company a low, stable cost of debt regardless of where the broader cycle sits.
Capital returns. Procter & Gamble has paid a dividend every year since 1890, 136 consecutive years, and raised it every year for 70 consecutive years since 1956, one of only five US companies with a streak that long. The April 2026 increase brought the quarterly rate to $1.0568 per share, up from $1.0065 a year earlier. Fiscal 2025 dividends paid were $9,872 million, and share buybacks were $6,500 million under a program that targeted $6 to $7 billion for the year; nine-month fiscal 2026 buybacks were $4,153 million. Guidance for full fiscal 2026 calls for roughly $10 billion of dividends and $5 billion of buybacks, about $15 billion of total cash return. Share count is shrinking modestly, from about 2,368 million basic weighted-average shares in fiscal 2023 to about 2,350 million in fiscal 2025, with buybacks more than offsetting the dilution from convertible preferred stock and equity compensation.
Guidance. As of the April 24, 2026 third-quarter release, Procter & Gamble maintained, rather than raised, its fiscal 2026 guidance: all-in sales growth of 1 to 5 percent, organic sales growth “in-line to up 4 percent,” diluted EPS growth of 1 to 6 percent, and Core EPS growth “in-line to up 4 percent,” implying a range of $6.83 to $7.09 per share off the fiscal 2025 base. Critically, management stated it now expects results toward the lower end of that guided range, citing the cost stack described below, while at the same time choosing to step up spending on innovation and demand creation specifically to defend the volume recovery.
The cost headwind stack, kept separate on purpose. Guided for fiscal 2026, and confirmed individually in the company’s own earnings materials: tariffs, roughly $400 million after-tax, the newest and now largest single line item in the bridge; commodities, roughly $150 million after-tax, a figure that was itself revised up mid-year from a prior guide of roughly neutral; net interest and tax, roughly $250 million after-tax; and a foreign-exchange tailwind of roughly $200 million after-tax that is set against first-half-2025 dollar weakness and is at real risk of flipping into a headwind if the dollar index holds above 100. Management has separately flagged that the Iran and Middle East conflict and the resulting oil-price spike could add a further cost, and it is worth being precise about the scale of that one: the company has guided to roughly $150 million after-tax in fiscal 2026 tied to that conflict, concentrated in the fiscal fourth quarter. Management has also said that if Brent crude were to hold near $100 a barrel for a full year rather than mean-revert, the annualized after-tax cost could approach $1 billion. That billion-dollar figure is a stated scenario for a sustained, multi-quarter oil shock, not a confirmed fiscal 2026 actual or a base case, and it should never be read as money Procter & Gamble has already lost.
Recent events worth flagging. In June 2025 Procter & Gamble announced a “Focused Portfolio, Supply Chain and Productivity Plan,” expecting $1.5 to $2.0 billion of before-tax restructuring costs over two years, more than half landing by the end of fiscal 2026, including the elimination of up to 7,000 non-manufacturing overhead roles by the end of fiscal 2027, with manufacturing’s roughly 52,000 employees explicitly exempted. This is explicitly framed by management as a margin-defense and productivity lever responding to both the US category growth slowdown and rising tariff costs, not a growth-acceleration initiative in its own right. In January 2026, the decades-old Glad joint venture with Clorox expired, and Clorox bought out Procter & Gamble’s minority stake for roughly $476 million, generating an after-tax gain of $261 million that inflated reported, though not Core, third-quarter EPS. On February 20, 2026, the US Supreme Court ruled that certain IEEPA-based tariffs were invalid; Procter & Gamble had already paid roughly $200 million under that authority that may now be recoverable, though no recovery has yet been recognized in its financial statements.
Disclosed risks that matter. Procter & Gamble’s own filings flag customer concentration explicitly: Walmart alone represents about 16 percent of consolidated net sales, up from 15 percent two years earlier, and the top ten customers together are 43 percent, up from 40 percent, with the company stating plainly that continued concentration “could create significant cost and margin pressure,” particularly if a key customer expands its own private-label offerings. The filings also flag the Gillette indefinite-lived intangible asset, carried at $12.8 billion as of March 31, 2026, roughly 10 percent of total assets, as “susceptible to impairment risk” if grooming-category growth, pricing power, or currency assumptions deteriorate, a disclosed tail risk rather than a prediction of an actual impairment.
Insider and institutional signal. Per the fiscal 2025 proxy, Vanguard and BlackRock each hold more than 5 percent of shares outstanding, a typical, passive-index-dominated ownership base for a Dow component of this size, though both figures trace back to Schedule 13G filings from December 2023 and January 2024, the most recent on file, so the exact current percentage should be read as directionally right but not perfectly current. On the insider side, Form 4 filings from February 2026 show routine post-vesting option-exercise-and-sell transactions from several senior executives, including the chairman, with no open-market insider purchases found. That pattern is common at large-cap consumer-staples companies with regular equity-compensation vesting and should be read as a weak, unremarkable signal, not evidence of a specific negative view, but also not a vote of confidence via open-market buying.
What the market is paying
Procter & Gamble closed at $146.64 on June 30, 2026, down about 1.2 percent on the day, within a 52-week range of $137.62 to $167.25, putting the stock in the lower-to-middle half of its own one-year band. Market capitalization was approximately $341.5 billion across roughly 2.33 billion shares outstanding. Beta over five years is 0.38, a textbook low-beta consumer-staples defensive, but the stock has not behaved calmly on every measure this year: it swung from its 52-week high to its 52-week low, a peak-to-trough move of nearly 18 percent, after a fiscal first-quarter print flagged decelerating category volumes and rising tariff and commodity pressure, a real, fundamentals-driven drawdown rather than pure macro noise.
The trailing-twelve-month return tells the real story: PG’s price return over the past year was approximately negative 8 percent, against the S&P 500’s roughly positive 21 percent and its own staples sector ETF’s roughly positive 3 percent. Year-to-date, PG is up about 2.3 percent, which sounds fine in isolation but lags both the S&P 500’s roughly 9.5 percent and the staples sector’s roughly 6.9 percent gain over the same stretch. Against its five closest named peers, PG’s one-year return of about negative 8 percent is actually the second-best in the group, ahead of Unilever, Kenvue, and Kimberly-Clark (the worst performer at roughly negative 15 percent), and behind only Colgate’s essentially flat result. Read together: this has been a weak year for the whole household and personal-care peer group, not a Procter & Gamble-specific story, but it has also been a weak year, full stop, against a market that rallied hard.
Valuation. Trailing price-to-earnings is approximately 21.5 times, and forward price-to-earnings is approximately 21 times, tight agreement across several data vendors. Dividend yield is approximately 2.9 percent. Against its own trading history, PG’s current multiple sits meaningfully below its approximate five-year and ten-year average of roughly 25 to 28 times, though that historical average itself was sourced from a search-snippet summary rather than a directly verified page this research pass, so it should be treated as indicative context rather than a precisely confirmed figure. Against its named peers, PG’s forward multiple of roughly 21 times is the second-richest of the five, behind only Colgate’s 22.7 times, and ahead of Unilever’s 15.5 times, Kenvue’s 15.2 times, and Kimberly-Clark’s 14.5 times, while carrying the lowest dividend yield of the group at 2.9 percent against 3.7 to 4.6 percent for the others.
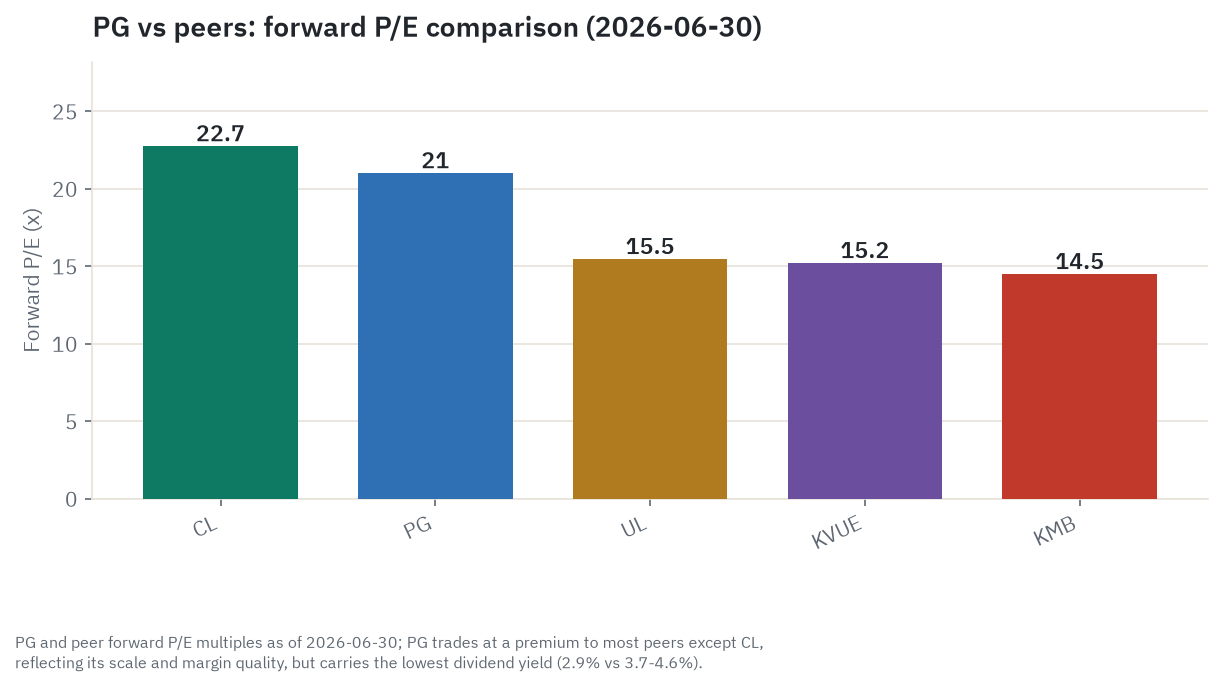
Put those two facts side by side and the valuation argument is genuinely two-sided. PG looks cheap against its own history and roughly 10 to 12 percent below the current analyst-mean price target. It looks rich against its peer group, for growth that is no faster than the names trading at a meaningfully lower multiple. A PEG ratio, which measures a valuation multiple against a growth rate, would help settle this, but data vendors disagree sharply on PG’s PEG, one putting it near 4.2 and another near 6.6, a gap wide enough that neither number should be treated as fact; both, notably, sit well above the 1.0 to 2.0 range that value-oriented investors typically look for, whichever input is correct.
Liquidity and positioning. Average daily trading volume is roughly 9 million shares, highly liquid with no positioning constraint for any size of trade. Short interest is roughly 1.1 percent of float, low in absolute terms, though it has risen about 74 percent year over year, worth watching but not an extreme reading. Sell-side coverage is buy-leaning across every vendor checked, with zero sell ratings among the roughly 22 to 25 analysts tracked, a mean price target in the $161 to $164 range, and a consensus rating that reads “Moderate Buy,” though those estimates have been trimmed modestly over the past 30 days as fiscal 2026 and 2027 earnings expectations came down. PG’s next earnings date is August 4, 2026, before market open.
What the crowd is saying
The narrative around Procter & Gamble in financial media and retail-investor commentary splits cleanly into two camps that rarely talk to each other. One camp treats the stock as exactly what it has been for decades, a Dividend King and a defensive anchor to own through any cycle, an argument that leans almost entirely on the 70-year increase streak and the fortress balance sheet. The other camp treats it as a slow grower whose stock has quietly underperformed the market for a full year, an argument that leans on the trailing return gap against the S&P 500 and the still-rich relative multiple. Both framings are using real, sourced facts. Neither one, on its own, is the whole picture, which is exactly why this piece spends so much time on both sides.
One data-quality note worth being explicit about: an earlier sentiment-research pass for this run produced numbers that directly contradict the verified market data used above, including a stale closing price, a stale 52-week high, a materially different year-to-date return, and a claim that Procter & Gamble had explicitly stated private label was losing market share, which is the opposite of what the company’s own disclosures and third-party retail data actually show. None of those contaminated figures appear anywhere in this article. Only the qualitative framing, Dividend King versus slow grower, is carried forward here, and it is presented as market mood, not as fact.
The useful, honest divergence to flag is this: the “safe blue-chip” narrative that still surrounds Procter & Gamble in much retail commentary has not caught up to what the filings actually show, which is a gross margin that has fallen in every recent reporting period. The stock’s own price action, lagging the market by a wide margin over the trailing year, is arguably a more accurate reflection of the underlying fundamentals than the reflexive “steady Dividend King” framing that still dominates a lot of the public conversation about the name.
The durability question: what has to be true, and what breaks it
The structural case for Procter & Gamble’s demand is about as strong as consumer demand gets. People do not stop washing clothes, changing diapers, or brushing their teeth in a downturn. That is a genuinely different claim from “people keep buying Procter & Gamble’s specific brand at Procter & Gamble’s specific price,” and the entire investment debate about this stock lives in the gap between those two statements.
The bull case rests on three things that are real, not hypothetical. First, the third fiscal quarter of 2026 delivered the first company-wide positive volume growth in a year, alongside every one of ten categories and every one of seven regions growing organically, a genuine signal that the worst of the post-inflation volume slowdown may be behind the company rather than just a favorable comparison against a weak prior-year quarter. Second, the restructuring and productivity program, unusually large by Procter & Gamble’s own historical standards, is explicitly designed to offset a genuinely new, non-transitory cost item in tariffs rather than to chase generic efficiency; if tariff policy stabilizes from here, that same program becomes pure margin upside instead of a defensive offset. Third, the rate-cut optionality is real and unusually favorable for a company with this dividend track record. If the current, hawkish rate stance proves to be a temporary response to an energy-driven inflation spike rather than a durable regime change, Procter & Gamble is one of the more obvious beneficiaries of a subsequent re-rating.
The bear case does not require anything to break. It requires three moderate, entirely plausible forces to keep compounding at the same time they already are. First, private-label and discounter share gains keep eating into Fabric & Home Care, the largest segment at roughly 36 percent of revenue, faster than productivity savings can offset, especially if real wage growth stays flat to negative across the developed world at the same time. Once a household adopts a store-brand detergent and finds it good enough, reverting to the premium brand requires an active choice, not habit, and the switching cost runs in the wrong direction for Procter & Gamble. Second, the tariff, commodity, and possible oil-shock cost stack proves stickier than guided and is only partly offset by restructuring savings, forcing a genuine choice between protecting margin by raising price, which risks the fragile volume recovery, or protecting volume by absorbing the cost, which compresses an already-defended margin further. Third, the dollar’s mid-2026 strength persists, turning the guided foreign-exchange tailwind into a headwind while the Federal Reserve holds rates higher for longer on sticky, energy-driven inflation, a double blow that would compress both earnings and the valuation multiple at the same time, the classic mechanism behind exactly the kind of drawdown a bond-proxy staples stock has already shown once this cycle.
The most likely path, on the evidence gathered here, is a split verdict rather than a clean call in either direction. The underlying category demand is not going to see a durable, broad-based collapse in detergent, diapers, or toothpaste. The volume inflection in the most recent quarter is a genuinely positive, if not yet fully proven, signal. At the same time, the cost stack is a real, multi-hundred-million-dollar drag the productivity program is racing to offset rather than comfortably absorbing, and the private-label pressure in the largest segment is a slow structural bleed rather than a cyclical one that reverses on its own. The most probable near-term outcome is organic growth landing near the low-to-middle of the guided range, modest earnings growth, and a stock whose total return over the next year is driven more by the direction of interest rates than by any single operating print, a genuine bond-proxy dynamic sitting on top of a business whose actual unit economics are more stable than its share price behavior over the past year would suggest.
One geography deserves a specific correction here, because it is the most commonly misstated part of the current story: Greater China has improved meaningfully in the most recent quarter, with organic sales up 3 percent, Beauty organic sales up 7 percent, and SK-II specifically up 18 percent in China, a real, current-quarter inflection, not a stale figure. The durable China concern for Procter & Gamble is not current demand weakness. It is structural: China’s birth rate fell to 5.6 per 1,000 people in 2025, down roughly 13 percent since 2023, a direct, long-run headwind to the company’s Baby Care franchise in what was supposed to be a growth market. Cyclical China weakness can recover, and on the latest evidence it has started to. A falling birth rate does not reverse.
The scenarios in detail
Four variables decide where Procter & Gamble’s stock lands over the next five years. The three scenarios below are simply different settings of these same four dials.
The organic growth rate, and whether it is volume-led or price-led. Fiscal 2025 organic growth was 2 percent, split evenly between price and volume, the lower-quality kind of growth for a mature staples business. The third fiscal quarter of 2026 printed 3 percent organic growth with 2 points of volume, the first company-wide positive-volume quarter in a year. The single most important open question for the entire thesis is whether that volume inflection repeats once comparisons get harder in the back half of fiscal 2026, or whether the price-led fiscal 2025 pattern turns out to be the real trend.
The gross-margin trajectory. Gross margin has fallen in every recent period, fiscal 2025 down 20 basis points, nine-month fiscal 2026 down 110, third-quarter fiscal 2026 down 150 on a reported basis, despite 180 to 210 basis points of manufacturing productivity savings each period. The productivity engine is running just to lose ground, because mix, tariffs, and reinvestment spending are two to three times the size of the pricing lever. Whether the restructuring program can finally get this bridge back to flat or positive is the second dial.
The multiple, and the rate regime it moves with. Procter & Gamble trades in large part as a long-duration bond proxy, and its roughly 21-times forward multiple moves inversely to the risk-free rate to a degree that has little to do with the underlying business. That multiple sits below the company’s own approximate 25-to-28-times historical range, but it is still the second-richest in its named peer set while carrying the lowest yield. This dial has moved the stock more than any single operating metric over the past year.
Structural share pressure from private label and retailer power. US private-label sales reached roughly $330 billion in 2025, about 23 to 24 percent of the market, and grew roughly three times faster than national brands, with household products, Procter & Gamble’s largest exposure, losing the most relative ground. Research firm Circana expects that pace to slow in 2026 rather than accelerate further, so this is better described as a grind than a cliff, but the specific risk, Procter & Gamble’s own share loss within Fabric & Home Care, compounds with rising customer concentration that the company’s own filings flag as a margin risk.
Bull case: the algorithm re-normalizes and the bond proxy re-rates
Organic growth of 4 to 6 percent, volume-led, as the third-quarter fiscal 2026 inflection broadens and holds. Gross margin returns to flat-to-modestly-positive as restructuring savings compound and tariffs stabilize or partly refund. Beauty and China recovery continues along the lines already showing up in the most recent quarter. The Federal Reserve pivots to cutting rates, and the bond-proxy multiple re-rates from roughly 21 times toward 23 to 24 times. Core EPS grows toward roughly $10 a share by the early 2030s. Illustrative valuation: roughly $10 of earnings at roughly 23.5 times works out to a price near $235 to $240. What has to be true: volume growth persists for multiple quarters against harder comparisons, and the productivity engine finally outruns mix and tariff drag while rates fall. What most likely breaks it: rates stay higher for longer on sticky, energy-driven inflation, so the multiple never re-rates even if the underlying business delivers.
Base case: a fortress compounder, fairly priced
Organic growth of 2 to 4 percent, gross margin roughly flat as productivity and restructuring offset a persistent cost stack, and the multiple holding near 21 times, below the company’s own history but sustained by its quality and defensive-demand profile. Core EPS grows 4 to 5 percent a year toward roughly $8.70 by the early 2030s. Illustrative valuation: roughly $8.70 of earnings at roughly 21.5 times works out to a price near $185 to $190. What has to be true: the volume inflection holds enough to keep organic growth inside the guided algorithm, and the cost stack stays offsettable by productivity without a multiple collapse. What most likely breaks it: the tariff, commodity, and currency stack proves stickier than productivity can absorb, dragging both earnings and the multiple below plan.
Bear case: a slow de-rating the dividend does not rescue
Organic growth stalls at 1 to 2 percent, price-led again as the volume inflection fails to repeat. Private label keeps grinding Fabric & Home Care share so gross margin keeps slipping despite record productivity. The guided foreign-exchange tailwind flips to a headwind, the Federal Reserve holds rates higher for longer, and the market de-rates the stock toward the peer group’s 15-to-17-times zone because a 2-to-3-percent grower does not merit the group’s second-richest multiple. Core EPS grows only 1 to 2 percent a year toward roughly $7.55 by the early 2030s. Illustrative valuation: roughly $7.55 of earnings at roughly 17 times works out to a price near $125 to $130. This is not a scenario where anything dramatically breaks. It is dead money, roughly flat to modestly negative price return while the S&P 500 compounds well ahead of it, exactly as the trailing year has already played out, with the dividend yield as the only real return. What most likely rescues the stock from this path: a dovish Federal Reserve pivot, which would re-rate the multiple on rates alone even if the operating story stays only okay.
All dollar levels above are illustrative scenario arithmetic built on stated growth-rate and exit-multiple assumptions, anchored on the verified $146.64 close as of June 30, 2026. None of them is a price target, and none should be read as a forecast of fact.
Catalysts and timeline. The nearest-term event is the August 4, 2026 fiscal fourth-quarter and full-year report, which confirms whether Procter & Gamble landed at the guided low end and, more importantly, delivers the first fiscal 2027 guidance. Beyond that, the volume-versus-price split in the next one to two quarterly prints is the single most-watched line item, alongside the path of the tariff, commodity, and currency stack, and whether the roughly $150 million of potential IEEPA tariff-refund recovery actually materializes. Over a multi-year horizon, the Federal Reserve’s rate path, the private-label share curve in household products, China’s structural birth-rate trend, the ultimate closing (or non-closing) of the Kimberly-Clark and Kenvue combination, and the sensitivity of the Gillette intangible asset to a higher-rate, slower-growth world are the inflections that matter most.
Companies to watch (bull / base / bear)
Procter & Gamble (PG), the primary name in this piece. Bull: the volume inflection broadens, the productivity program finally outruns the cost stack, and a rate pivot re-rates the multiple. Base: a fortress 2-to-4-percent compounder, fairly priced near 21 times, total return roughly matching earnings growth plus the dividend. Bear: private label keeps grinding the largest segment, margin keeps slipping despite record productivity, and the multiple de-rates toward the mid-teens where the cheaper peers already sit. Watch: the volume-versus-price split in each quarterly release, and the gross-margin bridge sign.
Colgate-Palmolive (CL). Bull: Hill’s Pet Nutrition and oral-care category leadership sustain above-peer pricing power. Base: steady low-single-digit organic growth continues to command the group’s richest multiple. Bear: the multiple already looks fully priced for the growth on offer, and the mid-year gross-margin guidance cut shows real cost pressure reaching GAAP earnings. Watch: whether gross-margin guidance stabilizes or is cut again.
Unilever (UL). Bull: India-led emerging-market volume growth and a simplified Power Brands portfolio continue to outpace US peers. Base: underlying sales growth holds near the low end of its 4-to-6-percent guided range. Bear: currency translation and a foreign-primary listing keep US shareholder returns lagging the underlying growth story. Watch: whether the year-to-date underperformance versus this peer set closes or widens.
Kimberly-Clark (KMB) and Kenvue (KVUE), a linked pair. Bull: the roughly $48.7 billion combination closes as structured, creating a scaled consumer-health competitor with real cost synergies. Base: the deal proceeds through Federal Trade Commission review on the current expected second-half-2026 timeline. Bear: the deal is blocked, delayed, or restructured by regulators, leaving both companies in limbo and Kenvue shareholders exposed to Kimberly-Clark’s own depressed share price. Watch: the Federal Trade Commission’s second-request timeline and any public signal on the review’s direction.
Church & Dwight (CHD). Bull: the fastest organic growth and clearest margin expansion in this group continues on a volume-led basis. Base: organic growth holds near the company’s own 3-to-4-percent guide even as reported revenue keeps shrinking on divestitures. Bear: small scale limits retailer leverage relative to larger peers as the industry-wide private-label pressure persists. Watch: whether organic growth decelerates back toward the smaller scale this company’s peers would suggest.
Clorox (CLX). Bull: the GOJO and Purell hygiene adjacency provides a durable growth leg once underlying demand stabilizes. Base: the sharp fiscal 2026 guidance cut proves to be the trough, with a slow recovery in the following fiscal year. Bear: demand keeps falling while margins keep compressing at the same time, an unusually weak combination in this peer set. Watch: whether the next quarterly print shows any stabilization in organic sales.
Risk controls
The single largest risk sitting outside Procter & Gamble’s own control is the direction of interest rates. Because the stock trades in part as a bond substitute, a reader positioning around this name should treat rate-path risk as at least as important as any single operating metric, and should not assume that a strong quarterly print alone will move the stock if the rate backdrop stays unfavorable.
The single largest risk inside the company’s own control is the Fabric & Home Care margin fight against private label. This is a slow, structural bleed rather than a single event, so the right way to track it is the trend in the gross-margin bridge over several quarters, not any one data point.
Customer concentration is a real, filing-disclosed risk: Walmart alone is roughly 16 percent of total revenue, and a reader should treat any deterioration in that relationship, or any acceleration of Walmart’s own private-label push, as a material negative development rather than routine retailer-supplier friction.
Valuation risk cuts both ways here and deserves honest framing. Procter & Gamble is genuinely cheaper than its own history, but it is not cheap in absolute terms or against its peer group, so a reader should not treat the de-rating alone as a margin of safety; the growth rate still has to hold up for the current multiple to make sense.
The Gillette intangible asset, carried at $12.8 billion, is a disclosed tail risk rather than a near-term concern, but it is worth knowing about specifically because it means a genuinely adverse combination of slower grooming-category growth, higher discount rates, and unfavorable currency movement could, in a severe enough scenario, trigger another non-cash impairment charge similar to the one taken in fiscal 2024.
Finally, access and liquidity are not risks for the primary name itself. PG trades on the NYSE with roughly 9 million shares of average daily volume and no positioning constraint. The access risk in this piece belongs to the two foreign-primary-listed peers discussed above, Nestle and Reckitt Benckiser, whose thin OTC ADRs are a genuinely different liquidity profile than anything else covered here.
Methodology, sourcing, and data-quality flags
This article draws on Procter & Gamble’s fiscal 2025 Form 10-K, its third-quarter fiscal 2026 Form 10-Q and 8-K earnings release, its fiscal 2025 proxy statement, and Form 4 insider-transaction filings, cross-checked line-by-line against the underlying EDGAR filing text rather than relying on secondary summaries. Of the 67 load-bearing claims reviewed for this run, 66 were verified directly against primary sources. One claim, an outdated dividend-streak figure, was cut entirely because it conflated two different points in time; it is fully superseded by the correctly-dated figures used throughout this piece (70 consecutive years of dividend increases, 136 consecutive years of dividend payments, both as of the April 2026 declaration).
On valuation, the evidence is genuinely two-sided. A forward multiple near 21 times is a real de-rating from Procter & Gamble’s own approximate 25-to-28-times historical range and sits roughly 10 to 12 percent below the current analyst-mean price target, yet it remains the second-richest multiple in its named peer set and carries the group’s lowest dividend yield, for growth no faster than Kimberly-Clark, Kenvue, or Unilever. That nets out to roughly fair: cheap against its own history, rich against the group it is actually priced next to.
On growth, Procter & Gamble is a low-single-digit organic grower guiding to the low end of a 0-to-4-percent range, with US category growth having decelerated from roughly 4 percent to roughly 2 percent. The third fiscal quarter’s volume inflection is a genuine positive, but it is one data point, so the honest read is modestly below-average for a company whose own stated algorithm calls for growing ahead of the market.
On quality, the evidence is clearly top-tier: gross margin above 51 percent, segment earnings-before-tax margins ranging from 23 to 29 percent, roughly $14 to $15 billion of adjusted free cash flow, an Aa3 and AA-rated balance sheet carrying roughly $25 billion of net debt, and a 70-year dividend-increase streak. The only dent in an otherwise excellent quality picture is that gross margin keeps slipping despite a record productivity effort.
On risk, the picture nets out balanced. Very low financial and market risk, a beta of 0.38 and a fortress balance sheet, sits against real structural risk: Walmart’s roughly 16 percent customer concentration and the top ten customers’ combined 43 percent, a private-label drain concentrated in the roughly 36-percent-of-revenue Fabric & Home Care segment, a $12.8 billion Gillette intangible carrying a disclosed impairment sensitivity, and a bond-proxy stock exposed to a higher-for-longer rate regime.
On momentum, the softest and lowest-weighted factor in this read, the evidence is weak to neutral: a roughly negative 8 percent one-year price return against the S&P 500’s roughly positive 21 percent, trading below its 200-day moving average, and trimmed fiscal 2026 and 2027 earnings estimates, offset by a genuinely improving Greater China, Beauty, and SK-II print in the most recent quarter and a sell-side consensus that reads “Moderate Buy” with zero sell ratings.
Overall lean: a quality-defensive stock that has de-rated to roughly fair value for what it is today, a Hold as a labeled research signal, with the dividend and balance sheet the floor and the direction of interest rates the biggest single swing factor. This is a research read, not personalized investment advice; see the disclaimer above and below.
Data-quality flags:
- PG’s PEG ratio is disputed across data vendors, roughly 4.2 on one and 6.6 on another, reflecting different forward-growth inputs; neither single figure should be treated as fact, and the trailing and forward price-to-earnings ratios used throughout this piece are the more reliable anchor.
- PG’s approximate 25-to-28-times historical average price-to-earnings ratio was sourced from a search-snippet summary rather than a directly verified page this research pass, and should be treated as indicative context rather than a precisely confirmed figure.
- Enterprise value and several secondary valuation multiples (price-to-sales, price-to-book, EV-to-EBITDA) were single-vendor sourced for the market-action figures in this piece; enterprise value was independently cross-checked by rebuilding it from primary balance-sheet debt and cash figures and matched closely, but the secondary multiples were not independently corroborated on a second vendor.
- Adjusted free cash flow productivity figures diverge depending on the period measured: fiscal 2025 was a confirmed 87 percent, nine-month fiscal 2026 was reported around 92 percent, the single third fiscal quarter alone was reported around 82 percent, and full fiscal 2026 guidance is 85 to 90 percent; this piece uses the guidance range as the anchor and attributes any single-period figure to its specific period rather than stating one number as the figure.
- The Kimberly-Clark acquisition of Kenvue is pending Federal Trade Commission second-request review and has not closed; it is discussed throughout this piece as a pending transaction, not a completed one.
- US private-label growth is a real, structural pressure on Procter & Gamble’s largest segment, but the pace of that growth is itself expected to slow in 2026 according to the research firm tracking it, so this piece treats it as a grind rather than an acceleration.
- One earlier research stream produced sentiment-market figures (price, 52-week high, year-to-date return, and a claim about private-label share loss) that directly contradict the verified market data used throughout this piece; none of those figures were used, and only the qualitative Dividend-King-versus-slow-grower narrative framing was carried forward, explicitly labeled as market mood rather than fact.
- Institutional-ownership percentages for Vanguard and BlackRock trace back to Schedule 13G filings from December 2023 and January 2024, the most recent on file for this stock, so read the exact current percentage as directionally accurate rather than up to the minute.
Key sources: Procter & Gamble fiscal 2025 Form 10-K and fiscal 2025 proxy statement (sec.gov); Procter & Gamble third-quarter fiscal 2026 Form 10-Q and 8-K earnings release, April 24, 2026 (sec.gov, pginvestor.com); company earnings-call commentary via CFO Dive and BigGo; Circana and NielsenIQ private-label market research; company and SEC filings for Unilever, Colgate-Palmolive, Kimberly-Clark, Church & Dwight, Clorox, and Kenvue; stockanalysis.com, Yahoo Finance, Finviz, Barchart, and Marketbeat for point-in-time price, valuation, and sell-side consensus data as of June 30 and July 1, 2026.
JSON-LD Structured Data: Article and FAQ
{
  "@context": "https://schema.org",
  "@type": "FAQPage",
  "mainEntity": [
    {
      "@type": "Question",
      "name": "What is the 6-month outlook for Procter & Gamble (PG) stock?",
      "acceptedAnswer": {
        "@type": "Answer",
        "text": "The 6-month outlook is driven by Procter & Gamble's August 4, 2026 fiscal fourth-quarter earnings release and fiscal 2027 guidance. The base case projects a modest drift toward the low $150s, the bull case projects a move back toward the analyst-mean zone near $163 on a clean quarter and volume growth, and the bear case projects a move back toward the 52-week low near $134 on a miss and a strengthening dollar."
      }
    },
    {
      "@type": "Question",
      "name": "What is the 1-year price forecast for PG stock?",
      "acceptedAnswer": {
        "@type": "Answer",
        "text": "Over the next 12 months, the base case projects the stock at roughly $156 on low-to-mid single-digit Core EPS growth, the bull case projects movement toward the 52-week high near $174 on volume-led growth and a Federal Reserve rate pivot, and the bear case projects a 'dead money' outcome near $129 as the valuation multiple slides toward the high teens."
      }
    },
    {
      "@type": "Question",
      "name": "What is the 3-year outlook for Procter & Gamble stock?",
      "acceptedAnswer": {
        "@type": "Answer",
        "text": "By 3 years, the base case projects the stock near $170 as Procter & Gamble delivers 2-to-4 percent organic growth with flat gross margins, the bull case projects a move toward $205 as volume-led growth spreads and rates ease, and the bear case projects a move toward $128 as private label continues grinding Fabric & Home Care share and the multiple de-rates."
      }
    },
    {
      "@type": "Question",
      "name": "What is the 5-year forecast for PG stock to 2031?",
      "acceptedAnswer": {
        "@type": "Answer",
        "text": "By 2031, the base case projects Procter & Gamble stock near $186 as a fortress-quality compounder with low-to-mid single-digit growth and a 21.5x multiple, the bull case projects near $238 as the growth algorithm re-normalizes and the multiple re-rates toward 23-24x, and the bear case projects near $130 as the premium leaks away on modest 1-2 percent growth."
      }
    }
  ]
}
Prepared June 30, 2026. Figures are point-in-time and will change. This is research and analysis for educational purposes, not investment advice, not a recommendation, and not a solicitation. Consumer-staples valuations move with interest-rate expectations in ways that can have little to do with the underlying business, so treat any scenario above as illustrative, not predictive. Verify all figures independently and consult a licensed financial advisor before making any decision.