
Research date: June 22, 2026 | OSINT research on Walmart Inc. (NYSE: WMT), its thin-margin grocery base, the high-margin advertising-and-membership overlay the market is paying up for, and the retail and automation names it is measured against. Live prices, stamped hard.
Important disclaimer. This is independent OSINT (open-source intelligence) research compiled for educational and informational purposes only. It is not investment advice, not a recommendation or solicitation to buy, sell, or hold any security, and not a statement that any security is suitable for you. The author is not a financial advisor and has no fiduciary relationship with any reader. All figures are point-in-time (as of June 22, 2026) and move fast - prices, market caps, valuation multiples, and market-share figures may be stale by the time you read this. Any bull / base / bear scenarios and “companies to watch” are analytical framings, not price predictions or guarantees, and the five-year illustrative valuations are simple arithmetic on stated assumptions, not price targets. Do your own due diligence and consult a licensed professional before making any financial decision.
Where this stock could be in 6 months, 1 year, 3 years, and 5 years
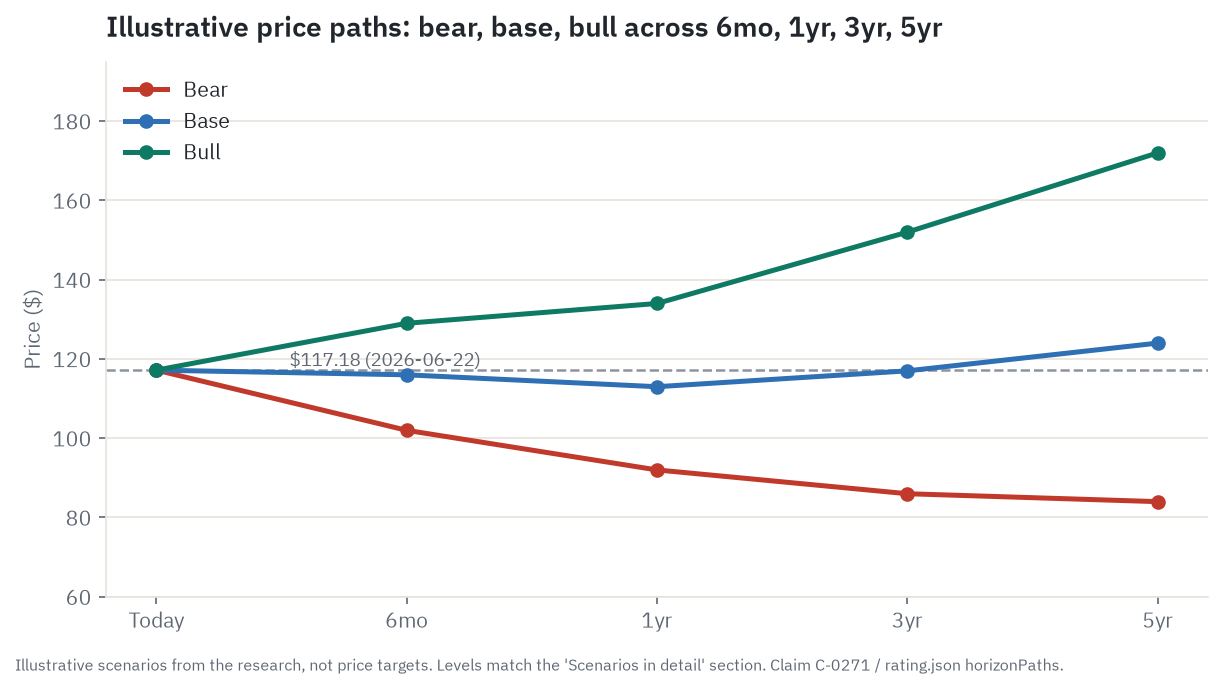
Walmart closed at $117.18 on June 22, 2026, for a market cap near $933 billion. That number sits right on top of the 200-day moving average (about $116.55) and roughly 13 percent below the May 2026 high near $135, so the stock comes into this outlook already cooled off and resting on technical support. The chart above turns the rest of the research into four price paths. Read every level as an estimate built from a stated earnings-and-multiple assumption, never as a target or a promise.
Six months. The next two quarters are governed by one event and one season: the August 20, 2026 second-quarter print and the back-to-school and holiday tariff commentary that comes with it. The template is already on the tape. On May 21, 2026 the stock fell about 7 percent on a quarter that actually beat, because the forward guide was merely in line. At roughly 41 times earnings there is no cushion for an in-line guide. The base case has the stock roughly flat near support at about $116. A clean beat plus a reassuring word on tariffs and advertising could lift it toward $129 (bull). A soft guide or a tariff escalation into peak season pulls it toward $102 (bear).
One year. Over twelve months the dominant question is whether the Street revises its estimates up. Mid-single-digit guidance does not usually produce upward revisions, which means a 40-times multiple has little to push it higher and real room to compress. The base case is a modest de-rate while earnings grow into the multiple, leaving the stock treading water near $113. A genuine beat-and-raise that forces the premium to hold reaches the consensus zone near $134 (bull). A slow de-rate toward Walmart’s own history, helped along by higher-for-longer rates or a tariff stumble, lands near $92, close to the 52-week low (bear).
Three years. Now the structural question starts to show in the numbers. The decisive read is the margin crossover: after the capex peak, does automation depreciation plateau and overhead lever while the advertising and membership lines scale, finally lifting the consolidated operating margin off its roughly 4.2 percent plateau? The base case is a defensive compounder whose multiple keeps slowly de-rating, so the price round-trips to about $117. If the crossover actually arrives and earnings accelerate toward 9 percent a year, the premium re-anchors near $152 (bull). If the overlay is confirmed as defensive-only and the platform premium drains toward a plain retailer’s multiple, the price falls toward $86 (bear).
Five years. This is the pure durability question. The bull case is a Costco-style structural transformation, with advertising near $12 billion and membership near $6 billion together becoming more than 40 percent of operating income, a genuinely higher-margin enterprise that earns a sustained premium and reaches roughly $172. The base case is steady mid-single-digit compounding at a fair-but-lower multiple near 33 times, a fine defensive holding rather than a compounder, around $124. The bear case is a re-rating down to a retailer’s multiple near 26 times because the margin never structurally moved, landing near $84. That bear is a valuation reset, not an impairment of a cash machine.
Where the read lands today. On balance the read holds at Hold. Walmart is a best-in-class, defensive cash machine, with $14.9 billion of free cash flow, a 53-year dividend streak, an irreplaceable grocery-data moat, and a fast-growing high-margin overlay, that trades at roughly 41 times earnings on management’s own 4-to-8-percent earnings-growth guide. That premium needs a margin-mix transformation which has not yet moved the consolidated operating margin off its five-year plateau. The single thing most likely to flip the read is that consolidated margin itself: a sustained move above about 4.5 percent would make the bull case datable, while another year stuck near 4.2 percent confirms the slow-de-rate bear.
Companion tool
Jump to the interactive dashboard to sort and filter every company in this piece, or download the Excel model to flex the scenarios yourself. The scenario prices in that file are illustrative arithmetic, not targets.
TL;DR
Walmart is a thin-margin grocery giant wearing a tech multiple, and the whole investment debate is whether the multiple is earned. By revenue it is a retailer: $713.2 billion in total revenue and $706.4 billion in net sales for the fiscal year ended January 2026, run at a consolidated operating margin of about 4.2 percent that has barely moved in five years. By profit growth it is trying to become a platform. A high-margin overlay of Walmart Connect advertising (nearly $6.4 billion globally, up 46 percent), membership fees, and a third-party marketplace sits on top of the store base, and per the chief financial officer the advertising-and-membership pair is already close to a third of operating income while being only about 1.5 percent of revenue. That mix-shift is the bull case. The catch is that the consolidated margin has not actually risen: the high-margin dollars have so far been absorbed by wage inflation, automation depreciation, and tariff cost on imported general merchandise. The single number that decides the next five years is that consolidated operating margin, and whether it finally moves off the roughly 4.2 percent plateau. The biggest risk is the valuation itself. At about 41 times trailing earnings (a disputed 39-to-43-times forward) on a 4-to-8-percent earnings-growth guide, a slow de-rate toward Walmart’s own history is 13 to 27 percent of downside before any earnings miss. Those are the near and far ends of one spectrum, not a contradiction: about 13 percent is a de-rate only to the five-year average multiple, while roughly 27 percent is the full path down toward the ten-year median and then a plain retailer’s multiple. The May 2026 selloff-on-a-beat was a live rehearsal of exactly that fragility. The honest read is Hold, Overvalued on valuation, because you pay full price here for quality you can measure and a margin transformation you cannot yet see in the consolidated number. All figures below are point-in-time as of June 22, 2026 and move fast. Verify live quotes before acting.
Explore it yourself: the interactive dashboard
Open the dashboard in a full screen
The dashboard holds the nine companies in this piece, sortable by market cap, by role (the subject, the retail and warehouse peers, the grocers, the dollar stores, the automation partner, the delivery platform), and by the bull and bear one-liner on each. Use it to check any single name as you read.
Prefer a spreadsheet? Download the Excel model with the peer table and a scoring tab you can adjust. The scenario prices are illustrative arithmetic on stated assumptions, not targets.
A thin-margin giant wearing a tech multiple
Picture a supermarket that quietly rents out its shelves and its aisles. The groceries are the reason 150 million-plus people walk in every week, and the store barely makes a few cents on the dollar selling them. The real money is starting to come from a second business layered on top: the brands that want their cereal at eye level pay to be there, the shoppers who want free delivery pay a yearly fee, and the outside sellers who want to reach all that traffic pay a cut of every sale. The low-margin food is the magnet. The high-margin rent is the prize.
That is the cleanest way to hold Walmart in your head, and it is also the exact tension in the stock. The store base is enormous and slow. Walmart turned $706.4 billion of net sales into about $29.8 billion of consolidated operating income in the fiscal year ended January 2026, an operating margin of roughly 4.2 percent. That margin has sat in a band between 4.0 and 4.3 percent for five years. A 4-percent-margin retailer growing the top line in the mid-single digits is, on its own, a fine business that does not command a tech multiple.
Yet the stock trades near 41 times trailing earnings, well above its own roughly 30-times ten-year median. The market is paying that premium for the rent, not the groceries. The question this whole piece tests is simple to state and hard to answer: is the re-rating earned by a real margin-mix transformation, or is the market extrapolating a high-margin story that is still tiny next to a $700-billion revenue base? Bull and bear both have to fall out of the evidence, so here is the evidence.
How the money flows
flowchart TD
    SHOPPERS["150M+ weekly shoppers\n(grocery anchor: 59% of US sales, ~285B)"]
    GROCERY["Grocery & Consumables\n(19.9% US market share, EDLP moat)"]
    GM["General Merchandise\n(~26% US sales; tariff-exposed imports)"]
    HW["Health & Wellness\n(14.4% US sales; pharmacy growth)"]
    ECOM["E-commerce\n(US: 99.6B FY26, +26% YoY, 9 consec qtrs)"]

    SHOPPERS --> GROCERY
    SHOPPERS --> GM
    SHOPPERS --> HW
    SHOPPERS --> ECOM

    SUPPLIERS["CPG & GM Suppliers\n(P&G / Unilever / 100K+ vendors; Walmart monopsony)"]
    IMPORT["Imports: China ~60% of import vol\n(electronics, toys, apparel; tariff chokepoint)"]
    DOMESTIC["Domestic sourcing ~67%\n(food, private label, fresh)"]

    SUPPLIERS --> GROCERY
    SUPPLIERS --> GM
    IMPORT --> SUPPLIERS
    DOMESTIC --> SUPPLIERS

    DC["42 Regional DCs\n(Symbotic automation: 23 retrofitting, sole vendor)"]
    FC["29 E-com Fulfillment Centers\n(~50% automated; 2x throughput vs legacy)"]
    APD["400 APD Centers (committed)\n(store-attached micro-fulfillment for same-day)"]

    SUPPLIERS --> DC
    DC --> STORES
    DC --> FC
    DC --> APD

    STORES["4,614 US Stores\n(Supercenter core; 60% of US pop within 30 min)"]
    LASTMILE["Last-Mile Delivery\n(+45% YoY; store-fulfilled cost down 20%)"]
    PICKUP["Curbside Pickup\n(lowest cost-to-serve; customer absorbs last mile)"]
    SHIPHOME["Ship-to-Home (FedEx/UPS)\n(highest cost; automation compressing)"]

    FC --> SHIPHOME
    APD --> LASTMILE
    APD --> PICKUP
    STORES --> LASTMILE
    STORES --> PICKUP

    SHIPHOME --> CUSTOMER["End Customer"]
    LASTMILE --> CUSTOMER
    PICKUP --> CUSTOMER

    CUSTOMER --> HMARGIN["HIGH-MARGIN OVERLAY\n(~1/3 of enterprise operating income)"]

    HMARGIN --> ADS["Walmart Connect Ads\n(6.4B FY26, +46%; 70-80% op margin)"]
    HMARGIN --> MEMBER["Walmart+ & Sam's Club Fees\n(4.4B FY26, +15.5%; near-zero COGS)"]
    HMARGIN --> MKT["3P Marketplace + WFS\n(est. 15B GMV; 6-15% take rate)"]

    ADS --> PROFIT["Enterprise Operating Income\n(29.8B GAAP FY26; 4.2% consolidated margin)"]
    MEMBER --> PROFIT
    MKT --> PROFIT
    STORES --> PROFIT

    PROFIT --> CAPEX["Reinvestment: 26.6B capex FY26\n(peak; automation + remodels + tech)"]
    CAPEX --> DC
    CAPEX --> FC
    CAPEX --> STORES
Read the diagram top to bottom and the shape of the business does the explaining. Demand starts with the same 150 million-plus weekly shoppers, pulled in mostly by grocery, which is roughly 59 percent of US sales. That traffic spreads across four buckets: groceries and consumables, general merchandise, health and wellness, and e-commerce. Behind them sits the supply side, where Walmart’s scale lets it lean hard on more than 100,000 vendors, and where the one genuine chokepoint is imports. Roughly a third of US merchandise is imported and about 60 percent of that comes from China, concentrated in the higher-margin general-merchandise categories. That single arrow is where tariffs do their damage.
The middle of the chart is the part most people picture when they think of Walmart: distribution centers, fulfillment centers, store-attached micro-fulfillment, and the stores themselves, feeding curbside pickup, store-fulfilled delivery, and ship-to-home. This is the expensive, low-margin machine. It is the reason the consolidated margin is thin, and it is the reason a $26.6 billion annual capex bill exists.
The bottom of the chart is where the investing point lives. All that traffic, once captured, gets monetized a second time through the high-margin overlay: Walmart Connect advertising, Walmart+ and Sam’s Club membership fees, and the third-party marketplace with its take rate and fulfillment fees. Per the chief financial officer, the advertising-and-membership pair is already close to a third of operating income. The shape is the thesis: a low-margin volume machine generates the traffic, and a high-margin rent layer on top is where the profit growth is supposed to come from. The bear’s whole argument is that the rent is still small and the consolidated profit line at the bottom has not actually moved.
Field guide: the segments and where the dollars sit
Walmart reports three segments. Knowing what each one is, and which one actually makes the money, is the foundation for everything else.
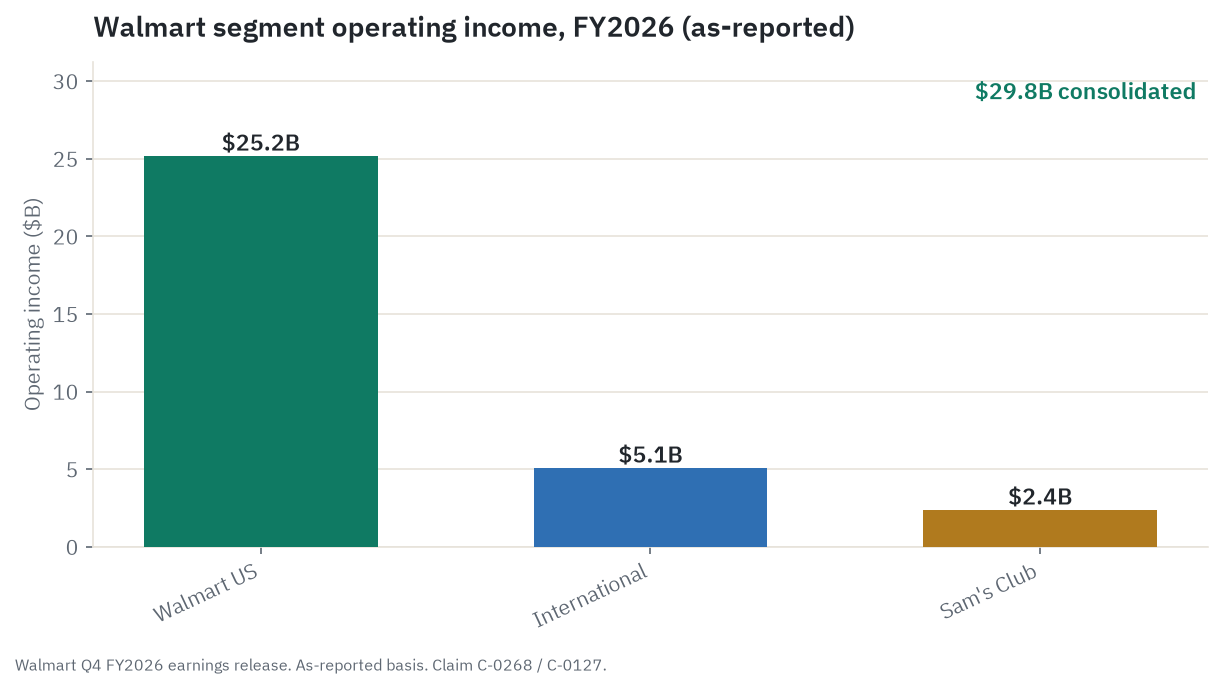
Walmart U.S. is the profit engine. It was 68 percent of net sales in the fiscal year ended January 2026, at $483.0 billion, and it carried a 5.21 percent segment operating margin for $25.2 billion of operating income, the highest margin of the three. Comparable store sales rose 4.6 percent for the full year, and crucially the growth came from traffic, not just higher tickets, with management citing sustained share gains among higher-income households. Comparable sales, usually shortened to comps, measure the sales growth at stores and digital channels that have been open at least a year, stripping out the lift from brand-new openings, so the figure isolates whether the existing base is actually growing rather than just getting bigger by adding doors. This is the segment the entire valuation rests on.
Walmart International was 18 percent of net sales, at $130.4 billion. Its operating income actually fell about 7 percent to $5.1 billion despite net sales rising 7 percent, because of a roughly $700 million non-cash charge tied to PhonePe, the India fintech business, ahead of a possible listing. Strip that charge out and International was roughly flat in constant currency. The key markets are Walmex in Mexico, plus China, Canada, and Flipkart in India. International grows but dilutes the blended margin.
Sam’s Club U.S. was 13 percent of net sales, at $93.0 billion, at a 2.63 percent segment operating margin for $2.4 billion of operating income. That headline margin understates the economics, because membership income, which is high-margin and accrues to Sam’s Club, is part of the story and is growing. Comparable sales rose 5.1 percent for the year, and Sam’s Club raised its membership fee in May 2026 for the first time since 2022.
A few definitions are worth carrying as you read the rest. Grocery is roughly 59 percent of US sales and is the traffic magnet, not the profit driver, because food is sold at thin margins under the everyday-low-price discipline. Everyday low prices, sometimes shortened to EDLP, is Walmart’s core pricing strategy: keep prices low and stable all the time rather than swinging between high list prices and big promotional sales, which trains shoppers to expect value on every trip without waiting for a deal. General merchandise, around 26 percent of US sales, is the higher-margin layer that carries the apparel, electronics, toys, and home goods, and it is also where the China sourcing and the tariff exposure concentrate. Health and wellness, about 14.4 percent of US sales and rising, is the second-highest-margin in-store category, carried by pharmacy.
One reporting nuance matters for anyone comparing year-over-year segment numbers. During the fiscal year ended January 2026 Walmart began combining the Sam’s Club U.S. supply chain with Walmart U.S. operations, and starting in the first quarter of the new fiscal year it updated how corporate overhead is allocated across segments, restating prior periods for comparability. The three reportable segments did not change, but the absolute segment operating-income figures shift slightly on the new basis. The figures used here are the as-reported numbers for the fiscal year ended January 2026, to keep one consistent basis. The chart below shows that split.
The e-commerce, marketplace, and fulfillment story
For years Walmart’s e-commerce was a growth line with a profit problem: it grew fast and lost money on every individually shipped order, because shipping one item to one doorstep is a worse trade than ringing it up at a register. The interesting recent development is that the math has flipped.
The growth is real and durable. Global e-commerce grew 22 percent for the fiscal year ended January 2026, and US e-commerce has now strung together nine consecutive quarters of growth. The faster-growing engine inside that is the third-party marketplace, where US marketplace gross merchandise value grew roughly 50 percent in the first quarter of the new fiscal year. Gross merchandise value, or GMV, is the total dollar value of goods sold across the platform, including the items outside sellers move through Walmart’s site. It is not Walmart’s revenue. On a third-party marketplace sale Walmart books only its take rate, the cut it keeps on the transaction, not the whole ticket, so a $15 billion marketplace adds far less than $15 billion to the top line. Walmart’s marketplace take rate runs 6 to 15 percent depending on category, with most categories at 15 percent, and it now hosts more than 200,000 sellers.
The bigger shift is profitability. Per management, US e-commerce turned profitable, the result of routing and batching deliveries more densely, charging express fees for speed, and pushing more volume through store-fulfilled pickup and delivery where the cost-to-serve is lowest. Cost-to-serve is the all-in cost of getting one order into a customer’s hands, from picking and packing to the last mile, and when a shopper drives to the store for curbside pickup they absorb that last mile themselves, which is why pickup is the cheapest channel of all. Management has cited a 20 percent reduction in delivery cost and, per the chief financial officer, a consistent 30 percent reduction in shipping cost. There is also a business layered on the marketplace: Walmart Fulfillment Services, the company’s version of letting outside sellers use its warehouses and delivery network. Walmart says items enrolled in that service get a 50 percent lift in gross merchandise value from the faster shipping badge, and that the service runs roughly 15 percent cheaper than competing third-party logistics. Adoption is high, with about two-thirds of sellers using it.
The honest framing is that e-commerce has moved from a drag to a contributor, which removes a long-standing bear point, but it is not yet a large profit center on its own. It matters more as the plumbing that makes the high-margin overlay possible: every delivery, every marketplace order, and every Walmart+ sign-up feeds the data and the ad inventory that actually carry the margin.
The high-margin engines: the re-rating thesis
This is the heart of the bull case, so it is worth being precise about what is real, what is an estimate, and how big it actually is.
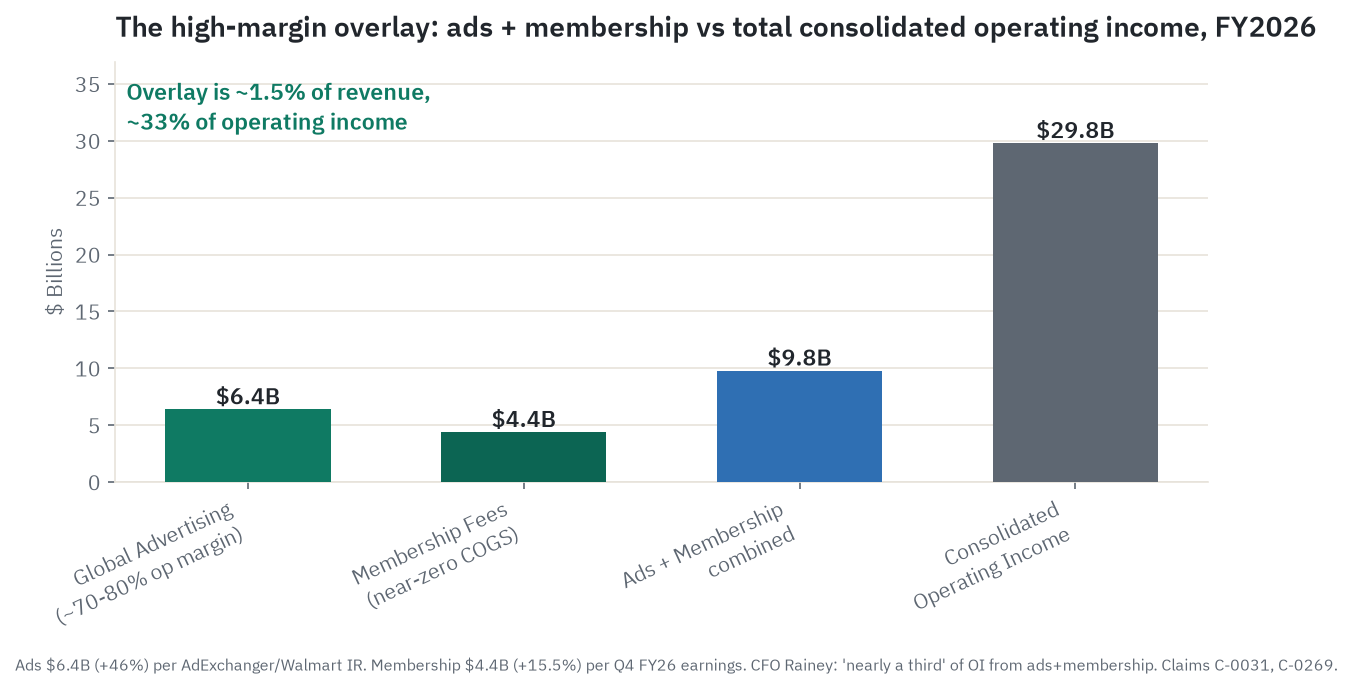
Walmart Connect advertising is the centerpiece. Global advertising revenue was nearly $6.4 billion for the fiscal year ended January 2026, up 46 percent. The US business, Walmart Connect, grew 41 percent for the full year and was still growing 37 percent in the most recent quarter. Walmart is the second-largest US retail media network behind Amazon. A retail media network is a retailer selling ad space on its own site, app, and in its stores to the brands it already carries, using the first-party shopper data it collects at checkout, so the brand pays Walmart to put its cereal in front of the exact shoppers Walmart knows are buying cereal. The December 2024 acquisition of Vizio for about $2.3 billion added connected-TV inventory to the mix. The economics are what make advertising matter so much. Walmart does not disclose a standalone margin for the business, but the chief financial officer has put the operating margin in a 70-to-80 percent range, which is consistent with how retail media works across the industry. On the margin profile, advertising is worth roughly 15 to 20 times more operating income per dollar of revenue than a dollar of grocery.
Membership is the second engine. Membership and other income was $6.8 billion for the fiscal year, and in the most recent quarter it grew 27 percent year-over-year, with membership fee revenue up more than 17 percent globally. This line combines Sam’s Club fees, Walmart+ fees, and other items, and Walmart does not break it out by banner. Walmart+ membership counts are not disclosed by the company; analyst surveys from the likes of Morgan Stanley and CIRP put the figure in a roughly 28-to-31 million range, which should be treated as an estimate, not a fact. What is disclosed is that members behave very differently: per a company-cited figure, Walmart+ members make about seven times more e-commerce visits and spend about three times more than non-members. Walmart does not publish a Walmart+ renewal or retention rate, so the direct comparison to Costco’s above-92-percent US renewal is not yet available; the seven-times-visit and three-times-spend behavior, plus the Sam’s Club fee increase in May 2026, are the only hard read on stickiness, and the Costco figure should be held as the benchmark Walmart is aiming at rather than one it has demonstrably matched.
The marketplace take rounds out the overlay, with third-party gross merchandise value estimated by Marketplace Pulse at around $15 billion (again an estimate, not a Walmart-disclosed figure), monetized through the take rate and fulfillment fees.
Now the load-bearing fact, and the reason the stock trades the way it does. Advertising and membership together were about $9.8 billion of revenue, roughly 1.5 percent of total revenue, yet per the chief financial officer they generate close to a third of total operating income. That ratio, a sliver of revenue producing a third of profit, is the entire margin-mix thesis in one line. The chart makes the disproportion visible.
It helps to see how big the overlay has to get before it actually moves the headline number. The consolidated operating margin is roughly 4.2 percent on about $706 billion of net sales, which is about $29.8 billion of operating income. Lifting that margin to 4.5 percent means finding roughly another $2 billion of operating income that is not offset elsewhere. The trouble is the offset. An estimated decomposition of the most recent year (Walmart does not disclose the segment-level advertising-and-membership profit split, so this is an analytical inference, not a reported figure) suggests the overlay added roughly $2 billion of operating-income growth while the core retail business gave back roughly $0.5 billion to wage, depreciation, and tariff cost. The overlay is winning, but only by enough to hold the line and edge it up, not yet by enough to visibly bend the consolidated margin. That is why the margin has stayed flat even as advertising grew 46 percent: the high-margin dollars are real, but so far they are mostly filling a hole the rest of the business keeps digging.
Here is where the bull and bear genuinely diverge, and it is worth stating both sides plainly. The bull says this overlay is compounding at 30 to 50 percent a year on a structurally higher margin, so over time the overlay’s contribution must outgrow the core’s cost drag and finally drag the whole company’s profitability up. The bear says look at the consolidated margin, which has not moved: every dollar of high-margin mix gain has so far been eaten by wage inflation, automation depreciation, and tariff absorption on general merchandise. Both can be true at once today, and which one wins over five years is the whole trade. The next two sections give the bear its strongest exhibit.
Automation and supply-chain cost-out
Walmart’s other structural argument is that it is building a lower cost floor, not just cutting costs once. The automated distribution and fulfillment buildout is the most concrete version of this.
The footprint is real and installed. More than 60 percent of US stores are now served by automated distribution centers, and more than half of e-commerce fulfillment-center volume is automated. Per the company, automated fulfillment centers run about twice as productive as manual ones, and unit costs in the automated network fell roughly 20 percent year-over-year. The key partner is Symbotic, the warehouse-robotics company in which Walmart is both the largest customer and a strategic backer; the two are tied together by a multi-year commercial agreement and Symbotic’s large backlog. This is running infrastructure generating real per-unit savings, not a slide-deck promise, and it deserves credit as such.
The catch is timing and cost. The automation buildout is the main reason capex is about $26.6 billion a year, roughly 3.8 percent of net sales, which is unusually high for a retailer and is compressing free cash flow relative to operating cash flow right now. The fiscal years around the current one are the capex peak. The bull case needs depreciation to plateau after the peak so the productivity gains convert into free cash flow and into core-retail operating income. The bear case, which is also management’s own disclosed risk, is that the capex load impairs free cash flow before the margin payoff arrives. Automation is genuinely improving cost-to-serve and is what made e-commerce economics viable, but on its own it improves the plumbing rather than creating the margin step-change that would justify a re-rating. It is the supporting actor to the advertising-and-membership story, not the lead.
Grocery, comps, and the consumer Walmart actually serves
Grocery is where Walmart’s durability lives, and it behaves very differently from the rest of the business through a cycle. Food, cleaning products, pharmacy, and personal care are recurrence-mandatory: households cannot defer them and cannot cut them to zero. They can only trade laterally, and in a stress environment that lateral trade tends to run toward Walmart. Roughly 59 percent of US sales is this kind of structural, population-scaled base, and it is not a cyclical bet.
The comps arithmetic helps Walmart at the moment. Food-at-home inflation was running about 2.9 percent year-over-year as of spring 2026, with the USDA forecasting about 3.2 percent for the full year (an estimate). Low-to-mid single-digit food inflation mechanically lifts the average ticket without Walmart having to sell more units, and Walmart’s everyday-low-price positioning pulls in traffic from grocers that have to pass through higher absolute prices. There is even a perception gap working in Walmart’s favor: surveys suggest households believe grocery inflation is far higher than the actual reading, which sustains value-seeking behavior regardless of where true inflation lands. The tail risk on the other side is sustained food deflation, which would strip out the ticket tailwind and leave comps dependent on pure volume, the dynamic that compressed Walmart’s comps in 2015 and 2016. That is not the base case for 2026 given tariff pass-through, but it is worth watching.
The customer mix is the subtler story. Walmart has been winning higher-income shoppers, and on its own earnings call it drew the line explicitly: higher-income shoppers were spending with confidence across categories, while lower-income customers showed visible stress, including a drop in fuel-gallon purchases below ten per visit for the first time since 2022. Winning the upper-income cohort is a genuine bull point, but it cuts both ways. Those shoppers came for convenience and value, and they also have the means to leave when the economy improves. The lower-income core, meanwhile, is funded partly by wages and partly by transfer payments that face headwinds in 2026, which the macro section covers. In the first quarter of the new fiscal year US comps were up 4.1 percent with transaction growth of 3.0 percent, the strongest traffic in six quarters, so the traffic engine is currently healthy.
Company by company: who’s who
Walmart does not exist in isolation. Here is the competitive and ecosystem set, grouped by role, with one dated result and a genuine bull and bear on each. Market caps are point-in-time as of June 22, 2026 and several peer figures are third-party aggregator data, so treat them as approximate.
The subject
Walmart Inc. (WMT) - market cap about $933 billion. Operates roughly 10,600 stores globally plus a fast-growing e-commerce marketplace, with grocery as the traffic anchor and a high-margin advertising-plus-membership overlay as the re-rating thesis. Most recent result: first quarter of the new fiscal year (May 2026), Walmart US comps up 4.1 percent with transaction growth of 3.0 percent and US e-commerce up 22 percent, with full-year guidance reaffirmed. Bull: a grocery-anchored traffic engine funding a high-margin overlay growing 30 to 40 percent a year, plus a store-as-fulfillment-center model that gives delivery economics a pure e-commerce rival cannot easily replicate. Bear: roughly 39 to 43 times forward earnings against a 4-to-8-percent earnings-growth guide, with the overlay still a fraction of $706 billion in revenue, so multiple compression alone implies meaningful downside before any earnings miss, from about 13 percent on a de-rate to the five-year average up to roughly 27 percent on a full de-rate toward the ten-year median and a plain retailer’s multiple.
The retail and warehouse peers
Amazon.com Inc. (AMZN) - market cap about $2.5 trillion. The chief retail and retail-media rival. It holds about 40.5 percent of US e-commerce, runs the dominant cloud business in AWS, and operates the largest retail-advertising business by a wide margin. Most recent result: first quarter of 2026, net sales of $181.5 billion (up 17 percent) and operating income of $23.9 billion (up 30 percent) at a record operating margin, with AWS up 28 percent. Amazon is the structural ceiling on Walmart’s advertising ambitions, and the scale gap is the single most important competitive fact in this piece. We cover Amazon’s own story in depth in our Amazon deep dive. Bull: AWS and advertising create a margin floor that lifts the whole company far above retail economics, and at roughly 27 times trailing earnings Amazon is actually cheaper than Walmart or Costco despite better growth and margin. Bear: heavy AI infrastructure capex pressures near-term free cash flow, and Amazon’s roughly 1.6 percent share of physical grocery leaves its US flywheel dependent on a general-merchandise moat that Walmart is encroaching on.
Costco Wholesale Corporation (COST) - market cap about $422 billion. The membership-warehouse peer and the closest analog to Sam’s Club. It sells merchandise at near-cost while membership fees, with a US renewal rate above 92 percent, drive nearly all the profit, the same model Walmart is building toward with its own overlay. Most recent result: third quarter of fiscal 2026 (reported May 29, 2026), net sales of $69.2 billion (up 11.6 percent), comparable sales up 9.8 percent, and membership income up 10.7 percent. Bull: near-indestructible membership economics and Kirkland private-label loyalty make Costco the most durable retail moat in the US. Bear: at 43 to 48 times earnings it prices in perfection, and any renewal-rate stumble would crater a stock with almost no valuation cushion. That bear doubles as a warning for Walmart, because both names sit in the same stretched staple-premium cohort.
Target Corporation (TGT) - market cap about $59 billion. A mass-merchandise retailer with a heavier discretionary mix and no retail-media or marketplace business at scale, which makes it more cyclical than Walmart. Most recent result: first quarter of fiscal 2026 (May 2026), net sales of $25.4 billion (up 6.7 percent), comps up 5.6 percent on 4.4 percent traffic growth, with full-year guidance raised. Bull: at only about 15 times forward earnings, a 60-percent-plus discount to Walmart, Target prices in years of misery that may not materialize, and the 3.5 percent dividend yield plus a traffic recovery offer real upside if comps sustain. Bear: no advertising or marketplace overlay, heavy discretionary exposure, and the very higher-income shoppers trading into Walmart for groceries. Target is also a live data point for the Walmart bull: the market clearly pays up for the overlay Walmart has and Target lacks.
The grocers and dollar stores
Kroger Co. (KR) - market cap about $34 billion. The largest traditional US supermarket chain, holding roughly 8.3 percent US grocery share at a thin operating margin. Most recent result: first quarter of fiscal 2027 (ended June 18, 2026), revenue of $46.1 billion with identical sales ex-fuel up just 1.0 percent and adjusted earnings in line. Bull: at 10 to 11 times forward earnings, the valuation may price in too much secular decline, and the fuel, pharmacy, and digital ecosystem still generate real cash. Bear: grocery share is structurally eroding to Walmart, Costco, and Aldi while comps lag inflation, and thin margins leave no cushion.
Dollar General Corporation (DG) - market cap about $25 billion. Roughly 20,000 small-format stores serving a quick-trip, lower-income core in rural and suburban markets, a different mission from a Walmart Supercenter. Most recent result: first quarter of fiscal 2027 (ended June 2, 2026), revenue of $10.8 billion, same-store sales up 2 percent, and earnings ahead of consensus. Bull: a local-monopoly dynamic in rural markets that becomes more defensible as larger chains concentrate in metros. Bear: the core low-income customer is under maximum financial stress, shrink remains elevated, and the turnaround program is unproven at scale.
Dollar Tree Inc. (DLTR) - market cap about $22 billion. Roughly 16,000 stores in a multi-price-point value format after divesting Family Dollar in early 2025, serving a slightly higher-income value hunter than Dollar General. Most recent result: first quarter of fiscal 2026 (May 2026), a beat with a raised full-year profit outlook, shares around $114. Bull: the Family Dollar exit cleans up the portfolio and lets management focus on the more stable core banner with pricing power above the old dollar price point. Bear: a simpler but smaller business still squeezed by Walmart’s everyday-low-price discipline and Amazon’s value marketplace, with limited e-commerce to offset traffic softness.
The automation partner and the delivery platform
Symbotic Inc. (SYM) - market cap about $24 billion. The AI-enabled warehouse-robotics company behind much of Walmart’s distribution automation. Walmart is its largest customer and a strategic backer, and in early 2025 Symbotic bought Walmart’s advanced-robotics unit and signed a commercial agreement for up to 400 store-attached pickup-and-delivery deployments. Most recent result: second quarter of fiscal 2026, revenue of $676 million with an earnings miss but a backlog of about $22.7 billion. Bull: a large backlog anchored by the Walmart agreement gives multi-year revenue visibility, and the Walmart relationship is a reference customer that opens doors across US retail. Bear: earnings misses and margin compression suggest execution risk, and at roughly 70 times forward earnings the stock needs near-flawless delivery. The sharper flag is customer concentration: Walmart is both Symbotic’s largest customer and its backer, so the two rise and fall together.
Maplebear Inc. (Instacart, CART) - market cap about $10 billion. A grocery delivery and pickup marketplace across roughly 1,500 retail banners, with a retail-media advertising business of about $1 billion that competes with Walmart Connect for grocery-intent ad dollars. Walmart handles its own delivery and does not depend on Instacart, so the reason it matters to the Walmart thesis is as a read-through on the ad pool itself: if Instacart’s roughly $1 billion ad business is growing because total grocery retail-media budgets are expanding, that is good for Walmart Connect, but if those budgets are being fragmented across Instacart, Kroger, and others rather than concentrating on the two leaders, it puts a ceiling on the Walmart bull. Most recent data: shares around $44 on June 22, 2026, at roughly 17 times forward earnings. Bull: Instacart’s grocery-list intent data is uniquely valuable to advertisers, and at roughly 17 times forward earnings it is a cheaper way to bet on grocery retail media than Walmart’s parent at 39 times. Bear: it is structurally dependent on retailer goodwill, since the data-sharing model can be terminated, and it faces Walmart’s own delivery plus DoorDash and Uber in every urban market.
What the filings say
Strip away the narrative and the filings show a financially dominant retailer with one genuine point of tension. All figures here are from Walmart’s SEC filings for the fiscal year ended January 31, 2026 (the 10-K filed March 13, 2026, and the related earnings releases), unless noted.
The income statement. Total revenue was $713.2 billion, up 4.7 percent, and net sales crossed $700 billion for the first time at $706.4 billion. Gross profit was $171.0 billion at a 24.2 percent gross margin, which has been improving 20 to 50 basis points a year as the advertising and membership mix supplements core retail. Operating expenses ran 20.9 percent of net sales. Consolidated GAAP operating income was $29.8 billion at a 4.2 percent margin; on an adjusted constant-currency basis operating income was about $31.0 billion, up 5.4 percent, with the GAAP figure held down by the roughly $700 million non-cash PhonePe charge in International. Net income attributable to Walmart was about $21.9 billion, up 12.6 percent, on roughly 8.0 billion diluted shares.
The cash flow and balance sheet. Operating cash flow was $41.6 billion. Capital expenditures were $26.6 billion, which is the pressure point. Free cash flow was $14.9 billion, up from about $12.6 billion the prior year. The balance sheet is a fortress: about $10.7 billion of cash against roughly $51.5 billion of total debt, for net debt near $40.8 billion, which is only about one times operating cash flow, all investment-grade and staggered across maturities with no near-term wall. Inventory was $58.9 billion. In April 2026 Walmart issued $4.25 billion of senior notes across five tranches, easily absorbed.
Capital returns. Walmart repurchased 85 million shares for $8.1 billion during the year and announced a new $30 billion buyback authorization, the largest in its history, in February 2026. The dividend was raised to $0.99 a share, up 5.3 percent, the 53rd consecutive annual increase, which puts Walmart firmly in Dividend King territory. The cash machine funds the $30 billion buyback, the 53-year dividend streak, and the $26.6 billion capex program all at once, which no peer can match at this scale.
Guidance. For the current fiscal year, management guided to net sales growth of 3.5 to 4.5 percent in constant currency, adjusted operating income growth of 6 to 8 percent, and adjusted earnings per share of $2.75 to $2.85. The fact that operating-income growth is guided faster than sales growth signals continued margin-mix expansion, driven mainly by advertising and membership rather than retail-margin recovery. That guide, reiterated in May 2026, is the basis for most of the forward arithmetic in this piece.
The risks Walmart itself discloses. The 10-K flags several, and a few genuinely matter. First, omnichannel execution and the cost of the investment: management acknowledges that shipping individual orders can be less profitable than in-store sales, and the central tension is that if e-commerce growth plateaus before automation drives down cost-to-serve, the capex load impairs free cash flow without the margin payoff. Second, competitive intensity across price, delivery speed, membership economics, and marketplace scale. Third, trade policy and import cost: Walmart is the world’s largest importer and management has acknowledged absorbing some tariff cost rather than passing it all through. Fourth, cybersecurity at the scale of hundreds of millions of transactions.
Ownership and insider activity. The Walton family holds roughly 44 percent of shares through Walton Enterprises and the Walton Family Holdings Trust. The Trust executed a steady cadence of disclosed open-market sales through 2025 and into 2026, including several million shares across February, March, May, and June 2026. These are disclosed Form 4 transactions. The consistent, sized cadence reads as estate and wealth-planning diversification rather than a view on the business, and the family still holds about 44 percent; it should not be read as a management signal or as anything bearish about Walmart’s prospects. There was also a wave of senior executive departures within months of the new chief executive’s February 2026 start, including the heads of International and US stores and two Sam’s Club leaders. Those departures are reported by the press; no cause should be imputed to any individual, and the most straightforward reading is a new chief executive reorganizing his team.
One legal item belongs here for completeness. In February 2026 Walmart agreed to a $100 million judgment to settle charges brought by the Federal Trade Commission relating to earnings claims made to gig delivery drivers, along with ten years of FTC compliance monitoring. The conduct allegation is the FTC’s; the figure stated here is the settled amount, and nothing beyond the settled terms is asserted.
What the market is paying
Now the valuation, which is the crux. Every figure here is point-in-time as of the June 22, 2026 close and moves daily.
Walmart closed at $117.18, inside a 52-week range of $94.23 to $135.16, which puts it at roughly 56 percent of that span, closer to the floor than the ceiling. The May 2026 high near $135 has given way to a pullback of about 13 percent. On the technicals, the stock sits about 6 percent below its 50-day moving average ($124.86) and just barely above its 200-day ($116.55), so recent buyers are underwater and the immediate support cluster is right here.
The returns have been excellent and are worth being honest about. Over the trailing year the total return was about 28.7 percent. Over five years it was roughly 175 percent, an exceptional run for a defensive retailer. But much of that five-year gain came from the multiple expanding from about 25 times to about 40 times, not from earnings, which is precisely the thing a buyer today no longer gets for free. Year-to-date in 2026 the stock is up only about 5 percent and trails both the S&P 500 (up about 9 percent) and most of its retail peers, with Target up about 33 percent and Costco up about 10 percent. Walmart has been the laggard among the retail majors this year. Beta is 0.60 across three sources, confirming a low-volatility, defensive-leaning name.
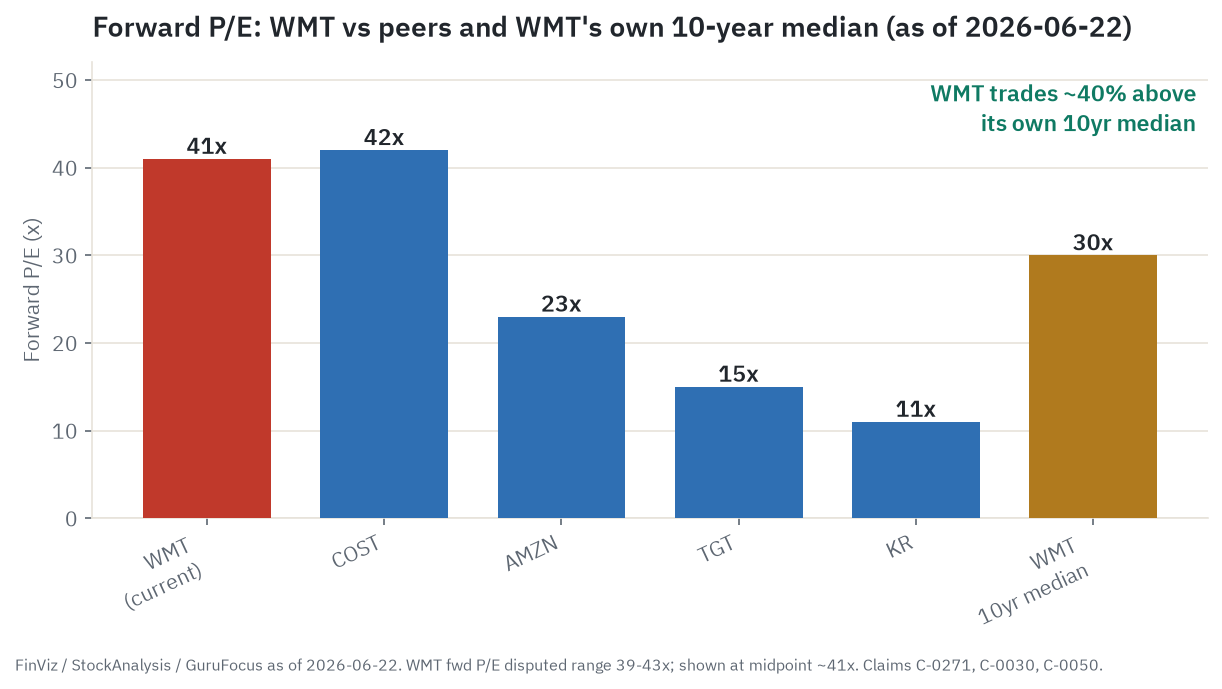
The multiples are where the argument concentrates. Walmart trades at about 41 times trailing earnings on three independent sources in tight agreement. The forward multiple is genuinely disputed, ranging from about 35.7 times at FinViz to about 44.4 times at GuruFocus, with the spread driven by whether GAAP or adjusted earnings are used and which twelve-month period is treated as forward. On management’s own adjusted guidance midpoint of $2.80, the forward multiple is roughly 41 to 43 times. A fair characterization is 39 to 41 times forward on consensus, and because no two sources agree it has to be treated as a range. Other point-in-time reads: EV/EBITDA around 22 to 23 times, price-to-sales 1.29 times, price-to-free-cash-flow about 74 times (a free-cash-flow yield near 1.3 percent), and a dividend yield around 0.84 percent. The PEG ratio is also disputed, from about 2.0 times on flattering recent earnings growth to about 4.3 times on long-term consensus growth.
Against Walmart’s own history, the re-rating is large and real. The current trailing multiple of about 41 times sits roughly 40 percent above the ten-year median near 30 times. EV/EBITDA is about 40 percent above its five-year average, and price-to-sales is about 36 percent above its five-year average. On every metric the stock trades 30 to 40 percent above its own ten-year norm. Against peers, the market pays up for both Walmart and Costco (47.9 times trailing) while refusing the premium for Target (17.1 times) and treating Amazon (27.8 times) as cheaper on trailing earnings. The chart shows the forward comparison.
What is the market actually paying for? Four things: a sustained earnings growth rate above retail norms from the advertising, marketplace, and membership lines; a structural mix-shift that lifts the consolidated operating margin over time; low-volatility downside protection that a 0.60 beta earns; and Dividend King capital discipline. The bull case on the multiple is that the overlay compounds into a genuinely higher-margin company. The bear case is the single most important exhibit in this whole piece, and it has its own chart.
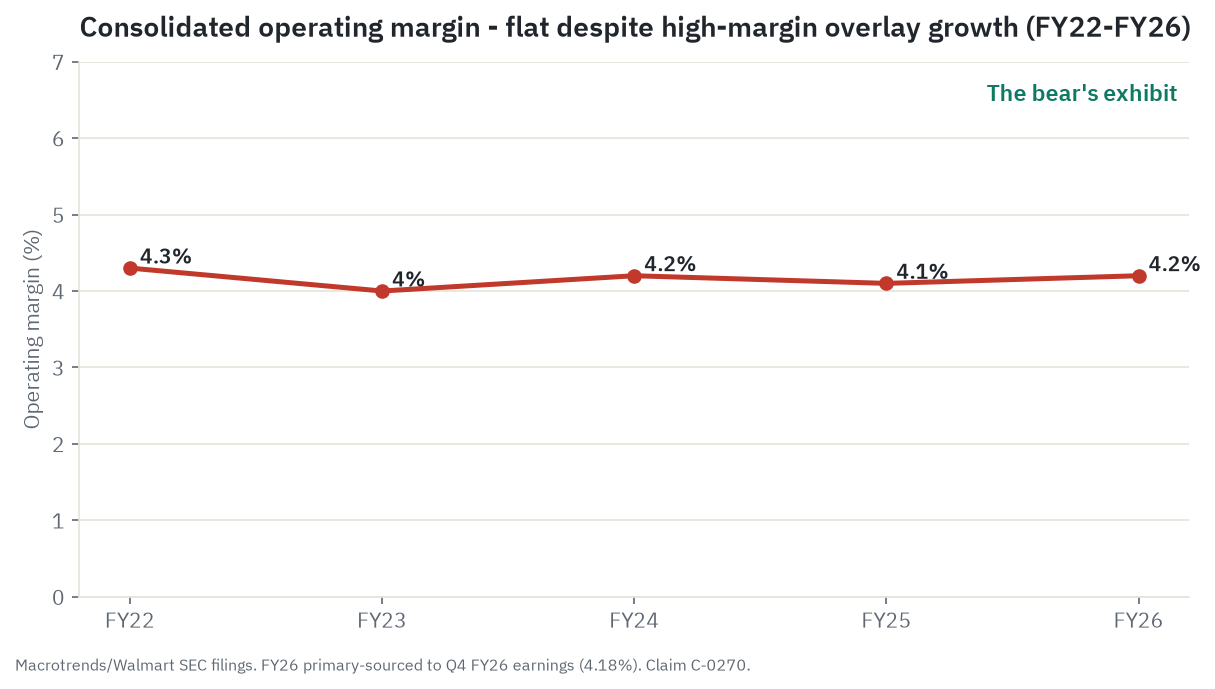
That flat line is the bear’s exhibit. The consolidated operating margin has not moved off roughly 4.2 percent in five years, even as advertising grew 46 percent and the overlay reached close to a third of operating income. The most direct demonstration came in the most recent quarter: consolidated operating margin was flat year-over-year at about 4.3 percent despite advertising growing 37 percent. Every dollar of high-margin mix gain was offset by wage deleverage, automation depreciation, and tariff absorption, plus a one-off fuel cost headwind of about $175 million that, by itself, neutralized a full quarter of structural margin improvement. A business growing earnings 4 to 8 percent does not normally command 40 times unless the market is pricing a margin step-change that has not yet appeared in the consolidated number. A de-rate to even the five-year average near 36 times is roughly 13 percent of downside from here, on multiple compression alone, before any earnings revision.
On liquidity and positioning, Walmart is among the most liquid US equities, short interest is a modest 1.83 percent of float with no squeeze dynamic, and the sell-side consensus is Strong Buy with a mean target around $138 to $140 (high $155, the quoted $70 low being an unverified outlier). That target implies roughly 18 to 20 percent upside, but note the divergence: the targets have not followed the stock down from its May high, which reads as stale-bull positioning rather than confirmation. Treat all targets as opinion, not fact.
What the crowd is saying
Sentiment is the softest of the inputs, so read it as signal rather than fact, and the signal here is a clean split: bearish on valuation, neutral-to-bullish on business quality, with the two sides mostly talking past each other.
The news flow shifted from warming to cautiously cooling around mid-May 2026, and the cause was the earnings reaction. The first-quarter print beat on both revenue and earnings, yet the stock fell about 7 percent on the day, its largest single-session drop of the year, because the forward guide came in light and the tariff and fuel commentary was more cautious than hoped. Coverage moved from “Walmart proves its model” to “a premium multiple leaves no room for any softness.” Layered on top was the executive-departure story, which the press treated skeptically as a management shakeup on top of a chief-executive handoff. That is a soft signal, not a crisis, and again no cause should be imputed to any individual.
Retail and social chatter leans valuation-skeptic and reads as organic, with no sign of coordinated promotion, which is expected for a stock this large and liquid. A representative and sourced data point: a Reddit thread asking why Walmart trades at a high earnings multiple drew over 1,400 upvotes in March 2026, resting on the argument that a roughly 4.8-percent-margin business growing earnings in the single digits does not deserve a 40-times-plus multiple. That is one thread, not a trend line, but it captures the loudest piece of the retail-level skepticism. Employee sentiment on Glassdoor sits at a mid-range 3.4 out of 5, and third-party customer review scores are lower at around 2.1 to 2.2, consistent with Walmart’s long-standing positioning: strong on price and value, mixed on service execution.
The useful part of sentiment is the divergence between the crowd’s story and the financials, and it is the sharpest in the whole Walmart picture. The crowd’s story is that Walmart is a defensive compounder being re-rated as a tech-and-media business, with the grocery moat insulating revenue and the high-income shopper gains proving the brand is trading up. What the filings and the market show is that the trailing multiple is about 40 percent above Walmart’s own ten-year median and roughly 145 percent above the retail-defensive industry median, while operating margins have stayed essentially flat through years of the overlay narrative. The overlay is real, but at absolute scale it is still a small fraction of revenue, and a single cost shock erased a quarter of margin progress. One independent DCF cited by Simply Wall St pegged intrinsic value near $93, which is a model output rather than a fact, but the direction is consistent across multiple frames: the market is pricing a smooth, sustained margin expansion that the financials have not yet delivered. One hygiene note for readers doing their own research: several lightly-sourced and AI-generated articles circulating in 2026 frame Walmart’s transformation in unqualified, promotional language, so check whether any ad-revenue or marketplace figure you encounter is attributed to a primary earnings release or simply restated without citation.
Durability: the structural case versus the cyclical and valuation bear
Putting the macro and micro together, Walmart’s durability has a split character, and being honest about the split is the whole point.
The structural case rests on three things that are genuinely new relative to prior cycles. First, the high-margin overlay changes how revenue growth turns into profit growth: advertising, membership, and marketplace fees scale on top of existing fixed-cost infrastructure, and they did not exist at material scale in 2008 or even 2015. Second, the upper-income customer gains have lasted more than two years, through normalizing conditions rather than just an acute recession, and if even a fraction of those shoppers become permanently Walmart-centric, the lifetime-value accretion is structural. Third, automation is creating a cost floor, not just a one-time cut, because the installed robotics infrastructure generates per-unit savings that compound with volume. Together these argue that Walmart is accumulating some permanent incremental margin potential without relying on the cycle to deliver it, which supports a premium to historical norms.
The cyclical and valuation bear is equally real and concentrates in three triggers. The first is tariff re-escalation at the worst moment: if US-China tariffs return toward the 145 percent peak while consumer sentiment is already near multi-decade lows, Walmart faces cost inflation and demand destruction on the same general-merchandise categories at once, and the thin 4.2 percent margin has almost no cushion. The second is SNAP cuts colliding with an unemployment spike, which would stress the lower-income core beyond simple trade-down and pressure transaction counts, ticket, and grocery share together. The third is the multiple itself: at 40-times-plus on a 4-to-8-percent grower, a de-rate toward Walmart’s own history is the largest single swing factor on a one-to-three-year view, larger than the fundamentals.
The most likely outcome is a split, and it leans toward the base case. The structural quality is real and earns the company a premium to a plain retailer; the consolidated margin has not yet moved, so the premium is at risk of slowly draining as the market reprices a mid-single-digit grower. The honest version is that the bull is not wrong about the overlay’s quality, it is making a bet on timing, and at 40 times, timing is the entire trade.
The scenarios in detail
The five-year outcome reduces to four variables. Everything below is an estimate and illustrative arithmetic, not a price target and not advice. The math behind each level is shown so it can be audited.
The driver tree. First and most important is the margin-mix crossover: does the consolidated operating margin actually move off roughly 4.2 percent within three to five years, or does the overlay keep merely offsetting core-retail compression? An estimated decomposition (Walmart does not disclose the segment-level advertising-and-membership profit split, so this is an analytical inference, not a reported figure) suggests roughly $2 billion of overlay operating-income growth offset by roughly $0.5 billion of core-retail decline in the most recent year, which would make the overlay a defensive story rather than a compounding one. That single question is the master variable. Second is retail-media scale and ceiling: Walmart Connect monetizes at about 4 percent of marketplace value versus Amazon’s roughly 8 percent, and even at full parity on today’s marketplace it tops out near an estimated $12 billion, with the open question being whether ad growth is new advertiser dollars or budget reallocated from Amazon. Third is capital intensity and the automation free-cash-flow inflection: capex at $26.6 billion a year peaks now, and the bull needs depreciation to plateau so productivity converts to cash. Fourth is the multiple itself against the macro, which on a one-to-three-year view swings the return more than the fundamentals do.
The earnings basis for every scenario is a forward adjusted earnings starting point near $2.80, grown at about 3 percent a year (bear), 6 percent (base), or 9 percent (bull), capitalized at exit multiples that de-rate toward Walmart’s own history in the base and bear and hold a premium in the bull. The same dollar ranges appear in the lede chart at the top of this piece.
Bull: the platform transformation earns the premium
Advertising compounds toward about $12 billion at roughly 75 percent margin, membership scales toward about $6 billion, marketplace value multiplies, automation depreciation plateaus after the capex peak, and overhead levers, so the crossover finally arrives and the consolidated margin moves off 4.2 percent toward roughly 4.7 to 5.0 percent. Earnings accelerate from 6 to about 9 percent a year. Adjusted operating income grows from about $31 billion toward roughly $44 to $48 billion by 2030 (estimate), and earnings per share reach about $4.31. The market keeps a rich multiple near 40 times because the margin mix is visibly more Amazon-like. Illustrative levels: about $134 at one year and about $172 at five years. What breaks it: the margin stays flat, the crossover keeps being “within our planning horizon” but never datable, and the bull collapses into the base.
Base: the defensive compounder
Advertising and membership keep compounding but keep offsetting core-retail cost drag rather than expanding the consolidated margin, exactly the recent pattern of advertising up 37 percent with margin flat. Earnings grow about 6 percent a year, in line with the guide. Tariffs hold near 30 percent and SNAP is a one-to-two-quarter headwind, then neutral. The multiple de-rates gradually from about 41 times toward Walmart’s own five-year average near 33 to 36 times as the market accepts a mid-single-digit grower. Adjusted operating income grows from about $31 billion toward roughly $40 billion by 2030 (estimate) and earnings per share reach about $3.75. The price grows into the multiple, so total return is dividend plus modest earnings growth minus the de-rate, roughly flat-to-low-single-digit price for the first few years, then grinding higher. Illustrative levels: about $113 at one year and about $124 at five years. What breaks it: a tariff or SNAP-driven margin or comp miss in peak season that turns the gradual de-rate into a sharp one.
Bear: the slow de-rate
The overlay is masking core-retail compression rather than expanding margin, the consolidated margin stays in the 4.0 to 4.3 percent band for another six to eight quarters, and earnings grow only 3 to 4 percent with no upside surprise. With nothing to drive estimates higher, the 40-times multiple has no support and drifts toward the five-year average near 36 times, then the ten-year median near 30 times, then a retailer’s multiple near 26 times. Tariff re-escalation into peak season or a SNAP-plus-unemployment shock can stack on top. Adjusted operating income grows slowly to about $36 billion by 2030 (estimate) and earnings per share reach about $3.25. The de-rate dominates, 13 to 27 percent on multiple compression alone before any miss. Illustrative levels: about $92 at one year, near the 52-week low, and about $84 at five years. This is a re-rating down, not an impairment of a cash-generative business. What pulls it back to base or bull: two or three consecutive quarters of genuine consolidated-margin expansion, or a flight-to-defensive-quality bid that holds the premium through a risk-off regime.
Catalysts and what to watch
The near-term catalysts are the August 20, 2026 second-quarter print (the forward guide versus the 4-to-8-percent frame, the consolidated-margin trend, advertising growth, and peak-season tariff commentary), the back-to-school and holiday peak that concentrates both tariff cost and discretionary-demand risk, and the US-China tariff calendar. The multi-year inflections are the post-peak automation free-cash-flow inflection, the retail-media crossover, the new chief executive’s reorganization executing or not, and the SNAP reductions flowing through with a lag. The single leading indicator that tells a long-term holder which scenario is winning is the consolidated operating margin: stuck at 4.0 to 4.3 percent is base or bear, a sustained move above about 4.5 percent is the bull crossover becoming real. Watch alongside it the advertising growth rate, the traffic-versus-ticket mix and upper-income retention, capex and free cash flow after the peak, and the multiple itself against the five-year average and ten-year median.
Companies to watch (bull / base / bear)
Walmart (WMT) - the subject; a thin-margin grocery base monetized by a high-margin overlay. Bull: the consolidated margin moves off 4.2 percent as ads and membership scale past the cost drag. Base: a defensive compounder whose multiple slowly de-rates while earnings grow in, leaving total return modest. Bear: the overlay stays defensive-only, the margin stays flat, and the premium drains toward a retailer’s multiple. Watch: the consolidated operating margin and the August 20 forward guide.
Amazon (AMZN) - the chief retail and retail-media rival and the structural ceiling on Walmart’s ad ambitions. Bull: AWS and advertising lift the whole company above retail economics at a cheaper multiple than Walmart. Base: steady share leadership in e-commerce and advertising while capex weighs on near-term cash. Bear: heavy AI capex pressures free cash flow and physical grocery stays a structural weak spot. Watch: the advertising growth rate and the AWS reacceleration. See the Amazon deep dive.
Costco (COST) - the membership-warehouse benchmark and a warning on the staple-premium cohort. Bull: near-indestructible membership economics keep compounding. Base: steady high-single-digit comps with a stretched but earned premium. Bear: at 43 to 48 times, any renewal stumble craters a stock with no cushion. Watch: the US renewal rate and membership-income growth.
Symbotic (SYM) - the automation partner Walmart’s cost-floor story depends on. Bull: a large backlog and the Walmart reference customer drive multi-year visibility. Base: lumpy deployments and execution risk against a high multiple. Bear: customer concentration cuts both ways, since Walmart is both largest customer and backer. Watch: deployment pace and the performance hurdles in the 400-unit program.
Target (TGT) - the discretionary-heavy peer the market refuses to pay up for. Bull: at about 15 times, it prices in years of misery that may not arrive. Base: a slow traffic recovery with a high dividend yield. Bear: no overlay, heavy discretionary exposure, higher-income shoppers leaking to Walmart. Watch: comp durability and any move into retail media at scale.
Risk controls
The honest risks are concentrated and worth stating without hedging them away. The first is valuation after a long run: at 40-times-plus on a 4-to-8-percent grower, the stock can fall 13 to 27 percent on multiple compression alone, with no earnings miss required, and the May 2026 drop on a beat showed the fragility live. The second is thin-margin fragility: a 4.2 percent consolidated margin leaves almost no cushion, so a single cost shock can erase a quarter of progress, as a $175 million fuel headwind already did. The third is tariff and import exposure: as the world’s largest importer with China at roughly 20 percent of US sales in the higher-margin layer, a re-escalation toward the 145 percent peak into peak general-merchandise season is the most plausible margin-threatening event. The fourth is consumer and macro cyclicality, especially a SNAP cut colliding with an unemployment spike that stresses the lower-income core. The fifth is e-commerce profitability reversal if the express-fee and density gains prove cyclical. The sixth is competition, above all Amazon’s roughly 11-times scale advantage in advertising and its delivery-price floor. The seventh is key-person and ownership concentration: a brand-new chief executive amid a C-suite reshuffle, and a Walton family holding about 44 percent. The eighth is regulatory and labor, including the ongoing FTC compliance monitoring and rising state minimum wages.
What would change the read. A bull should turn cautious if the consolidated margin prints flat for another six to eight quarters despite continued 30-percent-plus advertising growth, or if the stock keeps selling off on beats, or if tariffs re-escalate into peak season with no absorption headroom. A bear should reconsider if Walmart posts two or three consecutive quarters of genuine consolidated-margin expansion, if advertising scales past the estimated $12 billion ceiling on new advertiser dollars, or if a risk-off regime drives a flight-to-defensive-quality bid that holds the premium.
Methodology, sourcing, and data-quality flags
This piece draws on parallel research streams: the SEC filings (the 10-K for the fiscal year ended January 2026 plus the related 8-K earnings releases), point-in-time market and valuation data, the value-chain and unit-economics analysis, the sentiment and OSINT read, the macro and micro economics, and a forward bull/base/bear outlook, with a skeptic attacking the thesis and a compliance pass enforcing the disclaimers. The source hierarchy runs primary first (Walmart’s filings and earnings releases, the FTC release), then named analyst and aggregator data (eMarketer, Numerator, Marketplace Pulse, Morgan Stanley, StockAnalysis, FinViz, GuruFocus), then reputable trade press, and finally clearly labeled estimates. Every load-bearing figure is recorded in the run’s claims ledger with a source and an as-of date.
The five-factor read, in plain terms, is where the Hold conclusion comes from.
Valuation is the heaviest mark against the stock. Walmart trades at about 41 times trailing earnings (a disputed 39-to-43-times forward) on management’s own 4-to-8-percent earnings-growth guide, a roughly 4-to-5-times forward PEG, about 40 percent above its own ten-year median and roughly 145 percent above the retail-defensive median, with a free-cash-flow yield near 1.3 percent. The premium rests on a margin transformation that has not yet appeared in the consolidated income statement. Valuation nets to clearly overvalued.
Growth is solid but not the runway the multiple implies. Net sales are guided up 3.5 to 4.5 percent, adjusted operating income up 6 to 8 percent, and adjusted earnings per share to $2.75 to $2.85, with real share gains including the upper-income cohort. The genuine growth engine of advertising, membership, and marketplace is high-quality but only about 1.5 percent of revenue, so it earns a positive quality read rather than a high consolidated growth rate. Growth nets to neutral.
Quality is best-in-class for the sector. Operating cash flow was $41.6 billion, free cash flow $14.9 billion, the dividend streak reached 53 years, and the balance sheet funds $26.6 billion of capex and a $30 billion buyback at once. The roughly 21 percent US grocery share and 150 million-plus weekly shoppers form an irreplaceable data moat, and US e-commerce is now profitable. Margins are thin by design, but cash generation and durability are exceptional. Quality is strong.
Risk is real and two-sided. Walmart is the largest US importer with China at roughly 20 percent of US sales in the higher-margin general-merchandise layer (a tariff binary, peak risk 145 percent), it is over-indexed at roughly 26 percent of SNAP grocery dollars into a roughly 20 percent benefit cut, it has a brand-new chief executive amid a C-suite departure wave and steady disclosed Walton-trust selling, and its thin 4.2 percent margin leaves little cushion. A 0.60 beta and balance-sheet strength partly offset, holding this to a modest negative rather than a heavy one.
Momentum is mixed. The one-year total return was about 28.7 percent inside a long uptrend, but the stock is about 13 percent off its May high, below its 50-day moving average, barely above its 200-day, trailing the S&P 500 and most peers year-to-date, and the 7-percent drop on a beat showed fragile positioning. The Strong-Buy mean target near $138 has not followed the stock down, which reads as stale-bull divergence rather than confirmation. Momentum nets to neutral.
On balance the read lands at Hold, with the valuation factor doing the work: high-quality, defensive, and durably cash-generative, but richly valued for the growth it actually guides to, with the platform-margin transformation still unproven in the consolidated number. This is a transparent, rules-based research signal, not personalized investment advice and not a recommendation to buy or sell. The read moves up only if the consolidated margin visibly expands or the multiple de-rates materially to a lower price; it moves down on a tariff or SNAP-driven margin or comp miss into peak season.
Data-quality flags:
- Dollar-figure recording bug. A systematic recording issue stripped leading dollar signs and some digits from value strings in the raw ledger. The underlying numbers are correct; every dollar figure in this piece was reconciled against the research markdown and the SEC filings (for example $117.18 price, $932.5 billion market cap, $26.6 billion capex, $14.9 billion free cash flow), not lifted from the raw ledger strings.
- Forward P/E and PEG are disputed. Forward P/E ranges from about 35.7 times to about 44.4 times across sources, driven by GAAP-versus-adjusted earnings and the period used; it is presented here as a range, roughly 39 to 41 times on consensus. PEG ranges from about 2.0 to 4.3 times depending on the growth input.
- The core-retail operating-income decomposition is an analytical estimate. Walmart does not disclose the segment-level advertising-and-membership profit split, so the inference that core-retail operating income declined while the overlay grew is a derived scenario built on assumed 70-to-80-percent ad margins, not a reported figure. It is presented two-sided.
- Walmart+ member count, retail-media margin, marketplace GMV, and renewal rates are estimates. Walmart+ counts (roughly 28 to 31 million, per Morgan Stanley and CIRP surveys), the 70-to-80-percent advertising margin (a CFO range and industry estimate), third-party GMV (around $15 billion, per Marketplace Pulse), and Sam’s Club renewal rates are not company-disclosed; all are attributed and ranged.
- Segment operating income basis. Figures use the as-reported basis for the fiscal year ended January 2026, not the restated presentation that reflects the new overhead-allocation methodology adopted in the current fiscal year. Year-over-year segment comparisons will look slightly different on the new basis.
- Market shares and peer valuations bounce by source and quarter. Retail-media, e-commerce, and grocery shares (eMarketer, Numerator) and peer market caps and multiples are tier-appropriate analyst and aggregator data, attributed and dated, and should not be read as hard Walmart-disclosed facts.
- The $70 analyst price-target low is unverified as to author and vintage and is treated as an outlier; the practical mean target is around $138 to $140.
- Sentiment is the softest input. Social and search signals are illustrative impressions, not measured indices.
- Macro figures are estimates and forecasts, attributed (USDA food-inflation forecast, SNAP-impact and recession-probability estimates, the Simply Wall St DCF), not facts.
- Point-in-time prices. All prices, caps, and multiples are as of June 22, 2026 and move fast.
Key sources: Walmart 10-K for the fiscal year ended January 31, 2026 and the related 8-K earnings releases (Q4 and Q1); Walmart corporate news releases; the FTC press release (February 2026); StockAnalysis, Yahoo Finance, FinViz, and GuruFocus for point-in-time market data; AdExchanger and Sherwood for advertising figures; Marketplace Pulse for marketplace GMV; eMarketer and Numerator for share data; Morgan Stanley and CIRP for membership estimates; Simply Wall St for the DCF; the USDA, BLS, NY Fed, and Federal Reserve for macro data.
This article is OSINT research for educational purposes only and is not investment advice or a recommendation to buy or sell any security. Figures are point-in-time as of 2026-06-22 and subject to change. Do your own due diligence.