
Research date: June 30, 2026 | OSINT market research on The Home Depot, Inc. (HD, NYSE), the world’s largest home-improvement retailer, now three years into a stalled comparable-sales stretch while it spends roughly $24 billion buying its way into the professional-contractor distribution business. The most recent reported numbers are fiscal 2025 (52 weeks ended February 1, 2026, filed March 18, 2026) and the first quarter of fiscal 2026 (ended May 3, 2026, filed May 27, 2026). Q2 FY2026 results are expected August 18, 2026, and are not yet out.
Important disclaimer. This is OSINT-based research and educational analysis, not investment advice. I am not a financial advisor. Nothing here is a recommendation to buy or sell any security, and the scenarios below are illustrative, not price targets. Home Depot’s fundamentals are unusually tied to the path of mortgage rates and existing-home turnover, a single macro variable outside the company’s control, and roughly half its merchandise is imported into an unsettled tariff regime. Market caps, prices, valuation multiples, and market-share figures are point-in-time (June 30, 2026), press-reported where noted, and move fast. Do your own due diligence and consult a licensed advisor.
Where this stock could be in 6 months, 1 year, 3 years, and 5 years
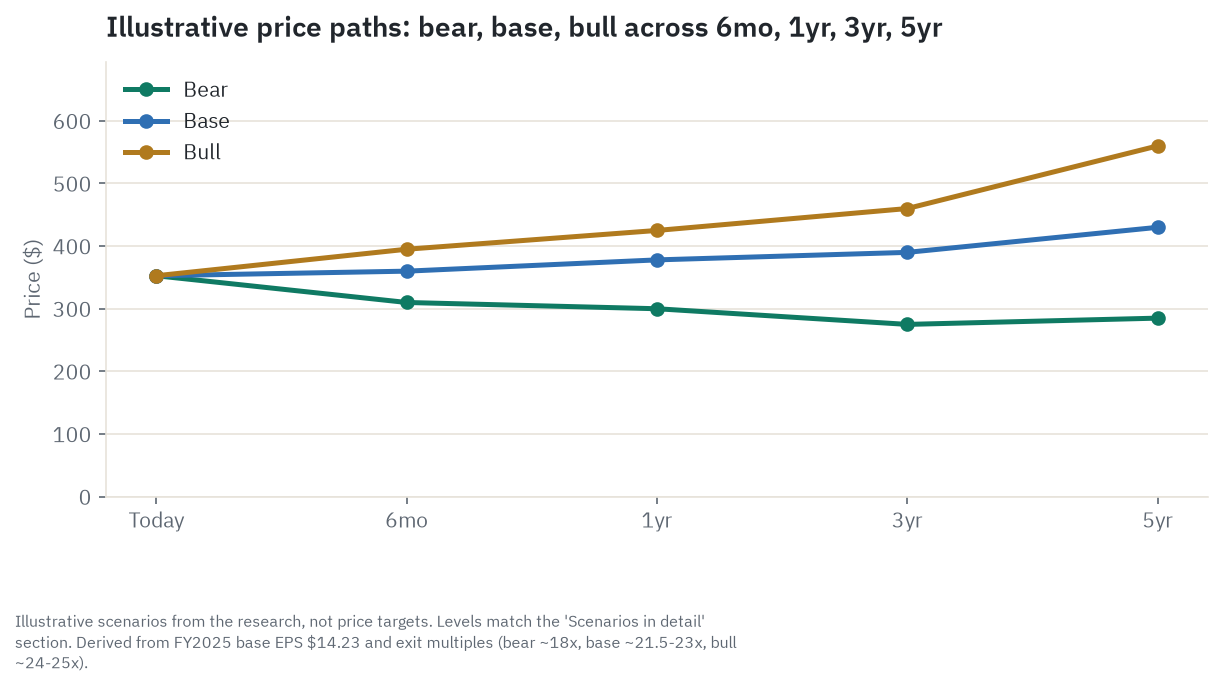
Every dollar figure below is an illustrative estimate built from a stated future earnings-per-share assumption times a stated exit multiple. None of it is a price target, and none of it should be traded on directly. The stock was around $352.68 when this was written, roughly in the middle of its 52-week range and about 17 percent below its September 2025 high; the quote above the article is the live, current number.
6 months (into late 2026). This window is about the next earnings print and the Fed, not anything structural. The base case has HD drifting to roughly $360, a touch above today’s price, as it probes the $356 200-day moving average on an in-line August 18 report that reaffirms the flat-to-2-percent comparable-sales guide. The bull case, near $395, needs a comparable-sales beat paired with a credible signal that the Federal Reserve is about to cut and mortgage rates are about to follow. The bear case, near $310, close to the low end of the sell-side analyst range, is a soft print combined with the valuation premium over Lowe’s compressing as investors lose patience. The single thing most likely to flip this window is the tone of Fed guidance and the 30-year mortgage rate heading into that print.
1 year (mid-2027). The question for this window is whether comparable sales are visibly breaking out of the roughly zero-to-one-percent band they have occupied for three years, and whether the 2027 rate path is actually bending down rather than just being talked about. The base case, near $378, sits close to the current $370-to-415 range of sell-side price targets. The bull case, near $425, retests the $426.75 all-time high on genuine unlock optimism. The bear case, near $300, is what happens if the Mortgage Bankers Association’s forecast of rates near 6.5 percent through 2028 is confirmed on schedule and the multiple de-rates toward Lowe’s. The flip factor is a quarter of comparable sales convincingly above 2 percent, or, on the other side, a fourth consecutive near-zero year.
3 years (2029). This is where the structural drivers start to matter more than the next quarter’s print. Wolfe Research, in a June 2026 downgrade, dated any real housing unlock to “mid-2027 at the earliest,” which means this window is the first one where the thesis actually has to start showing up in the numbers rather than in a slide deck. The base case, near $390, assumes earnings per share around $17 and a modestly recovering multiple as the housing thaw begins in stages and Home Depot resumes its buyback. The bull case, near $460, has the unlock arriving cleanly and the buyback back in force. The bear case, near $275, is a fourth and fifth straight near-zero comparable-sales year with the buyback still paused, the roughly 34 percent price-to-earnings premium over Lowe’s compressing toward parity. The flip factor is existing-home sales sustainably back above 4.5 to 5 million units a year, paired with the operating margin actually stabilizing.
5 years (2031). This is the pure durability question: does the professional-contractor distribution bet stop diluting the company’s blended margin and start adding to it, does the historic buyback engine re-arm once the debt from that bet is paid down, and does the core retail business’s roughly 13.5-to-14 percent operating margin reassert itself once housing normalizes. The base case, near $430, has earnings per share near $20 and a mid-21x multiple, plus the current 2.64 percent dividend yield doing real work in total return. The bull case, near $560, is the company’s own conditional “market-recovery” scenario actually firing: comparable sales in the 4-to-5 percent range, earnings near $23, and the multiple re-rating back toward 24 or 25 times. The bear case, near $285, is a fifth straight year of essentially flat earnings at a compressed, Lowe’s-like multiple, a dividend-supported floor rather than a growth story. The gap here is the widest of any horizon, the bull case is nearly double the bear case, and that gap is really a bet on whether mortgage rates ever meaningfully fall within the window.
Where the read lands today. On balance, the five-factor read lands at Hold, with a downward tilt. Home Depot is a genuinely dominant, high-quality number-one retailer with real long-term optionality on a housing recovery and a durable dividend, but it is priced at a real premium to a cheaper direct competitor running the identical playbook, on three years of stalled comparable sales and declining earnings, with both the buyback and the housing catalyst switched off. Practically: this is a name worth continuing to hold if you already own it for the eventual housing turn and the dividend, not one worth paying up for at today’s multiple. The read would move up to Accumulate on a genuinely cheaper entry point or a real comparable-sales-and-margin inflection, and down to Reduce if the premium over Lowe’s holds while comparable sales and earnings keep stalling for a fourth straight year. The single thing most likely to flip it either way is the 30-year mortgage rate.
Companion tool
Jump to the interactive dashboard to sort and filter HD against its peer and supplier set across valuation, growth, quality, risk, and momentum, or download the Excel model to flex the bull, base, and bear scenarios with your own earnings and multiple assumptions.
TL;DR
Home Depot is the largest home-improvement retailer in the world, addressing a roughly $1.1 trillion market split close to evenly between do-it-yourself homeowners and professional contractors, and for most of the last two decades it grew earnings almost on autopilot through modest sales growth, a durable operating margin near 14 percent, and an aggressive buyback that shrank the share count every year. All three of those levers have gone quiet at once, and that is the whole story right now. Comparable sales, or comps, measure a store’s sales against the same period a year earlier at locations open in both periods, deliberately excluding new stores and acquisitions, which is exactly why the number matters here: it isolates whether the existing business is actually selling more, stripped of any boost from buying other companies. Comps have printed near zero for three straight fiscal years, so the modest growth Home Depot has reported has come almost entirely from bolting the SRS and GMS acquisitions onto the base business, not from the base business itself. Operating margin has fallen every year since fiscal 2023 as Home Depot folds in the SRS and GMS professional-distribution businesses it bought for a combined roughly $24 billion, both of which run at a small fraction of the core retail margin. The buyback has been paused since March 2024 specifically to pay down the debt those two deals required, with no resumption planned in fiscal 2026. Diluted earnings per share actually declined for three consecutive years, from $15.11 to $14.91 to $14.23. Home Depot still trades at a roughly 34 percent price-to-earnings premium to its closest competitor, Lowe’s, a premium that requires the market’s bet on a housing-market unlock to pay off on a timeline that professional forecasters keep pushing further into the future.
Explore it yourself: the interactive dashboard
Open the dashboard in a full screen
A compounder that has stopped compounding
For most of the last twenty years, Home Depot’s earnings-per-share growth worked like a business splitting a fixed pizza into fewer slices. Even in years when the pizza itself (net income) barely grew, the company kept buying back stock, shrinking the number of slices (shares outstanding), so each remaining slice (earnings per share) got bigger anyway. It is a completely legitimate way to compound EPS, and Home Depot ran it about as well as any large retailer in America.
That machine is switched off. The board paused the buyback in March 2024 to help pay for the roughly $18.25 billion purchase of SRS Distribution, a distributor of roofing, pool, and landscape supplies to professional contractors, and it has stayed paused through fiscal 2025 and into fiscal 2026 while the company also absorbed a second, roughly $5.5 billion acquisition, GMS Inc., a distributor of drywall, ceilings, and steel framing, in September 2025. Together the two deals, more than 1,250 branches between them, form the Pro-distribution spine Home Depot is building to serve complex contractor projects a big-box store alone cannot handle. Home Depot spent $7.951 billion buying back stock in fiscal 2023. It spent $649 million in fiscal 2024. It spent zero in fiscal 2025. The company’s own 10-K says there are “no plans to resume share repurchases in fiscal 2026.” The pizza itself, meanwhile, has not been growing either: diluted earnings per share fell in each of the last two fiscal years, from $15.11 to $14.91 to $14.23, even as revenue rose, because the operating margin has been sliding as the newly-bought distribution businesses dilute the blend. A company that built its reputation as a reliable compounder has not actually compounded its earnings per share since fiscal 2023, and the one lever that historically covered for a soft top line, the buyback, is currently doing nothing.
Layered on top of that is a second, unrelated lock: the housing market itself is frozen by rates. Roughly 80 percent of outstanding US mortgages sit below today’s market rate, and about 70 percent sit below 5 percent, against an average effective rate on existing mortgages of around 4.3 percent. Picture a renter who signed a 30-year lease at a bargain rate years ago; moving to a nicer apartment now means paying double for the same square footage, so almost nobody moves who does not have to. That is the housing “lock-in effect” in one sentence, and it explains why existing-home sales are running at roughly 4.17 million units a year, well below the 5.0-to-5.5-million pace that prevailed through most of the 2010s. A home sale is the single biggest trigger for a large, high-margin remodel. When home sales freeze, so does Home Depot’s highest-margin demand.
The bull case is that both of these are temporary, not permanent, and the numbers back that up as a possibility rather than a certainty: the buyback can resume once the debt from SRS and GMS is paid down, and the housing lock-in unwinds mechanically as rates fall or as enough time passes that people simply have to move regardless of rate. The bear case is that the market is paying a premium multiple today for both of those things to happen on a schedule that keeps getting pushed out. That tension, not any single number, is what this whole article is about.
How the money flows
flowchart TD
    DIY["DIY/consumer demand - ~50% of $164.7B FY25 sales"]
    PRO["Pro/contractor demand - nearing 50% of sales"]
    VEND["Tool, appliance, lumber & paint vendors - Stanley B&D, TTI, Whirlpool, Masco/Behr"]
    IMPORT["Import layer - ~half of goods, ex-US sourcing, tariff-exposed"]
    STORES["HD store network - 2,359 stores, DCs/FDCs, $151.97B Primary-segment sales"]
    SRS["SRS + GMS Pro distribution - 1,250+ branches, $12.7B 'Other'-segment sales"]
    REV["Consolidated net sales $164.7B -> gross profit $54.9B (33.3%) -> op income $20.9B (12.7%)"]
    OCF["Operating cash flow $16.3B"]
    CAPEX["Capex ~$3.7B - stores, automation, tech"]
    DIV["Dividend $9.2B paid, $2.33/qtr"]
    DEBT["Debt paydown $5.0B"]
    BUYBACK["Buybacks - paused since Mar 2024, $11.7B of $15B unused"]

    VEND --> IMPORT
    IMPORT --> STORES
    IMPORT --> SRS
    STORES --> DIY
    STORES --> PRO
    SRS --> PRO
    DIY --> REV
    PRO --> REV
    REV --> OCF
    OCF --> CAPEX
    OCF --> DIV
    OCF --> DEBT
    OCF --> BUYBACK
Money starts in two pockets that the company itself now describes as close to equal in size. On one side is the DIY homeowner or renter, walking into one of Home Depot’s 2,359 stores or opening the app for a weekend project. On the other is the Pro, the roofer, remodeler, electrician, or general contractor buying materials to bill forward to someone else’s job, and by the company’s own account at its December 2025 investor conference, Pro-related revenue is now nearing half of the total. Both pull merchandise down through the same upstream supplier base: tool brands like Stanley Black & Decker and TTI’s Milwaukee line, appliance makers like Whirlpool and GE Appliances, lumber and building-materials producers, and Behr paint, Home Depot’s own private label made by Masco. Close to half of everything Home Depot sells crosses a border before it reaches a shelf, sourced through offices in Mexico, Canada, India, Vietnam, Taiwan, China, and parts of Europe, with a stated goal that no single country outside the US supply more than roughly 10 percent of total purchases in a year. That import layer is the single biggest cost-line risk in the whole chain, because it sits squarely inside an unsettled tariff regime discussed in detail below. A tariff is a tax collected at the border, so on roughly half of Home Depot’s merchandise it works as a direct increase to cost of goods sold, a cost the company must either absorb as thinner margin or pass on as a higher shelf price, or split between the two. A February 2026 Supreme Court ruling struck down only the tariffs imposed under the International Emergency Economic Powers Act; separate tariff authority under Section 122, Section 232, and Section 301 survived that ruling and remains fully in force, and the mechanics of refunding duties already collected under the invalidated authority are still unresolved in ongoing litigation. That makes the ruling a legal development worth tracking, not tariff relief Home Depot can bank on.
From there the merchandise splits into two increasingly distinct distribution spines. The legacy spine is the store network itself, still carrying the large majority of revenue, $151.97 billion of the $164.7 billion fiscal 2025 total, but its organic growth has essentially stopped: comparable sales rose only 0.3 percent last year. The newer spine is the one Home Depot has spent close to $24 billion building since 2024, SRS Distribution and, since September 2025, GMS Inc., together running more than 1,250 branch locations that deliver roofing materials, drywall, landscape supplies, and pool products directly to job sites on trade credit, something a big-box store cannot replicate. This “Other” segment generated about $12.7 billion of net sales in fiscal 2025, still a small fraction of the total but the fastest-growing piece, and the reason management now frames its addressable market at roughly $1.1 trillion rather than the roughly $950 billion core home-improvement market it used to cite.
Money collects back at the top as $164.7 billion of consolidated net sales, converts to $54.9 billion of gross profit at a 33.3 percent margin, and after operating costs becomes $20.9 billion of operating income at a 12.7 percent margin, down from 13.5 percent the year before. Operating cash flow of $16.3 billion then runs down a clearly stated waterfall: reinvest in the business first, about $3.7 billion of capital spending; then the quarterly dividend, $9.2 billion paid in fiscal 2025; then debt paydown; and only last, share buybacks, which remain paused. That ordering is itself a signal. Home Depot is telling the market, through where its cash actually goes, that building out the Pro-distribution spine currently outranks returning cash to shareholders through repurchases.
What Home Depot actually sells, and to whom
The Primary segment is the legacy retail business, the roughly 2,359 stores across the US, Canada, and Mexico plus the e-commerce operation, and it is still the profit engine: $151.966 billion of fiscal 2025 net sales at a 13.5 percent operating margin, down only modestly from 13.9 percent the year before. This is the business most people picture when they think of Home Depot, orange aprons, wide aisles, big-box stores anchoring a shopping center, and it still carries the company’s real pricing power, built on scale (buying leverage over even large national brands), density (a store network dense enough to be the default trip for both a weekend DIY project and a contractor’s daily supply run), and brand.
The “Other” segment, SRS and GMS, is the newer Pro-distribution business, four operating lines, roofing and building products, interior and construction products, landscape, and pool, run through more than 1,250 branches rather than big-box stores. It generated $12.717 billion of fiscal 2025 net sales, roughly 7.7 percent of the consolidated total, but at a 2.5 percent operating margin, versus 3.3 percent the prior year and roughly one-tenth the core retail margin. That is not an accident or a sign of mismanagement. Building-materials distribution is a scale-and-logistics business industry-wide, and peers like Beacon Roofing, SiteOne, and Builders FirstSource run in similar thin-margin territory. Home Depot bought its way into that business deliberately, at that margin, because it locks in Pro-customer relationships through trade credit and job-site delivery that a big-box store cannot offer, and because owning the distribution relationship keeps a complex, whole-house Pro project from routing through an independent distributor that Lowe’s or someone else might capture instead.
Online, which the company reports separately from SRS/GMS, was 15.9 percent of net sales in fiscal 2025, up 8.7 percent year over year, a real but secondary channel next to the physical store and branch network.
Pro versus DIY, by the company’s own telling at its investor conference, is close to a 50/50 split of revenue, though Home Depot does not disclose the exact number in its filings, so treat that figure as directionally right rather than exact. The distinction matters because the two customer types behave completely differently. A DIY shopper comparison-shops between Home Depot, Lowe’s, Amazon, and the local hardware store on price and convenience with almost no switching cost. A Pro contractor with an established trade-credit account and a job-site delivery relationship does not switch distributors mid-project over a small price difference, because renegotiating credit terms is a real hassle. That stickiness is exactly why Home Depot is spending tens of billions of dollars to deepen its Pro relationships even at a much lower margin than its core business.
Who wins where
Reasoning through the whole chain, the durable economics sit almost entirely with Home Depot’s own core retail franchise, the roughly 13.5-to-14 percent margin business built on scale, store density, and brand, against which both suppliers and independent local competitors are largely price-takers. Manufacturers of commodity building products and appliances are exposed directly to tariffs and input costs and have limited pricing power of their own, apart from the private-label and exclusive-brand lines, like Behr paint, that Home Depot negotiates specifically because they carry a higher margin than national brands. Independent regional distributors and local hardware stores are structurally thinner-margin and are the group actually losing ground in the current consolidation wave: both Home Depot (SRS, GMS) and Lowe’s (Artisan Design Group, Foundation Building Materials) are buying up the same fragmented Pro-distribution assets those independents used to own, taking share and margin away from that tier specifically.
The newly acquired Pro-distribution layer itself, SRS and GMS, is a structural price-taker business on its own economics, a thin-margin, commodity-logistics operation no matter who owns it. Home Depot’s bet is that owning it anyway, and cross-selling it against a captive Pro customer base with trade credit already in place, is worth running a business at roughly one-tenth the margin of its core retail operation. Whether that bet pays off depends on integration executing cleanly and on the Pro relationship it buys proving durable enough to be worth the margin given up, which is discussed further in the durability section below.
The consumer, DIY and Pro alike, captures the surplus in a downturn by simply deferring or canceling a project, which is exactly the dynamic suppressing Home Depot’s highest-margin categories right now, and funds the whole chain again once confidence returns.
Company by company: who’s who
The Home Depot, Inc. (HD, NYSE) is the category leader, roughly $351.7 billion market capitalization as of June 30, 2026, the world’s largest home-improvement retailer with 2,359 stores across the US, Canada, and Mexico plus SRS and GMS Pro-distribution. Q1 FY2026 revenue was $41.77 billion, up 4.8 percent, beating consensus of roughly $41.51 billion, with comparable sales up 0.6 percent. Bull: scale, Pro-customer loyalty, and the SRS/GMS build-out give Home Depot multiple growth levers even while DIY discretionary spend stays soft, and a housing-market unlock would be a genuine multi-year tailwind. Bear: comparable transactions have been negative for several quarters, meaning growth is coming from bigger tickets rather than more shopping trips, a sign of a still-cautious DIY consumer, and both tariff costs and a housing market stuck in a low-turnover holding pattern cap the upside until rates fall meaningfully.
Lowe’s Companies, Inc. (LOW, NYSE), roughly $123.6 billion market cap, is Home Depot’s direct number-two rival, roughly 1,750 stores, historically more DIY-weighted but running the identical Pro-distribution playbook through its own acquisitions of Artisan Design Group ($1.325 billion, closed June 2025) and Foundation Building Materials (roughly $8.8 billion, closed October 2025). Q1 FY2026 total sales were $23.1 billion, up 10.3 percent, its fourth straight quarter of positive comparable sales at 0.6 percent. Bull: four consecutive quarters of positive comps and a real Pro push show the “DIY-only” narrative on Lowe’s is outdated, and any housing thaw disproportionately helps its higher DIY mix rebound. Bear: that headline 10.3 percent total-sales growth is almost entirely acquisition-driven, not organic. Lowe’s own comparable sales of 0.6 percent are essentially identical to Home Depot’s, and Lowe’s has likewise paused its buyback, in its case until 2027 as it delevers toward a 2.75x target. The two companies are running the same playbook, financed the same way, with the same buyback pause, and Lowe’s is doing it at roughly two-thirds Home Depot’s multiple, which is the single hardest thing to explain away in Home Depot’s valuation case, addressed in detail below.
Ferguson Enterprises Inc. (FERG, NYSE), roughly $46.0 billion market cap, is North America’s largest wholesale distributor of plumbing, HVAC, and waterworks products to professional contractors, a B2B distributor rather than a retailer, selling into the same Pro end-markets Home Depot and Lowe’s are chasing through SRS and their own Pro-loyalty programs. Q1 FY2026 sales were $7.47 billion, up 3.6 percent, with operating margin expanding 120 basis points to 8.2 percent even as the company flagged a weaker US residential backdrop. Bull: margin expansion despite modest sales growth shows pricing discipline and a mix shift toward higher-margin specialty categories, and the pure-distribution model captures upside from any construction recovery without retail store-footprint risk. Bear: Ferguson is directly exposed to the same soft US residential construction and remodel market pressuring Home Depot and Lowe’s, with less brand-level pricing power than a retailer, and its own guidance explicitly flags the weaker backdrop.
Builders FirstSource, Inc. (BLDR, NYSE), roughly $9.6 billion market cap, is the largest US supplier of building materials and prefabricated components to homebuilders and Pro contractors, more concentrated in new residential construction than Home Depot’s repair-and-remodel-weighted Pro book. Q1 2026 revenue was $3.29 billion, down 10.1 percent, and the company posted a net loss of $47.4 million. Bull: scale in prefabricated components gives Builders FirstSource structural cost advantages once new-home construction volumes recover. Bear: revenue is actively shrinking and the company just swung to a net loss, a much more cyclical and lower-quality exposure than Home Depot or Lowe’s repair-and-remodel base; this is a pure option on a recovery that has not arrived, not a thesis backed by current numbers.
QXO Inc. (QXO, NYSE), roughly $12.5 billion market cap, is a building-products distribution roll-up controlled by industrial-consolidator Brad Jacobs, now the largest publicly traded roofing and building-products distributor after its roughly $11 billion acquisition of Beacon Roofing Supply and a $2.25 billion acquisition of Kodiak Building Partners, with a further roughly $17 billion agreement to acquire TopBuild announced in April 2026. Q1 2026 net sales were $1.73 billion, but adjusted EBITDA was only $1.2 million, near breakeven, alongside a $227.1 million net loss. Bull: Jacobs has a proven track record building industrial roll-ups, and the pending TopBuild deal would create real scale against Ferguson and Builders FirstSource. Bear: near-zero adjusted EBITDA margin and a $227 million net loss show the roll-up is still deep in integration mode with no proven profitability at scale, and three large acquisitions in eighteen months into a soft market is real balance-sheet risk; this is a bet on the operator, not on the numbers.
Floor & Decor Holdings, Inc. (FND, NYSE), roughly $6.4 billion market cap, is a specialty big-box retailer of hard-surface flooring, competing with Home Depot’s and Lowe’s flooring aisles but with deeper in-category assortment. Q1 FY2026 net sales were $1.15 billion, down 0.7 percent, with comparable sales down 3.7 percent and comparable transactions down 5.5 percent. Bull: category depth and Pro-installer relationships make Floor & Decor the default destination once discretionary remodel spending recovers, and the company is still opening stores and buying back stock through the downturn. Bear: comparable sales and transactions have been negative for multiple quarters, and flooring is one of the most discretionary, big-ticket remodel categories, getting hit hardest by the weak housing cycle; this bull case is a recovery call with no recovery yet visible in the data.
Tractor Supply Company (TSCO, NASDAQ), roughly $16.6 billion market cap, is the largest US rural-lifestyle retailer, farm and ranch supplies, tools, and hardware for a rural and small-acreage customer base that overlaps Home Depot and Lowe’s only at the margins. Q1 2026 net sales were $3.59 billion, up 3.6 percent, with comparable sales up 0.5 percent. Bull: a rural, exurban customer base less tied to the existing-home-turnover cycle gives Tractor Supply a more insulated, steadily compounding growth profile. Bear: comparable sales of only 0.5 percent show this name is not immune to the same discretionary pressure everyone else in the group is feeling; it is a more defensible story than the others here, but not a safe haven.
Walmart Inc. (WMT, NYSE), roughly $901.3 billion market cap, Costco Wholesale Corp. (COST, NASDAQ), roughly $414.9 billion, and Amazon.com, Inc. (AMZN, NASDAQ), roughly $2.56 trillion, all sell home-improvement-adjacent categories, garden, tools, basic hardware, at a fraction of Home Depot’s category depth. They are included here only as scale and consumer-spending context, not as direct competitors, and each has its own standalone research on this site.
What the filings say
Home Depot’s fiscal 2025 (52 weeks ended February 1, 2026) net sales were $164.7 billion, up 3.2 percent, or $5.2 billion, from fiscal 2024’s $159.5 billion, which itself was a 53-week year. The increase was driven almost entirely by acquisitions: SRS, owned for a full year, and GMS, owned since September 2025, together added roughly $6.3 billion of incremental net sales, against a roughly $2.5 billion drag from the loss of fiscal 2024’s extra week. Organic growth was thin. Total comparable sales were up 0.3 percent in fiscal 2025, following declines of 1.8 percent in fiscal 2024 and 3.2 percent in fiscal 2023, three straight years of flat-to-negative organic growth only just turning positive. Comparable transactions fell 1.0 percent while average ticket rose 1.4 percent, meaning the growth that did occur came from customers spending more per visit, not from more visits.
Margins tell the real story. Gross margin has been essentially flat, 33.3 percent in fiscal 2025 versus 33.4 percent in both of the prior two years, meaning Home Depot is not losing pricing power at the shelf. Operating margin, by contrast, fell to 12.7 percent in fiscal 2025 from 13.5 percent in fiscal 2024 and 14.2 percent in fiscal 2023, a clear three-year downtrend. That decline is a structural mix effect, not an execution failure. The Primary retail segment’s own operating margin was 13.5 percent in fiscal 2025, down only modestly from 13.9 percent, while the newly consolidated “Other” segment, SRS plus GMS, ran a 2.5 percent operating margin on $12.7 billion of sales, versus 3.3 percent on $6.4 billion the year before. Home Depot deliberately bought a lower-margin distribution business, and folding it into the consolidated numbers mechanically drags the blended margin down even though the core retail engine is still healthy. GAAP diluted earnings per share was $14.23 in fiscal 2025, down 4.6 percent from $14.91 in fiscal 2024 (which itself carried roughly a $0.30 boost from the extra 53rd week) and from $15.11 in fiscal 2023. Net margin followed the same path, 8.6 percent in fiscal 2025 versus 9.3 percent and 9.9 percent in the two years before.
Cash flow softened alongside earnings. Operating cash flow was $16.325 billion in fiscal 2025, down from $19.810 billion in fiscal 2024 and $21.172 billion in fiscal 2023, reflecting working-capital drag, an inventory build of roughly $1.5 billion, on top of lower earnings. Capital spending was $3.679 billion, up modestly from $3.485 billion the year before. Free cash flow, operating cash flow minus capex, a figure this analysis calculated rather than one Home Depot itself reports as a defined non-GAAP measure, came to roughly $12.6 billion in fiscal 2025, down from roughly $16.3 billion the year before, a meaningful step down. Cash on hand was thin, $1.389 billion at fiscal 2025-end, versus total debt of approximately $55.8 billion, up from roughly $53.4 billion a year earlier as Home Depot borrowed to fund SRS and GMS. Goodwill on the balance sheet ballooned from $8.455 billion before the SRS deal to $22.344 billion at fiscal 2025-end, with $11.048 billion added from SRS in fiscal 2024 and $2.843 billion added from GMS in fiscal 2025. Goodwill is simply the premium Home Depot paid above SRS’s and GMS’s book value to acquire them, the price tag on buying growth rather than building it. If either business underperforms the assumptions baked into that price, accounting rules force Home Depot to write the goodwill down, a large non-cash charge to earnings that costs no cash but signals to the market that it overpaid, a credibility hit rather than a liquidity one. Total stockholders’ equity, which had been near zero in the heaviest buyback years, recovered to $12.813 billion at fiscal 2025-end, still thin next to roughly $105 to $108 billion of total assets. Return on invested capital, a company-defined measure of how much profit Home Depot earns per dollar of capital deployed in the business, fell to 25.7 percent in fiscal 2025 from 31.3 percent in fiscal 2024 and 36.7 percent in fiscal 2023, a direct mechanical consequence of financing two large acquisitions substantially with debt, which enlarges the capital base faster than the acquired businesses’ thinner profits can offset.
On capital return, Home Depot raised its quarterly dividend 1.3 percent to $2.33 per share in February 2026, which the company itself describes as equating to an annual dividend of $9.32 per share, the 156th consecutive quarter it has paid a cash dividend. Total dividends paid were $9.152 billion in fiscal 2025. The $15.0 billion share-repurchase authorization approved in August 2023 has been paused since March 2024 to help fund the SRS acquisition, and the 10-K states plainly that Home Depot has “no plans to resume share repurchases in fiscal 2026.” The company bought back $0 of stock in fiscal 2025, $649 million in fiscal 2024, and $7.951 billion in fiscal 2023, the last year the program was actually running; $11.66 billion of the authorization remains unused.
Management’s most current guidance, given with fourth-quarter fiscal 2025 results on February 24, 2026 and reaffirmed word for word with first-quarter fiscal 2026 results on May 19, 2026, calls for total sales growth of roughly 2.5 to 4.5 percent, comparable sales roughly flat to up 2.0 percent, operating margin of roughly 12.4 to 12.6 percent, and diluted earnings per share growth of roughly flat to up 4.0 percent off the $14.23 fiscal 2025 base. CEO Ted Decker described the first quarter as “in line with our expectations,” noting that “the underlying demand in our business was relatively similar to what we saw throughout fiscal 2025, despite greater consumer uncertainty and housing affordability pressure.” This is management’s own forward-looking guidance, not a promise, and it points to more of the same rather than a turn.
The 10-K’s own disclosed risk factors are direct about the two things weighing on the business: first, that “the high interest rate environment that persisted throughout fiscal 2025 and the significant increase in home prices in recent years have impacted housing affordability,” contributing to “historically low levels of housing turnover”; and second, tariff exposure, noting the company “experienced increased costs as a result of tariffs in fiscal 2025” and flagging the US Supreme Court’s ruling striking down certain tariffs as introducing “additional uncertainty regarding the U.S. tariff regime,” discussed in full below. A third disclosed risk is integration risk on the SRS and GMS deals themselves, which management’s own language frames plainly: if integration “is not fully successful or is delayed for a material period of time, we may not achieve the anticipated synergies, cost savings, enhanced capabilities, or other benefits of the acquisition.” On ownership, institutional holders are concentrated in index giants Vanguard (10.0 percent of shares) and BlackRock (7.1 percent), while combined insider ownership among directors and executives is a de minimis 0.08 percent, minimal but typical for a mega-cap of Home Depot’s size and neither a red flag nor a bullish signal on its own; no notable insider buying or selling was identified in recent filings.
What the market is paying
Home Depot closed at $352.68 on June 30, 2026, up 0.53 percent on the day, for a market capitalization of roughly $351.7 billion and an enterprise value that vendors put anywhere from $407 billion to $425 billion depending on how net debt is treated. Shares outstanding are roughly 997.1 million. The 52-week range is $289.10 to $426.75, the high printed September 17, 2025, and at $352.68 the stock sits roughly in the middle of that range, about 17 percent below its high.
Returns depend heavily on whether dividends are included. On a total-return basis (Yahoo Finance), Home Depot is up 1.25 percent over the trailing year and 22.50 percent cumulatively over three years, 25.25 percent over five, badly trailing the S&P 500’s total return of 20.86 percent over one year and 68.51 percent over three. On a price-only basis (Barchart), the stock is actually down 3.81 percent over the trailing year but up sharply, 8.70 percent, over the last week and 11.21 percent over the last month, reflecting a real recent rally off the lows. Either way the conclusion is the same: Home Depot has been roughly flat to modestly positive over the last year and has meaningfully lagged the broader market, a sharp comedown from the stock’s pre-2022 growth-multiple years. Against Lowe’s specifically, Home Depot has actually held up better lately on a price basis, up 2.49 percent year to date versus Lowe’s down 8.57 percent, and up 16.47 percent over three years versus Lowe’s down 0.65 percent, though Lowe’s edges ahead over five years.
Volatility estimates disagree across vendors, with beta reads ranging from 0.94 to as high as 1.20 depending on the lookback window, so treat Home Depot as roughly market-beta rather than clearly defensive. The reliable drawdown figure is a decline of about 17.4 percent from the September 2025 high to the June 30 close, a real but not dramatic pullback for a stock whose fundamentals are this closely tied to the rate cycle.
Valuation is where the real tension sits. Home Depot trades at 25.05 times trailing earnings and, on a single-vendor read that could not be independently cross-checked, roughly 23.09 times forward earnings, with a PEG ratio (price-to-earnings relative to expected growth) of 4.29. Against its own history, that trailing multiple is below its fiscal 2025 and fiscal 2026 peaks in the high 20s but well above its fiscal 2023 low of 18.97, roughly in the middle of the “20-to-25 times” range the stock has typically commanded. Against Lowe’s, though, Home Depot trades at a genuine premium across every multiple that matters, about 34 percent richer on trailing price-to-earnings (25.05 versus 18.64), about 26 percent richer on enterprise value to EBITDA, and roughly 51 percent richer on price to sales. The gap is starkest on the PEG ratio, where a growth-adjusted multiple works something like paying for oranges by the pound rather than by the crate: Home Depot’s 4.29 is more than double Lowe’s 1.88, meaning the market is charging more than twice as much per unit of expected growth for a business posting essentially the same 0.3-to-0.6-percent comparable-sales growth as its cheaper rival. Whether that premium is earned is a judgment call the data cannot settle on its own, Home Depot is larger and has deeper Pro-customer penetration, the conventional argument for paying up, but a PEG above 4 on low-single-digit growth leaves very little room for a disappointment or a housing-cycle relapse.
Home Depot pays a 2.64 percent dividend yield and trades at a free-cash-flow yield of roughly 4.2 percent. Trading is highly liquid, roughly $1.85 billion of average daily notional, and short interest, the share of outstanding stock that traders have borrowed and sold on a bet the price falls, is low, about 1.36 percent of shares outstanding as of mid-June 2026, though it has risen modestly, roughly 9 to 12 percent month over month, worth watching but not itself a bearish signal at this level. Sell-side consensus rates the stock “Buy,” with mean price targets clustering somewhere between $370 and $415 depending on the vendor, against the $352.68 close, implying roughly single-digit-to-low-teens percentage upside; the high-low spread among analysts runs from $310 to $430, a more than 35 percent gap that says the Street itself is not tightly clustered on where this goes from here. The stock currently sits above its 50-day moving average of $323.02 but just below its 200-day average of $356.10, which is acting as a near-term ceiling after a sharp one-month rally.
What the crowd is saying
The dominant news narrative through the second quarter of 2026 cooled from “coiled spring for a housing recovery” to something closer to “execution risk on margin recovery and the timing of the Pro payoff.” Q1 FY2026 earnings on May 19 reported comparable sales of 0.6 percent, below the roughly 0.8 percent consensus expected, the third consecutive quarter under 0.5 percent comps, alongside a roughly 75-basis-point year-over-year drop in gross margin driven almost entirely by the GMS acquisition’s mix effect. Management’s own tone reflected the shift: the CFO said the company anticipates margin pressures “will persist, as we have not yet seen a catalyst for an inflection in housing activity.” Analyst sentiment moved with it. Wolfe Research downgraded the stock from Outperform to Peer Perform on June 23, 2026, citing earnings-visibility concerns around the Pro business; Stifel maintained a Hold rating but cut its price target from $375 to $320; and other shops trimmed targets 5 to 10 percent through May.
Retail and social sentiment tells a different story, and the divergence between the two is itself the useful signal here. Retail chatter, judged by StockTwits message volume, was described as “extremely bullish” in late May, though the underlying tone reads as a patient, dividend-and-quality holding view rather than an aggressive trading stance. One visible trader quote captures the mood: “the downside and sluggishness is already priced in the stock now.” There is no evidence of coordinated promotion or thin-float hype here; this reads as ordinary retail ownership of a large, well-covered, dividend-paying Dow component, not a pump. Home Depot does not rank as a trending name on social-attention platforms, consistent with its profile as a mature blue chip rather than a momentum story. Employee sentiment on Glassdoor sits at a stable 3.7 out of 5 stars across nearly 56,000 reviews, with 69 percent saying they would recommend the company to a friend, though compensation ratings have softened slightly amid recurring complaints about scheduling and return-to-office demands.
The crux of the divergence: retail investors are betting the Pro-distribution buildout pays off faster than Wall Street currently expects, treating Home Depot as a patient, quality, dividend-growing hold at a now-more-reasonable entry point. Wall Street’s more recent recalibration says the earnings visibility on that same bet is actually impaired through 2027, that margin recovery is delayed, and that the near-term catalyst simply is not visible yet. Both camps are looking at the identical set of facts, three years of near-zero comps, structural margin dilution, a paused buyback, and drawing different conclusions about how patient an investor should be. Nothing here suggests manipulation or a hygiene problem; the analyst downgrade wave is genuine, data-driven, and dated to specific filings and events, not coordinated bearish promotion.
Is this compounder actually broken, or just paused?
The honest answer is neither, cleanly, and the two halves of the business need to be pulled apart to see why. Home Depot’s demand has a structural floor and a cyclical ceiling, and conflating them is the single most common mistake in reading this company.
The structural floor is repair-and-maintenance spend, roofs that leak, water heaters that fail, electrical panels that need replacing, driven by a slow-moving fact: the median age of an owner-occupied US home reached 42 years in 2024, up from 31 years in 2005, and only about 4 percent of the current housing stock was built in the last four years. An aging, undersupplied housing stock throws off repair demand almost regardless of the rate cycle, a furnace does not wait for the Federal Reserve, and this is precisely the layer Home Depot has been deliberately shifting toward through the SRS and GMS acquisitions, both of which sell largely into replacement-driven trade demand rather than discretionary remodel.
The cyclical ceiling is discretionary, big-ticket remodel spend, kitchen and bath overhauls, additions, the projects funded by home-sale-triggered decisions, home-equity extraction, and consumer confidence, and this is the layer currently under real pressure. US homeowners are sitting on roughly $34.9 trillion in aggregate home equity, of which about $11 trillion is considered “tappable” while preserving a healthy equity cushion, a genuine, real balance-sheet tailwind that does not depend on new borrowing to exist. But tapping that equity for a discretionary project requires confidence, and confidence is exactly what a frozen housing market and elevated rates erode. Comparable sales have gone from negative 3.2 percent in fiscal 2023 to negative 1.8 percent in fiscal 2024 to positive 0.3 percent in fiscal 2025, a trough followed by stabilization, not yet a recovery, and management’s own flat-to-2-percent fiscal 2026 guidance implies more bottoming rather than a spring-back.
The steel-manned bear case, and it deserves to be taken seriously rather than waved off, runs like this. The housing unlock the entire bull thesis depends on is now forecast by the people who study mortgage markets for a living to arrive later than the stock’s multiple assumes, or possibly not within the window at all. The Mortgage Bankers Association and Fannie Mae both project 30-year mortgage rates averaging around 6.5 percent through 2026, 2027, and into 2028, and Wolfe Research’s own June 2026 downgrade dated any real unlock to “mid-2027 at the earliest.” Home Depot itself has not compounded earnings per share in three years, and both of the levers that used to do that work, margin and the buyback, are switched off simultaneously: operating margin has fallen for three straight years on a structural mix shift that is not going to reverse simply because the housing cycle turns, and the buyback will not resume until debt from SRS and GMS comes down to a 2.0 times leverage target the company itself has only targeted for the end of calendar 2026. The valuation premium over Lowe’s, a company running the identical Pro-distribution acquisition playbook and currently posting four straight quarters of positive comparable sales, looks difficult to defend on the growth actually being delivered. And the tariff picture, discussed in detail below, is not the relief it was briefly reported to be; the specific legal mechanism that was struck down has already been substantially replaced by other tariff authority that survived the court ruling.
Against that, the structural bull case rests on genuinely new facts rather than hope: the oldest housing stock on record, a record and largely untapped pool of home equity sitting with exactly the demographic that drives discretionary remodel, a deliberate shift of Home Depot’s own revenue mix toward the more resilient repair-and-replacement Pro business, and a “lock-in effect” that is a known, bounded problem with a known mechanism for resolving itself, whether through rate cuts or simply the passage of time as people are eventually forced to move regardless of the rate they would give up. The most probable outcome, on the evidence assembled here, is a genuinely uneven middle: repair and Pro/trade demand keeps grinding modestly positive, as it already has, while true discretionary big-ticket remodel stays muted until mortgage rates move convincingly below roughly 6 percent, unlocking pent-up demand in stages rather than all at once. Both the bull and the bear are correctly describing different halves of the same business at the same time. The swing factor for which half dominates over the next one to two years is simply the path of mortgage rates and the labor market, not anything specific to Home Depot’s own execution.
The scenarios in detail
Four variables decide Home Depot’s five-year outcome, and the first is the master switch that moves the other three.
-
The housing and rate cycle, the master variable. Existing-home sales ran roughly 4.17 million units a year in May 2026, against a 5.0-to-5.5-million 2010s norm, frozen by the mortgage lock-in described above. The 30-year rate averaged 6.49 percent the week of June 25, 2026. The Mortgage Bankers Association and Fannie Mae both see roughly 6.5 percent holding through 2028; Wolfe Research dates any unlock to mid-2027 at the earliest.
-
The comparable-sales trajectory, organic and excluding acquisitions. Comps have printed near zero for three straight years, with fiscal 2026 guided flat to up 2 percent. Home Depot’s own conditional “market-recovery” scenario, laid out at its December 2025 investor conference, envisions 4-to-5-percent comps and mid-to-high-single-digit earnings growth, but only “once housing normalizes,” with no date attached. That is a conditional scenario management itself describes, not a forecast for any given year, and should be read that way.
-
The operating-margin trajectory, structural mix versus cyclical recovery. Margin fell from 14.2 to 13.5 to 12.7 percent over the last three years and is guided to roughly 12.4 to 12.6 percent for fiscal 2026. As shown above, the SRS/GMS “Other” segment running at 2.5-to-3.3-percent operating margin against a core retail margin near 13.5-to-14 percent explains essentially the entire decline. The five-year question is whether that blended margin stabilizes as the mix shift slows and integration matures, or keeps grinding lower as the Pro-distribution business keeps growing faster than the core.
-
Capital return and the EPS engine. The buyback is dormant, not permanently dead, but its return is tied to a 2.0 times debt-to-EBITDAR leverage target the company has set for roughly the end of calendar 2026, EBITDAR being earnings before interest, taxes, depreciation, amortization, and rent, the measure lenders use to judge how much debt a retailer’s ongoing cash generation can safely carry. Layered on top is the tariff picture: roughly half of Home Depot’s goods are imported, and the tariff regime remains genuinely unsettled following a February 2026 Supreme Court ruling, discussed below.
Bull: the coiled spring uncoils
Mortgage rates fall convincingly below roughly 6 percent by 2027 to 2028, breaking the lock-in and thawing existing-home turnover back toward 5 million-plus units a year. Comparable sales inflect from around 1 percent toward the 4-to-5-percent market-recovery range Home Depot itself has described as its upside scenario. Blended operating margin stabilizes and recovers toward roughly 13 percent as SRS/GMS integration matures and the core retail business re-accelerates. Home Depot delevers to its 2.0 times target on schedule, resumes a sizeable buyback starting around 2027, and the multiple re-rates to roughly 24 to 25 times on restored earnings growth. Diluted earnings per share, roughly $14.8 in fiscal 2026, climbs to roughly $23 by fiscal 2030, close to a 10 percent compound annual growth rate. Illustrative valuation: roughly $23 of fiscal 2030 earnings per share at a 24-to-25 multiple works out to around $560, which would retest and exceed the current $426.75 all-time high. This is an estimate, not a target. What has to be true: the Federal Reserve cuts enough to move the 30-year mortgage rate below roughly 6 percent, and turnover actually responds. What most likely breaks it: rates simply staying near 6.5 percent through 2028, as the MBA and Fannie Mae currently forecast, so the unlock never arrives inside the window.
Base: a slow, uneven thaw (the most probable path)
Mortgage rates ease gradually toward roughly 5.5 to 6 percent by 2028, and turnover thaws in stages rather than all at once. Comparable sales grind from around 1 percent toward roughly 3 percent by year three to five, an improvement, but short of the full market-recovery scenario. Consolidated operating margin bottoms around 12.4 to 12.6 percent in fiscal 2026 and stabilizes in the low 13s as the SRS/GMS drag annualizes out and the core holds near 13.5 to 14 percent. Home Depot delevers to its 2.0 times target by roughly the end of 2026 and resumes a moderate buyback in 2027. Diluted earnings per share, roughly $14.6 in fiscal 2026, rises to roughly $20 by fiscal 2030, about a 7 percent compound annual growth rate. Illustrative valuation: roughly $20 of fiscal 2030 earnings per share at a 21.5 multiple works out to around $430. This is an estimate, not a target. Total return in this scenario is largely the 2.64 percent dividend plus modest mid-single-digit price appreciation, respectable but not thrilling. What has to be true: rates drift lower without a recession, the buyback resumes on schedule, and the SRS/GMS drag stops widening. What most likely breaks it: a labor-market shock that hits big-ticket and Pro demand simultaneously, or a fresh round of tariffs that reopens the margin drag.
Bear: the skeptic’s case, taken seriously
Higher-for-longer is confirmed, the 30-year rate sticks near 6.5 percent through 2027 and 2028, the mortgage lock-in never breaks, and turnover stays frozen. Home Depot posts a fourth and fifth straight near-zero comparable-sales year. The SRS/GMS mix holds consolidated operating margin in the low 12s, integration costs run hot, and the $22.3 billion of goodwill on the balance sheet becomes a live impairment question if the Pro-distribution bet underperforms. Delevering more than $50 billion of debt in a no-growth comp environment takes longer than planned, so the buyback stays paused deep into 2027, and earnings per share stays roughly flat to down for a fourth and fifth consecutive year. A fresh round of Section 232 or Section 301 tariffs lands on imported hardgoods, and the tariff-refund offset Home Depot has told investors could provide “a significant” benefit stays stuck, unresolved, in ongoing litigation. The roughly 34 percent premium to a cheaper Lowe’s, running the identical Pro-distribution playbook with four straight quarters of positive comparable sales, compresses toward parity as the market tires of paying more than four times growth-adjusted earnings for an unlock that never arrives. Diluted earnings per share stays roughly flat, around $15 to $16 by fiscal 2030, close to a 2 percent compound annual growth rate, and the multiple de-rates from 25 times toward roughly 18 times. Illustrative valuation: roughly $16 of fiscal 2030 earnings per share at 18 times works out to around $285, near the current 52-week low of $289.10. This is an estimate, not a target, and it describes stagnation, not a collapse; the dividend and franchise quality put a real floor under the stock even in this scenario. What has to be true, and it is essentially the consensus rate forecast: rates do exactly what the MBA and Fannie Mae currently project. What most likely breaks the bear case: a faster, deeper Fed cutting cycle that pulls mortgage rates below 6 percent ahead of schedule.
Catalysts and what to watch
Near term: the August 18, 2026 second-quarter print, the clearest near-term read on whether comparable sales and margin guidance hold; Federal Reserve meetings and the 30-year mortgage rate through the second half of 2026, the master dial the whole stock trades on; progress toward the end-2026 debt-to-EBITDAR target that is the precondition for any buyback resumption; and any successor tariff action, discussed below.
Multi-year: the mid-2027-plus window Wolfe Research has identified as the earliest plausible housing unlock; a possible 2027 buyback resumption once deleveraging completes; the 2026-to-2028 window over which SRS/GMS integration matures and its margin drag either annualizes out or persists; and the aging housing stock’s roughly $20 billion cited pent-up remodel backlog releasing gradually as confidence improves.
Leading indicators for a long-term holder to track: the National Association of Realtors’ existing-home sales pace, where a sustained move above roughly 4.5 to 5.0 million units is the cleanest signal the turnover freeze is thawing; the 30-year mortgage rate and, specifically, the shrinking gap between it and the average outstanding mortgage rate; Home Depot’s own real, organic comparable sales and big-ticket transactions above $1,000; the consolidated operating margin, watching for the slide to actually stop rather than merely decelerate; and Home Depot’s leverage ratio and any signal on buyback resumption.
Companies to watch (bull / base / bear)
Home Depot (HD) - the name itself. Bull: comparable sales inflect durably above 2 percent and the buyback resumes, re-arming the historical EPS engine. Base: a slow, uneven thaw, margin stabilizes, buyback resumes on a delayed schedule around 2027. Bear: a fourth straight near-zero comp year, the premium over Lowe’s compresses toward parity, and a goodwill impairment question lands on top of it. Watch: the 30-year mortgage rate, existing-home sales, and the leverage ratio.
Lowe’s (LOW) - the closest comp and the cheapest way to make the same bet. Bull: four straight quarters of positive comps continue and the Pro push closes the scale gap with Home Depot. Base: organic growth stays similarly muted to Home Depot’s, but the cheaper multiple provides more room for error. Bear: the acquisition-driven growth proves hollow once Artisan Design Group and Foundation Building Materials lap their first anniversaries and organic comps alone are all that is left. Watch: Lowe’s own comparable-sales trend and its 2027 buyback-resumption timeline.
Ferguson (FERG) - a read on Pro-market health from the distribution side. Bull: margin expansion persists even through a soft residential backdrop. Base: low-single-digit growth, stable margins, a slow bump along the bottom of the cycle. Bear: the weak residential market the company itself flags actually deepens. Watch: quarterly operating-margin trend and residential-versus-commercial mix commentary.
Builders FirstSource (BLDR) - the purest, most leveraged read on new-home construction. Bull: new-construction volumes turn and the prefabricated-components cost advantage shows through. Base: revenue stays roughly flat to down while the company works through the current downturn. Bear: the net loss widens as new-home starts stay depressed. Watch: single-family housing starts and Builders FirstSource’s own gross-margin guidance.
QXO (QXO) - a bet on the operator, not the current numbers. Bull: the TopBuild acquisition closes and integration proves as disciplined as Brad Jacobs’ prior roll-ups. Base: revenue scales through further acquisitions while profitability lags for another year or two. Bear: integration missteps or a soft market push adjusted EBITDA negative and strain the balance sheet from three large deals in eighteen months. Watch: adjusted EBITDA margin trend and the TopBuild close timeline.
Floor & Decor (FND) - the most discretionary-remodel-exposed name in the set. Bull: comparable sales turn positive as discretionary big-ticket remodel spending returns. Base: comps stay negative but stabilize as the buyback and new-store growth support the stock. Bear: comparable sales and transactions keep deteriorating as flooring remains the most deferrable big-ticket category. Watch: comparable transaction counts, the cleanest read on real demand versus price-driven ticket growth.
Tractor Supply (TSCO) - the diversification play. Bull: the rural, exurban customer base keeps compounding steadily regardless of the urban/suburban housing cycle. Base: modest low-single-digit comps continue, a slower but steadier compounder than the home-improvement majors. Bear: rural household spending softens in line with the broader consumer, showing this name was never fully insulated. Watch: comparable-sales trend and membership growth in the company’s loyalty program.
Risk controls
The single biggest risk to this thesis is concentration in one macro variable: the path of the 30-year mortgage rate and existing-home turnover. Nearly every scenario above, bull, base, and bear, is ultimately a function of that one number, which Home Depot cannot control and cannot meaningfully hedge. A reader building a position around this name should size it understanding that a genuine surprise in either direction on rates will likely move the stock more than any company-specific news.
The second risk is balance-sheet and integration risk from the SRS and GMS acquisitions. Total debt of roughly $55.8 billion and goodwill of $22.3 billion mean a material integration misstep or a Pro-distribution demand downturn (new-construction-linked categories like roofing already showed negative comps in the first quarter of fiscal 2026) could force an impairment charge, a real headline risk to the “quality compounder” narrative even without touching the core retail business.
The third is tariff and trade-policy risk. Roughly half of Home Depot’s goods are imported, and the February 2026 Supreme Court ruling striking down certain tariffs did not resolve the underlying trade-policy uncertainty; other tariff authority survived that ruling and remains in place, discussed in detail in the methodology section below.
The fourth is valuation risk after the recent rally. The stock has already run roughly 11 percent over the last month and 9 percent over the last three months, and at a roughly 34 percent premium to Lowe’s and a PEG above 4, there is very little room in the current multiple for a growth disappointment or a housing-cycle relapse.
What would change the thesis for the better: a durable move in organic comparable sales above 2 to 3 percent, an earlier-than-expected buyback resumption signaling deleveraging is ahead of schedule, or consolidated operating margin visibly stabilizing rather than continuing to slide. What would change it for the worse: a fourth straight near-zero comparable-sales year, a goodwill impairment, or a fresh round of tariffs landing on imported hardgoods while the refund relief management has cited as a possible offset remains stuck in litigation.
Liquidity and access are not a concern here; Home Depot is one of the most liquid large-cap stocks in the market, trading roughly $1.85 billion of notional a day, with low, only modestly rising short interest.
Methodology, sourcing, and data-quality flags
This analysis draws on Home Depot’s fiscal 2025 Form 10-K (period ended February 1, 2026, filed March 18, 2026), the companion fourth-quarter earnings release, the first-quarter fiscal 2026 Form 10-Q and 8-K, the 2026 proxy statement, market-data vendors as of June 30 to July 1, 2026, and independent research into the mortgage-rate and existing-home-sales backdrop from the Mortgage Bankers Association, Fannie Mae, Freddie Mac, and the National Association of Realtors. Every load-bearing figure in this piece traces to a claim in the underlying research ledger, verified against a primary filing or corroborated across at least two independent vendors, or explicitly hedged where sources disagreed.
A handful of specific data-quality notes matter for how to read this piece. Buybacks: the correct figures, reconciled directly against the 10-K’s cash-flow statement, are $0 repurchased in fiscal 2025, $649 million in fiscal 2024, and $7.951 billion in fiscal 2023, the program’s last active year; treat the buyback as dormant, paused since March 2024 specifically to delever after the SRS and GMS acquisitions, targeting 2.0 times debt-to-EBITDAR by roughly the end of calendar 2026, with no resumption planned in fiscal 2026. Earnings per share declined for three consecutive fiscal years, from $15.11 to $14.91 to $14.23; this piece has deliberately avoided any framing that implies growth where the filed numbers show decline. The dividend is $2.33 per share paid quarterly, or $9.32 annualized, a 2.64 percent yield; the company describes it as its 156th consecutive quarterly dividend and roughly a 16-year increase streak, though the exact streak count could not be independently confirmed against the specific filings reviewed and should be treated as standard market commentary rather than a filed figure. Margin: the operating-margin decline from 14.2 to 12.7 percent over three years is a structural mix effect from consolidating the lower-margin SRS/GMS Pro-distribution business, not a sign of core retail deterioration; the Primary segment’s own margin fell only modestly, from 14.2 to 13.5 percent, over the same window. Tariffs: the February 20, 2026 Supreme Court ruling in Learning Resources, Inc. v. Trump struck down tariffs imposed under the International Emergency Economic Powers Act, but Section 122, 232, and 301 tariff authority survived that ruling and remains in place; the ruling did not resolve refund mechanics for tariffs already collected, which remain contingent and unresolved in ongoing Court of International Trade litigation. This is not tariff relief for Home Depot, and this piece frames it as an unresolved legal development, not a tailwind. Home equity: the roughly $34.9 trillion figure is aggregate US homeowner equity per Federal Reserve Flow-of-Funds data, a broader measure than the roughly $11 trillion “tappable” figure from ICE Mortgage Monitor; the two should not be read as the same number measured two ways. The “market-recovery” scenario management described at its December 2025 investor conference, comparable sales of 4 to 5 percent and mid-to-high-single-digit earnings growth, is a conditional scenario tied to housing normalizing with no date attached, not fiscal 2026 guidance and not a forecast; the actual fiscal 2026 guidance is flat-to-2-percent comps and flat-to-4-percent earnings growth. Analyst price targets and enterprise value are reported here as ranges, roughly $370 to $415 for the mean target and roughly $407 to $425 billion for enterprise value, because different data vendors produce materially different point figures depending on methodology; treat any single-number citation elsewhere as one vendor’s read, not a consensus fact. Price and market cap are stamped to the June 30, 2026 close and will have moved by the time this is read; the live figure at the top of this article reflects the current quote.
On the five-factor read behind the Hold rating: valuation nets negative. Home Depot trades at roughly 23 times forward and 25 times trailing earnings, a roughly 34 percent premium to Lowe’s and a PEG more than double Lowe’s, for growth that is currently near zero and earnings that have declined for three years; this is the single most stretched figure in the set. Growth also nets negative in the near term: three straight years of near-zero comparable sales, guided to remain flat-to-2-percent in fiscal 2026, even though the longer-run addressable market and Pro-distribution buildout are genuine. Quality nets clearly positive: this is where Home Depot earns its reputation, a number-one market position, still-strong 25.7 percent return on invested capital, a rock-stable 33.3 percent gross margin, roughly $16.3 billion of annual operating cash flow, and a durable, long-running dividend, tempered only by elevated debt above the company’s own leverage target and a large, impairment-exposed goodwill balance. Risk nets negative: elevated leverage with the buyback dormant, single-variable dependence on the housing and rate cycle, roughly half of goods imported into an unsettled tariff regime, and structural margin dilution, offset somewhat by the dividend floor and low short interest. Momentum is roughly neutral: the stock has badly lagged the broader market over one and three years yet rallied meaningfully over the last month and three months, sits above its 50-day but below its 200-day moving average, and carries a consensus Buy rating with only modest implied upside to the sell-side mean target. Taken together, the evidence supports a labeled research signal of Hold with a downward tilt: a genuinely high-quality business, priced today for more growth and more certainty than the filings currently show.
Key sources: The Home Depot, Inc. Form 10-K for fiscal year ended February 1, 2026 (SEC EDGAR); Home Depot Form 10-Q for the quarter ended May 3, 2026; Home Depot fourth-quarter fiscal 2025 and first-quarter fiscal 2026 earnings releases (8-K); Home Depot 2026 DEF 14A proxy statement; Lowe’s Companies quarterly earnings releases and investor materials; Mortgage Bankers Association and Fannie Mae mortgage-rate forecasts; Freddie Mac Primary Mortgage Market Survey; National Association of Realtors existing-home sales data; National Association of Home Builders housing-stock-age analysis; ICE Mortgage Monitor; Federal Reserve Flow-of-Funds data; SCOTUSblog and law-firm client alerts on Learning Resources, Inc. v. Trump; and market-data vendors stockanalysis.com, MarketBeat, Yahoo Finance, Barchart, and WallStreetZen, all as of June 30 to July 1, 2026.
Prepared June 30, 2026. Figures are point-in-time and will change. This is research and analysis for educational purposes, not investment advice, not a recommendation, and not a solicitation. Home Depot’s fundamentals are unusually tied to the path of mortgage rates and existing-home turnover, and roughly half its merchandise is imported into an unsettled tariff regime. Verify all figures independently and consult a licensed financial advisor before making any decision.