
Research date: June 22, 2026 | OSINT company research on Alphabet Inc. (Nasdaq: GOOGL / GOOG), its advertising and cloud businesses, the AI build-out funding it, the antitrust overhang, and its US-listed mega-cap peers. Live prices, stamped hard.
Important disclaimer. This is independent OSINT (open-source intelligence) research compiled for educational and informational purposes only. It is not investment advice, not a recommendation or solicitation to buy, sell, or hold any security, and not a statement that any security is suitable for you. The author is not a financial advisor and has no fiduciary relationship with any reader. The rules-based rating below is a research signal, not a directive. All figures are point-in-time (intraday on June 22, 2026 unless otherwise stamped) and move fast - prices, market caps, multiples, and legal status may be stale by the time you read this. Any bull / base / bear scenarios and the five-year illustrative valuations are analytical framings and arithmetic on stated assumptions, not price targets, predictions, or guarantees. Do your own due diligence and consult a licensed professional before making any financial decision.
Companion tool - jump to the interactive dashboard to sort and filter every company in this piece and explore the value-chain map and the peer table.
TL;DR
Alphabet is two businesses bolted to one balance sheet. The first is Google Services - Search, YouTube, the ad network, and subscriptions - a near-monopoly advertising auction that runs at roughly a 45 percent segment operating margin and threw off about $139 billion of operating income in 2025. The second is Google Cloud, which grew 63 percent year over year in Q1 2026 to a roughly 33 percent margin with a backlog above $460 billion. Services is funding the largest capital-spending program in corporate history: 2026 capex is guided to $180 to $190 billion, roughly 3.5 times what Alphabet spent two years earlier, to build AI compute. That spend is the whole story. It cut Q1 2026 free cash flow to just $10.1 billion against $45.8 billion of operating cash flow. Free cash flow is the cash left after the data centers are built (operating cash flow minus capital spending), which is why a heavy capex year collapses free cash flow while operating cash flow stays high. The spend also pushed Alphabet to raise $84.75 billion of equity (with a $10 billion Berkshire Hathaway anchor) plus more than $85 billion of debt, and stopped its buyback cold. As of June 22, 2026 the stock trades near $350.86 (it last closed at $368.03 on June 18), a market cap around $4.28 trillion, up about 113 percent over the trailing year. It looks cheap on forward earnings (~29x) and expensive on free cash flow (~70x), and that gap is the entire argument. The bull case: the AI capex converts to cash faster than it eats free cash flow, Cloud compounds into a second profit engine, and Google monetizes AI answers on its own surfaces. The bear case: free cash flow falls about 72 percent in 2026 and possibly toward zero in 2027, AI answer-engines erode the paid search click, and the live antitrust appeals reach the data and distribution moat. The single number that decides it is revenue-per-query on AI surfaces, and no clean figure for it exists yet. Every figure below carries a date stamp and moves fast. Verify live quotes before acting.
All prices, market caps, and valuation multiples below are point-in-time, read intraday on June 22, 2026 unless a different date is stamped. These figures move fast and may be materially stale by the time you read this. Verify live quotes before acting.
Explore it yourself: the interactive dashboard
Open the dashboard in a full screen
The dashboard holds the eleven companies in this piece - Alphabet plus its competitors, AI-compute suppliers, and Waymo - sortable by market cap and by how each one touches the same AI cycle, with a role chip (subject, competitor, partner-threat, supplier, optionality) on every name. Use it to check any single company as you read.
Prefer a spreadsheet? Download the Excel valuation model. The blue cells let you flex revenue growth, 2030 margin, exit multiple, and share count and watch the five-year math recompute, so you can build your own bull, base, and bear instead of taking ours.
The two-engine machine, in one picture
Most companies are one thing. Alphabet in 2026 is two things stapled together, and they pull in opposite directions on cash.
Picture a hydroelectric dam. On one side is a reservoir that fills itself: water arrives whether or not anyone does anything, and turbines at the base spin it into power almost for free. That is Google Search. Advertisers pour money in because people keep searching, and the auction turns that flow into profit at a margin most businesses never see. On the other side, the operator is in the middle of the biggest construction project the valley has ever seen - new turbines, new transmission lines, a second powerhouse - all paid for out of the river’s own output. That is the AI build-out: data centers, custom chips, and the power to run them. The question that decides everything is simple to state and hard to answer. Does the new construction generate enough extra power to justify draining the reservoir to pay for it, or does the operator end up cash-poor with half-built turbines while the river level drops?
That is the Alphabet bet in one sentence. A cash machine is funding a megaproject, and the open question is whether the megaproject pays back before the cash machine is asked to do something it cannot. Everything that follows - the segments, the chips, the antitrust cases, the valuation - is a way of pressure-testing that one question.
How the money flows
flowchart TD
    ADV["Advertisers<br/>fund ~75% of revenue"]
    CLOUD["Cloud customers + AI labs<br/>GCP/Vertex/TPU rental"]
    SUBS["Subscribers + device buyers<br/>YouTube, One, Pixel"]

    GOOGL["ALPHABET (GOOGL)<br/>Q1'26 rev $109.9B, op margin 36.1%<br/>OCF $45.8B"]

    APPLE["Apple / distribution<br/>TAC $15.2B per qtr"]
    OPEX["Content + opex<br/>(YouTube, R&D, depreciation)"]

    CAPEX["Capex FY26 guide $180-190B<br/>Q1'26 FCF only $10.1B"]
    CAPMKT["External capital<br/>$84.75B equity (Berkshire $10B)<br/>LT debt $46.5B to $77.5B"]
    RETURNS["Shareholder returns<br/>div +5% to $0.22; buybacks paused"]
    OBETS["Other Bets / Waymo<br/>op loss $(2.1)B"]

    BRCM["Broadcom (+MediaTek/Marvell)<br/>TPU co-design thru 2031"]
    TSMC["TSMC<br/>fab N3P now, 2nm next"]
    HBM["Samsung + SK Hynix<br/>HBM, sold out to ~2028"]
    NVDA["Nvidia<br/>GPUs, ~81% AI-chip share"]
    DC["Data centers<br/>$75.6B uncommenced leases"]
    POWER["Power: Kairos SMR 500MW<br/>+ geothermal PPAs"]

    ADV --> GOOGL
    CLOUD --> GOOGL
    SUBS --> GOOGL
    GOOGL -->|pays| APPLE
    GOOGL -->|pays| OPEX
    GOOGL --> CAPEX
    CAPMKT -->|funds gap| CAPEX
    GOOGL --> RETURNS
    GOOGL --> OBETS

    CAPEX --> BRCM
    CAPEX --> NVDA
    CAPEX --> DC
    BRCM --> TSMC
    TSMC --> HBM
    DC --> POWER

    CLOUD -. Anthropic 1M TPUs >1GW; GOOGL also invests .-> GOOGL
Read this from the top down and the shape is the investing point. The money starts with three sets of customers. Advertisers are the largest by far, funding around three-quarters of revenue across Search, YouTube, and the third-party Network. Cloud customers - enterprises and, increasingly, AI labs renting compute - are the second source, and consumers buying subscriptions and Pixel devices are the third. In Q1 2026, total revenue was $109.9 billion, up about 22 percent year over year, with Google Services contributing $89.6 billion and Google Cloud $20.0 billion. Other Bets, the home of Waymo, is a rounding error on revenue ($411 million) and a cash sink (a $2.1 billion operating loss).
Before Alphabet keeps an ad dollar, it pays the first toll: traffic acquisition cost, or TAC, the money it sends to partners who deliver the user. The most famous of these is the roughly $20 billion a year it has historically paid Apple to be the default search engine in Safari. That Apple payment is only one slice. TAC was $15.2 billion in Q1 2026 alone, on the order of $61 billion a year, and that figure is total traffic-acquisition cost across every distribution partner (Apple, the carriers, the browsers, the third-party Network sites), not the Apple deal by itself. So the $15.2 billion-a-quarter line and the $20 billion-a-year Apple figure are not in conflict: Apple is roughly a third of the total. TAC runs about 20 percent of gross ad revenue, and it is the chain’s most legally exposed leg, because the DOJ antitrust remedy is aimed directly at the exclusivity of those default deals. After TAC, content costs for YouTube, and data-center depreciation, the auction still converted to a 36.1 percent operating margin and $45.8 billion of operating cash flow in the quarter.
Then comes the 2026 story: where the cash goes. Capital expenditure consumed $35.7 billion in the quarter, leaving free cash flow of just $10.1 billion. Because internal cash no longer covers the build, Alphabet is funding the gap from outside - long-term debt jumped from $46.5 billion to $77.5 billion in a single quarter, and in June it priced an $84.75 billion equity raise anchored by Berkshire Hathaway. The build money then flows down a concentrated hardware stack: Alphabet designs its own AI chips (TPUs) with Broadcom, has them fabricated by TSMC, stacks them with high-bandwidth memory from Samsung and SK Hynix, also buys Nvidia GPUs to resell as cloud capacity, assembles it into data centers, and feeds those data centers with electricity contracted years ahead. At several of those nodes Alphabet is a price-taker into a market that is sold out. And the flywheel closes a loop worth noticing: some of the cloud revenue at the top is paid by AI labs renting the very chips this capex builds. The Anthropic deal alone is up to one million TPUs and more than a gigawatt of capacity, and Alphabet is also an Anthropic investor, so dollars cycle from its balance sheet into Anthropic and back as cloud revenue.
The summary: Alphabet keeps the economics at the top of the chain (advertising), where it is a near-unavoidable toll-taker - which is exactly why it is a defendant in two US antitrust cases. It pays the economics at the bottom of the chain, where the chokepoints are TSMC fabrication, Korean memory, and, newly, electricity.
The business, segment by segment
Alphabet reports three segments: Google Services, Google Cloud, and Other Bets. The first earns almost all the profit, the second is the growth story, and the third is a lottery ticket. Here is what each one is and how it makes money, with the jargon unpacked as we go.
Google Services is the cash engine. In FY2025 it generated $342,721 million of revenue and $139,404 million of segment operating income - a 40.7 percent margin at the full-year level, and closer to 45 percent in Q1 2026. Inside it:
- Google Search and other is the core. It earned $224,532 million in FY2025 and grew 19 percent year over year in Q1 2026 to $60.4 billion. This is the auction where advertisers bid to appear against what you type. It is the highest-margin, widest-moat business Alphabet owns.
- YouTube ads earned $40,367 million in FY2025 and grew 11 percent in Q1 2026 to $9.88 billion. The growth vector here is the living room: YouTube is now the number-one distributor of US TV viewing per Nielsen at about 12.5 percent of total TV time, up from 10.8 percent a year earlier, with roughly 171 million people watching on a TV screen each month.
- Google Network is the odd one out. It is the business of placing Google’s ads on other people’s websites, and it is shrinking - it earned $29,792 million in FY2025 and fell 4 percent year over year to $6.97 billion in Q1 2026. As AI answers keep users on Google’s own pages, the open-web inventory Google syndicates into is contracting. It is small and low-margin, so the decline is a signal more than a wound.
- Subscriptions, platforms, and devices is the quiet grower, up 19 percent to $12.4 billion in Q1 2026 - now larger than YouTube ads. This is YouTube Premium and TV, Google One (including paid Gemini tiers), and Pixel. It matters because it diversifies Alphabet away from pure ad cyclicality and because Google One’s AI plans are a direct way for consumers to pay for AI.
Google Cloud is the inflection. It sells three things that blur together: raw infrastructure (compute and storage, increasingly on Alphabet’s own chips), Vertex AI - now repackaged as the “Gemini Enterprise Agent Platform,” the toolkit enterprises use to build AI agents on Google models - and Workspace, the Gmail-and-Docs subscription suite. An AI agent here means software that can take multi-step actions against a company’s own data and tools (pull a record, draft the reply, update the system) rather than just answering a question in a chat box. Enterprises rent Google’s models plus the surrounding tooling to build and run these agents on their own data, which is the concrete thing behind the 63 percent Cloud growth. Cloud revenue was $58,705 million in FY2025 and accelerated to $20.0 billion in Q1 2026, up 63 percent year over year. The bigger deal is profitability: segment operating margin reached 32.9 percent in Q1 2026, up from 17.8 percent a year earlier. Cloud has gone from a money-loser to a structurally profitable business, which is what turns the AI capex from pure cost into a returning investment.
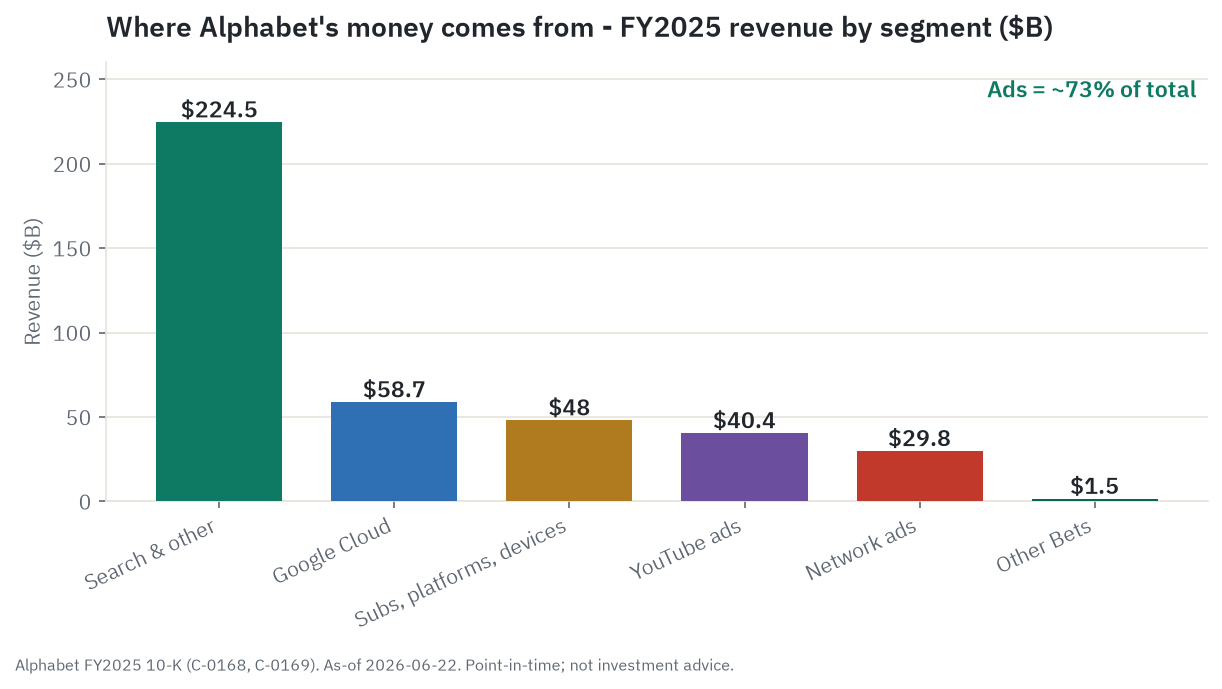
Other Bets is everything else, mostly Waymo. It earned $1,537 million in FY2025 and lost $7,515 million. Treat it as research spending with optional upside, not as a profit contributor.
A few more terms you will meet below. Remaining performance obligations, or RPO, is the “backlog” - contracted future revenue not yet recognized; Cloud’s RPO is above $460 billion. AI Overviews and AI Mode are the AI-generated answers Google now shows above or instead of the classic ten blue links. TPU is Alphabet’s Tensor Processing Unit, its in-house AI chip, the alternative to buying Nvidia GPUs. Those three ideas carry most of the bull and bear arguments.
The AI build-out: capex, compute, and the model stack
This is the part of Alphabet that changed the company’s financial character, so it is worth slowing down.
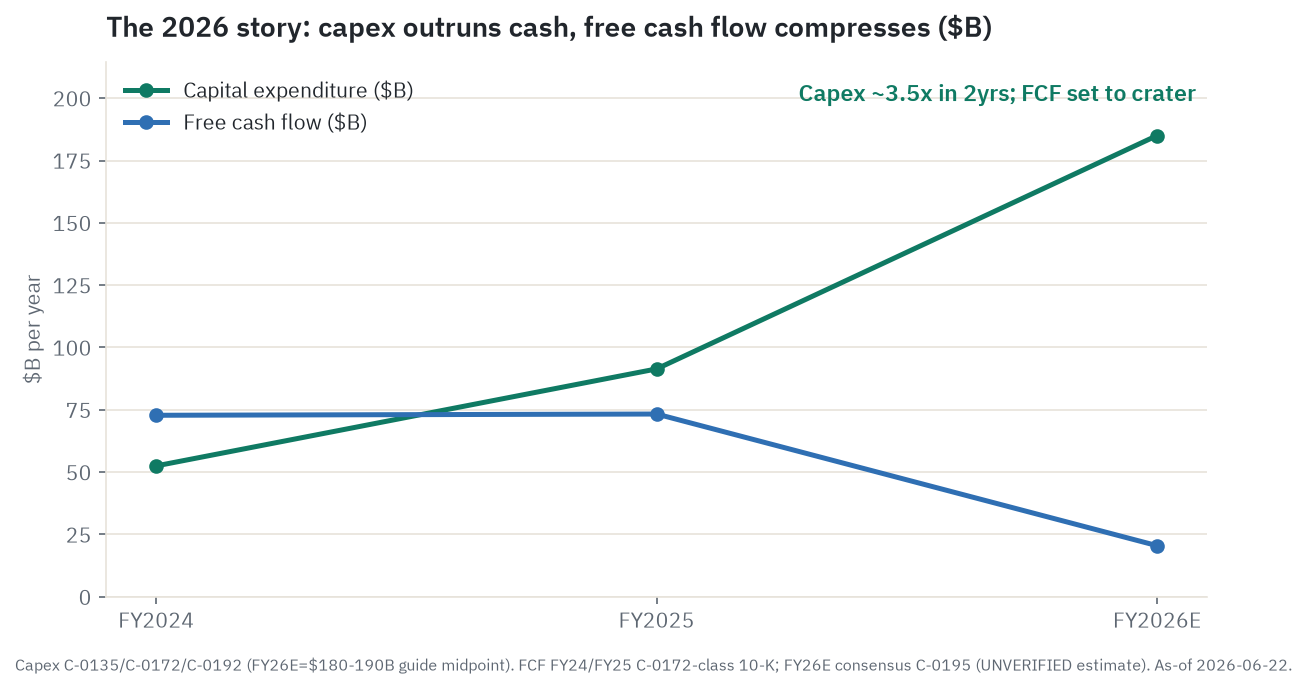
The scale of the spend. Capex went from $52.5 billion in FY2024 to $91.4 billion in FY2025 to a guided $180 to $190 billion in 2026, with management saying 2027 will rise “significantly” again. That is roughly a 3.5x increase over three years. About 60 percent of it is servers and 40 percent is data centers and networking. The reason given is blunt and worth taking at face value: management says demand for its AI products is “exceeding the company’s available supply,” and CEO Sundar Pichai said on the Q1 call that cloud revenue “would have been higher” if Google could have met demand. In other words, the constraint is supply, not demand - at least for now.
The chip strategy. Most hyperscalers rent their AI compute from Nvidia. Alphabet largely does not. It designs its own TPUs, co-designed with Broadcom (under an agreement running through 2031) and fabricated by TSMC, and it is widening the design bench to MediaTek and possibly Marvell. The current flagship, Ironwood (the seventh-generation TPU), reached general availability on April 22, 2026, with per-chip performance roughly on par with Nvidia’s B200. The economic point is cost. Analysts at SemiAnalysis estimate Ironwood’s all-in cost of ownership runs meaningfully below a comparable Nvidia system - on the order of 30 to 44 percent lower depending on whether you count Google’s internal economics or what an external cloud renter pays after Google’s margin. That gap exists because Broadcom takes a thin margin on the silicon while Nvidia takes a large one. Owning the chip is how Alphabet claws back margin that competitors pay to Nvidia, and it is the structural reason Alphabet can answer a search query with AI without the cost blowing up. To be clear about the limits of this claim: the exact split between TPUs and Nvidia GPUs inside Google is not disclosed, and the TCO figures are analyst estimates, not company disclosures. But the direction is well supported, and there is external validation - Anthropic agreed to use up to one million TPUs.
The model. Gemini is Alphabet’s frontier model family. The Gemini app reported 750 million monthly active users as of Q4 2025 (secondary trackers put it above 900 million by mid-2026, which is directional, not company-confirmed), against an estimated 810 million for ChatGPT - so Gemini is a clear and closing number two. On benchmarks, Gemini 3 Pro leads the LMArena user-preference leaderboard and wins on some reasoning tests, while rivals lead on coding and certain math. The differentiator is not the benchmark, though. It is distribution: Gemini reaches users through Search, Android, Chrome, and Workspace seats that competitors have to win one at a time.
The funding. Here is the genuinely unusual part. The most cash-generative company in tech is now raising outside capital to fund the build. In June 2026 Alphabet priced an $84.75 billion equity raise (upsized from $80 billion): $15 billion of common stock, about $15 billion of mandatory convertible preferred (a 6.25 percent coupon, converting around May 2029, with capped-call transactions to blunt the future dilution), a $40 billion at-the-market program starting in Q3 2026, and a $10 billion private placement to Berkshire Hathaway at a roughly 6.5 percent discount. One nuance the headlines flatten: about $30 billion of the ATM program is earmarked not for compute but to cover employee stock-vesting tax obligations, an administrative change. So do not read the whole $84.75 billion as pure capex funding. On top of the equity, Alphabet raised more than $85 billion of debt over the prior year across six currencies. The signal cuts two ways. It is a confidence statement - raising cheap capital with Berkshire as anchor while demand outruns supply - and it is also the clearest evidence that the build now exceeds what even Alphabet’s river can pay for.
The depreciation tail. All that hardware does not hit the income statement at once. Alphabet depreciates servers over six years (raised from four in 2023), so the $180-to-$190-billion cash outlay shows up as a cost only slowly. Q1 2026 depreciation was already up 45 percent year over year to $6.5 billion, and management has warned that higher depreciation and data-center energy costs will “continue to put pressure on the P&L” through 2026 into 2027. Sitting on the balance sheet is $78.6 billion of assets not yet in service - a pipeline of cost that will roll into future cost of revenue. That is a programmed margin drag, and it is the bears’ favorite chart.
There is a sharper version of this argument that a reader will run into, so it belongs here rather than buried in a footnote. In November 2025, short-seller Michael Burry alleged that the big AI spenders, naming Google among them, understate depreciation by stretching the useful life of their chips, and that this flatters reported profit across the group by roughly $176 billion over 2026 to 2028. The attribution is real (CNBC, November 11, 2025). The substance is contested, not established. The factual hook is that Alphabet did raise its assumed server life from four years to six in 2023, which lowers annual depreciation per dollar of hardware. Whether six years is too generous is the open question: Nvidia and others counter that older accelerators stay in productive use for years, and no regulator or auditor has found Alphabet’s accounting improper. Treat it as a contested bear-case view to weigh, not a finding. It is flagged again in the data-quality section at the end.
Who Alphabet competes with and depends on
Alphabet sits at the center of two maps at once: a demand-side competitive map for advertising, cloud, and AI, and a supply-side dependency map for the silicon that powers the build.
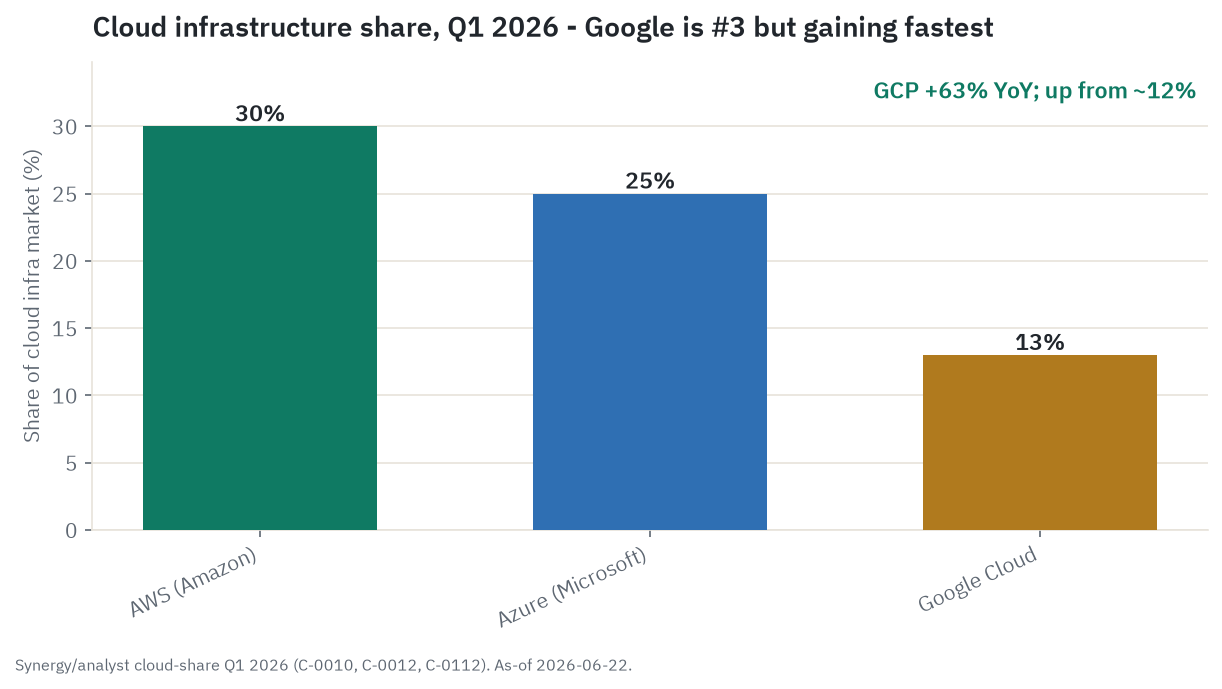
On the demand side, the contest runs across three fronts. In advertising, the “triopoly” of Meta, Google, and Amazon holds about 62 percent of global digital ad spend, and the landmark 2026 shift is that eMarketer projects Meta overtakes Google in total digital ad revenue for the first time (Meta about $243.5 billion versus Google about $239.5 billion). The pie is growing; Google’s slice is projected to shrink, which is the structural worry that sits underneath the cyclical ad story. In cloud, Google is a distant number three at roughly 13 to 14 percent share behind AWS (around 30 percent) and Azure (around 25 percent), but it is the fastest grower of the three. In AI assistants, the share numbers diverge wildly by method - ChatGPT is somewhere between 46 and 55 percent, Gemini between 13 and 28 percent, Claude between 8 and 21 percent, depending on whether you count active users, US users, or web traffic - but the direction is consistent: ChatGPT is ceding share, and Gemini and Claude are gaining it.
A reader who has used both will ask the obvious question: is not ChatGPT, not Bing, the real threat to Search? It is the fair question, and the honest answer is that OpenAI is the most direct consumer-AI substitution threat, distinct from Microsoft’s Bing. OpenAI is private and not in this roster, which is exactly why it is hard to size: it discloses no ad revenue and no clean query-share line, so its competitive weight has to be inferred from third-party usage trackers that disagree with each other. Two things keep it from being a clean Search-killer so far. About 95 percent of ChatGPT users still also use Google, so it is adding a habit rather than replacing one for most people. And OpenAI is now standing up its own search-ad business, which means the threat is less “people stop searching” and more “a second ad auction appears for the same intent.” That second point is the one to watch, because an OpenAI ad business competes for the same advertiser dollars that fund Alphabet, not just for user attention. Microsoft’s Bing, by contrast, has spent years as a distant share-taker and is the lesser of the two consumer threats.
The most-watched relationship is with Apple, which is both a threat and, lately, a partner. Google pays Apple roughly $20 billion a year for the Safari default, the single most antitrust-exposed contract it has. The conventional fear was that Apple would build its own AI search and walk away. The 2026 reality ran the other way: in January 2026 Apple and Google signed a roughly $1 billion-a-year deal under which a custom Gemini powers the rebuilt Siri, and that deal does not replace the search default. So Google now collects on two fronts. The threat to the search economics now comes mainly from the antitrust remedy and from AI search eroding query volume, not from Apple defecting.
On the supply side, the chain narrows to a few chokepoints. Broadcom co-designs the TPUs. TSMC fabricates them (and the Nvidia GPUs Google buys) - the single hardest chokepoint, because there is no second source for leading-edge AI silicon, and it is concentrated in Taiwan. High-bandwidth memory comes from Samsung and SK Hynix, a market that is sold out into roughly 2028 (we map that crunch in the memory supercycle). Nvidia, with about 81 percent of the AI-chip market, is both a supplier Google pays and the rival its TPUs are built to route around - the NVDA toll-booth piece is the other side of that trade. And the newest bottleneck is electricity: Alphabet has signed multi-year nuclear (a Kairos small-modular-reactor deal for up to 500 megawatts) and geothermal contracts because the binding constraint on adding compute is shifting from chips to gigawatts, the theme of the AI power supply chain.
The demand drivers: search, AI, cloud, and the ad market
What actually grows the top line over the next few years comes down to four flows, and each carries a bull and a bear.
The digital ad cycle. Global digital ad spend is roughly $700 to $750 billion in 2026 and growing in the mid-teens, and US ad spend is forecast up about 6.6 percent (8.9 percent including political). Advertising is cyclical, with an estimated elasticity to GDP of 1.4 to 1.9 - it falls harder than the economy in a downturn and rebounds harder coming out. Search holds up better than brand advertising because it is intent-driven, but “better” is not “immune.” The cyclical setup for 2026 is supportive (consensus US GDP growth near 2.2 percent), with two cautions: a K-shaped consumer where the top decile drives nearly half of spending, and the structural share loss to Meta.
AI search monetization - the existential variable. This is the one that matters most and is hardest to pin down. The bull evidence is real: Search and other ad revenue grew 19 percent in Q1 2026, paid clicks were up 13 percent and cost-per-click up 5 percent (so growth was volume-led, the healthiest kind), ads now appear on about 25.5 percent of AI Overview pages (up from 3 percent in January 2025), and 95 percent of ChatGPT users still also use Google. The bear evidence is equally real and points the other way: about 43 percent of Google searches now end with no click at all (93 percent under AI Mode), Gartner forecasts traditional search volume down about 25 percent by end-2026, and ChatGPT is standing up its own search-ad business. The honest synthesis: as of mid-2026, Google is monetizing the AI transition on its own surfaces, and the erosion is concentrated in the open-web Network leg rather than in Google’s own profit and loss. But the forward risk is genuine. The whole bull case rests on a number nobody can yet measure cleanly - revenue per query on AI surfaces. If AI answers fail to monetize as well as the click they replace, the cash engine compresses. This is the single most important unknown in the entire thesis, and no clean figure for it exists.
Cloud and enterprise AI. Cloud’s 63 percent growth is backed by a remaining-performance-obligation backlog above $460 billion, roughly doubled in a quarter, with about half expected to convert to revenue within 24 months. For the first time, management says enterprise AI is the primary driver. The bull reads the backlog as contracted proof that the demand is structural, not a bubble. The bear note belongs here too: Alphabet does not disclose the backlog’s composition, so a large share could be a handful of mega AI-lab capacity deals (like Anthropic) that carry counterparty risk and possibly lower margins than the 33 percent headline. “Demand exceeds supply” is management’s framing inside a document used to justify a capital raise, not an audited fact.
Subscriptions and YouTube CTV. The slower, steadier flow. Subscriptions are growing 19 percent and YouTube keeps taking living-room TV time. Neither is a thesis-maker, but together they diversify the ad cyclicality.
Company by company: who’s who in the GOOGL orbit
Alphabet does not trade in isolation. It is the anchor of a mega-cap set that is all exposed to the same AI cycle - some as competitors, some as suppliers, one as pure optionality. All market caps are point-in-time, stamped to June 22, 2026, and from third-party aggregators (analyst tier), so treat them as snapshots.
The subject
Alphabet (GOOGL) - market cap about $4.28 trillion. The advertising-and-search cash machine funding the largest capex program in its history while Cloud accelerates and the antitrust remedy works through appeal. Bull: the cheapest of the Mag-7 on forward earnings, with AI search and Cloud both inflecting, Waymo optionality, and its own TPU stack so it is not hostage to Nvidia pricing. Bear: generative AI could disintermediate the paid search click, free cash flow is compressing under capex with uncertain return on investment, and antitrust remedies (the Apple default, data-sharing, ad-tech divestiture) threaten the core economics.
The competitors
Microsoft (MSFT) - about $2.81 trillion. The most direct rival across cloud (Azure versus GCP) and AI assistants (Copilot versus Gemini), and through Bing the most direct search-substitution threat. We dig into its own capex-and-OpenAI bind in why Microsoft stock dropped. Bull: the OpenAI alliance gave it an early enterprise-AI lead, and Azure is the number-two cloud with strong AI pull. Bear: heavy AI capex with the same ROI doubts, an OpenAI relationship that is turning more competitive and costly, and a stock that de-rated off its 2025 highs.
Amazon (AMZN) - about $2.56 trillion. A dual rival: AWS is the cloud leader Google chases, and Amazon Ads is the number-three ad platform taking retail-media share. Like Google, it builds its own AI silicon (Trainium). Bull: AWS scale plus a fast-growing high-margin ad business plus custom silicon that cuts Nvidia dependence. Bear: Amazon is the cleanest external proof of the capex-eats-cash thesis - its FY2025 free cash flow fell roughly 66 percent to about $11 billion on $132 billion of capex. That is exactly what AI capex does to free cash flow, playing out one company over.
Meta (META) - about $1.45 trillion. The other advertising duopolist, and the name eMarketer projects overtakes Google on global ad revenue in 2026. Bull: engagement and ad-targeting strength, AI lifting ad ROI, a huge user base. Bear: no cloud or search cash buffer, Reality Labs still bleeds cash, and the stock fell off late-2025 highs on capex worries.
Apple (AAPL) - about $4.43 trillion. Both partner and threat, as covered above: it takes roughly $20 billion a year to keep Google the Safari default, and it now also pays Google about $1 billion a year for Gemini in Siri. Bull: an unmatched installed base and the gatekeeper of mobile search distribution. Bear: Apple has lagged in generative AI, and any future Apple-brokered search alternative would strike at Google’s distribution.
The suppliers
Nvidia (NVDA) - about $5.16 trillion, the most valuable company in the set. Google Cloud buys Nvidia GPUs to offer alongside its own TPUs, so Nvidia is both a key supplier and an indirect rival. Bull: it owns the AI-compute standard with CUDA lock-in, and every hyperscaler still buys GPUs. Bear: customer concentration in a few hyperscalers who are all building their own chips - Google’s TPU success is, structurally, bearish for Nvidia. Hold the two bulls (own-the-standard and Google’s-TPU-edge) side by side and they are in tension; both cannot fully win.
Broadcom (AVGO) - about $1.90 trillion. Co-designs Alphabet’s TPUs and supplies the networking that ties data centers together; Google is reportedly its largest custom-silicon customer. Bull: a custom-AI-silicon backlog ramping hard as hyperscalers diversify away from Nvidia. Bear: revenue concentrated in a few mega-customers whose in-housing or capex cuts would sting.
TSMC (TSM) - about $2.06 trillion (US-listed as an ADR). The foundry that fabricates the TPUs (via Broadcom) and the Nvidia GPUs - the effective single point of failure for advanced-node AI silicon. Bull: a near-monopoly on leading-edge fabrication with pricing power and a structural AI tailwind. Bear: geographic concentration in Taiwan and heavy capital intensity.
Micron (MU) - about $1.3 trillion, and SK Hynix (000660.KS) - about $1.35 trillion. The high-bandwidth-memory suppliers whose chips sit on every AI accelerator. Note the caution flagged in our own research: Micron’s market cap surged roughly tenfold in a year on the 2026 memory supercycle, an extraordinary move that prices in a permanent up-cycle memory has historically never delivered. Treat that cap as the most stretched figure in the set.
The optionality
Waymo - private, Alphabet-controlled, marked at about $126 billion in a February 2026 round (up from about $45 billion in late 2024). The robotaxi business, running roughly 400,000-plus paid rides a week. Be precise about what that number is: it is a private mark from an Alphabet-led round, not a market price, on a business that is still pre-profit, capital-hungry, and had a roughly 3,871-vehicle recall in the recent window. It is the weakest-backed plank of the bull “hidden value” case. Exposure to it is only through GOOGL.
What the filings say
This section is the audited spine. Every figure traces to the FY2025 10-K, the Q1 2026 10-Q, or the related 8-Ks.
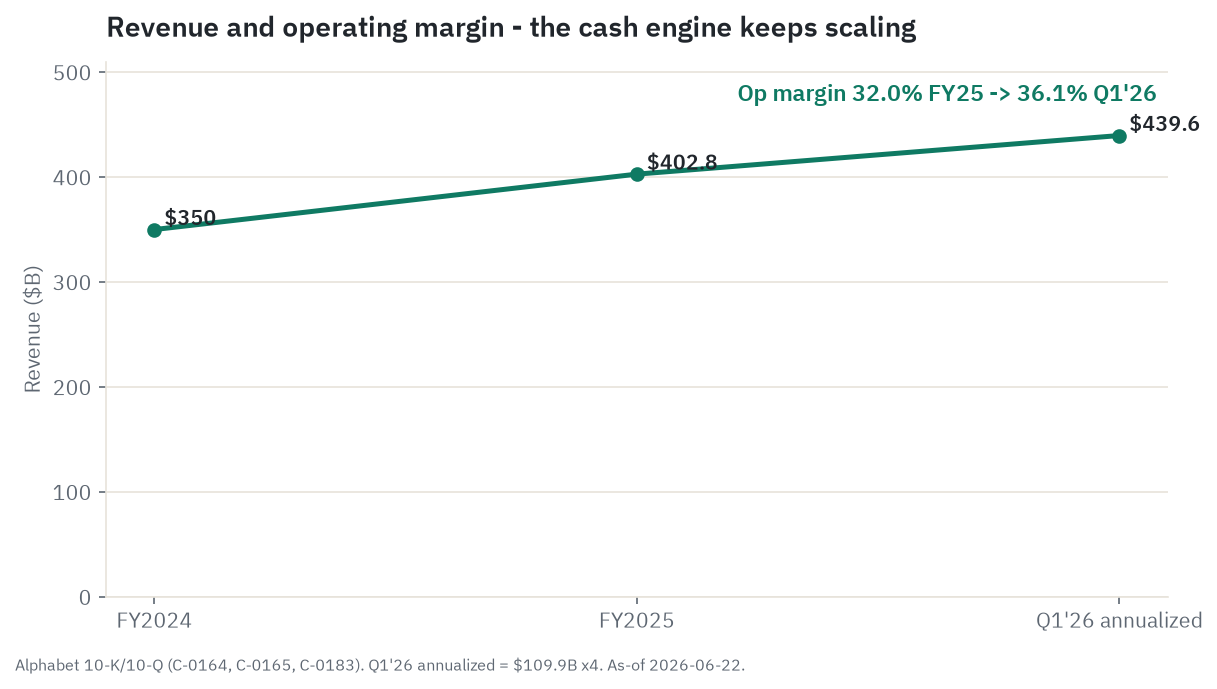
Revenue and margins. FY2025 revenue was $402,836 million, up 15.1 percent, with operating income of $129,039 million and a 32.0 percent operating margin. Q1 2026 accelerated: revenue $109,896 million (up 21.8 percent), operating income $39,696 million, operating margin 36.1 percent. The margin expansion despite a doubling of capex is the bulls’ best filing-level evidence that the spend is currently earning its keep.
An earnings-quality flag. Read net income carefully. FY2025 net income was $132,170 million and diluted EPS was $10.81, but that figure is inflated by $24,080 million of gains on equity securities sitting in other income. Q1 2026 carried another $37,716 million of such marks, and a January 2026 subsequent event added roughly $32.0 billion of unrealized gains on non-marketable investments. A large slice of recent “earnings” is mark-to-market investment gains, not operating profit. When you see a “cheap forward P/E,” remember the E is partly investment gains. The cleaner read is operating income.
Cash flow and the capex story. FY2025 operating cash flow was $164,713 million; capex was $91,447 million; free cash flow was $73,266 million, an 18.2 percent FCF margin. Then Q1 2026: operating cash flow $45,790 million, capex $35,674 million (more than double the year-ago quarter), free cash flow only $10,116 million. The capex surge is hitting free cash flow hard, and that is the central financial fact of 2026.
The balance sheet. Cash and marketable securities were $126.8 billion at the end of Q1 2026, but long-term debt jumped from $46.5 billion to $77.5 billion in the quarter after $31.4 billion of issuance. Net cash fell from about $80.3 billion at year-end 2025 to about $49.3 billion - still net cash, but eroding fast. Maturities are laddered, with little due near-term.
Capital returns and dilution. Buybacks slowed to $45,709 million in FY2025 from $62,222 million, then stopped entirely in Q1 2026 ($0, versus $15,068 million a year earlier). The dividend was raised 5 percent to $0.22 a quarter, still token at a roughly 0.25 percent yield. With the equity raise and stock-based compensation, share count is now rising rather than shrinking - a reversal of years of buyback-driven reduction.
Guidance and the build. Management guides 2026 capex to $180-190 billion and 2027 to rise significantly, frames the build as supply-constrained, and carries $75.6 billion of data-center leases not yet commenced and $78.6 billion of assets not yet in service - both forward cost.
Governance, which minority holders should not skip. Alphabet has a dual-class structure: Class A (GOOGL) has one vote, Class B has ten, Class C (GOOG) has none. Larry Page holds 27.4 percent of total voting power and Sergey Brin 25.3 percent; all directors and executives together control 54.3 percent of the vote. Outside shareholders own the economics, not the control. That is a structural risk: you cannot force change here.
The legal lines from the filings. The 10-K records the US search remedy (final judgment December 2025, both sides on appeal in early 2026), the ad-tech case (an April 2025 liability finding, remedies pending), the EU’s roughly €2.95 billion ad-tech fine with a $3.5 billion charge taken in Q3 2025, and accrued fines and settlements of $15,594 million at year-end. We cover the legal substance in its own section below, framed as findings and pending remedies, not as final outcomes.
What the market is paying
All figures here are point-in-time and move fast; prices were read intraday on June 22, 2026, and vendor snapshots disagree at the margin.
The stock traded near $350.86 intraday, against a last close of $368.03 on June 18 - so even “the price” carries a roughly 5 percent live-versus-close gap, and the market cap reads about $4.28 trillion intraday versus about $4.41 trillion at the prior close. The 52-week range is roughly $162 to $409 (vendors differ slightly), so the stock sits about 14 percent below its high and well more than 100 percent above its low. The trailing-year total return is about +113 percent, one of the strongest mega-cap runs in the set, with three- and five-year cumulative returns around +202 percent and +208 percent. Alphabet is the number-three weight in the S&P 500 at about 6 percent (GOOGL and GOOG combined). Beta is about 1.24, so this is a higher-amplitude name, not a calm one.
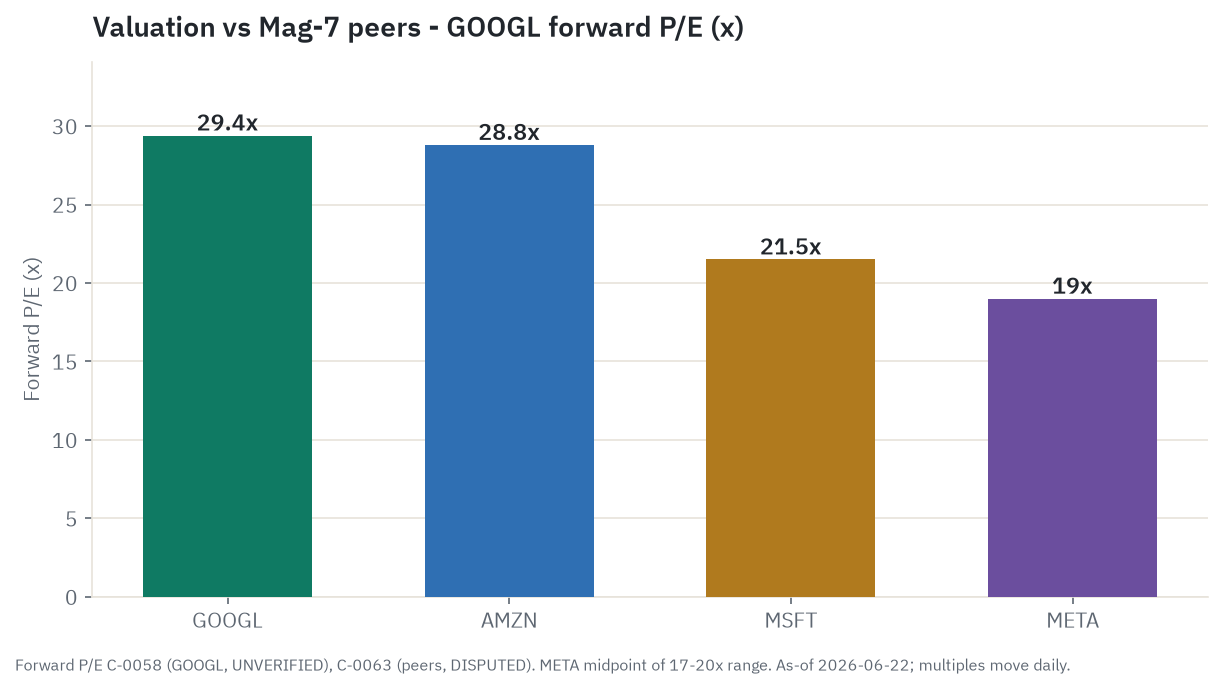
On valuation, the two-sided story is the whole point. Trailing P/E is about 28x and forward P/E about 29x - roughly in line with Amazon (~29x) and a clear premium to Microsoft (~21x) and Meta (which is vendor-disputed in a ~17 to 20x range, so do not lean the comparison on a single Meta figure). But price-to-free-cash-flow is about 70x, because the capex program is compressing the denominator. That is the single hardest figure to defend on a standalone basis. The bull pays the forward P/E and sees infrastructure being built; the bear pays the price-to-FCF and sees cash being spent faster than it compounds. Both are looking at the same company. The PEG ratio (~1.83) is single-source and should be treated as soft.
A note on two metrics a careful reader will look for and the reason this piece leans on price-to-FCF instead. Vendor snapshots put EV/EBITDA near 27.7x intraday on June 22, 2026 (point-in-time, definition-sensitive, and it moves fast), but that figure is unusually noisy for Alphabet right now: the equity-security marks that inflate earnings also distort EBITDA, and the net-cash position plus the in-flight equity raise make the enterprise-value construction a moving target. The mirror image of price-to-FCF, free-cash-flow yield, is just its reciprocal, so a ~70x P/FCF is a free-cash-flow yield near 1.4 percent. The cleaner cash read here is price-to-FCF, which is why the piece anchors on it rather than on EV/EBITDA or a quoted FCF-yield line.
On the sell side, consensus is overwhelmingly bullish - essentially no sell ratings across 33 to 63 analysts depending on vendor, with a mean 12-month target in the low $430s (high around $515 from Citizens, low around $340). Treat those as opinion, not fact; the wide dispersion (a $340-to-$515 range) is itself a signal of how far the AI-monetization assumptions diverge. The cluster sits about 20-plus percent above the current price.
What the crowd is saying
Everything in this section is signal about belief, not fact about the business. Analyst targets are opinions, social reads are soft proxies, and the aggregators disagree with each other.
The news tone is warming. The dominant story is “AI monetization is real” - Cloud re-accelerating, Gemini enterprise adoption, Waymo scaling, the TPU angle. The cooling threads are capital intensity (capex roughly doubling, FCF pressure), the regulatory overhang, AI-talent departures, and the Waymo recall that dinged near-term mood.
Retail is bullish but moderating. Reddit and WSB reads sit in a bullish band; StockTwits recently slipped from bullish to neutral around the Waymo recall headline. Intensity is moderate, not meme-grade - GOOGL is a core large-cap holding, so the chatter reads organic rather than pumped. There are no thin-float dynamics here. If anything, the hygiene risk is the opposite of a pump: consensus complacency.
The divergence that matters. The crowd and the Street agree, which is itself the flag. Both retail and analysts are positioned bullish “AI winner” with near-zero sell ratings. The loudest bull narrative (AI monetization, no disruption to Search) sits directly on top of the loudest bear fundamentals (capex doubling, FCF down sharply, binding antitrust remedies). The crowd is treating regulation and capital intensity as background noise; the filings treat them as material. When positioning is this one-sided, the bar is already high, and a downside surprise - a bad appeal, an FCF air-pocket, a real query-share print - would land against a market that has stopped pricing the bear case.
Regulation and policy overhang
Alphabet is fighting two US antitrust cases plus a stack of EU and UK actions. The financial fines are immaterial against its cash. The structural exposure - what the remedies could do to distribution and the data moat - is the real risk, and it is not yet resolved. Everything here is stated as a liability finding or a pending or on-appeal remedy, never as a final outcome.
The search-monopoly case. In August 2024, Judge Mehta found that Google illegally monopolized general search. The remedies order, finalized December 5, 2025, was a relative win for Google: no breakup of Chrome or Android. But it bars exclusive default deals, caps default revenue-share conditioning at 12 months (forcing annual rebidding), keeps the Apple payments alive but non-exclusive, and - the part aimed at the moat - requires Google to share a one-time search-index snapshot plus ongoing user-interaction data (queries, clicks, dwell times, with privacy protections; not ads data) with qualified competitors. A six-year oversight committee monitors compliance. Both sides are now on appeal: Google filed its opening brief on May 22, 2026, seeking to overturn the liability finding and the data-sharing mandate, and the DOJ with about 38 states cross-appealed in February 2026 seeking to reinstate the divestiture. Oral argument is expected late 2026 or early 2027, with a possible Supreme Court tail into 2028. The data-sharing mandate is the one to watch, because the data flywheel is Search’s actual moat.
The ad-tech case. In April 2025, Judge Brinkema found that Google illegally monopolized two open-web ad-tech markets (the publisher ad server and the ad exchange). The DOJ is seeking a forced divestiture of AdX and possibly DFP; Google argues behavioral remedies suffice. Through closing arguments in November 2025, the judge signaled skepticism toward a structural breakup on practical grounds (who would even buy AdX), so the base case is a behavioral remedy, with a divestiture as the structural tail. No final remedy had issued as of June 22, 2026.
The EU and UK. The EU fined Google €2.95 billion in September 2025 for ad-tech self-preferencing (Alphabet took a $3.5 billion charge and posted bank guarantees), and a further record DMA search fine in the roughly €700 million to €1 billion range was expected before the EU’s summer 2026 recess. The UK CMA designated Google with Strategic Market Status in search in October 2025 and is rolling out conduct requirements. The DMA fine ceiling is large in theory (10 percent of global turnover, roughly $35 billion), but the actual fines are a small fraction of that.
The realistic read. Direct fines do not move Alphabet’s economics. The base case across both US cases is behavioral remedies that are a mild headwind to the distribution moat and a modest leg-up for rivals. The low-probability, high-impact tails - a reinstated Chrome divestiture or a clean ban on the Apple payments or a forced AdX sale - are live on appeal but are not the most likely outcome. None forces an imminent revenue cliff. They raise the long-run competitive-erosion risk that the bear thesis leans on, and the binding questions are unlikely to be finally settled before 2027 or 2028.
Is the bet durable?
Pull the threads together and the durability question splits cleanly, which is usually the honest answer.
What is durable. The Search auction is a genuine moat - dominant query share, deep advertiser demand, default-placement reach - and it runs at roughly a 45 percent segment margin that it does not have to fight for. Even as the format shifts from ten blue links to AI answers, the underlying unit (intent-matched advertising) is unchanged, and crucially Alphabet owns both the demand side (advertisers) and the supply side (the inference silicon that makes AI answers cheap). The cost of answering a query with AI is falling about as fast as AI usage is rising - Gemini’s token prices keep dropping and the TPU stack cuts inference cost an estimated 3 to 5 times versus renting GPUs - which is why AI features have not yet dented Services margin. Cloud’s turn to a 33 percent margin on 63 percent growth, backed by a contracted backlog, is real. The balance sheet is still net cash. None of that depends on a narrative.
What is fragile. Almost every load-bearing plank of the bull case is a future event, and they share one root. The bet is that the AI capex converts to cash earnings faster than three things bite: that it eats free cash flow, that AI answer-engines erode the paid click, and that antitrust remedies compound. Free cash flow is already down to $10 billion a quarter and consensus sees it falling about 72 percent for the full year. The “cheapest Mag-7” framing is true only on earnings that are inflated by investment gains and not yet hit by the depreciation ramp; on the metric the capex actually governs (price-to-FCF near 70x), the stock is not cheap. The query-monetization question has no clean answer. And the data-sharing and ad-tech remedies are live, aimed at the moat, and could land in 2027 just as the cash story is at its weakest.
The most likely path is neither a collapse nor a moonshot. It is a split outcome: the durable Search and Cloud businesses keep compounding underneath, while the stock’s near-term direction is set by whether free cash flow inflects off the 2026-27 trough before the market loses patience and starts pricing on FCF instead of EPS. The thing to watch is not the next demo. It is the next free-cash-flow print, the next 2027 capex guide, and the next read on whether AI answers monetize the query.
The five-year outlook
Four dials decide the next five years. The scenarios below are just different settings of those four. Every forward number is an estimate, clearly labeled, and the illustrative valuations are arithmetic on stated assumptions to show the shape of the bet. None of them is a price target.
The four dials: (1) Search monetization through the AI transition - does revenue-per-query on AI surfaces hold as well as the click it replaces; (2) Cloud growth and incremental margin - does the $460 billion backlog convert on schedule at a decent margin; (3) Capex intensity and free-cash-flow conversion - how deep and how long is the FCF trough; and (4) the regulatory and competitive shift - does the appeal stay behavioral and does Google hold net ad share.
Bull - the full-stack AI platform compounds
Search keeps growing high-single to low-double digits as AI answers monetize at least as well as the click they replace; Cloud sustains 30-plus percent growth and pushes its margin past the mid-30s as the backlog converts; capex peaks around 2027 and then grows slower than revenue, so free cash flow recovers sharply by 2029-2030; the multiple holds near today’s ~29x forward; and the antitrust appeal stays behavioral. Operating income compounding mid-teens off the ~$129 billion FY2025 base could reach roughly $230 to $260 billion by 2030, which on a premium-but-defensible multiple maps to a market cap meaningfully above today’s $4.28 trillion. Waymo adds optionality on top. Illustrative only. What has to be true: AI monetization keeps pace with the click it cannibalizes, and the capex converts to cash on roughly a three-year lag. What breaks it: answer-engine substitution erodes the monetizable query faster than revenue-per-query rises.
Base - two engines, capped multiple
Search grows mid-to-high single digits with the ad cycle and slowly cedes net share to Meta; Cloud grows 25 to 40 percent tapering over the period at a low-to-mid-30s margin; capex stays elevated into 2027 so free cash flow stays depressed near-term (around $20.5 billion in 2026 on consensus) before recovering as the build matures; the multiple compresses modestly under higher-for-longer rates but earnings growth offsets it; and the search appeal stays behavioral. Operating income reaching roughly $180 to $210 billion by 2030 at a modestly de-rated, mature-grower multiple maps to a market cap moderately above today’s - mid-single-digit to low-double-digit annualized appreciation over five years before dividends. Illustrative only, not a target. What breaks it: the FCF trough deepens or extends (2027 capex surprises higher with no offsetting Cloud margin) and the market starts pricing on FCF (~70x) instead of EPS.
Bear - the slow squeeze
This is the skeptic’s case, and it is a real one. Through 2026-27 the capex drives depreciation into cost of revenue while Search decelerates as zero-click AI answers erode the monetizable query (Gartner’s roughly 25 percent volume drop begins to show); free cash flow falls toward zero in 2027 (as SemiAnalysis argues) so the market re-rates GOOGL onto FCF, not investment-gain-inflated EPS; Cloud backlog converts slower and at lower margin than 33 percent as a few mega-deals dominate; and the DC Circuit delivers an adverse data-sharing or ad-tech-divestiture outcome in 2027, hitting the moat when the cash story is weakest - all against one-sided bullish positioning. If 2030 operating income lands nearer $150 billion and the market applies a sub-20x multiple to a slower-growing, higher-capex, regulation-constrained business, the implied cap sits below today’s $4.28 trillion - the +113 percent one-year re-rating partly given back. Illustrative only. What has to be true: AI monetization disappoints, or capex returns lag badly, or an adverse appeal lands - and, crucially, more than one arrives together.
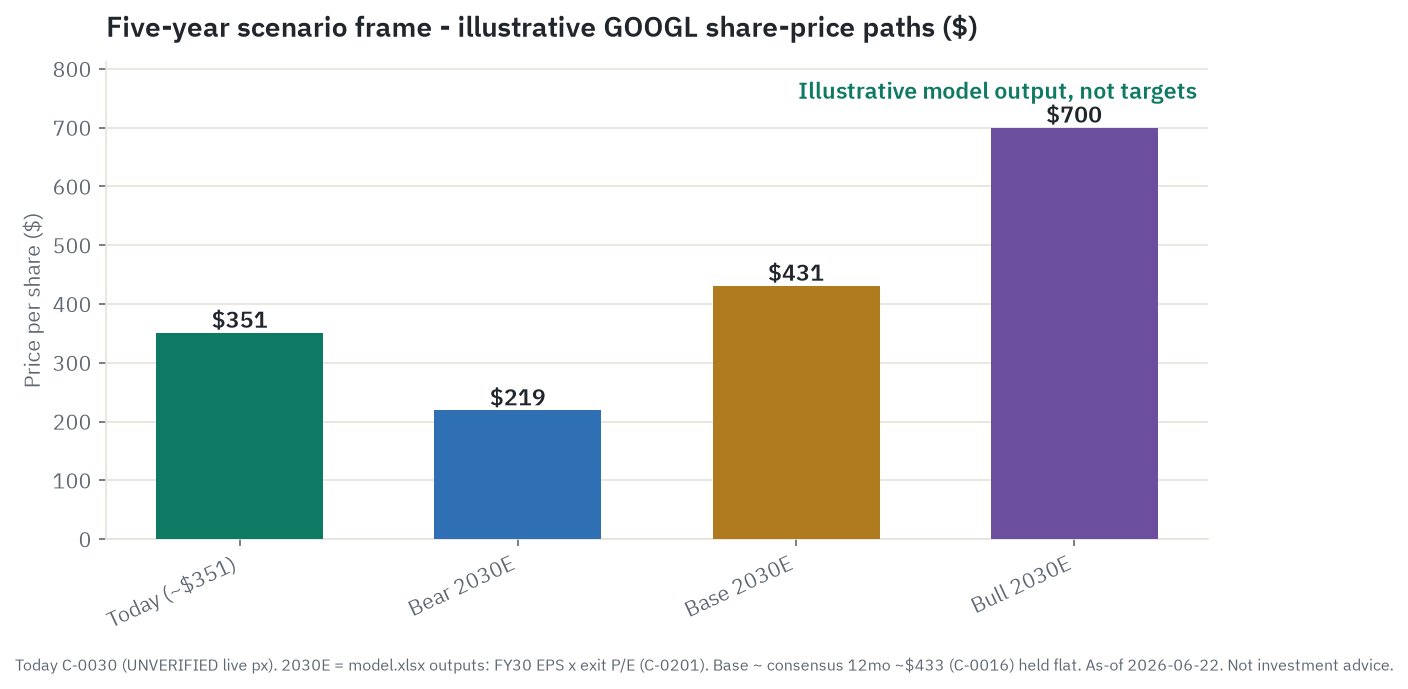
For a concrete feel, our Excel model’s default share-price arithmetic (clearly an illustration, not a forecast) lands bear around $219, base around $431, and bull around $700 against roughly $351 today. Change the assumptions in the blue cells and the outputs move. That is the point - the spread is the bet.
Catalysts and timeline. Near-term: Q2 2026 earnings in late July (the FCF print is the swing); the Fed path (the June 17 hold erased the 2026 cut and pushed easing to 2027-28, which pressures the multiple); the search-appeal briefing and the ad-tech remedy ruling; the Q3 ATM program start; and the eMarketer ad-revenue crossover with Meta. Multi-year: the 2027 capex guide, the depreciation ramp rolling $78.6 billion of assets into cost, the DC Circuit (and possible SCOTUS) resolution, Waymo’s path toward profitability, and the mandatory-convertible conversion around May 2029.
The leading indicators to watch, in order: free cash flow trajectory (the single most important number, because it decides whether the market values the stock on P/E or P/FCF); Cloud incremental margin and backlog conversion; Search paid-click volume and CPC against the Gartner volume forecast; AI Overview ad load as the closest revenue-per-query proxy; the 2027 capex revisions; the appeals docket; net ad-revenue share versus Meta; and the Fed path.
Companies to watch (bull / base / bear)
Alphabet (GOOGL) - the anchor, at roughly 29x forward earnings and 70x free cash flow after a +113 percent year.
- Bull: Embedded-style optionality plays out - Cloud becomes a margin-rich second pillar, AI monetization is confirmed across Search surfaces, free cash flow inflects off the 2026-27 trough, the appeal stays behavioral, and Waymo turns into a third leg.
- Base: durable Services plus Cloud compounding, capex elevated into 2027 so FCF stays depressed before recovering, the multiple de-rates modestly toward a mature-grower level, and the stock returns mid-single to low-double digits annualized.
- Bear: the slow squeeze - FCF toward zero in 2027, AI answers monetize worse than the click, an adverse appeal lands, and the “cheapest Mag-7” framing collapses onto P/FCF. The consensus target near the low $430s implies the bull lean; the bear implies a meaningful give-back of the run.
- Watch: the FCF print, the 2027 capex guide, the AI Overview ad load, and the appeals docket.
Amazon (AMZN) - watch its free cash flow as the live read on what AI capex does to a hyperscaler. AWS reacceleration is the bull tell; FCF compression is the bear confirmation.
Microsoft (MSFT) - watch the OpenAI relationship and Azure margins. A cleaner Copilot monetization story is the bull cross-read for the whole group.
Meta (META) - watch the ad-revenue crossover. If Meta overtakes Google on net ad revenue in 2026, the structural-share bear thesis gets a data point.
Nvidia (NVDA) - watch hyperscaler in-housing. Every TPU win for Google is, at the margin, bearish for Nvidia; the two are linked.
Broadcom (AVGO), TSMC (TSM), Micron (MU), SK Hynix - the supply chain. Watch order books and HBM pricing for whether the build is still accelerating or starting to glut. Micron’s roughly tenfold one-year move is the most stretched figure in the set; treat it with caution.
Waymo - watch ride volume and any path to profitability. Remember the $126 billion is a private mark, not a market price.
Risk controls
This is the honest risk paragraph for a retail reader. It is framing, not advice, and it is ranked roughly by how likely each is to bite near-term.
- Valuation and crowded positioning. The stock is up 113 percent in a year, trades at about 70x free cash flow, and has near-zero sell ratings. The single biggest near-term risk is simply that the narrative premium decays. When everyone is on one side, a small disappointment moves the price a lot.
- The free-cash-flow trough. Q1 2026 FCF was $10.1 billion; consensus sees it down about 72 percent for the year, and one credible analyst sees it near zero in 2027. If the market re-rates onto FCF, the “cheap” framing inverts. This is the number to watch above all others.
- AI search disruption. The whole cash engine rests on AI answers monetizing the query as well as the click they replace, and revenue-per-query on AI surfaces is unmeasured. A volume rollover (the Gartner forecast starting to land) without an offsetting revenue-per-query rise is the existential watch-item.
- Antitrust on appeal. The data-sharing mandate and the ad-tech remedy are live, aimed at the moat, and could land in 2027. The base case is behavioral, but the structural tails (a divestiture, a payments ban) are not zero.
- Capex outrunning returns. The 2027 capex guide is flagged “significantly higher.” If it rises again with no Cloud-margin offset, that is the bear tell, and the depreciation tail ($78.6 billion of assets not yet in service) is a programmed margin drag.
- Macro and rates. Alphabet is a long-duration equity, and the June 2026 Fed hold (which erased the 2026 cut) raises the discount rate on cash flows that sit years out. A correlated ad-spend slowdown would hit both engines at once.
- Governance. The founders control 54.3 percent of the vote. Minority holders own economics, not control, and cannot force change.
What would change the thesis, in either direction: a confirmed FCF inflection off the trough or a clean stretch of prints showing AI surfaces monetizing at parity (bullish); a Search query-volume rollover with revenue-per-query failing to keep pace, an adverse divestiture ruling, or FCF confirmed near zero in 2027 with the market re-rating onto P/FCF (bearish).
Where the read lands
Pull the five threads together and the lean is Buy, with the bar set deliberately low. Valuation nets to fair, not cheap: GOOGL looks discounted on forward earnings around 29x and stretched on price-to-free-cash-flow near 70x, and the EPS denominator is partly investment gains rather than operating profit, so the cheaper-looking ratio is the one to distrust. Growth is the strongest leg of the read - Cloud accelerating to 63 percent year over year, a contracted backlog above $460 billion, and gen-AI revenue up roughly 400 percent. Quality is high too: a roughly 45 percent Services operating margin, still net cash on the balance sheet, and a full-stack TPU cost advantage that competitors pay Nvidia to rent. Risk pulls the other way - live antitrust appeals aimed at the moat, free cash flow falling, net ad-revenue share slipping to Meta, and the founders’ 54 percent voting control over a stock outside shareholders cannot move. And momentum reads as a low-conviction positive only because the positioning is so one-sided that the one-sidedness is itself a caution. Net of all of that, the lean is Buy; the conviction is moderate, not strong; and the single thing most likely to flip it is the next free-cash-flow print. This is a labeled research read, not a recommendation, and any input that could not be verified counted as neutral.
Methodology, sourcing, and data-quality flags
This piece was built from twelve parallel research streams: demand drivers (the ad market, AI search monetization, Cloud, YouTube), AI infrastructure (capex, TPUs, Gemini, the financing), the competitive map, policy and regulation, the value chain, the company peer set, the SEC filings, market action and valuation, sentiment and OSINT, macro, micro and unit economics, and the five-year outlook. Every load-bearing figure traces to an entry in the run’s claims ledger with a source and a tier. The source hierarchy, in order of weight: primary (the FY2025 10-K, the Q1 2026 10-Q, the equity-raise 8-Ks and FWP, the proxy), analyst (market-intelligence and aggregator figures), press (reputable trade and financial coverage), and estimate (model-derived figures). The core financials are all primary-tier; the live market figures, valuation multiples, and competitive shares are press or analyst tier and time-sensitive.
Point-in-time note: every price, market cap, and valuation multiple is intraday on June 22, 2026 ($350.86 reference; last close $368.03 on June 18). These move fast and may be stale by the time you read this.
Data-quality flags:
- Live price, market cap, and the multiple set are press or analyst tier and time-sensitive. There is a roughly 5 percent live-versus-close price gap ($350.86 intraday versus $368.03 close) and a corresponding cap gap (~$4.28T versus ~$4.41T). The 52-week range differs slightly by vendor ($162.00-$408.61 versus $163.33-$404.44). PEG (~1.83) is single-source. Re-stamp at publish time.
- Forward P/E peer comparison is definition-sensitive (trailing versus forward, GAAP versus adjusted). Meta’s forward P/E is vendor-disputed in a ~17 to 20x range, so the GOOGL-versus-peer comparison is presented as a range and does not hinge on a single Meta point.
- Earnings quality. Net income and EPS are inflated by equity-security marks ($24.1 billion in FY2025, $37.7 billion in Q1 2026, plus a roughly $32.0 billion January 2026 unrealized gain). The “cheap forward P/E” is partly investment gains; the cleaner read is operating income.
- FY2026 free cash flow (~$20.5B, down ~72%) and the 2027 “FCF near zero” view are estimate-tier (consensus and SemiAnalysis, respectively), not company figures. Management has named no FCF guidance; it guides 2026 capex to $180-190B and 2027 “significantly higher.”
- Gartner’s ~25 percent traditional-search-volume decline by end-2026 is an estimate-tier forecast, not a measured result. It is the disconfirming evidence to management’s “queries at all-time high.”
- Revenue per query on AI surfaces has no clean disclosed or analyst figure and is described directionally only. The piece does not assert that AI answers monetize as well as ten blue links; it is flagged as the key unknown.
- Cloud backlog composition and customer concentration are not disclosed by Alphabet. The >$460B figure is contracted RPO, but how much is a few mega AI-lab deals (and at what margin and counterparty risk) is inferred, not sourced.
- Segment margins (Services ~45 percent, Cloud ~33 percent) and the TAC rate (~20 percent) are derived from primary segment revenue and operating income; the components are primary, the ratios are arithmetic. The TPU 3-5x inference-cost advantage and the ~30-44 percent TCO advantage are third-party (SemiAnalysis) estimates, not company disclosures.
- AI-assistant market shares diverge widely by method (ChatGPT ~46-55 percent, Gemini ~13-28 percent, Claude ~8-21 percent). The piece uses ranges with the method attached, never a single figure as “the” share. GCP cloud-infra share is ~13-14 percent depending on tracker.
- The Michael Burry depreciation allegation (that hyperscalers including Google understate GPU depreciation and overstate 2026-28 profits by ~$176 billion) is DISPUTED and is presented only as an attributed, contested bear-case argument, not as a fact about Alphabet’s accounting. The company depreciates servers over six years; whether that overstates profit is contested and not established.
- Antitrust items are stated as liability findings and pending or on-appeal remedies, never as final outcomes. The EU ad-tech fine is stated as roughly €2.95 billion. No breakup or divestiture is stated as fact.
- Analyst targets and ratings (mean ~low-$430s, near-zero sells) are UNVERIFIED opinion, attributed to the Street, with vendor disagreement (33 versus 63 analysts) shown rather than resolved. They are not prices the stock will reach.
- Social/retail sentiment (WSB ~65-72, StockTwits bullish-to-neutral) is estimate-tier soft proxy, directional mood, not measurement.
- Waymo’s ~$126 billion is a private-round mark, not a market price. Micron’s ~10x one-year cap move is flagged as an extraordinary, supercycle-priced move to treat with caution.
- Sourcing note: several segment figures were initially read via filing mirrors (StockTitan, PPC Land) because SEC.gov blocked the automated fetcher; the underlying source is the Q1 2026 earnings release and the figures were reconciled to the 10-Q.
Key sources: SEC EDGAR (Alphabet CIK 0001652044) FY2025 10-K, Q1 2026 10-Q, the 2026 DEF 14A proxy, and the June 2026 equity-raise FWP and 8-Ks; Alphabet’s Q1 2026 earnings release; Google Cloud and SemiAnalysis for the TPU and Ironwood detail; the Federal Reserve June 2026 FOMC statement; eMarketer, Madison & Wall, Grand View Research, Gartner, Sensor Tower, Similarweb, and First Page Sage for ad-market, search-volume, and AI-assistant figures; the DDC and EDVA court records, the NTU and natlawreview summaries, the European Commission, and the UK CMA for the antitrust and regulatory status; and stockanalysis.com, finviz, MarketBeat, and S&P Global for live price, market cap, multiples, and analyst targets.
This document is OSINT research for educational purposes only and is not investment advice, not a recommendation, and not a solicitation. The author is not a financial advisor. All data is point-in-time as of June 22, 2026 and may be outdated; nothing here is guaranteed. The five-year scenarios and illustrative valuations are arithmetic on stated assumptions, not price targets. Forward-looking statements are estimates or attributed third-party views, not promises. Do your own due diligence and consult a licensed financial advisor before making any decision.