
Research date: June 22, 2026 | OSINT market research on NVIDIA Corporation (Nasdaq: NVDA), the AI-accelerator value chain that feeds and competes with it, and its five-year outlook. Live prices, stamped hard.
Important disclaimer. This is OSINT-based research and educational analysis, not investment advice. I am not a financial advisor. Nothing here is a recommendation to buy or sell any security, and the five-year scenarios below are illustrative, not price targets. NVDA is a high-beta (2.20) semiconductor stock tied to a single, fast-moving AI-capex cycle, and it can fall hard and fast. Market caps, prices, valuation multiples, and market-share figures are point-in-time (June 22, 2026), press-reported where noted, and move fast. Do your own due diligence and consult a licensed advisor.
Companion tool - jump to the interactive dashboard to sort and filter every company in NVIDIA’s chain and explore the value-chain map, leaderboard, and analysis.
TL;DR
NVIDIA is, financially, a data-center company with a few profitable hobbies. In fiscal 2026 (the year ended January 25, 2026) it earned $215.9 billion of revenue, up 65 percent, with Data Center roughly 90 percent of the total, a gross margin of 71.1 percent, $120.1 billion of net income, and about $97 billion of free cash flow on a net-cash balance sheet. By the first quarter of fiscal 2027 (ended April 26, 2026) quarterly revenue hit $81.6 billion, up 85 percent, and gross margin had recovered to 74.9 percent. The whole investment question reduces to two things: is the AI capex that funds all of this durable, and is the price sane. On June 22, 2026 the stock was around $210.69 for a market cap near $5.10 trillion, the most valuable company on earth, yet it trades at a forward price-to-earnings multiple near 21 and a trailing one near 32, roughly half its own five-year average around 69, with a PEG near 0.47 (PEG is the P/E divided by the earnings growth rate; below 1 looks cheap for the growth on offer, but only if that growth is real). That multiple is low because the market is pricing a hard deceleration off a peak, not because the market thinks the stock is a gift. The bull case is that NVIDIA is the indispensable toll booth on a multi-hundred-billion-dollar build-out, protected by CUDA (the programming software that runs only on NVIDIA chips, so code written for it is costly to move elsewhere), NVLink networking (the high-speed wiring that lets many GPUs behave as one), and full-rack systems. The bear case is that the moat leaks exactly where the market is growing (inference and custom chips), that demand quality is contested (circular financing, no firm-level AI return on investment yet), and that a single capex pause re-rates a low multiple against falling forward earnings. Our rules-based signal lands at Strong Buy, valuation Undervalued, with the honest caveat that the cheapness is a bet on durability that a single bad quarter can break. All figures below carry a date stamp and move fast. Verify live quotes before acting.
All prices, market caps, and valuation multiples below are as of June 22, 2026 unless otherwise stamped. NVDA is a high-beta name inside an active AI-capex cycle. These figures move fast and may be materially stale by the time you read this. Verify live quotes before acting.
Explore it yourself: the interactive dashboard
Open the dashboard in a full screen
The dashboard holds the fourteen public companies in NVIDIA’s chain, sortable by market cap and tagged by tier (supplier, integrator, customer, competitor), with what each one makes, its position, and a bull and bear one-liner. Use it to check any single name as you read.
Prefer a spreadsheet? Download the Excel valuation model with the FY2026 actuals and a reader-adjustable five-year bull/base/bear scenario block, so you can flex the earnings and multiple assumptions yourself. The scenario outputs are illustrative arithmetic, not price targets.
The hook: the company that became the toll booth of the AI build-out
Picture five of the largest companies on earth deciding, at roughly the same moment, that being short on computing power is more dangerous than overspending on it. Microsoft, Amazon, Alphabet, Meta, and Oracle are guiding to combined capital spending well above $600 billion in calendar 2026, with credible analyst aggregates pushing toward $725 billion, up sharply year over year, and roughly three-quarters of it AI-related. These five are the hyperscalers, the handful of companies that operate the world’s largest cloud and consumer-internet data centers and so do most of the buying. Add the AI labs, the sovereign programs, and the rented-GPU “neoclouds,” and you have the largest infrastructure spend of its kind in history. Almost all of it has to pass through one type of product to become useful: an accelerator that can both train a model (teach it once, an expensive one-off) and run inference (serve that trained model to users millions of times a day, the recurring workload).
NVIDIA sells that accelerator, and it has built a position where most of the money flowing into AI computing routes across its plate. Think of a toll booth on the one bridge into a boomtown. NVIDIA does not own the boomtown, does not build the cars, and does not pour the concrete, but for now nearly every vehicle pays at its gate. That is the picks-and-shovels framing, and it is mostly right. The trouble with a toll booth is that two things can go wrong: traffic can stop, and someone can build a second bridge. Drop the analogy there, because the rest of this piece is about exactly those two risks. A holder of this stock is really asking two questions. Is the demand durable. And after a run that made this a $5 trillion company, is the price still sane. The honest answer to both is “probably, with real ways to be wrong,” and the rest of this report is the evidence.
How the money flows
flowchart TD
    DEMAND["AI compute buyers<br/>(hyperscalers, AI labs)<br/>fund the chain"]
    NVDA["NVIDIA<br/>GPU + rack design, CUDA<br/>FY26 rev $215.9B, ~71% GM"]
    ODM["ODM/OEM assembly<br/>Foxconn ~40%, Quanta, Wistron<br/>Supermicro, Dell, HPE<br/>thin margins"]
    TSMC["TSMC foundry<br/>GPU die, leading edge<br/>3nm price hikes"]
    COWOS["CoWoS packaging<br/>TSMC lead + ASE/Amkor/UMC<br/>BOTTLENECK: NVDA ~60% (~595k wafers)"]
    HBM["HBM memory<br/>SK Hynix ~50-55%, Samsung, Micron<br/>NVDA HBM4 ~70% to SK Hynix"]
    SUB["Substrate / PCB<br/>Ibiden ~70-80% top-tier<br/>Unimicron, Nan Ya PCB"]

    DEMAND -->|"pays for AI systems<br/>rack ~$2-8.8M"| ODM
    ODM -->|"buys GPUs / reference designs"| NVDA
    NVDA -->|"wafer fees"| TSMC
    NVDA -->|"packaging fees (chokepoint)"| COWOS
    NVDA -->|"HBM purchases, rising prices"| HBM
    NVDA -->|"substrate purchases"| SUB
    COWOS -.->|"consumes"| HBM
    COWOS -.->|"sits on"| SUB
    TSMC -.->|"die into package"| COWOS
Read that top to bottom and the investing point is the shape. The dollars start with the AI compute buyers: hyperscalers, AI labs, sovereign programs, and the neoclouds. They do not buy a loose chip anymore. They increasingly buy a full rack system, a cabinet of 72 GPUs wired together to behave like one giant accelerator, that sells for roughly $2 million to $3 million for the current GB200 generation, more for the inference-heavy GB300 build, and as high as a reported $8.8 million apiece for the next-generation Vera Rubin rack. NVIDIA designs the GPU and the rack, captures roughly 71 percent full-year gross margin (75 percent in the most recent quarter), and then pays its own suppliers out of that.
Trace the money upstream from NVIDIA and it splits into four input streams, and this is where the bottlenecks live. (For the wider picture of how this capex flows through every public name in the chain, see our AI supply-chain investment map.) First, TSMC fabricates the GPU die on leading-edge nodes, and it is weighing a roughly 15 percent price hike on 3nm in the second half of 2026. Second, and this is the true chokepoint, TSMC’s CoWoS advanced packaging (CoWoS, “chip-on-wafer-on-substrate,” is the step that glues the finished logic chip to its memory stacks on a single slab of silicon so they can talk fast enough) bonds that die to its memory stacks on a silicon interposer. NVIDIA is estimated to hold about 60 percent of TSMC’s 2026 CoWoS capacity, roughly 595,000 wafers, and to have booked more than half of the 2026 to 2027 expansion. Packaging, not wafer fabrication, is what sets the ceiling on how many GPUs can ship, and the reason it cannot simply be expanded on demand is physical: CoWoS runs on a small number of specialized, fully-qualified production lines that TSMC controls, the bonding and lithography tools have lead times measured in one to two years, and a new line has to be qualified before it can ship a single sellable part. Capacity therefore comes online in years, not quarters, which is exactly why NVIDIA pre-books it years ahead and why it, not the chip fab, gates how many GPUs reach customers. Third, high-bandwidth memory (HBM, the ultra-fast memory stacked in a tower right next to the GPU so data does not bottleneck the compute) comes from a three-player oligopoly, meaning only three suppliers exist so each holds real pricing power: SK Hynix leads at roughly 50 to 55 percent, with Samsung and Micron behind, and NVIDIA is steering close to 70 percent of its HBM4 demand for Vera Rubin to SK Hynix. (We map this three-player memory boom in full in the HBM memory supercycle.) Fourth, the package sits on a high-layer-count substrate where Japan’s Ibiden holds an estimated 70 to 80 percent of the top tier.
Downstream, NVIDIA hands GPUs and reference designs to the assemblers (Foxconn at roughly 40 percent of rack assembly, then Quanta, Wistron, plus Supermicro, Dell, and HPE), who earn large absolute dollars on thin and shrinking percentage margins as rack prices climb. So pricing power concentrates at exactly three nodes: NVIDIA itself, TSMC (the only credible leading-edge and CoWoS source), and the HBM trio. The bottleneck sits at CoWoS packaging and HBM. The commodity, margin-squeezed stage is rack assembly. And the single biggest physical concentration risk is that both fabrication and packaging route through Taiwan, with no near-term substitute. That shape, one owned design feeding one foundry, two chokepoints in memory and packaging, and a software toll on top, is the whole investing story in one diagram.
What NVIDIA actually sells (the franchise decoded)
It is tempting to call NVIDIA a chip company. That undersells it, because the moat is not the chip. Here is the real stack.
Data-center GPUs are the engine. The current shipping volume product is the Blackwell Ultra generation, the GB300 NVL72: a rack of 72 B300 GPUs and 36 Grace CPUs, 288 GB of HBM3e per GPU, delivering roughly 1.44 ExaFLOPS of dense FP4 compute (ExaFLOPS and FP4 are just raw compute-throughput measures; the only takeaway a reader needs is that each generation packs far more compute into one rack) and about 1.5 times the AI performance and 2 times the attention performance of the prior GB200 rack. The next platform, Vera Rubin, entered full mass production (announced at GTC Taipei on June 1, 2026), with volume shipments scheduled for fall 2026. Jensen Huang called it the most ambitious project in the company’s history. The cadence is one-directional: each generation raises both the silicon content and the rack price.
Networking is the part most people miss, and it is now a very large business in its own right. Full-year fiscal 2026 data-center networking revenue was $31.4 billion, up 142 percent. In the first quarter of fiscal 2027 networking ran $14.8 billion in a single quarter, up 199 percent year over year, roughly a $59 to $60 billion annualized run rate, and within data center it was about 19 to 20 percent of the segment. This matters because NVIDIA’s three networking layers, all of them the wiring that makes many separate GPUs act as one machine, let it sell the entire “AI factory” as one integrated fabric: NVLink for scale-up (the fastest links inside a single rack), InfiniBand for scale-out (a specialized network joining many racks into one cluster), and Spectrum-X Ethernet (the same scale-out idea built on standard Ethernet, past a $10 billion annualized run rate). That raises the switching cost well beyond the GPU.
CUDA is the software moat, roughly twenty years of development running on hundreds of millions of NVIDIA GPUs across every major cloud. Huang’s own framing is blunt: CUDA is the moat, the chips are the product. The developer lock-in is real, and for large-scale training it is deep (the system-level pieces, cuDNN, NCCL, TensorRT-LLM, plus NVLink integration, keep teams in place). We will get to where it leaks.
The segment mix is lopsided to a degree that surprises people. For full-year fiscal 2026, on total revenue of $215.94 billion, Data Center was $193.74 billion (89.7 percent), Gaming $16.04 billion, Professional Visualization $3.19 billion, Automotive $2.35 billion, and OEM and other $619 million. By the first quarter of fiscal 2027, Data Center alone was about 92 percent of revenue.
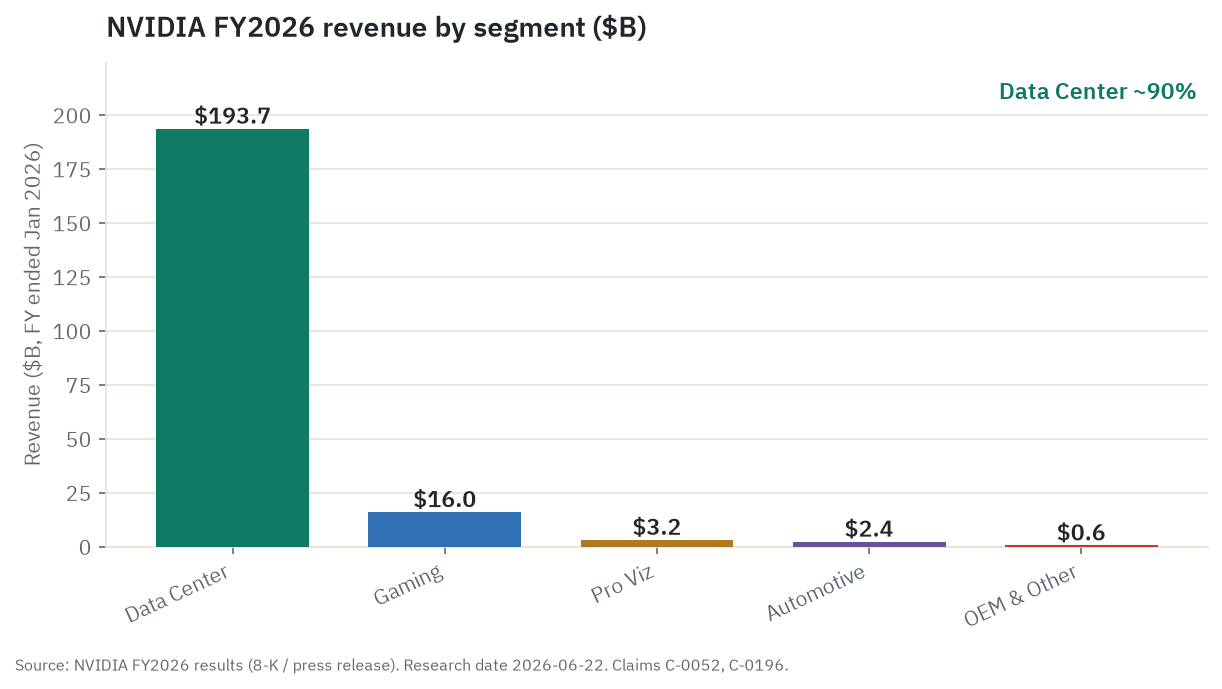
The consumer, automotive, and professional-visualization lines are real, growing, and profitable, but they are rounding items against Data Center. NVIDIA is a data-center compute-and-networking company with a few healthy hobbies bolted on.
Where the demand comes from (and whether it is durable)
NVIDIA does not disclose named end-customer revenue, so the cleanest read on demand is its own segment reporting plus the buyers’ capex guides. The company now splits Data Center into Hyperscale (the public clouds and largest consumer-internet companies) and ACIE (AI clouds, industrial and enterprise, including sovereign). In the first quarter of fiscal 2027, Data Center was $75.2 billion, up 92 percent, split almost evenly: Hyperscale $37.9 billion (up 115 percent) and ACIE $37.4 billion (up 74 percent). Six months earlier hyperscalers were well over half. The diversification toward enterprise, on-premise, and sovereign buyers is genuine, and it is the bull’s strongest durability argument.
The demand stack has four legs. Hyperscaler capex is the biggest: Amazon around $200 billion for calendar 2026, Microsoft around $190 billion, Alphabet $180 to $185 billion, Meta raised into the $115 to $145 billion range, Oracle around $50 billion. AI labs (OpenAI, Anthropic, xAI) train and increasingly serve models. Sovereign AI is the surprise mover: NVIDIA’s sovereign revenue exceeded $30 billion in fiscal 2026, more than tripling, about 14 percent of total revenue, with named programs like Saudi Arabia’s HUMAIN (a framework to deploy up to 600,000 NVIDIA accelerators over three years) and the UAE’s G42 cluster. Enterprise and industrial is the broadest, slowest pool.
On the much-quoted visibility figure, hedge it exactly as the CFO did. On the third-quarter fiscal 2026 call, Colette Kress said the company had “visibility to a half a trillion dollars in Blackwell and Rubin revenue from the start of this year through the end of calendar year 2026.” That is a roughly two-year window, it is “visibility” and not booked backlog, and Kress said it would grow. Do not read it as a contract. Alongside it, NVIDIA’s own balance sheet carries $119 billion of manufacturing and supply commitments (more on that below), which is management putting real money behind the same confidence.
Now the durability fault line, stated honestly because it is the whole question. A large share of AI compute is now inference (Gartner-cited figures put it at roughly two-thirds in 2026, up from about a third in 2023). The bull reads inference as always-on, recurring demand that underwrites recurring capex far better than episodic training runs did. The bear reads it as the most price-sensitive, most commoditizable workload, and the one most exposed to cheaper alternatives. Underneath both sits a return-on-investment problem. A February 2026 NBER study of about 6,000 senior executives found that 69 percent of firms use AI, yet nine in ten report no measurable impact on their own employment or productivity over the past three years; a 2025 MIT study put roughly 95 percent of enterprise generative-AI pilots at no measurable profit-and-loss impact. The honest balance, which the bear must not omit, is that the same NBER paper finds those executives expect a productivity boom over the next three years. The ROI gap is, on this evidence, a timing problem rather than a dead end. Whether the spend sustains long enough for that lag to close is the master variable for this stock.
There is one more contested thread: circular financing. NVIDIA committed more than $40 billion to AI equity deals in early 2026, with roughly $30 billion reported deployed into OpenAI (against an up-to-$100 billion framework ceiling), about $10 billion into Anthropic, and a stake in CoreWeave. Critics describe a loop: NVIDIA funds and supplies the labs, the labs commit hundreds of billions to clouds, the clouds buy NVIDIA GPUs. Press estimates put the interlinked total north of $800 billion and cite OpenAI on track to lose about $14 billion in 2026. Treat those last two figures as the bear’s thesis, not as audited NVIDIA accounting; they are press and commentary tier, corroborated across outlets but not verifiable from filings. My own back-of-envelope arithmetic, that the directly NVIDIA-funded slice of revenue is single-digit percent against $300 billion-plus of annualized data-center revenue, is an illustrative estimate, not a fact. The real structural risk in the loop is not literal round-tripping; it is concentration through the financing-dependent periphery, where a confidence wobble would crack first.
Company by company: NVIDIA and the chain that feeds and competes with it
Every name below ties back to NVIDIA exposure. Market caps are point-in-time, stamped June 22, 2026, and several are volatile or vendor-inconsistent (flagged where so). Group them by where they sit in the chain.
The anchor
NVIDIA (NVDA) - market cap around $5.10 trillion. The pure-play on AI compute: data-center GPUs, the NVLink/InfiniBand/Spectrum-X networking fabric, the CUDA software moat, full-rack systems, and a fast-growing sovereign and enterprise business. Bull: the indispensable scale leader, roughly 70 to 80 percent of accelerator revenue, mid-70s gross margin, about $97 billion free cash flow, net cash, trading cheap to its own history. Bear: peak-margin and peak-concentration economics, share leaking at inference, $119 billion of commitments that assume demand holds, China foreclosed, and a low multiple that re-rates hard if forward earnings fall.
The direct competitor
AMD (AMD) - around $880 billion. x86 CPUs plus the Instinct MI-series data-center GPUs, the only credible number two. Bull: the MI-series ramp and the ROCm software alternative give it the clearest path to share in a market where buyers crave a second source; marquee external wins (Oracle 50,000 MI450 from the third quarter of 2026, Meta 6GW, OpenAI 6GW) are real, and they skew to inference. Bear: still a distant second to CUDA, and on the numbers AMD carries the hardest-to-defend valuation in the whole set, a trailing P/E near 180, a forward P/E around 62, and a price-to-free-cash-flow over 100. That multiple needs flawless execution.
The suppliers and chokepoints
TSMC (TSM) - around $1.9 to $2.0 trillion. The sole leading-edge foundry and CoWoS packager for NVIDIA’s GPUs. Bull: an effective monopoly on cutting-edge logic and advanced packaging, sold out for years, with pricing power. Bear: the Taiwan concentration risk runs through the entire chain, and foundry capex is enormously cyclical.
SK Hynix (000660.KS) - around $1.3 trillion equivalent. The dominant HBM supplier, the gating component for every GPU. Bull: HBM leadership, sold out, with record memory margins on AI demand. Bear: peak-cycle memory pricing, rising HBM competition, and limited access for US retail (a thin OTC line only).
Micron (MU) - around $1.0 to $1.3 trillion. The third qualified HBM source and the US-listed memory play on the build-out. Bull: the HBM ramp lifts it out of commodity-memory volatility into a tighter, higher-margin product. Bear: memory is deeply cyclical and it trails SK Hynix in HBM share.
The ASIC enablers (partner and threat)
An ASIC is a chip custom-built for one job, which makes it cheaper and more power-efficient at scale than a general-purpose GPU, but useless for anything else. This is how the hyperscalers try to design their way around NVIDIA’s margin on their own steady workloads.
Broadcom (AVGO) - around $1.8 to $2.0 trillion. Custom AI ASICs (XPUs), networking and switch silicon, and VMware. Bull: the custom-silicon and AI-networking franchise is the primary way hyperscalers reduce NVIDIA dependence; first-quarter fiscal 2026 AI semis were $8.4 billion, up 106 percent, with a roughly $73 billion AI backlog. Bear: custom ASICs are lumpy and customer-concentrated, and the valuation prices in flawless execution.
Marvell (MRVL) - market cap disputed across vendors (tens to low-hundreds of billions; sources disagree widely). Custom AI silicon, optics and interconnect. Bull: optical interconnect and custom-compute exposure ride the same data-center wave; it guides to roughly $11 billion total fiscal 2027 revenue, with custom AI silicon a fast-growing subset (note: that $11 billion is total revenue, not AI-ASIC-specific). Bear: smaller scale, customer concentration, and a market cap that vendors cannot agree on, a sign of volatility.
The systems and OEM integrators
Supermicro (SMCI) - around $15 to $20 billion. AI servers and liquid-cooled GPU racks. Bull: a first mover in dense liquid-cooled racks, revenue scaling directly with NVIDIA shipments. Bear: thin margins, a prior accounting and governance scandal, and ferocious competition from Dell and the ODMs.
Dell (DELL) - around $265 billion. AI servers, enterprise infrastructure, PCs. Bull: enterprise relationships and scale make it a default integrator for NVIDIA AI systems. Bear: AI-server margins are thin and commoditized, and the legacy business drags growth.
The customers (each both buyer and threat)
Microsoft (MSFT) - around $2.8 trillion. Azure, plus the Maia in-house ASIC. Bull: Azure and Copilot are the deepest enterprise distribution of NVIDIA-powered compute. Bear: vast GPU capex with uncertain near-term ROI, and Maia plus the OpenAI dependence cut both ways. (We dug into that capex-and-ROI tension in why Microsoft stock dropped and whether it is losing the AI battle.)
Amazon (AMZN) - around $2.6 trillion. AWS, plus Trainium and Inferentia. Bull: AWS scale plus custom Trainium is the most credible owned-silicon hedge; Anthropic already runs more than 1 million Trainium2 chips. Bear: heavy AI capex pressures free cash flow.
Meta (META) - around $1.5 trillion. Social platforms, plus the MTIA accelerator. Bull: AI-driven ad targeting already monetizes the GPU spend, and the balance sheet funds the buildout. Bear: open-ended AI capex with no cloud revenue to directly offset it.
Alphabet (GOOGL) - around $3.8 to $4.5 trillion (sources vary). Search, Cloud, plus the TPU. Bull: the TPU stack plus Gemini is the most self-sufficient AI position, least dependent on NVIDIA; Google already owns an estimated 25 percent of global cumulative AI compute, mostly on its own TPUs. Bear: AI threatens core Search economics, and the antitrust overhang persists. For NVIDIA, Google is the clearest demonstration that a hyperscaler can route around the GPU at scale.
Oracle (ORCL) - around $530 to $610 billion (volatile). Database plus Oracle Cloud Infrastructure. Bull: the OCI GPU-cloud backlog reaccelerates a legacy franchise. Bear: the most fragile large buyer, with negative free cash flow, roughly $248 billion of not-yet-commenced lease commitments, and about half its capex debt-financed into a higher-for-longer rate regime.
CoreWeave (CRWV) - around $45 to $65 billion (highly volatile). A GPU-cloud “neocloud” renting NVIDIA accelerators at scale; NVIDIA is investor, supplier, and reference customer. Bull: the purest public bet on NVIDIA GPU demand, backed by NVIDIA itself, with a roughly $100 billion revenue backlog. Bear: heavy debt, single-supplier dependence, and a backlog resting on a handful of frontier-model tenants. This is the name where any financing-channel crack shows up first.
The competitive map: the moat, and the three ways it erodes
State the basis every time, because revenue share and shipment share do not reconcile. A hyperscaler ASIC that costs a fraction of a Blackwell GPU looks large in unit share and small in revenue share.
By revenue, the cross-house consensus for 2026 is NVIDIA roughly 70 to 80 percent, AMD roughly 5 to 8 percent, and hyperscaler custom silicon roughly 15 to 20 percent, in a total accelerator market above $200 billion. Houses cluster but disagree at the edges, so the honest framing is a range, trending down, not a single point. You will see “NVIDIA captures about 90 percent of AI accelerator spend” quoted widely; that figure is disputed and not corroborated as a clean 2026 number, so use the 70-to-80 revenue-share consensus instead.
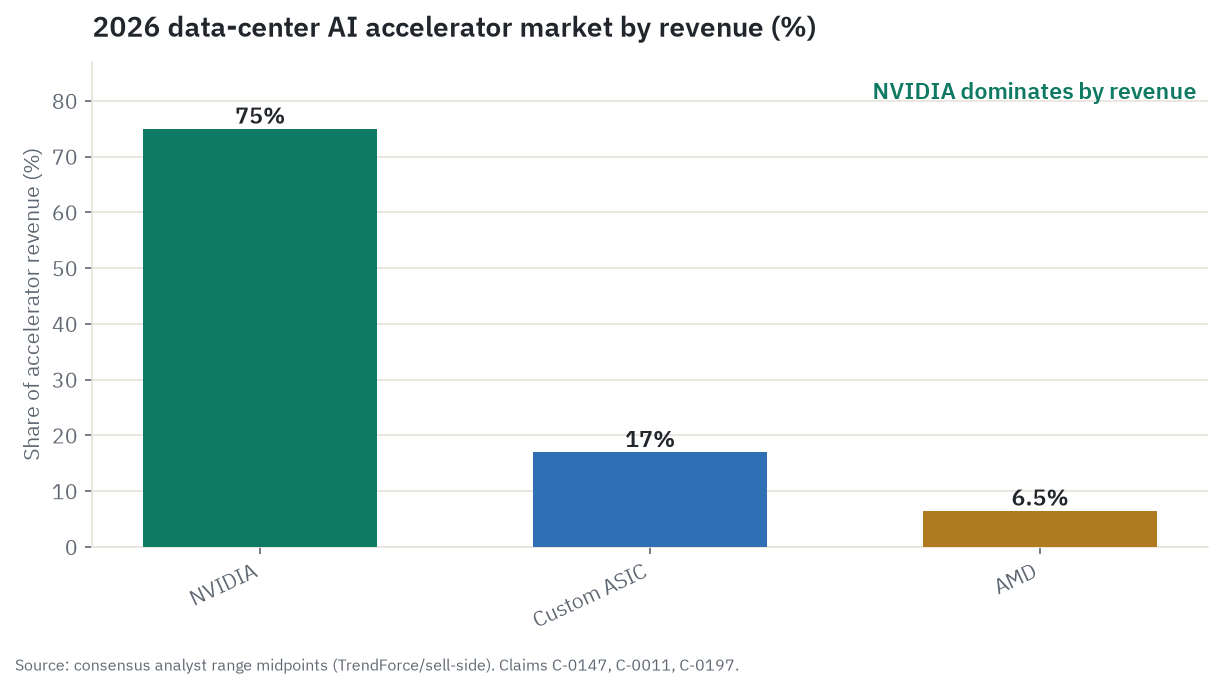
The moat is strongest at the top and weakest at the bottom of this list.
Most defensible: training plus the proprietary scale-up fabric. NVIDIA’s share of large-scale training is north of 90 to 95 percent, and the NVLink and InfiniBand lock-in for big training clusters is deep. Networking is a fast-growing, sticky layer (the $14.8 billion quarter, up 199 percent). This is where switching costs are highest.
Defensible but eroding: CUDA software. It remains the default developer ecosystem and the switching cost is real, but it leaks at the edges where a hyperscaler owns the workload end to end. OpenAI’s Triton compiles around the closed libraries, PyTorch’s compiler abstracts the backend, and AMD’s ROCm 7 is within roughly 10 to 30 percent of CUDA on many inference workloads.
Least defensible: high-volume, predictable inference. This is where custom ASICs optimize hardest and where share erodes first, and it is now roughly two-thirds of AI compute. The growth asymmetry is the real story: custom-ASIC shipments grew about 44.6 percent in 2026 against roughly 16.1 percent for merchant GPUs, nearly three times as fast, the first AI-era year custom silicon meaningfully outpaced GPUs. NVIDIA’s 2026 inference share is estimated at roughly 60 to 75 percent; one bearish source (New Street Research) projects a fall toward 20 to 30 percent by 2028, which should be read as one attributed scenario, not consensus, and weighed against the bull counter that NVIDIA is pushing Rubin, its Dynamo software, and Spectrum-X hard into inference.
The three erosion paths, then, are AMD’s merchant GPUs (clearest in inference-heavy external deals), the hyperscalers’ own ASICs eating internal workloads (Google TPU furthest along, AWS Trainium next, Microsoft Maia and Meta MTIA behind, with Broadcom and Marvell as the design enablers), and software abstraction loosening the CUDA grip on inference. Note one humbling lens: Google already owns about a quarter of cumulative installed AI compute on its own TPUs, which means NVIDIA’s flow share overstates its installed-base share at the largest buyers. The direction of share is down. The pace is the single biggest disagreement among analysts.
What the filings say
Everything in this section is from NVIDIA’s filings: the FY2026 10-K (filed February 25, 2026), the Q1 FY2027 10-Q (filed May 20, 2026), and recent 8-Ks. NVIDIA’s fiscal year ends in late January, so “FY2026” is the year ended January 25, 2026.
| Metric | FY2026 | FY2025 | Q1 FY2027 | Q1 FY2026 |
|---|---|---|---|---|
| Revenue | $215.938B (+65%) | $130.497B | $81.615B (+85% YoY) | $44.062B |
| Gross margin | 71.1% | 75.0% | 74.9% | 60.5% |
| Operating margin | 60.4% | 62.4% | 65.6% | 49.1% |
| Net income | $120.067B | $72.880B | $58.321B | $18.775B |
A few things to read off that table. Full-year FY2026 gross margin fell from 75.0 percent to 71.1 percent, depressed by the H20 China export-control charge; by Q1 FY2027 it had recovered to 74.9 percent as Blackwell became the bulk of revenue and the H20 hit lapped. Q1 FY2027 net income ($58.3 billion) actually exceeds operating income ($53.5 billion), because of large non-operating investment and interest gains. The two reportable segments tell the same lopsided story: Compute and Networking was $193.5 billion of FY2026 revenue (about 90 percent) against Graphics at $22.5 billion.
Cash generation is the standout. FY2026 operating cash flow was $102.7 billion against just $6.0 billion of capex (NVIDIA is fabless), implying free cash flow around $96.7 billion. Q1 FY2027 alone generated roughly $48.6 billion of free cash flow. About 80 percent of revenue converts to operating cash.
The balance sheet is net cash, even after a debt raise. Cash and equivalents were $13.2 billion at April 26, 2026, with a much larger marketable-securities portfolio on top (cash plus investments comfortably above $40 billion), against long-term debt of only $7.5 billion and zero commercial paper drawn. Then, as a subsequent event on June 18, 2026, NVIDIA completed a $25.0 billion seven-tranche senior notes offering. That roughly triples gross debt for a company that had carried almost none, and it most likely funds the enlarged buyback and commitments rather than operations. Capital returns are aggressive: $40.1 billion of buybacks in FY2026, $20.2 billion in Q1 FY2027 alone, and after a fresh $80.0 billion authorization in May 2026 the live buyback program exceeds $118 billion. Share count is actually falling, from about 24.4 billion to 24.2 billion over the year, as buybacks outpace stock-based-compensation dilution.
Two filing-grade risk disclosures deserve a holder’s attention. The first is customer concentration, and it is rising fast. In FY2026 one direct customer was 22 percent of total revenue and a second was 14 percent (against 12/11/11 percent in FY2025). By Q1 FY2027, three direct customers were 21 percent, 17 percent, and 16 percent of revenue, roughly 54 percent from three buyers, with accounts receivable even more concentrated (30/18/16 percent). NVIDIA also flags one large indirect AI customer buying through those direct customers. The second is the $119 billion of manufacturing, supply, and capacity commitments at April 26, 2026, of which $95 billion is due within the remainder of FY2027, plus $30 billion of multi-year cloud commitments and $27 billion of investment commitments. Inventory has built 2.5 times in a year to $25.8 billion, and there is a persistent $3.1 billion excess-purchase-obligation accrual. Read together, the $119 billion is management’s confidence made concrete: it is pre-buying TSMC, CoWoS, and HBM capacity at a scale that dwarfs its own balance sheet. The flip side is over-commitment risk, and the H20 episode (below) is the proof case that a demand or policy shift can strand it and force a multi-billion-dollar charge. The cancellable-and-reschedulable language is a partial cushion, not immunity.
The China hole is realized, not hypothetical. After the US required a license to export H20 chips to China in April 2025, NVIDIA took a $4.5 billion charge in Q1 FY2026 for excess H20 inventory and purchase obligations, and generated only about $60 million of H20 revenue under later licenses. China (including Hong Kong) revenue fell to $19.677 billion in FY2026 from $25.048 billion in FY2025, even as total revenue jumped to $215.9 billion. China’s share of revenue roughly halved to about 9 percent, and the 10-K states plainly that NVIDIA is “effectively foreclosed from competing in China’s data center compute market.” A small H200 license arrived in February 2026 with a 25 percent US import tariff and zero revenue to date, and it is uncertain whether China will even allow the imports.
On the legal front, frame the matters exactly as the filings and the tiering allow. China’s SAMR published a preliminary finding on September 15, 2025 that NVIDIA’s export-control compliance violated the terms of China’s 2020 approval of the Mellanox acquisition; the investigation is ongoing, with no final ruling or penalty, and China’s Anti-Monopoly Law allows fines of 1 to 10 percent of prior-year revenue as a statutory ceiling, not a prediction. Separately, NVIDIA’s 10-K confirms broad competition-regulator information requests across the EU, US, UK, China, and South Korea. The US DOJ has an open antitrust inquiry (reported around bundling and the Run:ai acquisition) and the EU Commission is in preliminary fact-finding on whether NVIDIA bundles GPUs with networking; both are open inquiries with no charges, no formal case, and no outcome. Nothing here should be read as a finding or a fine.
What the market is paying
All point-in-time, stamped June 22, 2026, and corroborated across vendors where possible.
The stock was around $210.69, for a market cap near $5.10 trillion, the most valuable company on earth and the single largest weight in the S&P 500 at roughly 7.9 percent. That weight cuts both ways for an index holder: anyone who owns an S&P 500 fund already owns a large, undiversified slice of NVIDIA, and because index and passive funds must hold it in proportion, a sharp NVIDIA drawdown drags the whole index down and can force mechanical selling that amplifies the move. The 52-week range is $142.03 to $236.54, so the price sits about 11 percent below its high and above both its 50-day moving average (around $209) and its 200-day (around $190), a constructive posture. The all-time-high close was $235.47 on May 14, 2026. The maximum drawdown from the peak is only about 11 percent, a shallow pullback by this stock’s own history (it fell more than 50 percent in the 2022 bear). The one-year total return is roughly 42 to 46 percent (a band across vendors), strong but well off the triple-digit returns of 2023 to 2024; the move is maturing. Year to date the stock is up roughly 10 percent on a price basis, a few points higher on total return (vendors disagree, so treat it as a range). Beta is 2.20, meaning the stock moves about twice the market, so any disappointment will be amplified.
Now the valuation, which is the heart of the “is it sane” question.
| Multiple | NVDA now | NVDA history | AMD (peer) |
|---|---|---|---|
| Trailing P/E | 32.3 | 3yr avg ~62, 5yr avg ~69 (peak ~139 in early 2023) | ~179 |
| Forward P/E | ~21 (one vendor ~23) | well above today through 2021-2024 | ~62 |
| PEG | 0.47 | n/a | 1.07 |
| EV/sales | ~20 | elevated vs history | ~23 |
| Price/FCF | ~43 | n/a | ~102 |
Read against its own history, NVIDIA trades cheap to itself. The trailing P/E near 32 is roughly half its three-year average and well below its five-year average near 69, and a fraction of the roughly 139 peak in early 2023. The reason is simple: earnings compounded faster than the price. Read against AMD, NVIDIA is the cheaper AI-compute name on a forward and growth-adjusted basis, despite being the dominant player; AMD’s multiples embed a steep catch-up assumption, while NVIDIA’s embed deceleration off a $120 billion-net-income base.
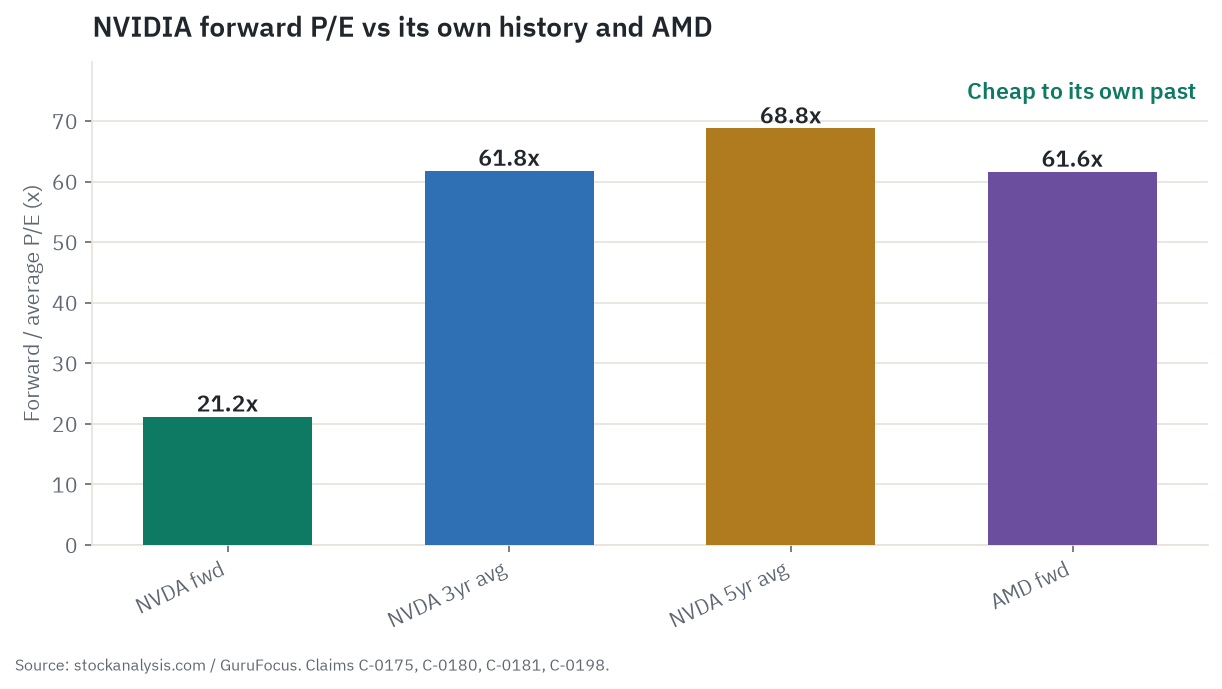
Here is the trap to keep in view. A forward P/E of 21 with a PEG of 0.47 does not mean the Street thinks the stock is a bargain. It means consensus is discounting a hard normalization off a peak base of $120 billion net income and 75 percent margins. If growth decelerates and margin reverts toward 71 percent or below on mix dilution, the cheap multiple re-rates against falling forward earnings, the classic peak-cyclical trap where a low P/E marks the top rather than a bargain. The cheap-looking multiple is a bet on durability, not a free lunch.
On ownership, institutions hold about 65 percent and were net buyers over the trailing year (roughly three times more inflows than outflows). Insider ownership is about 3.5 percent, almost entirely CEO and co-founder Jensen Huang, whose stake runs well over $170 billion; his selling is routine, pre-planned 10b5-1 diversification, a tiny fraction of his holdings, and should not be read as a signal. The sell-side consensus is Strong Buy, with a mean target around $309 and a range from a $180 low to a $500 high; targets are analyst opinion, not forecasts of fact.
What the crowd is saying
Treat this as signal about belief, not fact about the business.
News flow is warm to hot and demand-led. The dominant story is NVIDIA reframed at GTC 2026 as a full-stack AI infrastructure platform, with cumulative data-center revenue guidance raised toward $1 trillion through 2027, plus beat-and-raise quarters that prompted headlines calling the stock “remarkably cheap.” The cooling counter-current is China access and Jensen Huang’s own remarks on China’s AI progress, which briefly chilled coverage in late 2025. Retail sentiment is bullish but reactive: it swung to “extremely bullish” on very high message volume right after the May 2026 print, having dipped toward neutral in early December 2025 on the China comments. Because NVIDIA is a deep-float mega-cap, this chatter rides news rather than manufacturing it; there is no thin-float pump signature and the manipulation risk on the ticker itself is low.
The analyst disagreement is about magnitude, not direction. Across aggregators the rating mix is overwhelmingly Buy or better, with at most one to three holds and almost no sells, the smallest dissent you will see on a name this size. The target spread runs from roughly $180 to $500 against a price near $210, so the high implies more than +130 percent and the low implies roughly flat to down. That $300-plus spread on a mega-cap is the Street agreeing NVIDIA keeps the crown but disagreeing sharply on how much of the multi-year, trillion-dollar TAM lands in NVIDIA revenue versus leaking to custom silicon.
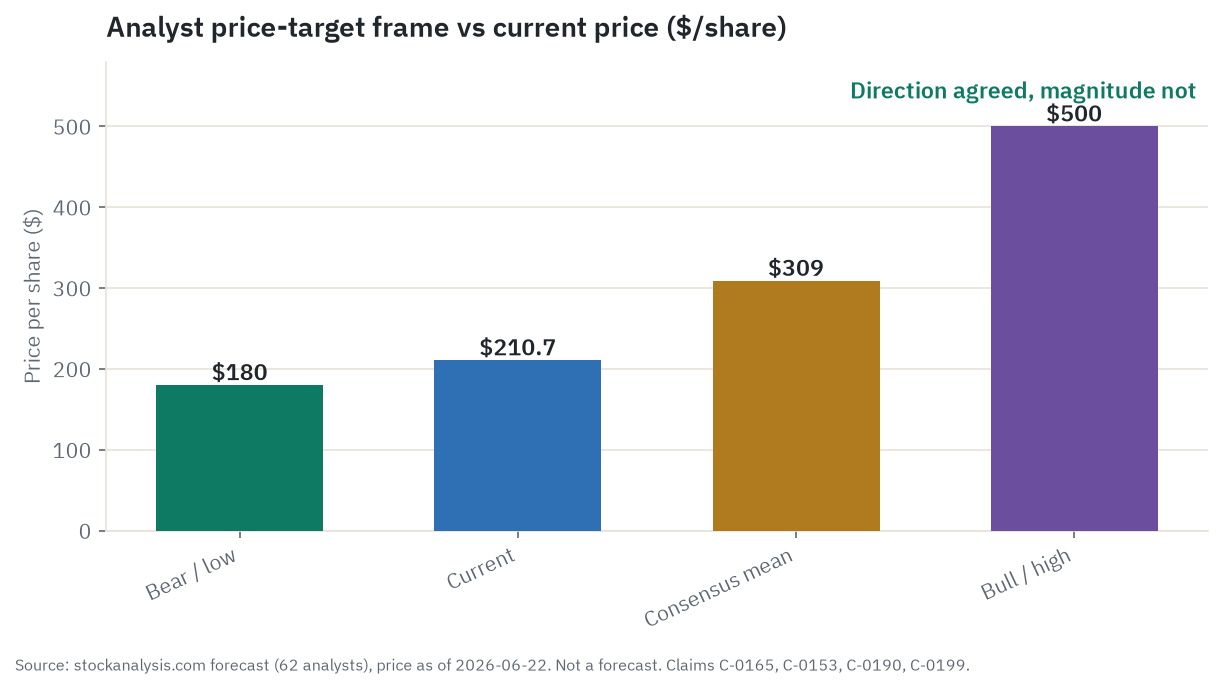
The narrative-versus-fundamentals read is where the useful tension sits. Where the crowd and the filings agree: NVIDIA’s roughly 70-to-80 percent dominance of accelerator revenue is real, so the loud bull story has genuine fundamental backing for once. Where they diverge sharply: the bull treats hyperscaler capex intent as clean end-demand, while the bear treats a meaningful slice as circular, vendor-financed, and cross-invested. The same datapoint (Big-Four 2026 capex up sharply) is weaponized by both camps. The honest read is that demand is real and large, but its quality, organic versus looped, is genuinely contested and cannot be resolved from sentiment. It is the single biggest open question separating the $500 bulls from the $180 bears. A second divergence: retail prices NVIDIA as a one-way AI proxy, while the analyst spread says the distribution of outcomes is wide. The crowd’s conviction is higher than the dispersion of professional targets justifies.
The economics: what governs the cycle
Two forces govern this cycle, one macro and one micro, and they pull in opposite directions.
Macro: the cost of capital reaches NVIDIA through its customers. NVIDIA itself is barely rate-sensitive; it is net cash and borrows almost nothing. The rate channel bites indirectly, through the cost of capital of the hyperscalers and labs whose capex is NVIDIA’s revenue. And the regime as of June 2026 is the opposite of the easing tailwind the AI trade enjoyed in 2024. The Fed held its policy rate at 3.50 to 3.75 percent at the June 17 meeting, the fourth straight hold, and the dot plot flipped hawkish (median end-2026 projection up to 3.8 percent, with markets pricing a possible hike rather than a cut). The 2026 inflation forecast was raised toward 3.6 percent, and the 10-year Treasury sits near 4.49 percent. A higher, stickier discount rate raises the hurdle rate on multi-year buildouts with uncertain payback and compresses the multiple the market pays for far-out AI earnings.
The buyers fund capex through three channels, in order of how binding the rate is. The self-funding channel (operating cash flow from the Big-Four core businesses) is the strongest brake-release and is nearly rate-insensitive; this is why the bull case held through a hawkish Fed. The debt channel is newly live: the buildout has outgrown internal cash, the cohort issued roughly $121 billion of bonds in 2025 (three to four times the prior norm) with $100 to $300 billion estimated for 2026, Alphabet’s long-term debt jumped from $10.9 billion to $46.5 billion and it sold a rare 100-year bond, and Oracle is the most levered case with roughly $248 billion of lease commitments and negative free cash flow. The equity and venture channel (the labs and neoclouds) is the most fragile, running on equity raises and private credit, exactly the longest-duration, least-profitable cash flows that get repriced when rates rise. The structural point: hyperscaler capex is real and cash-backed; lab and neocloud demand is sentiment-and-financing-backed, and that second layer is the thin ice.
Micro: the unit economics of a rack explain the pricing power. Take the NVL72, a cabinet of 72 GPUs that hyperscalers actually buy. A GB200 rack sells for roughly $3 million. The cleanest public teardown of the B200 GPU inside it puts production cost around $6,400, of which HBM memory is about 45 percent and HBM plus CoWoS packaging is roughly 62 percent. In other words, about 62 percent of the GPU’s hardware cost is value flowing straight to two external chokepoints, the HBM oligopoly and TSMC’s packaging monopoly, while NVIDIA adds the logic-die design (its own IP) and the system integration. That same B200 sells into systems at an implied $30,000 to $40,000 per GPU, an 80-percent-plus chip-level gross margin. The blended company margin (mid-70s) is lower than the bare-chip number because NVIDIA now ships more low-margin system content (networking, trays, cooling, ODM pass-through). NVIDIA holds this because the binding moat is at the software and networking layer, not the silicon it buys; HBM and CoWoS suppliers are chokepoints on supply but price-takers on value.
What could compress that margin: the custom-ASIC route-around (the sharpest risk, since hyperscalers building in-house chips explicitly avoid the 70-to-80 percent NVIDIA margin on the fast-growing inference workload), HBM cost inflation flowing through rather than being absorbed (a 20 percent HBM price rise adds roughly $580 per GPU; 12-layer HBM4 is expected above $600 a stack), CoWoS capacity normalizing (the supply-demand gap is set to narrow from about 20 percent to about 10 percent by end-2026, the point where scarcity stops underwriting pricing), system-mix dilution as more rack content ships at lower margin, and the China demand loss forcing discounted SKUs.
One more governor, increasingly the binding one: power. The constraint on AI data centers has shifted from chips and capital to the physical electrical layer, transformers, switchgear, and grid interconnection. High-voltage transformer lead times now run four to five years, US interconnection waits run four to seven years, and roughly half of planned 2026 US data-center capacity is delayed or canceled. (We trace who wins the electrical build-out in the AI power bottleneck.) Microsoft’s Satya Nadella has said the company has GPUs “sitting in inventory” it cannot install for lack of power, the cleanest evidence that power, not silicon, paces near-term deployment. Bernstein’s Stacy Rasgon calls the infrastructure bottleneck the single biggest risk to NVIDIA’s forward estimates. Power delays do not shrink the TAM, but they push orders into 2027 and 2028, make revenue timing less predictable, and, if they stretch while ROI stays absent, can convert deferral into demand softening.
Durability and synthesis
Pull the threads together and the durability question splits cleanly, which is usually the honest answer.
What is durable. The franchise is real and rests on filing-grade facts: roughly 70 to 80 percent of accelerator revenue, mid-70s gross margin, about $97 billion of free cash flow, a net-cash balance sheet, $120 billion of net income, and a moat at the training-plus-networking layer that is genuinely sticky. The demand base is broadening from a handful of hyperscalers toward sovereign and enterprise buyers (the Hyperscale and ACIE split is now roughly even). None of that depends on a single narrative, and a patient owner can hold this as a structurally advantaged compute franchise.
What is fragile. Almost every load-bearing word in the bull thesis depends on the pace of buyer spending holding. The moat leaks where the market is growing fastest (inference and custom ASICs), and the direction of share is down. Concentration is severe and rising into customers with no proven firm-level ROI yet. The $119 billion of commitments assumes demand holds, and the H20 charge is the proof case for how that strands. China is a structurally lost slice. The macro regime flipped against the trade, and the financing-dependent periphery (labs, neoclouds, Oracle) is the thin ice. The valuation is a bet on durability, with beta 2.20 to amplify any miss.
So is the boom durable? The business is. The pace of the spend is the fragile part. The most likely path is neither a collapse nor a moonshot: continued growth at a decelerating, more cyclical cadence, with NVIDIA staying the scale leader as share drifts gently from the mid-70s toward the high-60s or low-70s and absolute dollars still rise, while the market keeps paying a modest multiple because it keeps pricing the deceleration. The thing to watch is not the next product demo. It is the first “plateau” word from a hyperscaler, the first sequential decline in NVIDIA’s data-center revenue, and the health of the financing periphery.
The five-year outlook (bull / base / bear)
Everything below is forward-looking and labeled an estimate. The scenario valuations are illustrative arithmetic, base, bull, and bear earnings paths multiplied by a stated multiple band, not price targets and not advice. Four variables decide where NVIDIA lands, and every scenario is just a different setting of them: AI capex durability (the size of the pie), market share by workload (the moat), gross margin (pricing power), and the valuation multiple (the re-rate).
| Horizon | Base case | Bull / bear spread | Dominant factor |
|---|---|---|---|
| 6 months | Up or sideways. Q2 FY27 guided to $91B +/- 2% (no China DC compute assumed); GB300 and Rubin ramping. Growth still strong but the YoY rate steps down off +85%. | Bull: a clean beat-and-raise, margin held near 75%, re-rates toward 25 to 26x. Bear: a first sequential DC-revenue wobble or any “digesting capacity” language repunishes the complex; beta 2.20 amplifies. | Catalysts and cycle |
| 1 year | Revenue meaningfully higher on the Rubin ramp and the $119B commitment backstop, but the growth rate normalizes; margin mid-70s to low-70s. | Bull: full-year DC growth holds above 40 to 50%, margin stays mid-70s, share stable, EPS compounds and the multiple expands. Bear: a capex-plateau call plus financing-channel tightening triggers the first deceleration scare, margin drifts to ~71%, the multiple compresses on falling forward EPS. | Capex revisions, margin, inference share |
| 3 years | Earnings materially above FY2026 at a decelerating, more cyclical cadence; still the scale leader, share drifting from ~75% toward the high-60s/low-70s as ASIC and AMD take inference. | Bull: the inference TAM is so large that a falling share is still rising dollars; margin defended by Rubin, Dynamo, and NVLink lock-in. Bear: ROI disappointment ends the land-grab; a 2-to-4-quarter capex air-pocket strands part of the $119B (the H20 playbook); share leaks faster. | Share trajectory plus ROI proof |
| 5 years | A structurally larger, lower-growth, higher-cyclicality compute franchise; toll-booth economics persist but the growth rate and share normalize. | Bull: AI is a genuine general-purpose platform shift and NVIDIA is the durable backbone at scale, multiple re-rated higher. Bear: a Cisco-1999 re-rate (Cisco was the indispensable supplier of the late-1990s internet build-out and kept its franchise, but once buyers stopped spending its stock never again reached its 2000 peak), indispensable infrastructure whose buyers paused, leaving a peak-multiple memory. | Structural drivers |
Bull - durability proven, the pie grows faster than the share leaks. AI capex compounds as inference becomes recurring, cash-backed spend and sovereign and enterprise broaden the base; NVIDIA holds 70-percent-plus revenue share because the dollar TAM grows faster than rivals take it; margin holds mid-70s on Rubin, NVLink, and Dynamo lock-in plus ASP pass-through; and the market re-rates the multiple back toward the mid-20s as durability is proven. Illustratively, if forward earnings power roughly doubles over the window and the market pays a 25-to-28x multiple, the equity value is materially above today’s roughly $5.1 trillion. To put a number on it the way the bear case carries one, that path lands in the neighborhood of the sell-side high of about $500 a share, which from $210.69 would be roughly +130 percent, broadly in line with our own model’s bull output of about +122 percent and a market cap on the order of $11 to $12 trillion. Read that as illustrative arithmetic, base earnings times a stated multiple, not a price target and not advice. What has to be true: firm-level ROI shows up before experimentation budgets are cut. What most likely breaks it: ROI fails to materialize for another year and the land-grab ends.
Base - growth normalizes, NVIDIA stays the leader, the multiple stays modest. Capex grows but decelerates as ROI scrutiny rises and debt-financing friction bites; share drifts from about 75 percent toward the high-60s or low-70s as ASIC and AMD take inference, but absolute dollars keep rising; margin normalizes from about 75 percent toward the low-70s on mix dilution and CoWoS normalization; and the multiple stays roughly where it is (low-20s forward) because the market keeps pricing deceleration. Illustratively, forward EPS grows at a normalizing rate and the equity value grinds higher roughly with earnings, the multiple flat. What breaks it down: a two-to-four-quarter capex pause. What breaks it up: a couple of clean beats that kill the deceleration fear and re-rate the multiple.
Bear - a confidence wobble crystallizes through financing. This does not require the moat to break, only the pace of spending to pause, which semiconductor history says happens roughly every cycle. One Big-Four hyperscaler uses “plateau” or “digesting capacity” language on a call; the market repunishes the AI complex; the equity and private-credit channel funding OpenAI, Anthropic, xAI, and CoreWeave tightens; a marquee lab raise stalls or down-rounds; CoreWeave’s roughly $100 billion backlog quality gets questioned; orders push right; and NVIDIA prints its first sequential data-center revenue decline of the cycle. Share leaks at inference accelerate, margin reverts toward 71 percent or below on mix and discounted SKUs, part of the $119 billion becomes a write-down, and the hawkish rate regime is the accelerant. The cheap P/E re-rates against falling forward EPS, beta 2.20 amplifies the drawdown. Illustratively, impaired forward EPS times a de-rated mid-teens multiple puts equity value well below today’s roughly $5.1 trillion. This is a re-rate, not a wipeout: NVIDIA still earns money in this world. The China hole (roughly 9 percent of revenue, already foreclosed) and the customer concentration (three customers at 21/17/16 percent) make the downside more brittle.
Catalyst timeline. Near term: Q2 FY2027 earnings (guided $91 billion, no China DC compute assumed), the GB300 ramp through the first half of 2026 and Vera Rubin mass shipments in the fall, AMD’s MI450 volume (Oracle from the third quarter of 2026, Meta and OpenAI’s first gigawatt in the second half), each Big-Four quarterly capex update (the revision, not the level, is the canary), and any China H200 license that actually generates revenue. Multi-year: the CoWoS supply-demand gap narrowing toward 10 percent (where scarcity stops underwriting pricing), inference crossing further past two-thirds of compute (shifting the mix toward the least-defensible layer), the migration of hyperscaler funding from cash to debt into a higher-for-longer regime, and the ROI verdict on whether the predicted productivity boom actually arrives.
Companies to watch (bull / base / bear)
The watch-list, grouped by which scenario each name signals. The bear sits next to every bull on purpose.
NVIDIA (NVDA) - the anchor, at a forward P/E near 21 after the run to $5.1 trillion.
- Bull: durability proven, share holds 70-percent-plus on a growing pie, margin defended mid-70s, multiple re-rates toward the mid-20s.
- Base: steady but decelerating growth, share drifts toward the high-60s/low-70s, margin toward the low-70s, multiple flat, equity grinds up with earnings.
- Bear: a capex pause prints a sequential DC decline, margin reverts toward 71 percent, the cheap multiple re-rates against falling forward EPS (the consensus low near $180 implies roughly -15 percent), and part of the $119 billion becomes a write-down.
- Watch: the first hyperscaler “plateau” word, sequential DC revenue, gross-margin trajectory, the $119 billion commitment and inventory accrual, and any China H200 revenue.
The demand tells (capex direction). Microsoft, Amazon, Meta, Alphabet: watch each quarterly capex guidance revision. The first downward revision or “digesting” comment from any of them is the single highest-signal canary, far more than the absolute level. Each is also building its own silicon (Maia, Trainium, MTIA, TPU), so they are the bull “deep distribution” case and the bear “route-around” case at once.
The share-leak tells (ASIC and AMD). AMD’s design-win conversion (the Oracle, Meta, and OpenAI ramps actually shipping) and the custom-ASIC ramps (Google TPU, AWS Trainium, Microsoft Maia, Meta MTIA) read the inference share leak. Broadcom and Marvell, the ASIC enablers, are effectively the bear-for-NVDA names; watch Broadcom’s AI backlog. AMD’s own bear is its valuation, the richest in the set.
The supply-chain tells (pricing power). TSMC CoWoS bookings and the supply-demand gap (narrowing toward 10 percent) read both demand and the durability of pricing power. SK Hynix and Samsung HBM guidance and HBM4 pricing read margin pass-through; an HBM glut would flag a demand air-pocket. Memory and foundry carry peak-cycle pricing, so the bear here is a demand pause flipping scarcity into glut.
The financing-periphery tells (where it cracks first). CoreWeave and Oracle: backlog quality, bond spreads, and free cash flow. The financing periphery cracks before the cash-funded core, so a down-round or stalled raise at a frontier lab, or widening hyperscaler bond spreads, is the earliest bear confirmation.
Risk controls
This is framing, not advice. Ranked roughly by how likely each is to bite in the near term.
- Valuation and momentum reversal. A forward P/E near 21 looks cheap, but it is cheap because the market is pricing a hard deceleration off peak earnings. If growth and margin disappoint, the low multiple re-rates against falling forward EPS, and beta 2.20 amplifies it. This is the peak-cyclical trap.
- A capex-pace pause. The single most likely “this goes wrong” path is a confidence wobble about returns that crystallizes through the financing periphery, ending in NVIDIA’s first sequential data-center revenue decline of the cycle. It does not require the moat to break, only the pace of spending to pause for two to four quarters, which history says happens roughly every cycle.
- Customer concentration plus unproven ROI. Three customers are more than half of revenue, into demand that has shown no firm-level ROI yet (the NBER and MIT studies). The same NBER study expects a boom ahead, so this is a timing risk, but a real one.
- Share erosion at inference. Custom ASICs are growing nearly three times as fast as merchant GPUs, in the workload that is now two-thirds of compute and the least defensible layer for CUDA.
- The $119 billion commitment. Pre-bought capacity that assumes demand holds; the H20 charge shows how a demand or policy shift strands it.
- China. Roughly 9 percent of revenue is already foreclosed, the SAMR/Mellanox matter is a live preliminary finding (no ruling), and Beijing is steering customers to domestic competitors.
- Supply concentration. Both fabrication and CoWoS packaging route through Taiwan, with no near-term substitute. A Taiwan disruption is an existential single-point-of-failure risk.
- Macro. A higher-for-longer rate regime raises the hurdle rate on the debt-funded slice of the buildout and compresses the multiple on far-out AI earnings.
What would change the thesis, in either direction: ROI evidence inflecting (bullish) versus another year of “no firm-level impact” (bearish); capex guidance raised (bullish) versus the first downward revision (bearish); NVIDIA share stabilizing versus a visible inference-share loss or a sequential DC decline; and margin holding the mid-70s versus drifting below 71 percent.
Methodology, sourcing, and data-quality flags
This piece was built from parallel research streams: the value chain and supply chain, product and technology, the competitive map, demand drivers, policy and regulation, adjacent markets, the SEC filings, market action and valuation, sentiment, macro and micro economics, and a five-year forward outlook, plus an adversarial skeptic pass and a compliance pass. Every load-bearing figure traces to an entry in the run’s claims ledger with a source and a tier. The source hierarchy, in order of weight: primary (NVIDIA’s FY2026 10-K, Q1 FY2027 10-Q, and 8-Ks; the FY2026 and Q1 FY2027 CFO commentary; the Federal Reserve; the NBER study; CoreWeave’s 8-K); analyst (TrendForce, Gartner-cited, Epoch AI, SemiAnalysis, Bernstein, market-data aggregators); press (reputable trade and financial coverage); and estimate (model-computed figures). The ledger holds 189 load-bearing claims; the verifier pass left 183 verified, 4 disputed, and 2 unverified (both the author’s own illustrative estimates, never upgraded to fact).
Point-in-time note: every price, market cap, and valuation multiple is stamped to June 22, 2026 (NVDA around $210.69, market cap near $5.10 trillion). These figures move fast and may be materially stale by the time you read this.
Data-quality flags:
- Live price, market cap, and multiple set: point-in-time and time-sensitive (NVDA ~$210.69 / ~$5.10T at June 22, 2026). Peer market caps are vendor-sourced ranges; Marvell, Oracle, and CoreWeave are especially volatile and vendor-inconsistent, so they are shown as ranges, not points.
- Market-share figures are basis-dependent. Shipment/unit share (GPU ~69.7 percent vs ASIC ~27.8 percent, TrendForce) differs from revenue share (NVIDIA ~70-80 percent). Training share (>90-95 percent) and inference share (eroding first) diverge sharply. The basis is stated every time.
- NVDA share of AI accelerator spend (the ~90 percent figure) is DISPUTED and not corroborated as a clean 2026 point. The article uses the verified ~70-80 percent revenue-share consensus instead, trending down.
- Forecasts are forecasts, not facts. The $500 billion Blackwell+Rubin visibility figure is management’s “visibility,” not booked backlog. The 2028 inference-share fall to 20-30 percent is one attributed scenario (New Street Research), not consensus. The 2026 hyperscaler capex aggregates (~$600B to ~$725B) and Marvell’s ~$11B FY27 guide are attributed projections; Marvell’s $11B is total revenue, not AI-ASIC-specific.
- YTD return is a definition difference (~+10 percent price-only vs a few points higher on total return), recorded as a range, not a point.
- Legal and regulatory matters are open inquiries. The China SAMR/Mellanox finding is preliminary with no ruling or penalty. The US DOJ and EU Commission matters are open inquiries with no charges and no outcome. No violation, fine, or remedy is stated as fact; the AML 1-10 percent and EU 10 percent figures are statutory ceilings, not predictions.
- Circular-financing figures (>$800B interlinked, OpenAI ~$14B 2026 loss) are press/commentary tier, corroborated across outlets but not audited NVIDIA accounting, and are framed only as the bear’s thesis.
- Own-estimate arithmetic (NVDA hardware share of capex; indirectly NVDA-funded revenue) is the author’s illustrative estimate, labeled as such, never a fact.
- Per-rack unit economics (rack ASPs, the ~$6,400 B200 BoM, the ~80 percent chip margin) are analyst estimates and derived models; NVIDIA does not publish a rack BoM or per-SKU margin.
- TSMC Arizona $465B / 11-fab framework is a reported framework/plan, not realized capex; the primary-sourced number is TSMC’s board-approved “not more than $20 billion” Arizona injection.
Key sources: SEC EDGAR (NVDA CIK 0001045810) FY2026 10-K, Q1 FY2027 10-Q, the June 18, 2026 $25B notes 8-K, and the FY2026/Q1 FY2027 CFO commentary; the Federal Reserve June 17, 2026 FOMC decision and SEP; NBER “Firm Data on AI” (w34836) and MIT NANDA; Epoch AI and SemiAnalysis (rack and B200 economics, cumulative compute); TrendForce (CoWoS, HBM, shipment share); Gartner-cited inference share; IEA and DOE/LBNL (power); CoreWeave Q1 2026 8-K; stockanalysis.com, companiesmarketcap.com, MarketBeat, and macrotrends for live price, market cap, multiples, and analyst targets; AMD, Broadcom, and Marvell filings and press for the competitive map; and reputable trade and financial press (Tom’s Hardware, Futurum, CNBC, Bloomberg, Fortune, Reuters) for capex guides, the circular-financing narrative, and product detail.
Prepared June 22, 2026. Figures are point-in-time and will change. This is research and analysis for educational purposes, not investment advice, not a recommendation, and not a solicitation. NVDA is a high-beta semiconductor stock tied to a single AI-capex cycle and can fall sharply. Verify all figures independently and consult a licensed financial advisor before making any decision.