
Research date: June 21, 2026 | OSINT market research on Microsoft (MSFT, Nasdaq), a single-stock deep dive, with all prices in USD and stamped to the last close.
Important disclaimer. This is OSINT-based research and educational analysis, not investment advice. I am not a financial advisor. Nothing here is a recommendation to buy or sell any security, and the five-year scenarios below are illustrative, not price targets. Mega-cap AI infrastructure spending is a young and deeply cyclical thing; the capex, depreciation, and AI-demand numbers that drive this whole story can roll over faster than anyone expects, and that risk cuts both ways. Market caps, prices, valuation multiples, and market-share figures are point-in-time (June 21, 2026), press-reported where noted, and move fast. Do your own due diligence and consult a licensed advisor.
Companion tool - jump to the interactive dashboard to sort, filter, and search the comparison set, read each company’s bull and bear one-liner, and check the small tier leaderboard. The money-flow map itself is the inline diagram in How the money flows, not in the dashboard.
TL;DR
Microsoft fell from a $542.07 closing high on October 28, 2025 to a $356.77 trough on March 27, 2026, about 34 percent peak-to-trough on a closing basis, and at the $379.40 close on June 18, 2026 it was still down roughly 30 percent. That is a brutal move for a near-$3-trillion company, and it happened while Alphabet rose about 38 percent and the Nasdaq-100 rose about 17 percent over the very same window, so this was not the AI complex selling off. It was Microsoft, and to a lesser degree Meta, getting singled out. Here is the answer to the first question a worried holder asks: almost the entire drop is the market re-pricing the multiple, not cutting the earnings. Forward price-to-earnings fell from about 32 times to roughly 20 to 21 times (the cheapest in about three years) while consensus earnings estimates actually rose (about $16.84 for FY26 and $19.35 for FY27). What the market re-priced is the bill: about $190 billion of calendar-2026 capital spending, depreciation growing about 55 percent year over year while the cloud revenue it supports grows about 29 percent, and a Microsoft Cloud gross margin sliding from 69 percent to 66 percent. On the second question, whether Microsoft is losing the AI battle, the honest verdict is mostly no at the level the headlines mean, but with real exceptions. Azure grew about 40 percent and led Amazon’s AWS at about 28 percent; Microsoft has the deepest enterprise distribution of any AI vendor (more than 20 million paid Copilot seats, a $627 billion contracted backlog). It genuinely trails in three narrower places: the frontier model layer (its partner OpenAI’s enterprise API share has fallen), the consumer assistant (soft data, and immaterial to the profit-and-loss), and its own custom chips. The single risk that most decides the next year: whether depreciation keeps outrunning AI revenue long enough to force a cut to those forward earnings estimates, because if it does, 20 times stops being cheap.
Explore it yourself: the interactive dashboard
Use the dashboard to work the comparison set (Microsoft, Alphabet, Amazon, Meta, plus the private anchors OpenAI and Anthropic) without leaving this page. It is a sortable, searchable comp table: sort or filter by any score, type in the search box to find a company, read each company’s bull and bear one-liner inline, and check the small leaderboard that tallies the set by tier. It does not contain the money-flow or supply-chain map; for that, read the inline diagram in How the money flows below, which traces demand through the segments, the capex, the chip-and-memory inputs, and back out as depreciation.
Open the dashboard in a full screen
Prefer a spreadsheet? Download the Excel scoring model with the comparison table and the reader-adjustable scoring weights, so you can re-sort and flex the weightings yourself.
The hook: a $3-trillion company that fell like a small-cap
For most of the last decade Microsoft was the calm one. A five-year beta around 1.10 (beta measures how much a stock swings versus the broad market, where 1.0 means it moves roughly in line, so 1.10 is only a touch jumpier than the index), a fortress balance sheet, a stock that mostly went up and to the right. Then FY26 turned violent. Off the October 2025 peak, Microsoft lost about a third of its value, and its worst single day was a 9.99 percent drop on January 29, 2026, the reaction to the FY26 second-quarter print. That was Microsoft’s worst day since the March 2020 COVID crash. One day erased roughly $357 billion of market value, more than the entire market cap of most companies in the S&P 500.
The paradox the rest of this piece resolves is that the business underneath did not break. In the quarter that triggered the worst of it, Azure was still growing about 39 to 40 percent. Revenue beat, earnings beat. Management said its AI business had passed a $37 billion annualized revenue run-rate, up about 123 percent (that is a management framing, not an audited line, and we will pull it apart later). So how does a company growing its cloud at 40 percent have its worst quarter since the financial crisis?
Think of it like a utility that decides to build a power plant before the town shows up. The plant costs a fortune today, the meter readings (depreciation, the slow accounting bleed of a giant asset) start immediately, and the customers, the revenue that justifies the plant, arrive over the next several years. For a while the financials look worse, not better: huge cash out the door, rising depreciation eating into margins, and a promise that the demand is coming. The market loved that promise when it was paying Microsoft 32 times earnings. At 20 times, it wants to see the town arrive and pay the electric bill. That is the whole fight, and we will drop the power-plant image here and use the actual numbers from here on.
This article answers the two questions a Microsoft holder is actually asking. First, why did the stock drop so much? Second, is Microsoft losing the AI battle? We take both seriously, and we let the evidence falsify the scary version of each as readily as confirm it.
Why the stock dropped: a decomposition
Let us take the first operator question head-on and weight each candidate cause with evidence rather than vibes.
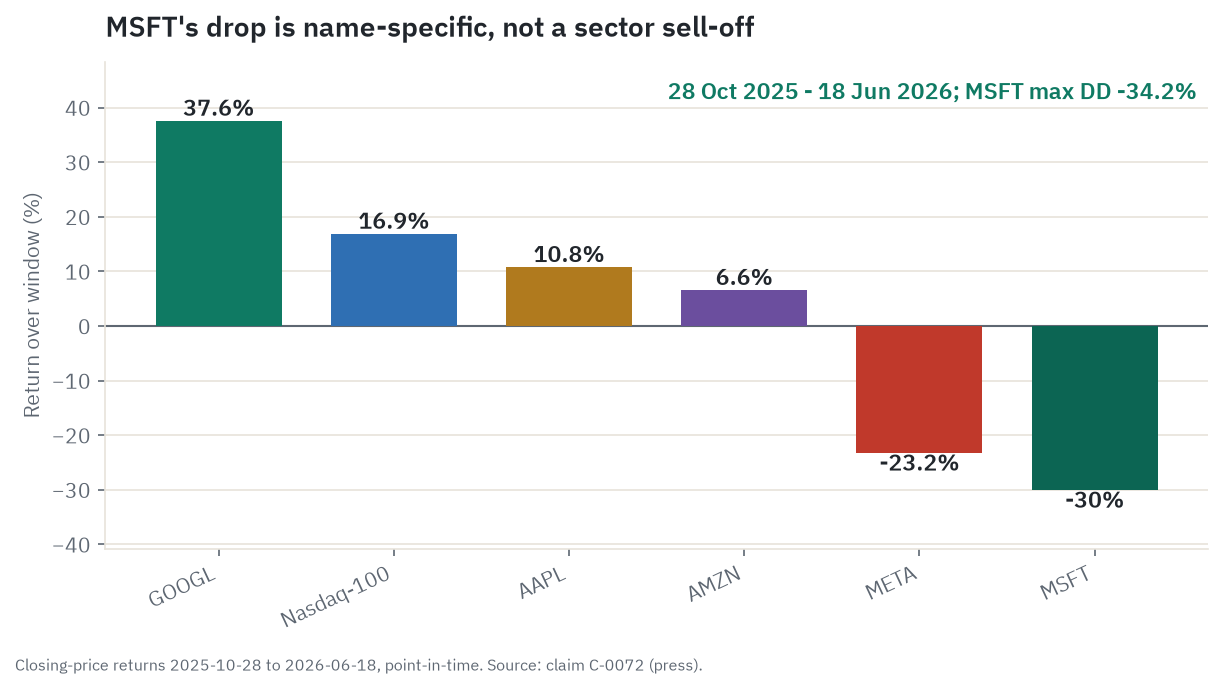
The window and the magnitude. Microsoft topped at a $542.07 close on October 28, 2025, the day before its FY26 first-quarter print, then bled lower to a $356.77 close on March 27, 2026, a 34.2 percent peak-to-trough decline on a closing basis. It has bounced weakly to $379.40 (June 18, 2026), still down 30 percent from the peak. These are point-in-time figures computed from price history, and they move fast. Year to date the stock is down about 21.5 percent, and over one year about 20.5 percent. Microsoft is one of the very few mega-caps with a negative one-year return.
Was it a sector sell-off? No. This is the single most clarifying fact in the whole story, so anchor on it. Over the identical window, Alphabet rose about 38 percent, Amazon rose about 7 percent, Apple rose about 11 percent, and the Nasdaq-100 itself rose about 17 percent and made new highs. Only Meta also fell, about 23 percent. So the popular explanation, that “the whole AI-capex complex sold off,” does not survive contact with the data. Alphabet is spending on AI infrastructure just as aggressively as Microsoft, and the market paid up for it while it punished Microsoft. The drop is name-specific. It is shared only with Meta, and for a different reason. That tells you the cause is something the market sees in Microsoft (and Meta) specifically.
Was it a missed quarter? No, the opposite. Here is the part that confuses people. The catalyst quarter, FY26 Q2 (reported January 28, 2026), was a beat. Revenue came in at $81.27 billion against a roughly $80.27 billion expectation; adjusted earnings of $4.14 beat $3.97. And the stock fell 9.99 percent the next day anyway. The market punished the Azure deceleration, from about 40 percent to about 39 percent, against a backdrop of soaring capital spending. The next quarter, FY26 Q3 (April 29, 2026), was the same pattern in slow motion: every headline number beat, and the stock still fell about 3.9 percent because the roughly $190 billion capex guide (against a roughly $155 billion consensus) and a $25 billion component-cost shock overrode the beat. The through-line is that the market stopped paying a premium for AI growth it now wants to see earn its keep.
So what actually drove the 30 percent? Almost all of it is multiple compression, not an earnings cut. This is the core of the answer.
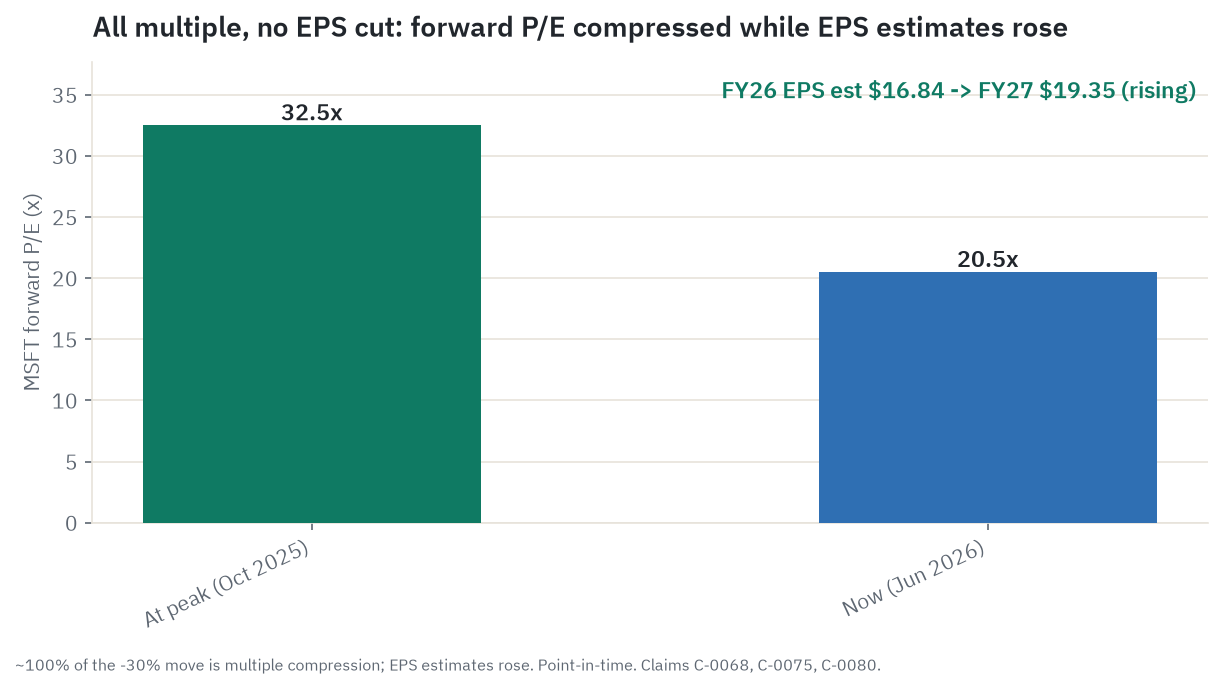
Two terms first, because they do the heavy lifting. A company’s “earnings” is the actual profit. The “multiple,” or price-to-earnings ratio, is how many dollars investors will pay for each dollar of those profits. A stock can fall two ways: the earnings can drop, or investors can decide each dollar of earnings is worth less and pay a lower multiple for the same profit. They are very different. An earnings drop says the business is getting worse. A multiple drop says investors changed their mind about how much the business is worth, often because they got more worried about the future.
Microsoft’s drop is overwhelmingly the second kind. The forward multiple de-rated from about 32 to 33 times at the peak to roughly 20.5 times now. Over the same stretch, consensus earnings estimates rose: FY27 consensus ($19.35) sits above FY26 ($16.84). Earnings were a tailwind, and the entire move is the market re-rating the multiple on doubt about AI return on investment, capex, and depreciation. (One honest caveat on the precise figure: the “100 percent multiple compression” math leans on the peak multiple being about 32 to 33 times. If the true peak was nearer 28 to 30 times, the split softens toward roughly 90 percent. The robust claim, which does not depend on a decimal, is that estimates rose, so the drop is overwhelmingly a re-rating.)
What, specifically, did the market re-price? The bill for the buildout. Three numbers, all from the filings:
- Capital spending of about $190 billion for calendar 2026, up roughly 61 percent year over year. Of that, about $25 billion is not extra capacity at all; it is pure component-price inflation, mostly memory chips (DRAM contract prices reportedly rose about 95 percent quarter over quarter early in 2026) that spiked in price. Whether that $25 billion recurs is a real question, and the honest answer is mixed: memory is historically a cyclical commodity that swings back to oversupply, so the price spike itself should ease as new capacity comes online rather than inflate every future year at the same rate. But there is a one-way catch. The inflated 2026 prices get capitalized into the depreciable base, so even if memory normalizes in 2027, the expensive 2026 vintage keeps depreciating at the high price for years. The spike is plausibly temporary; its depreciation tail is not. And about two-thirds of the capex goes into short-lived assets, GPUs and servers with a two-to-six-year life, not the long-lived buildings.
- Depreciation growing about 55 percent year over year (pure depreciation expense of about $9.0 billion in the March 2026 quarter), while Microsoft Cloud revenue grew about 29 percent. Depreciation is the accounting way of spreading the cost of those GPUs and datacenters over their useful life. When it grows faster than the revenue those assets earn, margins compress mechanically.
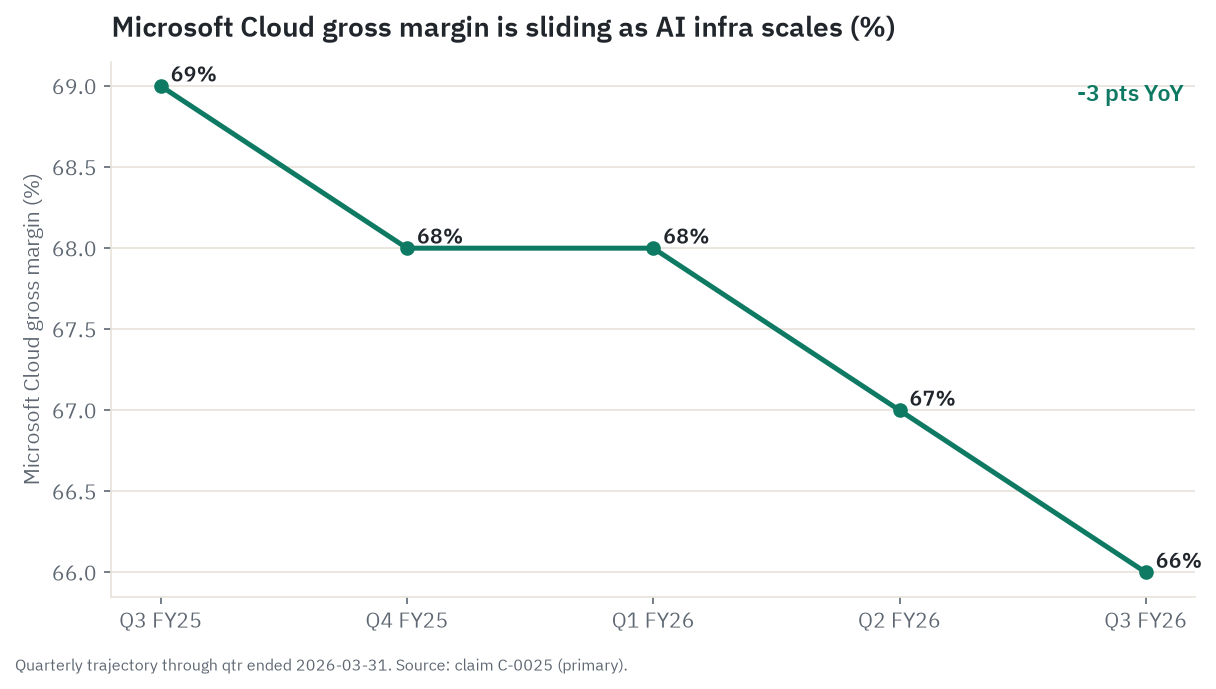
- Microsoft Cloud gross margin sliding from 69 percent to 66 percent year over year, and free cash flow declining as the capex eats the operating cash flow.
So the market’s verdict, translated: “We were paying 32 times for a company we thought would keep its high margins and grow into a clean, cash-generative AI franchise. Now we see $190 billion a year going out the door into assets that lose value fast, margins sliding, and we are not yet sure the return clears the cost of capital. We will pay 20 times until you show us it does.” That is a re-rating of the premium, not a verdict that the business is broken.
A rough, hedged attribution of the drop, labeled an estimate: of the roughly 30 percent decline, the overwhelming majority, call it 90 to 100 percent, is multiple compression on capex and depreciation and AI-ROI doubt. Earnings estimates were a small positive offset, not a drag. Macro and rates were a minor ambient factor at most (the 10-year Treasury near 4.5 percent was not the trigger, since Alphabet rose in the same rate environment). Rotation out of AI names is falsified by Alphabet’s gain. The sole genuinely company-specific worry that the multiple is pricing is the one the bear case lives on: that the forward earnings estimates themselves are too high, and a depreciation wave will eventually cut them. More on that later, because it is the whole game.
How the money flows
flowchart TD
    ENT["Enterprise IT budgets<br/>~80% F500 on Azure AI"]
    CONS["Consumers / SMB<br/>M365, Windows"]
    GAME["Gamers<br/>Xbox, Game Pass"]
    ADS["Advertisers<br/>Search, LinkedIn"]

    ENT --> IC
    ENT --> PBP
    CONS --> PBP
    CONS --> MPC
    GAME --> MPC
    ADS --> MPC

    PBP["Productivity & Biz Proc<br/>$35.0B Q3, profit engine"]
    IC["Intelligent Cloud<br/>$34.7B Q3, Azure +40%"]
    MPC["More Personal Computing<br/>$13.2B Q3, -1%"]

    PBP --> REV["Total revenue $82.9B Q3<br/>op income $38.4B"]
    IC --> REV
    MPC --> REV

    OAI["OpenAI loop<br/>$250B Azure customer + ~27% equity"]
    OAI -->|Azure consumption| IC
    REV -->|~$13B funding| OAI

    REV --> CAPEX["Capex ~$190B cal-2026<br/>incl ~$25B memory inflation"]
    CAPEX --> GPU["Nvidia GPUs<br/>~92% market, price-maker"]
    CAPEX --> MAIA["Maia 200 custom chip<br/>TSMC 3nm, inference"]
    CAPEX --> MEM["HBM/DRAM/NAND<br/>3-supplier oligopoly"]
    CAPEX --> DC["Datacenters + power<br/>capacity-constrained 2026"]

    GPU --> TSMC["TSMC 3nm foundry<br/>Taiwan chokepoint"]
    MAIA --> TSMC
    MEM --> TSMC

    GPU --> DEP["Depreciation<br/>+55% YoY vs cloud rev +29%"]
    MAIA --> DEP
    MEM --> DEP
    DC --> DEP
    DEP -->|margin drag, GM 69->66%| FCF["Free cash flow<br/>~$15.8B Q3, compressing"]
    REV --> FCF
    FCF --> RET["Capital returns<br/>buybacks + dividends"]
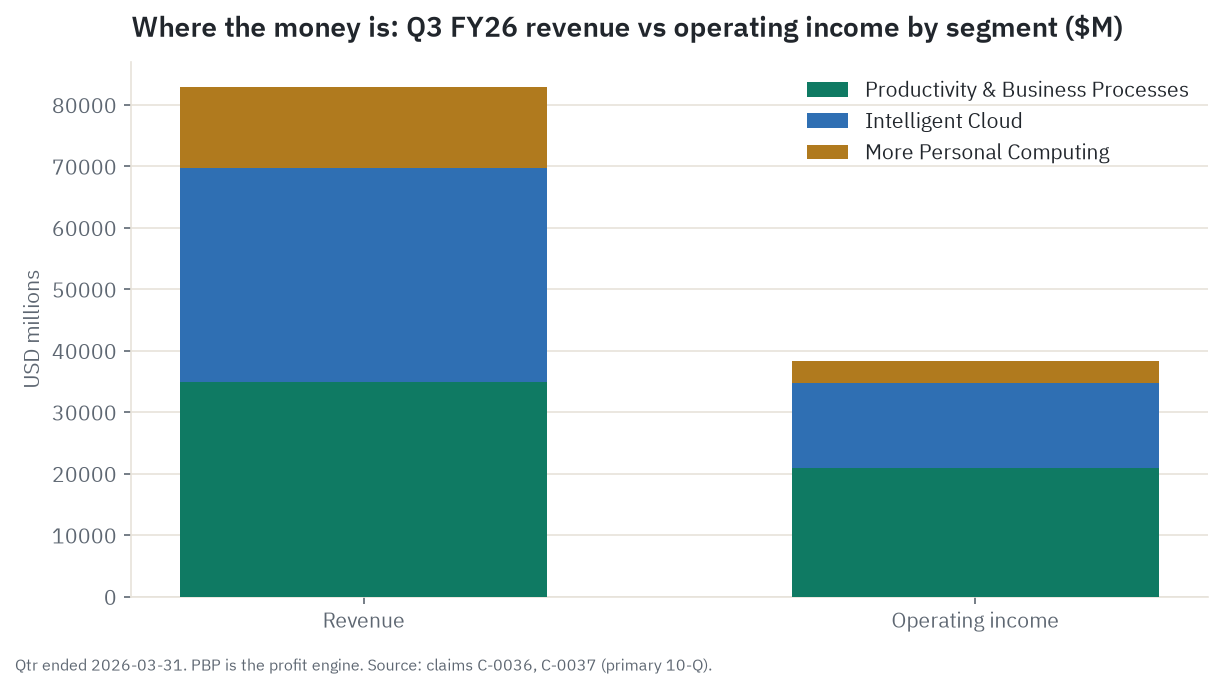
Read the diagram top to bottom and the investing point becomes the shape itself. Money enters Microsoft from four pools, in order of size: enterprise IT budgets (by far the largest, the CIOs paying for Azure, Microsoft 365, Copilot, Dynamics, GitHub, and security), then consumers and small business, then gamers, then advertisers. That demand lands in three reporting segments. Productivity and Business Processes ($35.0 billion in the March 2026 quarter) is the profit engine, throwing off about $21.0 billion of operating income at roughly a 60 percent segment margin. Intelligent Cloud ($34.7 billion, Azure up about 40 percent) is the growth engine, and it is where almost all the AI revenue and almost all the AI capex sit. More Personal Computing ($13.2 billion, down 1 percent) is the flat, lower-margin tail: Windows, devices, gaming, search.
Now follow the money down, past revenue, into the cost sinks that scare the market. Azure and AI demand exceed supply, so Microsoft is spending to add capacity: about $190 billion in calendar 2026, of which roughly $25 billion is just higher memory prices rather than more machines. That spending becomes the depreciable base, and depreciation is now running about 55 percent year over year while the Microsoft Cloud revenue it supports grows about 29 percent. Depreciation outrunning revenue is the arithmetic cause of the cloud gross margin sliding from 69 percent to 66 percent. The capex is paid for out of Microsoft’s own cash (around $100 billion a year of net income, a net-cash balance sheet), but free cash flow is compressing, and the buildout is now competing with buybacks and dividends for the same dollars.
The shape that matters most is on the right side and the OpenAI loop in the middle. AI demand shows up on both sides of Microsoft’s ledger at once: as revenue at the top, and as a capex-and-depreciation drag at the bottom. And Microsoft is in an awkward spot in the chain. When it sells cloud and software, it is a price-maker: proprietary platforms, high switching costs, it sets the price and collects the toll. When it buys the inputs to build the AI, it is a price-taker. Nvidia, with roughly 92 percent of the GPU market (a widely cited press figure), sets GPU prices. A three-supplier memory oligopoly (Samsung, SK Hynix, Micron) sets memory prices, and that is what produced the $25 billion component line. TSMC in Taiwan is the sole leading-edge foundry for both Nvidia’s chips and Microsoft’s own. So the toll-takers capture the incremental margin on the way in, and the depreciation lands on the way out. Price-taker on the inputs, depreciation on the output: that is the structural pinch behind the de-rating. The OpenAI loop, which we decode in the next section, is partly circular: Microsoft funds OpenAI (about $13 billion committed), OpenAI buys Azure (a $250 billion commitment), and the equity-method losses flow back through Microsoft’s income statement.
Field guide: the business, segment by segment
Before the competitive map, a plain-language tour of what Microsoft actually sells and how exposed each line is to the AI story.
Azure and Intelligent Cloud. Azure is Microsoft’s public cloud, the rented computing that companies run their software and AI on. It is the number-two cloud by scale behind Amazon’s AWS, and it is growing faster: about 40 percent year over year (39 percent in constant currency, which strips out the currency swings) in the March 2026 quarter, versus AWS at about 28 percent. Within Azure, growth splits into AI consumption (renting GPUs to run and train models) and traditional cloud workloads. Microsoft says it is capacity-constrained, meaning it could sell more if it had the datacenters built. One honest caveat the skeptic raised, and it matters: Chief Financial Officer Amy Hood reportedly located some of the constraint in the non-AI part of Azure, the “scale motion,” not purely in AI demand. So “sold out through 2026” is a slightly softer AI-demand signal than the cleanest bull reading suggests. Intelligent Cloud also holds server products and enterprise services. This is the segment carrying both the AI revenue and the AI capex.
Microsoft 365, Office, and Copilot. Microsoft 365 is the subscription bundle of Office (Word, Excel, Outlook, Teams) sold to roughly 450 million commercial seats. Copilot is the AI assistant bolted on top, at about $30 per user per month for the enterprise version. The seat numbers are the bull’s prize and the bear’s question. Paid Copilot seats went from 15 million (January 2026) to more than 20 million (April 2026), and seat additions grew 250 percent year over year, the fastest since launch. But 20 million paid seats against a 450 million commercial base is an attach rate of only about 4.4 percent (our estimate of the ratio). The whole bull case rests on that attach rate inflecting from low single digits toward double digits, because each Copilot seat is high-margin software revenue that helps justify the capex.
The OpenAI relationship and the roughly 27 percent stake. This is the most misunderstood thing on Microsoft’s books, so we decode the deal rather than repeat the press headline. Per the FY26 Q3 10-Q, Microsoft holds an investment of approximately 27 percent of OpenAI on an as-converted basis, accounted for under the equity method. “On an as-converted basis” means the 27 percent counts Microsoft’s stake as if OpenAI’s profit-participation units (the special instruments Microsoft actually holds) were swapped into ordinary equity, which is why the figure is framed as approximately 27 percent rather than a clean round ownership share. “Equity method” means Microsoft does not control or consolidate OpenAI; it books its share of OpenAI’s profit or loss as a single line below operating income. Microsoft uses a specific technique called hypothetical liquidation at book value (HLBV) because its rights in a wind-up differ from its raw ownership percentage. The practical effects, all from the filing:
- Microsoft has committed $13 billion of funding, of which $11.8 billion was funded as of March 31, 2026.
- OpenAI’s recurring losses flow through to Microsoft as a recurring drag. In FY26 Q1, that was a $3.1 billion hit, about $0.41 of earnings per share.
- The nine-month figure looks very different because of a one-off. Microsoft booked a $5.9 billion net gain over the nine months ended March 31, 2026, but the filing is explicit that this is primarily a dilution gain from the October 2025 OpenAI recapitalization, a one-time, non-cash accounting event, not operating profit. That is exactly why Microsoft reports a non-GAAP earnings figure that strips the OpenAI impact out entirely.
- OpenAI is also a $250 billion Azure customer, intellectual-property access runs to 2032, and a April 2026 amendment ended cloud exclusivity, made the IP license non-exclusive, and capped the revenue share. OpenAI is now multi-cloud, including a roughly $38 billion compute deal with AWS.
So the stake is both an asset (a roughly 27 percent claim on the ChatGPT franchise) and a dependency (a cash-burning partner whose losses hit GAAP earnings, and which is now less exclusive to Microsoft than it was). The press marks on the stake’s value (roughly $135 billion at the October 2025 $500 billion OpenAI round, roughly $228 billion at the March 2026 $852 billion round) are press-reported, dated, range-disclosed, and not a balance-sheet figure. Microsoft carries the stake at equity-method value, not at the private-round mark.
Windows, devices, and More Personal Computing. Windows licenses to PC makers, Surface devices, and the search-advertising business (Bing and Edge) live here. This segment is flat to declining (down 1 percent) and the lowest margin. It is the least AI-levered of the three, though Bing plus Copilot handle a meaningful slice of search-intent queries, weighted toward the workplace.
Gaming and Activision Blizzard. Xbox content, Game Pass subscriptions, and hardware sit in More Personal Computing after the Activision Blizzard acquisition. To size the “sidebar” framing: this whole segment, which also holds Windows and search, was about $13.2 billion in the March 2026 quarter and was down 1 percent, the only one of the three segments not growing, and within it Xbox content and services revenue grew about 16 percent in the latest full year, lifted by the Activision deal and Game Pass. Microsoft does not break out gaming as a standalone segment, so there is no clean quarterly gaming revenue line to quote, but the order of magnitude is clear: gaming is a real business sitting inside the smallest and slowest of Microsoft’s three reporting segments, and it is largely a sidebar to the AI thesis rather than a driver of it.
LinkedIn, Dynamics, GitHub, and security. LinkedIn (professional networking and marketing) and Dynamics (business applications) sit inside the $35.0 billion Productivity and Business Processes segment, the profit engine, alongside Microsoft 365. Microsoft does not report LinkedIn as a standalone segment either, so there is no clean discrete revenue line to anchor it, but it discloses the growth: LinkedIn revenue grew about 9 percent in the latest full year, a steady mid-single-to-high-single-digit contributor rather than an AI growth story, which is why it reads as a sidebar despite being a large business in absolute terms. GitHub Copilot, the AI coding assistant, had about 4.7 million paid subscribers as of January 2026, up about 75 percent year over year, and is deployed at roughly 90 percent of the Fortune 100. Microsoft’s security business is a quiet strength: it is a Gartner Magic Quadrant Leader in both SIEM (Sentinel) and endpoint protection (Defender), and Security Copilot is one of its more credible enterprise AI products. These are the places Microsoft’s distribution moat is widest.
Is Microsoft losing the AI battle? The competitive map
Now the second operator question. The honest answer requires keeping two different layers separate, because the headlines blur them and that blur is where the panic comes from. There is the assistant-and-distribution layer (who gets the AI in front of paying users) and the model layer (whose underlying AI is the best). Microsoft wins the first and trails in the second, and conflating them produces a wrong answer.
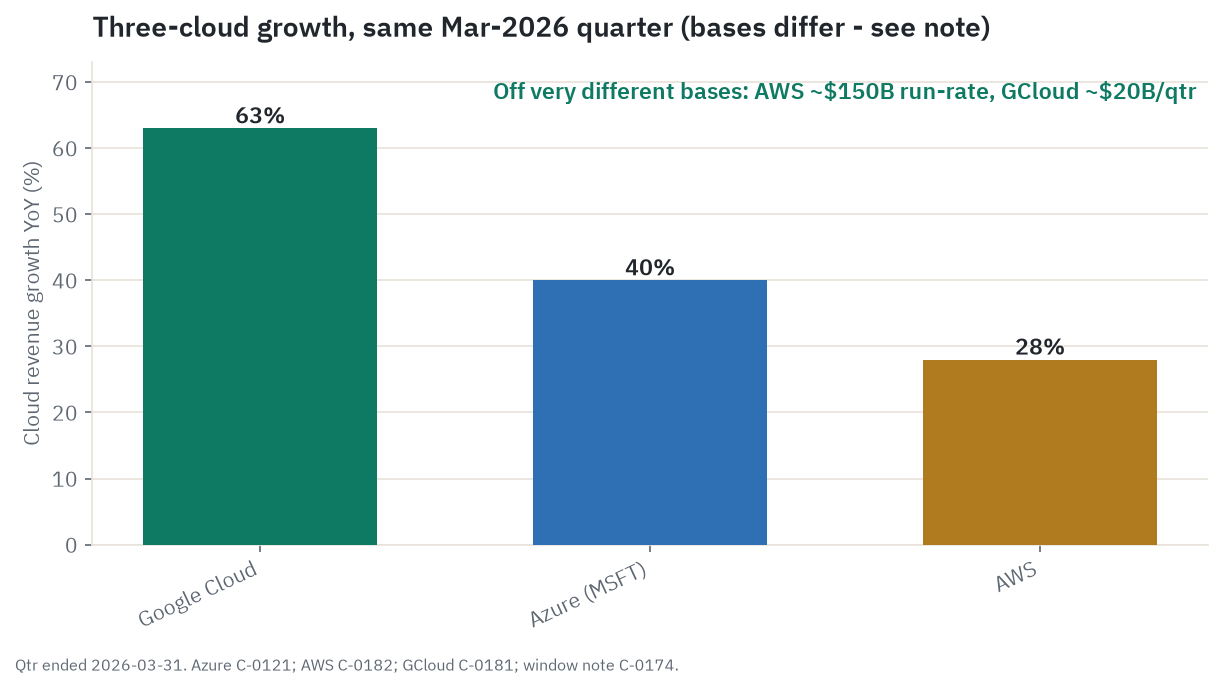
Enterprise AI and cloud: Microsoft leads. In the March 2026 quarter, Azure grew about 40 percent, ahead of AWS at about 28 percent. Google Cloud grew about 63 percent, but off a far smaller base (Google Cloud did about $20 billion in the quarter versus AWS at about $37.6 billion), so the percentage flatters it; a small business growing fast and a large business growing steadily are not the same race. On enterprise distribution, Microsoft is clearly ahead: more than 20 million paid Copilot seats, a $627 billion commercial remaining-performance-obligation backlog up about 99 percent year over year (that is contracted, not-yet-recognized revenue, a real measure of demand already booked), GitHub’s grip on developers, and a leading security-AI position. The management-framed AI run-rate of about $37 billion, up about 123 percent, is the headline number here, and it deserves a hard caveat: Microsoft does not itemize it, it blends Azure AI consumption plus Copilot seats plus OpenAI-on-Azure, and it is a management run-rate, not an audited GAAP line. Treat it as directional, not precise. One thing the (unitemized) shape does tell you: the bulk of the $37 billion is Azure AI consumption, the metered rental of GPUs to run and train models. Commercial Copilot per-seat revenue is a minority slice, on the order of $5 billion annualized at list (our back-of-envelope estimate, 20 million-plus seats at about $30 a month), so the run-rate is more a reading of raw infrastructure demand than a reading of Copilot seat adoption. That matters, because the bull case wants the high-margin Copilot software dollars to grow into the capex, and they are the smaller part of this number today. (And do not confuse it with a different $37 billion that floats around: the Menlo Ventures figure for total enterprise generative-AI spend across the whole industry in 2025. Two different numbers, same digits, from two different sources.)
The model layer: Microsoft trails, and it is real. Here is where the bear has a genuine point that the bull case cannot wave away. Microsoft does not make its own frontier model; it rents one, primarily from OpenAI. And OpenAI’s enterprise standing has slipped. Per Menlo Ventures’ 2025 enterprise survey (about 500 US decision-makers), OpenAI’s share of enterprise large-language-model API use fell to about 27 percent, down from about 50 percent in 2023, while Anthropic rose to about 40 percent and Google to about 21 percent. In coding specifically, the most monetized agentic use case, Anthropic leads at about 54 percent versus OpenAI at about 21 percent. The bull case for Microsoft assumes value migrates up the stack to the high-margin application layer that Microsoft owns. But if the best enterprise models belong to Anthropic and Google, and Microsoft has to embed Anthropic’s Claude as a default subprocessor inside its own Copilot (which it did, starting around December 2025 and January 2026) to stay competitive, then Microsoft is increasingly a distributor of rivals’ models, paying two tolls (Nvidia on compute and the model lab on the model) on a stack it does not fully own. That is the sharpest structural worry in the whole story.
The consumer assistant: Microsoft trails, and it barely matters. The loudest bear meme, “Copilot is losing, Microsoft is losing AI,” is built almost entirely on consumer chatbot share, which is the part of Microsoft’s AI business that matters least to the profit-and-loss. The data here is soft, single-house (Recon Analytics), and divergent by methodology, so we report only the direction and attribute it every time. By Recon’s reading, Copilot’s US paid-AI-subscriber share fell from about 18.8 percent in July 2025 to about 11.5 percent in January 2026, and when workers have access to all three assistants, about 8 percent choose Copilot versus about 70 percent for ChatGPT. Take those exact figures with caution; sources disagree by roughly 8 times depending on whether you measure web traffic, paid subscribers, or pick-rate. What is trustworthy is the direction: flat-to-shrinking consumer share despite Microsoft’s Windows and Office distribution. But this is consumer, not enterprise, and the consumer assistant is a tiny fraction of Microsoft’s revenue. The crowd is extrapolating a weak consumer product onto a strong enterprise franchise.
Custom silicon: Microsoft trails. The hyperscalers are designing their own AI chips to reduce their dependence on Nvidia and claw back margin. Microsoft’s chip is Maia (the Maia 200 inference accelerator, built on TSMC’s 3-nanometer process, which Microsoft says delivers about 30 percent better performance per dollar than the prior generation). Press reports put its mass production only now slipping into 2026, which is the rough measure of “behind”: while Maia is still ramping to volume, Amazon’s Trainium is already deployed at scale (press puts more than 500,000 second-generation chips active in one cluster and more than a million in use running Anthropic’s Claude, with a third generation due in 2026), and Google’s TPU is in its seventh generation. So Microsoft is a generation or two of deployment behind, not merely a few months. The cost of being behind is a margin lever left unpulled. Every workload that runs on Nvidia rather than on Microsoft’s own silicon pays Nvidia’s gross margin, widely reported above 70 percent, on top of the compute. A mature in-house inference chip lets a hyperscaler claw back a chunk of that toll on the highest-volume, lowest-complexity AI work, which is exactly the margin relief Amazon and Google are starting to capture and Microsoft is not yet.
Is Microsoft de-risking or admitting dependence? Both, honestly. Microsoft now routes Copilot across multiple models (OpenAI’s GPT by default, Anthropic’s Claude, and seven in-house MAI models it launched at Build in June 2026). The bull reads this as healthy optionality: Microsoft keeps the distribution regardless of which lab wins the frontier. The bear reads it as a forced admission that OpenAI-only was a vulnerability. Both readings are correct at once.
The scorecard. Microsoft is not losing the AI battle at the level the headlines assert. It leads enterprise cloud growth over AWS, leads enterprise distribution, and is monetizing AI inside the enterprise faster than anyone. It genuinely trails in three narrower places, of which only one (the model layer) threatens the long-term economics, and even that is partly hedged by multi-model routing. The bear’s strongest competitive point is not “Copilot lost the consumer”; it is “Microsoft is the hyperscaler paying the most tolls on the least-owned stack.” Keep that distinction and you have the honest verdict.
Company by company: Microsoft in depth and the AI-rival comparison set
Microsoft first and deepest, then the rivals grouped by where they actually compete. Every figure is point-in-time. Lead caveat for the whole section: the rivals are diversified giants, and “AI rival” usually means one segment of each, not the whole company.
Microsoft (MSFT, Nasdaq). Three segments, covered above. Market cap about $2.82 trillion (7,428,434,704 shares per the 10-Q cover dated April 23, 2026, times the $379.40 close on June 18, 2026, gives about $2.818 trillion; the aggregator figure of about $2.82 trillion is consistent). Most recent result: FY26 Q3 revenue $82.886 billion (up 18 percent), operating income up 20 percent, net income $31.778 billion (up 23 percent), GAAP diluted EPS $4.27, with the release saying results “exceeded expectations.” Azure up 40 percent, AI run-rate about $37 billion (management framing). But capex was $30.9 billion in the quarter, cloud gross margin slipped, and GAAP EPS was flattered by the one-off OpenAI dilution gain that non-GAAP strips out. Bull: operations are not broken; the Q3 beat, the Azure growth lead over AWS, more than 20 million Copilot seats, the roughly 27 percent OpenAI stake, and the deepest enterprise distribution moat mean the de-rate to about 20 times forward (the lowest in about three years, versus its own roughly 33 times norm) prices a value-trap the fundamentals do not yet show. Bear: about $190 billion of calendar-2026 capex with no visible return-on-capital ceiling feeds a rising-depreciation wave that can compress forward earnings faster than estimates assume, while Microsoft is measurably behind on the consumer assistant, the model layer (it rents OpenAI), and custom silicon, so the roughly 30 percent drawdown (Microsoft- and Meta-specific, not a sector sell-off) reads as a justified de-rating, not an overreaction.
Alphabet (GOOGL, Nasdaq). Materiality first: Google Cloud and Gemini are one piece of a diversified giant; Search, YouTube, and Android still drive the bulk of Alphabet’s revenue and profit. Treat the AI rivalry as one segment. Alphabet is the only fully owned end-to-end AI stack: its own frontier model (Gemini), its own cloud, and the most mature custom silicon (its seventh-generation TPU). Q1 2026: consolidated revenue $109.9 billion (up 22 percent), net income $62.6 billion (up 81 percent), Google Cloud $20.0 billion (up 63 percent, its first quarter above $20 billion). Bull: versus Microsoft, Alphabet owns the whole stack, is the fastest-growing major cloud, and the market is paying up for it (up about 38 percent since Microsoft’s October 2025 peak, about 29 times forward); it is the name that has clearly not lost the AI battle. Bear: at about $4.5 trillion and about 29 times forward it is priced for AI dominance with no room for a stumble; its Q1 net income was partly flattered by an Anthropic-stake markup; Search faces the same AI-disruption risk it is trying to monetize; and it carries its own roughly $180 to $190 billion calendar-2026 capex obligation.
Amazon (AMZN, Nasdaq). Materiality: AWS is the AI-relevant piece, but most of Amazon’s revenue is retail and advertising; judge the AI rivalry on AWS, not the whole company. AWS is the largest cloud by absolute scale (about $150 billion annualized run-rate, bigger than Azure) and reaccelerated to about 28 percent year over year, its fastest in roughly 15 quarters. Q1 2026: net sales $181.5 billion (up 17 percent), net income $30.3 billion, but that net income included $16.8 billion of pre-tax Anthropic-stake gains; AWS $37.6 billion (up 28 percent). Bull: AWS is the bigger cloud and just reaccelerated, with the deepest custom-silicon plus Anthropic stack and a cheaper sales multiple; the market is comfortable with it. Bear: Q1’s headline profit was materially flattered by a one-off Anthropic revaluation (not operating cash), AWS still grows slower than both Azure (about 40 percent) and Google Cloud (about 63 percent), and Amazon carries the heaviest calendar-2026 capex load (about $200 billion) against thin retail margins.
Meta (META, Nasdaq). Materiality: Meta is an advertising company, not a cloud vendor; it does not sell cloud to enterprises and is not a direct Azure competitor. Its relevance here is as the capex-sentiment control: it is the only other mega-cap that sold off alongside Microsoft off the October 2025 peak (down about 23 percent over the window versus Alphabet up 38 percent). Q1 2026: revenue $56.31 billion (up 33 percent), operating income $22.9 billion (41 percent margin), net income $26.77 billion, though that included an $8.03 billion one-off tax benefit. The stock fell after it raised its calendar-2026 capex guide to $125 to $145 billion. Bull: cheapest of the mega-cap set (about 17.6 times forward, below Microsoft), 33 percent revenue growth at a 41 percent operating margin, and an AI flywheel that lifts its own ad business directly. Bear: like Microsoft, Meta was singled out by the market for open-ended AI capex (the raised guide drove the drop), Q1 profit was flattered by a one-off tax benefit, and as a pure ad model with no cloud it has no enterprise-AI revenue line to defend the spend. Meta is the control that proves the de-rate is about unmonetized capex, not Microsoft execution alone.
OpenAI (private, no ticker). Materiality: OpenAI is private; there is no ticker and a retail investor cannot buy it. Any valuation is a private-round figure, not a public market cap, and it is also Microsoft’s partner, not a clean rival. It is the maker of GPT and ChatGPT, the consumer-assistant leader, and Microsoft’s primary model supplier. Around March 2026 it reportedly closed a $122 billion round at about $852 billion post-money and reportedly filed confidentially for an IPO targeting $1 trillion-plus, possibly listing in late 2026 (all press, all unverifiable independently). Bull: for a Microsoft holder, OpenAI is the single most valuable investment on the books, a roughly 27 percent stake in the ChatGPT franchise with IP rights to 2032, and an IPO would mark it to a public price (press marks it near $228 billion, about 8 percent of Microsoft’s cap). Bear: OpenAI is unprofitable and burning cash (its own projections imply roughly $14 billion of losses in 2026, per press), its losses hit Microsoft’s GAAP earnings each quarter, and it has gone multi-cloud and non-exclusive, eroding the moat Microsoft built around it; being private, it cannot be owned or valued cleanly.
Anthropic (private, context only). Materiality: private, no ticker, not buyable, included as context. It is the maker of Claude, the enterprise-API leader (about 40 percent versus OpenAI’s 27 percent per Menlo), and it is now embedded inside Microsoft’s own Copilot as a subprocessor. Early 2026: a $30 billion Series G at a $380 billion post-money valuation; by June 2026 press marked the implied valuation toward $900 billion-plus. Bull: Anthropic-in-Copilot shows Microsoft can win the distribution layer even while renting the best model; multi-model optionality de-risks single-lab dependence. Bear: Anthropic leading the enterprise and coding API layer is the clearest evidence Microsoft’s primary model (OpenAI) is losing the model race, and because Anthropic is owned partly by Amazon and Google, that upside accrues to Microsoft’s rivals, not to Microsoft.
What the filings say
Now the financials, from the 10-K, the 10-Q, and the earnings release, every figure dated and pulled from the filings rather than an aggregator.
Revenue and segment mix. FY26 Q3 (quarter ended March 31, 2026): total revenue $82,886 million, up 18 percent. By segment: Productivity and Business Processes $35,013 million (up 17 percent), Intelligent Cloud $34,681 million (up 30 percent), More Personal Computing $13,192 million (down 1 percent). Group operating income $38,398 million, and the segment split tells the real story: Productivity and Business Processes alone produced $20,973 million of that operating income, more than half, at roughly a 60 percent segment margin. Intelligent Cloud is the growth engine but the lower-margin one. For the full year FY25, total revenue was $281,724 million and operating income $128,528 million, with diluted EPS of $13.64. (Note that Microsoft recast its segments in FY26, so the FY25 10-K segment lines are not directly comparable to the FY26 10-Q segment lines.)
Margins. FY25 group gross margin was about 68.8 percent, operating margin about 45.6 percent, net margin about 36.1 percent. The pressure point is the cloud gross line. Microsoft Cloud gross margin moved 69, 68, 68, 67, 66 percent across the last five quarters, down about 3 points year over year. Management’s own language in the 10-K names the cause: “Microsoft Cloud gross margin percentage decreased … driven by the impact of scaling our AI infrastructure, offset in part by efficiency gains in Azure.” That same “impact of scaling our AI infrastructure” phrase repeats across the segment discussions. The company is telling you, in its own words, that the AI buildout is what is compressing the margin.
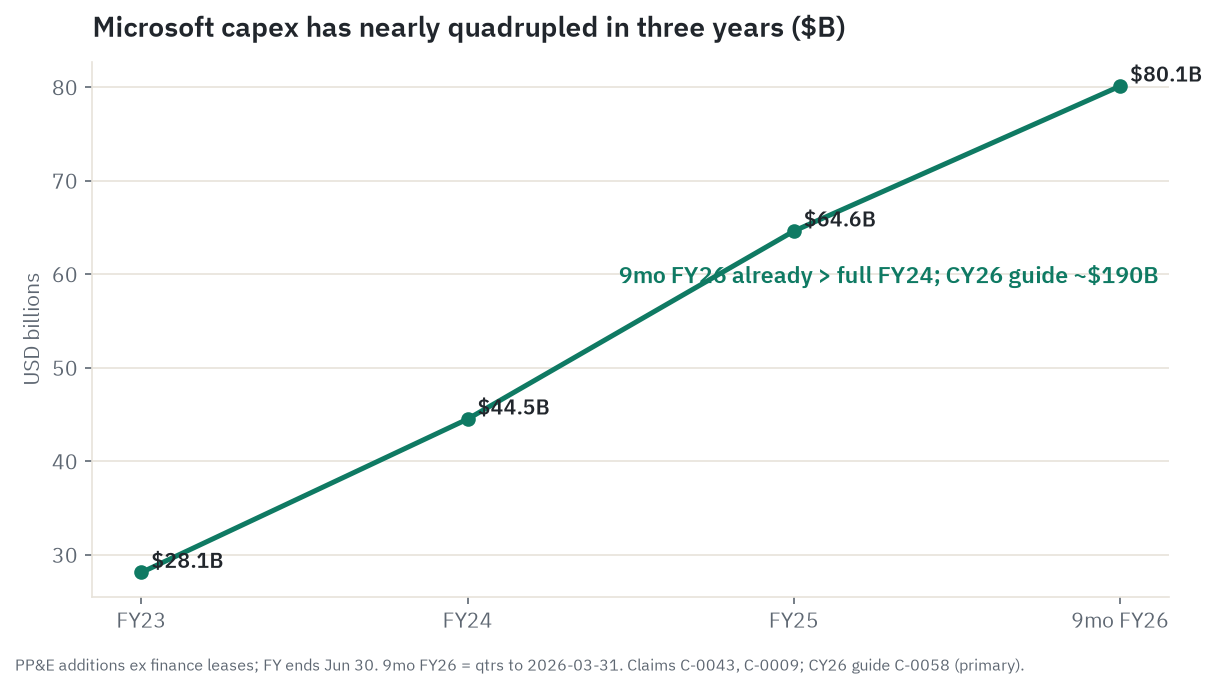
Cash flow and the capex line. This is the dominant story in the filings. Additions to property and equipment (cash capex, excluding finance leases) ran $28.1 billion (FY23), $44.5 billion (FY24), and $64.6 billion (FY25). The nine-month FY26 figure is already $80.1 billion, up about 69 percent over the comparable prior nine months, and that is before counting about $19.5 billion of finance-lease right-of-use additions (AI-infrastructure leases). FY25 operating cash flow was $136.2 billion; the nine-month FY26 figure was $127.5 billion. But subtract the capex and the free-cash-flow cushion thins dramatically: nine-month FY26 operating cash flow of $127.5 billion minus $80.1 billion of capex is about $47.4 billion of free cash flow, much less comfortable than the operating-cash-flow growth alone implies. Microsoft does not report a GAAP free-cash-flow line, so that figure is derived, and a stricter measure that also subtracted finance-lease outflows would be lower still.
The depreciation wave. Depreciation expense was $11.0 billion (FY23), $15.2 billion (FY24), and $22.0 billion (FY25), and pure depreciation hit about $9.0 billion in the March 2026 quarter alone, up about 55 percent year over year. Accumulated depreciation on property and equipment reached $111.7 billion at March 31, 2026, from $93.7 billion. There is a tell in the working capital, too: property-and-equipment purchases sitting in accounts payable jumped to $22.6 billion at March 31, 2026 from $6.9 billion at June 30, 2025, which means even more capex is already committed but not yet paid. Today’s $80 billion-plus of capex is tomorrow’s depreciation, and that is the margin headwind the bear case is built on.
The balance sheet. This is not a stretched company. Cash and equivalents of $32.1 billion plus short-term investments of $46.2 billion give $78.3 billion of cash and short-term investments (down from $94.6 billion at June 30, 2025, drawn down about $16 billion funding the buildout). Total debt is $40.3 billion. On that basis Microsoft is in a net-cash position, about $38 billion of net cash before finance leases. It carries about $46 billion of finance-lease liabilities, which matters for enterprise value if you capitalize leases, but it does not change the picture: Microsoft funds its capex out of its own cash flow and has a AAA-rated balance sheet. Any “value trap” or “capex destroys returns” argument is about returns and margins, not about solvency. Microsoft is nowhere near financial distress.
Capital returns and dilution. FY25 buybacks were $18.4 billion and dividends $24.1 billion; the nine-month FY26 figures were $17.7 billion and $19.7 billion. The canonical share count from the latest 10-Q cover page is 7,428,434,704 shares outstanding as of April 23, 2026, with balance-sheet shares of 7,429 million at March 31, 2026 versus 7,434 million at June 30, 2025. The float is roughly flat to slightly down: buybacks are offsetting stock-based-compensation dilution rather than aggressively shrinking the share count.
The OpenAI accounting, in the filing’s own words. We covered this in the field guide, but here is the precise treatment for completeness. The 10-Q states Microsoft has “an investment of approximately 27 percent of OpenAI on an as-converted basis accounted for under the equity method,” using the HLBV method, and that it has “made total funding commitments of $13 billion, of which $11.8 billion has been funded as of March 31, 2026.” The income-statement swing is large and volatile: $19 million of net losses for the three months and $5.9 billion of net gains for the nine months ended March 31, 2026 (versus net losses in the prior-year periods), with the nine-month gain “primarily relate[d] to the dilution gain from the OpenAI Recapitalization.” Because that gain is a one-off, non-cash item, management reports a non-GAAP earnings figure that “exclude[s] the impact from investments in OpenAI.” Read the GAAP and non-GAAP numbers side by side and you can see the OpenAI effect: the nine-month gap between GAAP diluted EPS ($13.14) and adjusted ($12.54) is essentially that dilution gain.
Management’s own guidance and risk factors. On capex, the MD&A is open-ended: “We will continue to invest in capital expenditures to support growth in our cloud offerings and our investments in AI infrastructure and training,” with no dollar ceiling. The 10-K risk factors flag exactly the things the market is pricing: the AI buildout compressing cloud gross margin, the possibility of “inadequate datacenter capacity,” and a newly expanded AI risk factor covering flawed algorithms, biased data, harmful generated content, and, for the first time prominently, agentic AI systems “that can take actions autonomously.” Recent 8-K filings are routine board and officer changes (Reid Hoffman not standing for re-election, “not as a result of any disagreement”; a new director appointed), with no guidance cut, restatement, or litigation 8-K in the recent window.
Answering the first operator question from the filings alone. The filings do not show a fundamental break. Revenue, operating income, and EPS all beat and grew. What they do show that would worry the market is precisely what the market re-priced: capex up about 69 percent with no ceiling, cloud gross margin down to 66 percent from AI-infrastructure scaling, rising depreciation, a thinning free-cash-flow cushion, and a one-off OpenAI gain flattering GAAP EPS. A drop, on these filings, is most consistent with a valuation-and-return reaction, not deteriorating operations. The filings cannot source the stock price itself; for that we go to the market.
What the market is paying
Point-in-time, and these figures move fast. Note that June 21, 2026 is a Saturday, so every price is stamped to the June 18, 2026 close.
Price and range. Last close $379.40 (June 18, 2026). The 52-week range is $356.28 to $555.45 intraday, and the all-time-high closing price was $542.07 on October 28, 2025. The stock sits near the bottom of its 52-week range, about 6 percent above the low and about 32 percent below the intraday high. Year to date it is down about 21.5 percent, and over one year down about 20.5 percent, one of the few mega-caps with a negative one-year return.
Volatility and the drawdown. The five-year beta is about 1.10, historically a calm mega-cap, but FY26 was anything but calm. The peak-to-trough drawdown was 34.2 percent on a closing basis ($542.07 on October 28, 2025 to $356.77 on March 27, 2026), and at $379.40 the stock is still 30 percent off the peak. The worst single day was the 9.99 percent fall on January 29, 2026, the FY26 Q2 reaction, Microsoft’s worst day since March 2020.
Liquidity and short interest. Microsoft is extremely liquid, trading roughly $15 to $23 billion a day. Short interest is only about 1.2 percent of float, which is low and rules out a squeeze. That low short interest is itself evidence: this decline is a fundamental de-rating, not a positioning or short-driven event. Nobody is betting against Microsoft in size; investors simply repriced what they will pay for it.
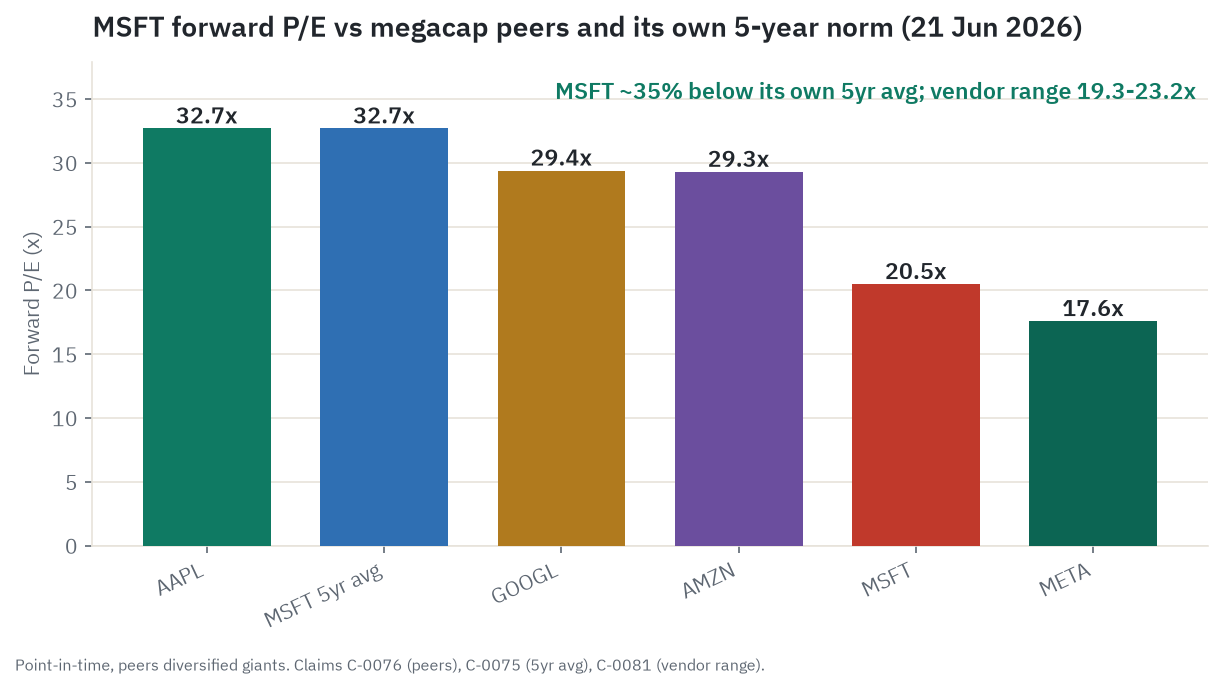
Valuation, versus its own history and versus peers. Forward price-to-earnings is about 20.5 times, and we flag that figure as disputed across vendors (the range runs about 19.3 to 23.2 times, mostly because some use next-twelve-months and some use the forward fiscal year, and some use GAAP and some adjusted EPS; use about 20 to 21 times as the central read, never a single decimal). A few more ratios round out the picture, each with a plain reading. Trailing P/E is about 22.6 times; this is the same price-to-earnings idea but measured against the last twelve months of actual profit rather than next year’s estimate, so it is the backward-looking cousin of the forward multiple. EV/EBITDA is about 15.5 times; enterprise value (the market cap plus net debt) divided by EBITDA (cash operating earnings before interest, taxes, depreciation, and amortization), which is a debt-and-cash-neutral way to compare two companies that strips out how each is financed and how it depreciates its assets. Price-to-sales is about 8.9 times; simply the price you pay per dollar of annual revenue, a crude gauge useful when margins are in flux. Dividend yield is about 0.96 percent; the annual dividend as a percentage of the share price, which tells you the cash income a holder collects each year before any price change. The story is in the comparison to Microsoft’s own history: its five-year average forward P/E is about 32.7 times, so it now trades roughly 35 percent below its own norm, the lowest forward multiple in about three years. Against peers (one vendor, for internal consistency): Microsoft at 20.5 times forward sits below Alphabet (29.4), Amazon (29.3), and Apple (32.7), and above only Meta (17.6). So Microsoft is cheap versus its own history and fair-to-cheap versus the cohort.
The honest caveat is why it is cheap, and that is the value-trap risk. About $190 billion of 2026 capex flows into rising depreciation that can compress forward EPS faster than current estimates assume. Twenty times is not a screaming bargain in absolute terms for a business facing margin pressure; it is cheap relative to Microsoft’s past premium, and that premium is exactly what is in question. The contrarian read worth sitting with: the multiple hardest to defend in this cohort is arguably not Microsoft’s at 20 times with rising estimates, but Alphabet’s and Apple’s near 29 to 33 times, which leave no room for an AI stumble. Microsoft’s bear case cannot rest on the multiple, because the multiple has already done the work. It has to rest on the forward earnings estimates being too high.
The sell-side. Consensus rating is Strong Buy across about 56 analysts (S&P Global), with 12-month targets of a roughly $561 mean, $555 median, $400 low, and $870 high (updated June 12, 2026). Treat these as opinion, not fact. The notable thing is that even the low target ($400) sits above the last price, which means the sell-side has lagged the drop and remains structurally bullish. The spread itself is worth reading: a $400-to-$870 range on one stock is enormous, and it is the same depreciation-versus-revenue fork this whole piece describes, expressed in target form. The $870 bull assumes the AI revenue overtakes the depreciation, earnings keep compounding, and the multiple re-rates back up; the $400 bear assumes depreciation outruns revenue, FY27 earnings get cut, and the multiple stays a show-me 20 times of a lower number. The targets disagree because the analysts disagree about which leg wins. Recent revisions are mixed: at least one shop (Melius) cut from Buy to Hold with a $430 target on Microsoft 365 and Copilot structural-pressure concerns, and Stifel flagged Azure deceleration. These are dated analyst opinions attributed by house, not facts. Consensus EPS estimates are still growing: FY26 $16.84, FY27 $19.35.
What the crowd is saying
This section is signal, not fact. Sentiment is a read on what people believe, not on what the business is doing, and everything here is soft. We use it to find the places where the crowd’s story diverges from the filings and the market, because those divergences are the useful part.
The dominant narrative is cooling, not warming. The heavy news coverage carries a negative lean, but the worry has shifted, and it is now widely held rather than fresh, which is to say it is cooling at the margin rather than building. The dominant story is not “Microsoft is losing the AI race” in a technology sense. It is AI capex, depreciation, and return-on-investment sustainability, plus a soft consumer-Copilot side-plot. The financial press frames it as “Wall Street is re-evaluating Microsoft’s AI future,” anchored on the January 2026 minus-10-percent day and the roughly $190 billion capex guide. The counter-narrative is alive and loud too: a Strong Buy consensus persists, and prominent bulls are well covered. The net read is that the bear thesis is now mature and consensus, while the bull thesis has become the contrarian one.
Retail and social. Microsoft is treated by retail as a safety play, so its chatter is structurally calmer and less meme-driven than Nvidia or Tesla. The social lean flipped from bullish to bearish through June, turning down after a shareholder lawsuit was reported on June 12. Mention intensity is the real tell: chatter rose sharply (one read had it up more than 1,000 percent year over year around mid-June), so attention is rising even as the lean turns negative. There is no sign of a coordinated pump; with a $2.8 trillion cap and short interest near 1.2 percent of float, there is no thin-float setup and no incentive for manipulation. The decline is a fundamental de-rating with low short interest, the opposite of a manufactured move.
Where the crowd diverges from the filings (the useful part). Three divergences stand out.
First, and biggest: consumer-Copilot panic versus enterprise-cloud reality. The loudest bear meme is built on consumer chatbot share (low single digits, shrinking), the part of Microsoft’s AI business that matters least to the profit-and-loss. The revenue engine is enterprise: Azure up 39 to 40 percent, the $627 billion commercial backlog, capacity-constrained demand. The crowd is extrapolating a weak consumer product onto a strong enterprise franchise. And the asymmetry favors the fundamentals, because the consumer-share data is genuinely soft and source-divergent while the enterprise figures are primary.
Second, “capex doom” versus still-large free cash flow and rising estimates. The press frame is that permanently high capex destroys the model. The filings say capex is compressing free cash flow (Q3 free cash flow about $15.8 billion versus $20.3 billion a year earlier) and depreciation is up about 55 percent, so the bear case has a real, primary-sourced kernel. But Microsoft still generated about $71.6 billion of free cash flow in FY25, funds its capex internally, and its forward EPS estimates have risen. The crowd is pricing an earnings catastrophe the estimates do not yet show. The one thing that keeps this divergence honest: the forward depreciation drag is real but has not yet become a consensus EPS cut, and that is the single thing to keep watching.
Third, press tone (skeptical) versus sell-side ratings (Strong Buy). The media reads “successive downgrades, market cap erased”; the actual board of analysts is Strong Buy with a mean target near $561 and a low target ($400) still above the last price. Either the sell-side is lagging the de-rating or the press has over-rotated to doom. Both can be true, and both are soft.
The one divergence that is not real, included to protect the reader: the belief that the whole AI-capex complex sold off. It did not. The drop is Microsoft-specific (shared only with Meta). Alphabet rose about 38 percent and the Nasdaq-100 about 17 percent over the identical window. That is the cleanest hard fact to anchor against the soft “AI bubble popped” chatter.
A note on positioning, kept honest. Insiders have been net sellers, but that selling is routine and compensation-driven (Nadella sold about $75 million over roughly 18 months on pre-set plans); the mildly notable thing is the absence of insider buying into a 30 percent drawdown, a soft signal by omission at most. On the institutional side, the marquee event, the Gates Foundation Trust fully exiting its remaining roughly 7.7 million shares (about $3.2 billion), is explicitly a planned 20-year-dissolution and liquidity move, not a sentiment vote, and treating it as bearish would mislead. Aggregator sentiment and net-flow scores are gameable and inconsistent, so we report direction (attention rising, lean cooling), never a precise score.
Is the franchise durable?
Pull the macro and micro threads together. The structural case and the cyclical case both have real evidence, and the most likely outcome is a split.
The structural bull case. Microsoft sits on one of the deepest distribution moats in software. About 80 percent of the Fortune 500 run on Azure AI, the commercial backlog is $627 billion and contracted, switching costs in Office and Azure are high, and the AI revenue is being sold into an installed base that already pays Microsoft for everything else. The roughly 27 percent OpenAI stake is a call option on the frontier-model franchise, with IP access to 2032. The balance sheet is net cash and the capex is internally funded. If AI value migrates up the stack to the high-margin application layer, Microsoft is positioned to collect more of it than anyone.
The real cyclical bear case. This is not “Microsoft is dying.” It is quieter and arithmetic, and it deserves to be stated as seriously as the bull case. The de-rate to 20 times was the multiple leg of what could be a two-leg adjustment, and the second leg, the earnings leg, has not printed. Depreciation is growing about 55 percent year over year against AI revenue growth that, off a now-larger base, is decelerating from plus-123 percent. Every quarter that gap persists, margins compress. The depreciable base is still building (about $190 billion of capex, two-thirds of it short-lived). At some point a hyperscaler trims its 2027 capex guidance (the canonical “digestion has begun” signal), the cohort re-rates, and consensus FY27 EPS finally gets cut, turning today’s “cheap 20 times” into “fair 22 times of a lower number,” which is to say no margin of safety. The OpenAI equity-method losses keep dripping through GAAP, the one-off recap gain does not repeat, and Microsoft remains the hyperscaler paying the most tolls (Nvidia on compute, the model lab on the model) on the least-owned stack. The trigger is a depreciation catch-up that outruns AI revenue for several more quarters; the timing is roughly FY27 into FY28, when the 2025-26 GPU vintages become peak depreciation.
The most likely outcome is a split. All three plausible futures have Microsoft growing revenue; the dispersion is entirely earnings-times-multiple. The single hinge across everything: does AI-revenue growth re-overtake depreciation growth before the multiple has to re-rate down on an earnings cut. If revenue wins the race, the bull is right and 20 times on rising-and-real earnings is genuinely cheap. If depreciation wins, the bear is right and 20 times was never cheap because the earnings number was 10 to 15 percent too high. Both paths are live, and the reader should not let the present-tense fact that “estimates are still rising” smuggle in the conclusion. That is the skeptic’s central point, and it is correct.
The five-year outlook
This section is a scenario map for FY26 (ending June 30, 2026) through roughly FY31, not a forecast and not advice. Every forward number is an estimate. There is no price target anywhere; the illustrative valuation ranges are earnings-times-multiple arithmetic, shown as direction and order of magnitude relative to today, never as a target.
The five drivers that decide it. Three scenarios are just different settings of the same five dials.
- Azure growth durability. Today about plus-40 percent, guided to decelerate toward the high-30s in constant currency, capacity-constrained at least through 2026. The five-year question is the glide path: does Azure hold the 30s as capacity comes online, or fade toward the mid-20s as the law of large numbers and a 2027-28 digestion bite. The $627 billion backlog backs durability; the open question is how fast it converts to recognized revenue.
- Capex intensity feeding the depreciation drag on margin. This is the bear’s arithmetic. Cash capex as a share of revenue nearly doubled from FY23 to FY25 (about 13 percent to about 23 percent). Depreciation growing about 55 percent against Microsoft Cloud revenue at about 29 percent is the direct cause of the cloud-margin slide. The dial: does depreciation growth stay above AI-revenue growth (margin keeps compressing) or does revenue overtake it (margin troughs and re-expands).
- Copilot and Microsoft 365 AI monetization. The bull’s prize. Paid Copilot seats went from 15 million to more than 20 million against a roughly 450 million base, an attach rate of only about 4.4 percent. The dial: does attach inflect toward double digits (high-margin software dollars arrive and the capex-to-AI-revenue gap closes toward payback), or stall in single digits while the consumer assistant keeps losing mindshare.
- OpenAI stake value and dependency resolution. Both asset and liability. The roughly 27 percent stake is press-marked near $228 billion (a press pro-rata figure on the $852 billion round, not a filing figure). Recurring equity-method losses hit GAAP EPS; the nine-month gain was a one-off recap dilution gain. Post-April-2026 the relationship is non-exclusive and OpenAI is multi-cloud. The dial: does an OpenAI IPO crystallize the stake as a clean, visible asset while the now-diversified Microsoft keeps its distribution, or does OpenAI’s cash burn keep dripping losses through GAAP while the dismantled moat means Microsoft pays two tolls on a less-owned stack.
- The multiple re-rating. Today about 20 to 21 times forward versus a five-year average near 32.7 times. The dial: does the multiple re-rate up as returns prove out, hold at a “show-me” 20 times, or compress further toward a capital-intensive-utility multiple if the earnings leg confirms the bear. Rates are the ambient hurdle; a 10-year Treasury break above roughly 4.75 to 5.0 percent would add a discount-rate headwind to the whole long-duration cohort.
The single hinge across all five: does AI-revenue growth re-overtake depreciation growth before the multiple has to re-rate down on an earnings cut. Dials 1 and 3 (revenue) racing dial 2 (depreciation) is the whole game; dials 4 and 5 amplify the outcome.
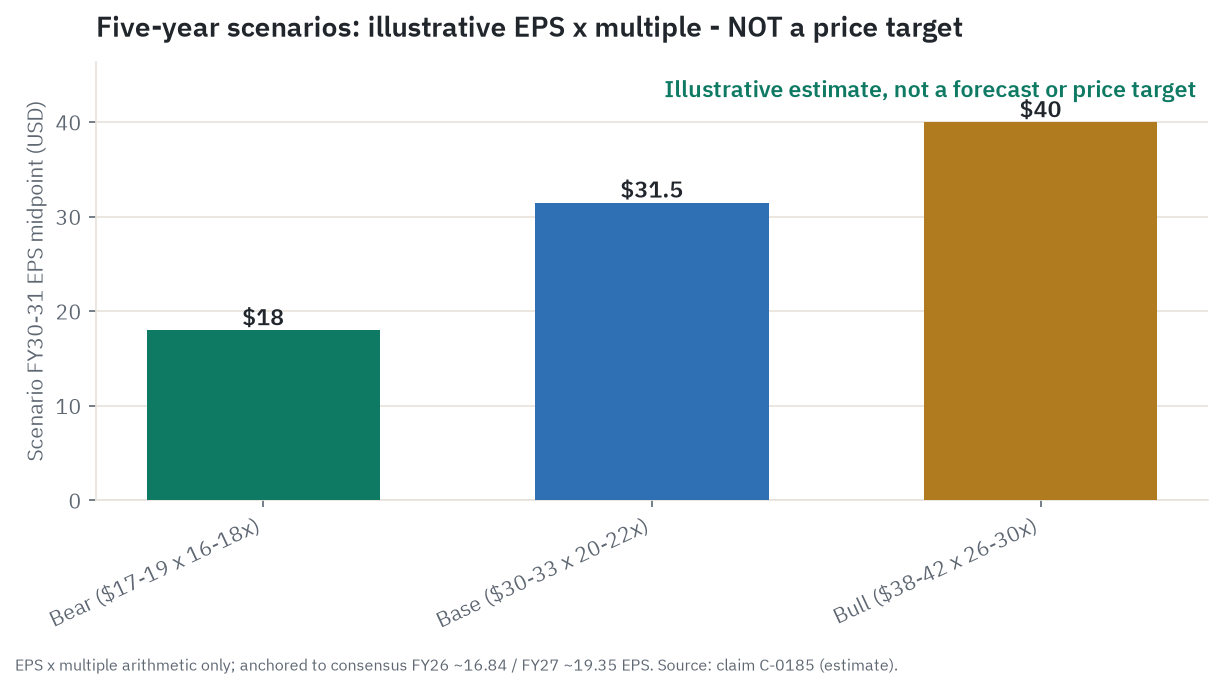
Bull: the up-stack capture arrives and the multiple re-rates. Azure holds the mid-30s as capacity unlocks; AI-revenue growth stays above 40 percent and re-overtakes depreciation growth, so cloud gross margin troughs near 65 to 66 percent and re-expands; Copilot attach inflects to double digits; useful-life assumptions hold; an OpenAI IPO crystallizes the stake; and the multiple re-rates toward 26 to 30 times as the return doubt resolves. Earnings compound mid-to-high teens off rising-and-real numbers, to an illustrative roughly $38 to $42 of EPS by about FY30-31. Illustrative valuation, estimate only and not a target: about $38 to $42 EPS times about 26 to 30 times implies a range well above today’s level. What has to be true: the application layer captures the AI dollar (attach inflects), and the Nvidia and depreciation tolls stop outrunning revenue. What most likely breaks it: Copilot attach stalls in single digits and Microsoft stays a low-margin distributor of rivals’ models.
Base: decelerating-but-durable growth, the multiple holds its discount. Azure glides from the high-30s toward the high-20s over the window (the guided deceleration plus a 2027-28 digestion air-pocket); depreciation and AI-revenue growth run roughly in step, so cloud margin stabilizes in the low-to-mid 60s; Copilot attach grinds from about 4.4 percent to high-single or low-double digits; useful lives unchanged; OpenAI losses keep dripping but the stake is a net positive once IPO-marked; and the multiple holds about 20 to 22 times, the “show-me” discount with no re-rate up or down. Earnings compound about 10 to 12 percent a year, and the starting point matters for where that lands: 10 to 12 percent for roughly five years off the FY26 figure near $17 lands closer to $27 to $30, so the higher $30 to $33 endpoint also leans on two ordinary tailwinds the base case assumes, namely that the compounding runs off the already-higher FY27 consensus near $19.35 rather than the FY26 base, and that continued buybacks keep shrinking the share count a percent or so a year, which lifts per-share earnings above the raw profit growth. With those assumptions stated, the illustrative landing is roughly $30 to $33 of EPS by about FY30-31; without the buyback and the higher starting base it is nearer $27 to $30. Either way it is an estimate, not a forecast. Illustrative valuation, estimate only: about $30 to $33 EPS times about 20 to 22 times implies a range modestly to meaningfully above today. The base case is “compounding reasserts; the multiple already did its de-rating.” What has to be true: the de-rate to 20 times was the whole adjustment, not the first leg, so consensus FY27 EPS holds and grows. What most likely breaks it: a depreciation catch-up cuts FY27 EPS before revenue growth overtakes it, which is the base case sliding into the bear.
Bear: the earnings leg finally arrives. This is the skeptic’s strongest case, weighted heavily, and it is not “Microsoft loses the AI race” dramatically. Azure decelerates harder than guided (toward the mid-20s) as a 2027-28 digestion hits and the “sold-out” scarcity eases; depreciation on the 2025-26 GPU vintages keeps outrunning decelerating AI revenue, so the capex-to-AI-revenue gap stops closing and cloud margin keeps sliding; a one-to-two-year haircut to assumed GPU useful life materializes (our illustrative estimate puts that at about $1.05 to $2.81 per share, roughly 5 to 15 percent of forward EPS, and Microsoft has not changed its useful lives, so this sizes a risk, not an event); a hyperscaler trims 2027 capex guidance and the cohort re-rates; OpenAI equity-method losses keep dripping and the recap gain does not repeat; and the multiple compresses to about 16 to 18 times on a cut forward EPS. Revenue still grows, but EPS stalls flat-to-modestly-up as depreciation eats the profit that would otherwise drop through, to an illustrative roughly $17 to $19 through the window (a consensus cut, not compounding). Illustrative valuation, estimate only: about $17 to $19 EPS times about 16 to 18 times implies a range below today’s level, the value-trap outcome where 20 times was not cheap because the earnings number was 10 to 15 percent too high. What has to be true: depreciation growth stays above AI-revenue growth long enough to force the consensus EPS cut the sell-side has not printed (even the low target $400 still sits above the $379 price, so the sell-side is structurally lagging). What saves the bear from itself: Copilot enterprise monetization inflects and the capex-to-AI-revenue ratio closes to breakeven, at which point 20 times on rising-and-real EPS is genuinely cheap and the bull wins.
The reader’s takeaway on the spread: the gap between bull and bear is not about whether Microsoft is a good company. All three scenarios have it growing revenue. The entire five-year dispersion is earnings-times-multiple: whether AI-revenue growth re-overtakes depreciation growth, and whether the market re-rates up, holds, or compresses. The bear is an earnings story the de-rate front-ran; the bull is a margin re-expansion story the de-rate ignored.
Catalysts and timeline. Near term: the FY26 Q4 print and first FY27 guide (about late July 2026) is the most important near-term catalyst; watch Azure constant-currency growth, the FY27 capex frame (a step-up or a digestion signal), cloud gross margin, Copilot seats, and any language on useful lives. The reported OpenAI IPO (confidential filing reported around mid-2026, possible late-2026 listing targeting $1 trillion-plus, all press) is the single biggest stake-crystallization event. The securities class action (filed June 12, 2026; see the data-quality flags; these are unproven allegations and Microsoft says they are without merit) keeps a headline overhang alive but is not a fundamental driver. Each quarterly print through FY27, the depreciation-versus-cloud-revenue gap is the metric that tells you which leg is winning. Multi-year inflections: the 2027-28 AI-capex digestion air-pocket, the GPU-vintage depreciation wave in FY27-29, the OpenAI IP-rights clock (research IP to roughly 2030, product IP to 2032), Maia silicon maturity, and any FTC action on AI bundling as a tail risk.
Leading indicators a reader can watch. In rough order of signal value: (1) the depreciation-growth-versus-AI/cloud-revenue-growth gap, today about plus-55 percent versus plus-29 percent, the master indicator; the quarter it closes is the bull’s confirmation, the quarter it widens is the bear’s; (2) Microsoft Cloud gross margin percentage, 69 to 66 and falling, watching for a trough-and-turn; (3) Copilot attach rate and paid seats, about 4.4 percent at 20 million, watching for the inflection toward double digits; (4) the capex-to-revenue ratio and FY27 capex-guidance revisions, watching whether a deceleration reads as discipline or as demand cooling; (5) the forward consensus FY27 EPS ($19.35), where the first cut is the bear’s starting gun.
Companies to watch (bull / base / bear)
A watch-list, not a recommendation list. The Bull, Base, and Bear lines are scenarios; the Watch line is what to monitor, not what to do.
Microsoft (MSFT). Role: the subject, an enterprise-distribution leader whose AI-capex premium just got re-rated.
- Bull: the de-rate already did the work; on rising-and-real EPS, 20 times is cheap versus its own 33-times norm.
- Base: compounding reasserts at about 10 to 12 percent EPS growth; the multiple holds its show-me discount.
- Bear: depreciation outruns AI revenue, FY27 EPS gets cut, and 20 times of a lower number is a value trap.
- Watch: the depreciation-versus-cloud-revenue gap, the cloud gross margin trough, Copilot attach, and the first FY27 EPS revision.
Alphabet (GOOGL). Role: the owned-stack rival the market is paying up for.
- Bull: owns Gemini, the TPU, and its cloud; the fastest-growing major cloud; clearly not losing the AI battle.
- Base: premium multiple holds as long as Search holds and Gemini keeps gaining.
- Bear: about $4.5 trillion at about 29 times prices AI dominance with no room for a stumble; Q1 profit flattered by an Anthropic markup; Search is the thing AI most disrupts.
- Watch: Google Cloud margin, Gemini enterprise-API share, and any Search-monetization wobble.
Amazon (AMZN). Role: the biggest cloud, judged on AWS not retail.
- Bull: AWS reaccelerated to 28 percent with the deepest custom-silicon plus Anthropic stack.
- Base: AWS holds the mid-to-high 20s; retail margin does the rest.
- Bear: AWS still grows slower than Azure and Google Cloud; Q1 profit flattered by a $16.8 billion Anthropic revaluation; heaviest capex on thin retail margins.
- Watch: AWS growth versus Azure, Trainium adoption, and capex discipline.
Meta (META). Role: the capex-sentiment control, not a cloud rival.
- Bull: cheapest of the set at about 17.6 times, 33 percent revenue growth, an ad flywheel that monetizes its own AI.
- Base: ad growth funds the capex; the multiple stays low but the business compounds.
- Bear: singled out alongside Microsoft for open-ended capex; Q1 profit flattered by a one-off tax benefit; no enterprise-AI revenue line to defend the spend.
- Watch: the capex guide, ad-revenue growth, and whether the AI spend shows up in ad performance.
OpenAI (private, no ticker). Role: Microsoft’s model supplier and roughly 27 percent stake; not buyable by a retail investor.
- Bull: an IPO marks Microsoft’s stake to a public price (press near $228 billion).
- Base: stays private and strategic; the stake is a net positive once marked.
- Bear: unprofitable and cash-burning (its losses hit Microsoft’s GAAP EPS), now multi-cloud and non-exclusive.
- Watch: the reported IPO timing, the equity-method loss line each quarter, and any further change to the Microsoft terms.
Anthropic (private, context only). Role: the enterprise-API leader, now inside Copilot as a subprocessor; owned partly by Amazon and Google.
- Bull: its presence in Copilot shows Microsoft can win distribution while renting the best model.
- Base: multi-model routing becomes the norm; the model layer commoditizes toward the distributor.
- Bear: Anthropic leading the enterprise and coding API layer is the evidence Microsoft’s primary model is losing, and that upside accrues to Amazon and Google.
- Watch: enterprise-API share trends and the reported Anthropic IPO.
Risk controls
The honest risk paragraph. The dominant risk is AI-capex cyclicality: the entire mega-cap buildout is young, and capex growth that runs about 51 percent in 2026 is widely modeled to decelerate hard in 2027 and 2028 (one house’s path runs roughly 51 percent, then 13 percent, then 5 percent; a forecast, not a fact), and a single hyperscaler cutting 2027 guidance would re-rate the whole cohort fast. Microsoft carries concentration risk in Azure and the cloud, where almost all the AI revenue and capex sit. Valuation after a compression cuts both ways: 20 times is cheap if the earnings hold and expensive if they get cut, and which one is true is precisely the open question. There is OpenAI counterparty and dependency risk: a cash-burning partner whose losses flow through GAAP and whose exclusivity to Microsoft has ended. There is regulatory risk, though it has eased on the merger axis (the UK CMA closed its inquiry, the EU accepted commitments to unbundle Teams with no fine, and the FTC’s work is at the staff-report level, not enforcement); the forward risk is a possible future review of Copilot bundling, which is prospective, not a current action. And there is execution risk on monetization, the Copilot attach rate being the clearest test.
To be explicit about what would change the thesis in either direction. The bull turns bear if consensus FY27 EPS gets cut, if depreciation growth stays above AI-revenue growth for three or four more quarters while cloud margin keeps sliding, if a useful-life shortening appears in a 10-K, if a hyperscaler cuts 2027 capex guidance, if Copilot attach stalls in single digits, or if the OpenAI dependency turns net-negative. The bear turns bull if the depreciation-versus-revenue gap closes, if Copilot attach inflects to double digits, if Azure re-accelerates as capacity unlocks and FY27 estimates rise rather than fall, or if an OpenAI IPO cleanly crystallizes the stake while the diversified model stack proves Microsoft keeps distribution regardless of which lab wins the frontier. One guardrail for the reader: nothing in this analysis says Microsoft, or any named peer, is insolvent or near it. Sector-wide warnings about AI-investment financing (press-reported forecasts from Morgan Stanley, JPMorgan, and a Federal Reserve governor about hyperscaler debt and financial-stability risk) are about the cohort and about debt-funded buildouts, not about Microsoft, which funds its capex out of its own cash and sits on net cash. Any “value trap” language in this piece is the bear scenario, explicitly hedged, never a statement about Microsoft’s solvency.
Methodology, sourcing, and data-quality flags
This piece was built from parallel research streams: the SEC filings (10-K, 10-Q, 8-K, proxy), market action and valuation, sentiment and OSINT, the macro and micro economics, the supply chain, and a five-year forward outlook, with a thesis-skeptic attacking the bull case and a compliance pass enforcing the disclaimers. The source hierarchy: SEC EDGAR is primary (Microsoft’s CIK 0000789019, filings verified directly); standard-setters and named research houses (TrendForce, Gartner, Menlo Ventures) are analyst-tier; reputable trade press is press-tier; anything modeled is labeled an estimate. Market cap is derived (shares from the latest 10-Q cover page times the last close), stamped, and disclosed against aggregators. Every load-bearing figure traces to a claim in the run’s ledger; the scenario numbers are labeled estimates.
Data-quality flags:
- Forward P/E is disputed across vendors. The figure runs about 19.3 to 23.2 times depending on whether the vendor uses next-twelve-months or forward-fiscal-year earnings, and GAAP versus adjusted EPS. We use about 20 to 21 times as the central read and never cite a single decimal as fact.
- Prices and the trading day. June 21, 2026 is a Saturday, so all prices are stamped to the June 18, 2026 close of $379.40. The peak ($542.07, October 28, 2025) and trough ($356.77, March 27, 2026) are on a closing basis. Re-running on a trading day will move every price, cap, and multiple.
- Market cap is derived, not an aggregator print. 7,428,434,704 shares (10-Q cover, April 23, 2026) times $379.40 gives about $2.818 trillion, consistent with aggregators near $2.82 trillion.
- The “100 percent multiple compression” decomposition depends on the peak forward multiple (about 32 to 33 times). If the true peak was about 28 to 30 times, the split softens toward roughly 90 percent. The robust claim is that estimates rose, so the drop is overwhelmingly a re-rating, not a precise 100 percent.
- The AI run-rate of about $37 billion (up about 123 percent) is a management framing, not an audited GAAP line. Microsoft does not itemize it; it blends Azure AI consumption, Copilot seats, and OpenAI-on-Azure. Treat the figure and the derived capex-to-AI-revenue ratio as directional, not precise. Note also the separate Menlo Ventures “$37 billion” (total enterprise generative-AI spend across the industry in 2025) is a different number from a different source.
- Definition differences. “Azure growth” is quoted reported (about 40 percent) and constant-currency (about 39 percent); “AI revenue” is a run-rate, not a recognized-revenue line; Copilot “seats” (paid licenses, more than 20 million) differ from “active users” (about 33 million across all surfaces including free).
- Consumer Copilot share is soft, single-house (Recon Analytics), and methodology-divergent by roughly 8 times (web traffic versus paid subscribers versus pick-rate). We report only the direction (flat-to-shrinking, a marginal number four) and carry the materiality caveat that this is consumer, not enterprise, and immaterial to the profit-and-loss. We never state a precise share as fact.
- The depreciation EPS sensitivity (about $1.05 to $2.81 per share from a one-to-two-year GPU-life haircut) is an illustrative estimate, ours, with inputs shown, not a forecast. Microsoft has not changed its useful lives; this sizes a risk, it does not predict an event.
- The June 12, 2026 securities class action is presented strictly as unproven allegations. A pension fund filed a complaint in Seattle federal court alleging Microsoft concealed Azure deceleration while ramping AI capex; it names Nadella and Hood as defendants only, with no implication of any wrongdoing, and no liability or judgment has been established. Microsoft has said the suit is without merit. The filing was reported by the wire and is dated; we could not corroborate the docket to a primary court source, so treat the allegations as unverified. Such suits are common after a large single-day drop.
- Analyst ratings and targets are opinion, not fact, attributed by house and dated: a Strong Buy consensus with a roughly $561 mean target, alongside specific downgrades (Melius to Hold, $430; Stifel on Azure deceleration). The “dominant narrative” characterization is a soft read on media tone.
- OpenAI and Anthropic valuations are press-reported private-round marks, not public market caps. OpenAI about $852 billion (and a reported $1 trillion-plus IPO target), Anthropic about $380 billion rising toward $900 billion-plus per press, are all dated, range-disclosed, and not independently verifiable. The Microsoft stake marks (about $135 billion at the $500 billion round, about $228 billion at the $852 billion round) are derived press figures, not balance-sheet values; Microsoft carries the stake at equity-method value.
- Free cash flow is derived. Microsoft does not report a GAAP free-cash-flow line; our figures are operating cash flow minus capex, and a stricter measure subtracting finance-lease outflows would be lower.
- No internal links. This site had no prior related post to cross-link at publication.
Key sources: Microsoft FY2025 10-K (filed 2025-07-30) and FY26 Q3 10-Q (period ended 2026-03-31, filed 2026-04-29) and the Q3 FY26 earnings release, all via SEC EDGAR (CIK 0000789019); Microsoft Investor Relations earnings materials; Alphabet, Amazon, and Meta Q1 2026 results via EDGAR and company IR; Menlo Ventures 2025 State of Generative AI in the Enterprise; stockanalysis.com, GuruFocus, and valueinvesting.io for point-in-time market data; press reporting from CNBC, Fortune, and trade outlets for the private-valuation and litigation items, each flagged press-tier.
Prepared June 21, 2026. Figures are point-in-time and will change. This is research and analysis for educational purposes, not investment advice, not a recommendation, and not a solicitation. Mega-cap AI infrastructure spending is young and deeply cyclical, and the capex, depreciation, and AI-demand figures that drive this story can move fast in either direction. Verify all figures independently and consult a licensed financial advisor before making any decision.