
Research date: June 22, 2026 | OSINT research on Apple Inc. (Nasdaq: AAPL), its installed-base and Services earnings engine, the two regulated profit pools at the heart of the thesis, and the supplier and peer names it is measured against. Live prices, stamped hard.
Important disclaimer. This is independent OSINT (open-source intelligence) research compiled for educational and informational purposes only. It is not investment advice, not a recommendation or solicitation to buy, sell, or hold any security, and not a statement that any security is suitable for you. The author is not a financial advisor and has no fiduciary relationship with any reader. All figures are point-in-time (as of June 22, 2026) and move fast - prices, market caps, valuation multiples, and market-share figures may be stale by the time you read this. Any bull / base / bear scenarios and “companies to watch” are analytical framings, not price predictions or guarantees, and the five-year illustrative valuations are simple arithmetic on stated assumptions, not price targets. Do your own due diligence and consult a licensed professional before making any financial decision.
Companion tool - jump to the interactive dashboard to sort and filter every peer and supplier in this piece and explore the money-flow map and valuation context.
TL;DR
Apple is two businesses wearing one logo. It is a hardware company by revenue, with the iPhone at roughly half of the $416.2 billion it sold in FY2025, and it is a software-and-services company by profit growth, with a Services line that is only about 26 percent of revenue but throws off about 42 percent of the company’s gross profit at a 75.4 percent gross margin. That Services annuity rides on more than 2.35 billion active devices and over a billion paid subscriptions, and it is the reason the stock trades the way it does. On June 22, 2026 AAPL changed hands around $299.13 for a market cap near $4.4 trillion, at a trailing price-to-earnings ratio around 36 and a forward P/E around 32 to 33, well above its own roughly 28-to-30 five-year median, on a top line that grows low-single-digits in a normal year. The single biggest thing that has to keep going right is that Services keeps compounding double-digits while the buyback shrinks the share count about 3 percent a year. The single biggest thing that could break it is not the balance sheet, which is pristine, but regulation: the two fattest profit pools inside Services, the roughly $20 billion a year Google pays to be the default Safari search engine and the App Store commission, are precisely the two that courts and regulators are dismantling. JPMorgan sizes a full loss of the Google payment at about $12.5 billion of revenue and roughly 15 percent of earnings per share. The bull case is a durable compounder where AI eventually shortens the upgrade cycle and the directly-priced subscriptions carry Services through any regulated-pool loss. The bear case is a 2027 one-two punch on the stock, not the business: a China give-back as Beijing’s subsidy fades, an adverse Google-appeal signal, and an AI story that still has no ship date, all hitting a long-duration multiple while rates stay higher-for-longer. The honest read is the rules-based rating: Hold, Overvalued on valuation, because you pay full price here for quality you can measure and a regulatory tail you cannot. All figures below carry a date stamp and move fast. Verify live quotes before acting.
Explore it yourself: the interactive dashboard
Open the dashboard in a full screen
The dashboard holds the thirteen peer, supplier, and counterparty names in this piece, sortable by market cap, by what they are to Apple (valuation peer, supplier, assembler, or deal counterparty), and by tier. Use it to check any single name as you read.
Prefer a spreadsheet? Download the Excel valuation model with the bull, base, and bear earnings paths, the buyback math, and the exit-multiple assumptions laid out so you can flex them yourself. The scenario prices in that file are illustrative arithmetic, not targets.
What Apple actually is (the 90-second primer)
Picture a tollgate at the entrance to a private city. Apple built the city, the roads, the storefronts, and the front gate, and it sold more than 2.35 billion residents the keys. Most of the money you notice changing hands is the sale of the keys themselves, the iPhones and Macs and Watches. The money that quietly compounds is the toll: every time a resident pays for storage, a subscription, an app, a warranty plan, or lets a search engine pay for the prime billboard at the gate, Apple clips a fee. The keys are a one-time, lower-margin sale. The tolls repeat at more than double the margin. That split is the whole investment debate in one image.
In FY2025, the fiscal year ended September 27, 2025, Apple sold $416.161 billion, up 6.4 percent from $391.035 billion the year before. Of that, Products were $307.0 billion and Services were $109.2 billion. iPhone alone was $209.586 billion, close to half the company. Services grew 14 percent, hardware grew low-single-digits, and the gap between those two growth rates, compounded, is what turns a slow-growing hardware company into a stock that trades like a grower.
The reason the toll is worth so much is margin. Apple’s FY2025 gross-margin split, straight from the 10-K, was Products at 36.8 percent and Services at 75.4 percent, with the company total at 46.9 percent. Run the arithmetic on the filing’s own numbers and Services, at about 26 percent of revenue, contributed roughly 42 percent of total gross profit, $82.3 billion of $195.2 billion. Every dollar of revenue that shifts from a phone to a subscription is worth roughly 38 extra points of gross margin. That single mechanic is why total company gross margin has climbed from 44.1 percent in FY2023 to 46.2 percent in FY2024 to 46.9 percent in FY2025 on only modest revenue growth.
Two facts frame everything that follows. First, the installed base is the real asset, not any single product. Second, the two highest-margin pieces of the Services line, the Google search payment and the App Store commission, are the exact two that regulators in the US, the EU, Japan, Korea, and the UK are actively prying open. Hold both thoughts. The rest of the piece is about how durable the toll is when the people who write the rules have decided to lower it.
How the money flows
flowchart TD
    CUST["End customers: ~2.3B+ active devices - Q2'26 rev ~$111.2B"]
    GOOG["Alphabet pays Apple ~$20B/yr - Safari default search"]
    APPL["APPLE - design, iOS, App Store, brand - keeps the economics"]
    APPSTORE["App Store commission - inbound toll, top-margin"]

    TSMC["TSMC - A/M silicon, EXCLUSIVE - narrowest chokepoint"]
    DISP["Samsung / LG / BOE - OLED displays"]
    SENS["Sony + Samsung - image sensors"]
    QCOM["Qualcomm - modems, being phased out by ~2027"]
    OTHER["Broadcom, Corning, Hynix/Micron - RF, glass, memory"]

    FOX["Foxconn ~65-70% + Luxshare / Pegatron - assembly, thin margin"]
    INDIA["Tata + Foxconn India - ~23% of assembly, US-bound by 2026"]
    CHINA_SUB["Chinese subcomponents - feed even India plants"]

    CUST -->|hardware + Services $| APPL
    GOOG -->|default-search fee| APPL
    APPSTORE -->|commission| APPL
    APPL -->|chip orders, captive| TSMC
    APPL -->|component spend| DISP
    APPL -->|component spend| SENS
    APPL -->|modem royalties| QCOM
    APPL -->|component spend| OTHER
    APPL -->|assembly fee| FOX
    APPL -->|assembly fee| INDIA
    TSMC -->|SoCs| FOX
    DISP --> FOX
    CHINA_SUB --> INDIA
    CHINA_SUB --> FOX
    FOX -->|finished devices| CUST
    INDIA -->|finished devices| CUST
Read this top to bottom and the investing point is the shape. Money comes into Apple from three directions, not one. The obvious one is customers buying hardware and paying for Services, which produced about $111.2 billion in the March 2026 quarter alone. The second is Alphabet, which pays Apple an estimated $20 billion a year just to be the default search engine in Safari, money that arrives at close to a 100 percent margin because Apple incurs almost no cost to collect it. The third is the App Store commission, a toll that developers pay on digital sales. Those second and third inflows are tiny in revenue terms next to the iPhone, but because they cost almost nothing to earn, they punch far above their weight in profit.
Now trace the money back out the bottom, because the chain narrows to a single dangerous point. Apple designs its own A-series and M-series chips, but it owns no fab. Every one of those leading-edge chips is etched by TSMC, and there is no viable second source at the volume and yield Apple needs. From there the chip goes to assembly, where Foxconn makes roughly 65 to 70 percent of all iPhones and Chinese and Indian partners make the rest, on razor-thin margins. Even the iPhones assembled in India still depend on Chinese-made subcomponents. So the picture is a company that keeps almost all the economics at the top, pays a sliver to a long line of single-source or near-single-source suppliers below it, and funnels the worldwide flow of orders through one Taiwanese foundry. The fat margin sits at the top, in Services. The fragility sits at the bottom, in the supply chain. And the part the market argues about, the regulated tolls, sits right next to the fat margin.
Whatever cash survives that round trip goes to one place above all: shareholders. Apple generated about $98.8 billion of free cash flow in FY2025 and returns on the order of $200 billion a year through buybacks and dividends. That return machine is doing a lot of the quiet work in the story, and we come back to it.
The installed base and the flywheel
The number that anchors the entire Apple thesis is the active installed base: more than 2.35 billion active devices worldwide, an all-time high that Tim Cook cited on the January 2025 earnings call, up roughly 150 million year over year. Within that, over 1 billion are active iPhones. One honest caveat up front: this is Apple’s own reported metric, a verbal figure from an earnings call, not an audited line in the 10-K, so treat it as Apple-reported, directionally reliable, and slightly stale rather than a hard filing fact.
Why does one number matter so much? Because the installed base is the flywheel. Every phone, watch, and laptop that gets sold becomes a new tollgate that pays Services revenue for years. Apple now counts well over 1 billion paid subscriptions across its platform, a record, feeding a Services line that crossed $109 billion for the full year. The hardware sale is not really the product. It is the customer-acquisition cost for an annuity.
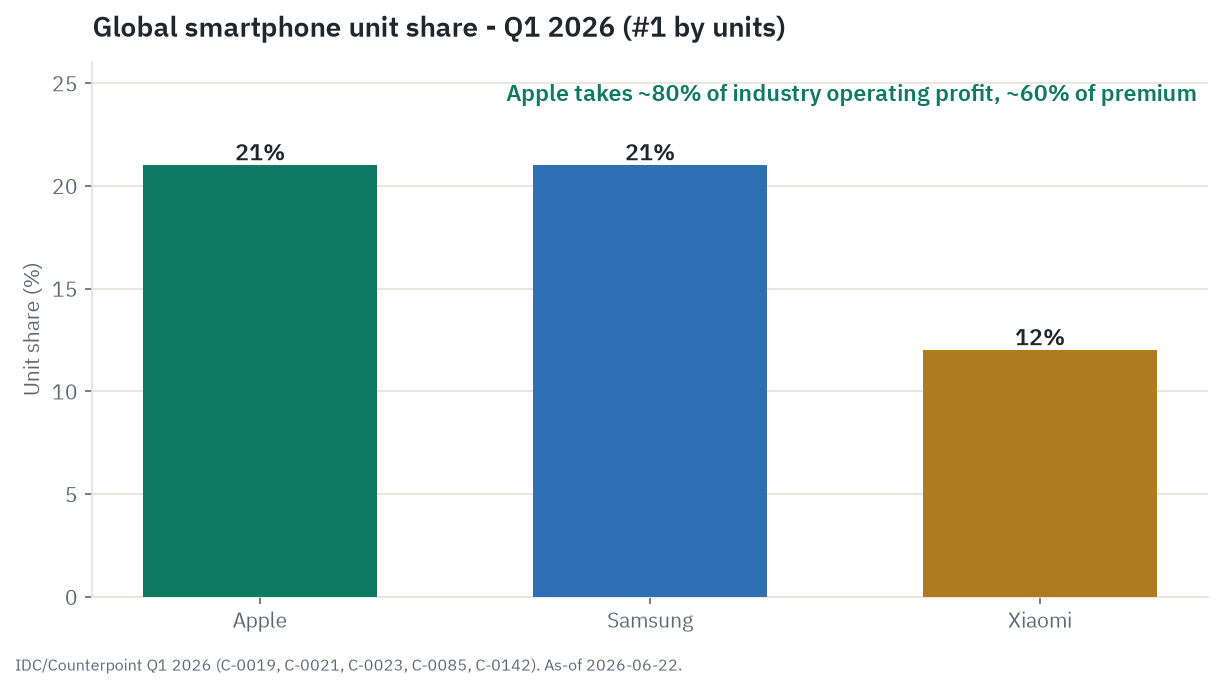
The lock-in is the part competitors cannot easily copy. Once you own an iPhone, an iCloud library, a few years of Messages, an Apple Watch paired to your phone, and a couple of subscriptions billed through your Apple ID, the cost of leaving is not the price of a new phone. It is the friction of rebuilding your digital life somewhere else. That switching cost is why Apple holds roughly 60 percent of the premium ($600-plus) smartphone segment and captures something like 80 percent of the entire smartphone industry’s operating profit despite selling only about one in five phones by unit. The company sells a minority of the world’s phones and keeps the overwhelming majority of the world’s phone profits.
There is a catch baked into the flywheel, and it is the central tension of the hardware side. People are keeping their phones longer. By late 2025, 42 percent of US iPhone buyers were replacing a phone they had owned three years or more, up from 32 percent a year earlier, and only 29 percent were replacing a phone two years old or newer. The average traded-in iPhone is now something like three and a half to three and three-quarter years old. A lengthening upgrade cycle means the hardware engine that feeds the flywheel turns more slowly each year. Apple has answered that with price, not volume, and that is the next section.
Segment field guide: where the revenue comes from
Here is the FY2025 revenue map, every figure from the 10-K.
| Segment | FY2025 net sales | YoY | What drives it |
|---|---|---|---|
| iPhone | $209.586B | +4% | ~50% of revenue; Pro-mix and storage uptiering carry ASP |
| Services | $109.158B | +14% | App Store, Google payment, iCloud, AppleCare, ads, subscriptions |
| Wearables, Home & Accessories | $35.686B | -4% | the only declining category |
| Mac | $33.708B | +12% | M-series refresh strength |
| iPad | $28.023B | +5% | steady |
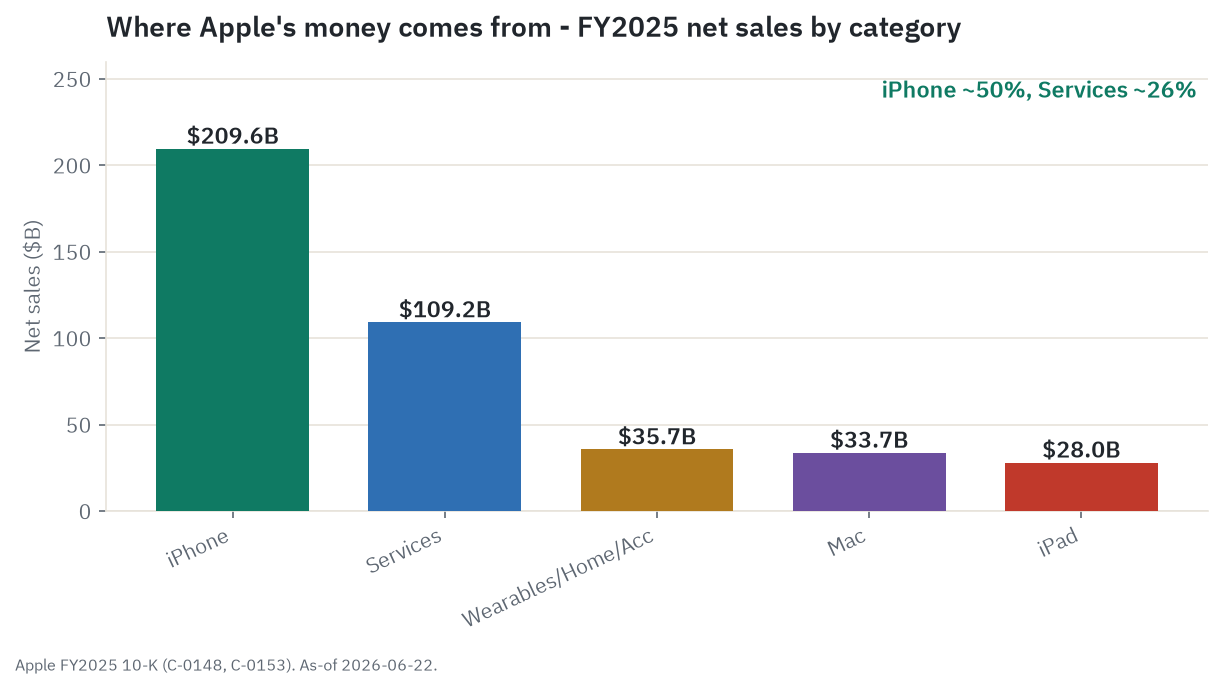
iPhone is the center of gravity at about half of all revenue. Its FY2025 growth of 4 percent came, in the 10-K’s own words, “due to higher net sales of Pro models.” That is the tell: the dollar growth is average selling price, not units. Global iPhone ASP has pushed past about $900, a record, with the US weighted-average retail price near $985 and the Q4 2025 figure reportedly tapping $1,000 as the premium iPhone 17 mix kicked in. That is roughly three times the global Android average near $295. Apple holds entry list prices steady and lets the mix toward Pro and Pro Max, plus the shift of the base storage tier from 128GB to 256GB, do the work. This is classic late-cycle premium-brand pricing power: monetizing a loyal, saturated base harder rather than adding many new buyers.
The size of that pricing power shows up in the cost stack. Counterpoint’s teardown estimate puts the bill of materials on an iPhone 17 Pro Max at about $408, against a US weighted-average retail price near $985 and a roughly $1,199 list on the 256GB Pro Max. The biggest component lines are silicon and radio: the A19 Pro chip around $91, the 5G modem around $90, the camera system around $80, and the display around $80. Hold the obvious caveat: that $408 is an industry-data estimate, not an Apple figure, and it is only the parts. It excludes assembly, logistics, R&D, iOS development, warranty, and channel, which is why the reported Products gross margin is 36.8 percent and not the roughly 66 percent the bare component spread implies. Still, the gap between a ~$408 parts cost and a ~$985 selling price is the clearest single picture of why Apple keeps almost all of the hardware economics while its assemblers fight over pennies.
Services is the profit engine, decomposed in its own section below. At 14 percent growth on a 75.4 percent gross margin, it is the line that justifies the multiple.
Mac had a strong FY2025 at plus 12 percent on the M-series refresh cycle, and an OLED MacBook Pro is on the roadmap for late 2026 into early 2027. iPad grew 5 percent, steady. Wearables, Home and Accessories was the one category that shrank, down 4 percent, a reminder that not every Apple line is a grower.
Geographically, the FY2025 split was Americas $178.353 billion (up 7 percent), Europe $111.032 billion (up 10 percent), Greater China $64.377 billion (down 4 percent), Japan $28.703 billion (up 15 percent), and Rest of Asia Pacific $33.696 billion (up 10 percent). Greater China, roughly a fifth of the business in a strong year, was the only segment to decline in FY2025, and the 10-K pinned it on lower iPhone sales. That China line then did a sharp U-turn in FY2026, which we get to in the macro section, and the durability of that reversal is one of the load-bearing debates in the whole piece.
The Services engine, decomposed
Services is not one thing. It is at least three different economic engines stacked inside one 75.4 percent-margin line, and they carry wildly different regulatory risk. Understanding which is which is the difference between thinking the whole Services story is fragile and seeing that most of it is bolted down while a concentrated slice is exposed.
Engine one: the Google search payment. Alphabet pays Apple an estimated $20 billion a year, reportedly around 36 percent of Safari search-ad revenue, to be the default search engine across Safari, iOS, and Mac. The same payment sits on the other side of Alphabet’s own income statement, where it funds part of the search franchise, so a single appeal ruling can re-rate both companies at once. In the trade this is called a traffic-acquisition-cost payment, or TAC: Google is buying the traffic that flows from being the box every Safari search lands in, and the fee it pays to win that placement is the cost of acquiring that traffic. This is the single highest-margin chunk of money in the company and arguably the highest-margin $20 billion in all of technology, because close to all of it falls to gross profit. It is also the single most fragile profit pool Apple has. In September 2025, Judge Mehta’s remedy ruling in the Google search case let the payment survive but stripped its exclusivity and capped the term at one year, so it is now re-bid annually with no legal floor. Both sides appealed to the D.C. Circuit, Google filed its opening brief on May 22, 2026, and a decision could land in 2027. JPMorgan’s worst-case math, a complete termination of the payment, is about $12.5 billion of revenue and roughly 15 percent of EPS. A 33x multiple does not have a 15 percent earnings air-pocket priced in.
Engine two: the App Store commission. Apple’s standard take is 30 percent on in-app purchases and first-year subscriptions, dropping to 15 percent for year-two-plus subscriptions, small developers under $1 million a year, and video and news partners. Here the important nuance is that the rate is high but the base it applies to is narrow. Apple’s own commissioned study put the App Store ecosystem at roughly $1.3 trillion of billings and sales in 2024, but more than 90 percent of that pays Apple zero commission, because physical goods and services (think Uber rides, Amazon orders, DoorDash) and in-app advertising are exempt by design. The commissionable slice is mainly the roughly $131 billion of digital goods, dominated by games and subscriptions, which is estimated to generate something like $30 billion a year in commissions. So when you read “$1.3 trillion App Store economy,” remember that Apple’s actual toll touches a small, specific, high-margin corner of it. That study is Apple-commissioned, so read the framing as self-interested.
The App Store toll is the slow leak, not the cliff. Jurisdiction by jurisdiction, regulators are forcing the rate open. The EU’s Digital Markets Act fined Apple 500 million euros in April 2025 for anti-steering and forced layered fees, alternative app stores, and third-party payments, with that fine under appeal. Japan’s Mobile Software Competition Act took full effect in December 2025, mandating alternative stores and third-party payments at fees of 5 to 26 percent. South Korea requires alternative in-app payment providers. The UK designated Apple with Strategic Market Status in October 2025, with conduct rules from April 1, 2026. Each jurisdiction that lets a developer route around the commission chips at the rate a little more. None of them, on its own, is a cliff. Together they are a steady downward grind on the highest-margin slice.
Engine three: the subscriptions Apple prices directly. iCloud, Apple Music, TV+, Arcade, Fitness+, AppleCare, and Apple’s own advertising. Apple Pay, Apple Card, and Tap to Pay sit inside this engine too, as a small payments and financial-services slice that Apple does not break out and that is folded into the broader directly-priced bucket rather than into the App Store line. It carries its own regulatory thread: digital wallets are one of the markets the DOJ smartphone complaint names, so the wallet business is not entirely outside the legal weather even though it is a minor revenue line. The bulk of engine three is the part that is sticky, high-margin, and largely out of regulators’ reach, because Apple sets the price itself on a locked-in base. If you want the genuinely durable core of the Services story, it is narrower than the headline $109 billion line, and it is this engine. The bear case can take the Google payment and grind the App Store rate, and this engine still stands. That is the bull’s deepest line of defense, and it is a real one.
The whole reason this section matters is that the market pays a Services-like multiple on the entire company. If you believe all three engines are equally durable, the multiple is defensible. If you separate them, you see that roughly $20 billion of near-pure-profit Google money and a $30 billion App Store commission line are the two carrying nearly all the legal risk, while the directly-priced annuity carries almost none.
The Apple Silicon and AI chapter
Two technologies get treated as the Apple story by the headlines, and both are better understood as chapters than as the thesis. The first is silicon. The second is AI. Take them in turn.
On silicon, Apple’s advantage is real and its dependence is total. Apple designs its own chips, and the current generation, the A19 and A19 Pro in the iPhone 17 line, is built on TSMC’s N3P 3-nanometer process; the M5 Mac chips are on TSMC 3nm as well; and 2nm is deferred to the A20 generation around the end of 2026. Designing the chip is the moat. Building it is the vulnerability, because Apple relies on TSMC for essentially 100 percent of its leading-edge silicon and has no second source at volume. Samsung’s competing 3nm process reportedly yields only 30 to 40 percent against TSMC’s 80-plus. There is one notable shift in Apple’s bargaining power: in 2026, Nvidia overtook Apple as TSMC’s largest customer, roughly $33 billion and 22 percent of TSMC revenue for Nvidia against about $27 billion and 18 percent for Apple. Apple no longer single-handedly anchors TSMC’s roadmap, which slightly weakens its priority claim on scarce 2nm capacity. There are early, preliminary reports of an Apple-Intel foundry arrangement using Intel’s 18A-P process as a possible second source, but neither company has confirmed the scope, it would cover lower-end chips at most, TSMC keeps the overwhelming majority, and nothing ships before 2027. Treat it as diversification chatter, not a done deal.
Apple is also methodically designing its modem supplier out. Its first in-house modems, the C1 and C1X, shipped in 2025 in the iPhone 16e and the iPhone Air, the C2 (codenamed Ganymede) is set to debut in the iPhone 18 line in 2026 adding mmWave, and Apple aims to replace Qualcomm entirely by around 2027. The iPhone 17 Pro still uses a Qualcomm modem today. This is a margin and control story playing out over a few years.
On AI, the honest framing is that this is a defensive cost, not a revenue line, and at the moment it landed soft. Apple’s home-grown Siri overhaul, first promised at WWDC 2024, slipped repeatedly. The fix was to license Google. In January 2026 the two companies confirmed a multi-year partnership in which a custom Google Gemini model powers the rebuilt Siri and a re-architected Apple Intelligence. Per Bloomberg’s Mark Gurman, Apple pays Google roughly $1 billion a year for a custom 1.2-trillion-parameter Gemini model, about eight times the size of Apple’s own cloud model; Apple has not confirmed the terms, so treat the $1 billion and the parameter count as reputable-press estimates. Tim Cook has said the new Siri runs on-device and in Apple’s Private Cloud Compute rather than on Google’s servers, and the WWDC 2026 reveal on June 8 framed it as “Apple Foundation Models co-developed with Google” running inside Apple’s own infrastructure. The strategic posture is clear enough: Apple frames Gemini as a stopgap it intends to replace with in-house models, even as it has lost AI talent including the head of its models team.
Here is the part the headlines skip. WWDC 2026 gave no firm ship date for the new Siri, and the stock fell roughly 2 percent that day and another 3 percent the next. Apple does not sell Apple Intelligence as a standalone subscription. By the most-cited analyst framing, which is interpretation and not company guidance, the monetization is indirect: the bet is that better AI shortens the iPhone upgrade cycle and deepens Services and iCloud+ attach. So the entire AI upside in the bull case is an unproven “AI super-cycle” lifting upgrades, while the roughly $1 billion Gemini bill is a real, structural new cost layered onto the 75 percent Services margin with no AI revenue line attached to offset it. One genuine Apple edge: Apple Intelligence runs on 8GB of RAM against Google’s Gemini Intelligence at 12GB, which means a wider chunk of Apple’s installed base can actually run it. The verdict: AI is first a moat-defense to keep the base from defecting and a second-order Services lever, not a direct revenue driver. If it fails to move upgrades, the iPhone hits what skeptics call a “plateau of utility” while the Gemini bill keeps running. This is the softest leg of the whole bull thesis.
The supply chain and where it could break
The supply story is a study in concentration that Apple is slowly, expensively trying to dilute. Three chokepoints matter.
The first is the foundry, already covered: one company, TSMC, for all leading-edge chips, with the added geopolitical wrinkle that those fabs sit in Taiwan. A serious Taiwan-Strait disruption would hit Apple’s product roadmap and margins directly with no near-term route around it. This is the narrowest single point of failure in the entire business.
The second is assembly. Foxconn (Hon Hai) makes roughly 65 to 70 percent of all iPhones, and Apple has historically been more than half of Foxconn’s revenue. Around it sit Luxshare, which acquired Pegatron and Wistron’s China plants to become a top-tier assembler and draws about 70 percent of its revenue from Apple, and Pegatron. This is the thin-margin floor of the chain, and it is heavily concentrated in Asia. Apple’s 10-K says plainly that final assembly of “substantially all” of its hardware is outsourced to partners “located in Asia.”
The third is the China-concentration problem and Apple’s answer to it, the India push. China’s share of global iPhone assembly fell to roughly 74 percent in 2025 from about 83 percent the prior year, while India’s share rose to about 23 percent and is projected to reach 26 to 28 percent in 2026. Tata Electronics handles roughly 35 percent of India output and Foxconn the rest. Apple aims to source the majority of US-market iPhones from India by the end of 2026, targeting 60 million-plus units a year, and in the June 2025 quarter roughly half of US-sold iPhones were already India-made. India duty cuts (assembled phones and PCBAs from 20 to 15 percent in 2024, many parts from 15 to 10 percent in 2025) have brought India-assembled cost within roughly 2 to 3 percent of China-built per a JPMorgan cost model, against a punishing 30 percent premium for US assembly. The catch the diversification narrative glosses over: India’s plants still depend critically on Chinese-made subcomponents like sensors, PCBs, and batteries, and an iPhone’s parts span 13 to 15 nations. Moving final assembly out of China does not move the component supply chain out of China.
Tariffs are the live cost on top of all this. Apple paid about $1.1 billion in tariff costs in the September 2025 quarter and guided to about $1.4 billion for the December holiday quarter, for $3 billion-plus across calendar 2025. The US backdrop for 2026 includes a roughly 22.5 percent combined add-on tariff on consumer electronics (treat the precise composition as approximate), a 25 percent tariff on select advanced chips that began January 15, 2026 but exempts consumer-electronics uses, the end of the $800 de minimis exemption in late February 2026, and a suspension of heightened reciprocal tariffs that lapses November 10, 2026. By analyst inference, not company disclosure, Apple absorbed roughly 60 percent of the chip-tariff cost on China-imported components and passed the rest through $50-to-$100 Pro-tier price hikes, holding blended iPhone gross margins roughly steady; the March 2026 quarter Products-side gross margin actually firmed to around 49.3 percent. Tariffs are a manageable headwind so far, not a thesis-breaker, but the November lapse is a margin tell worth watching.
Company by company: who’s who
Apple is the anchor here. The names below are not a peer cohort you would value Apple against on a single multiple; they are the companies whose moves are read-throughs for Apple’s thesis. All market caps are point-in-time as of June 22, 2026 and move daily. Each gets the one number that matters, plus a bull and a bear line.
The megacap valuation cohort
Microsoft (MSFT) - around $2.82 trillion. Windows, Microsoft 365, Azure, Copilot. A valuation peer, not a customer, in the same institutional “quality compounder” bucket, and a competitor in PCs and AI assistants. For the other side of the megacap-AI debate, see the Microsoft AI read. Bull: Azure plus Copilot give it an enterprise-AI growth engine Apple lacks on the top line. Bear: heavy AI capex on a rich multiple leaves little room for an enterprise-IT slowdown.
Alphabet (GOOGL) - around $4.4 trillion. The most important name on this list because it is both a peer and Apple’s single biggest commercial counterparty. Alphabet pays Apple the roughly $20 billion a year for default Safari search and now reportedly supplies the Gemini model behind the new Siri for about $1 billion a year. Android and Pixel also compete with the iPhone. Bull: the broadest AI platform, and the Apple deal is mutually entrenching. Bear: the search-remedy appeal could cap or ban the Apple default payment, which would hit both companies’ highest-margin economics at once.
Amazon (AMZN) - around $2.6 trillion. AWS, marketplace, Prime, ads, Alexa. A valuation peer and ecosystem rival (Alexa vs Siri, Prime Video vs TV+) and a major retail channel for Apple products. Bull: AWS and a fast-growing ad business drive rising operating margins. Bear: capital-intensive logistics and AWS AI capex pressure free cash flow.
Nvidia (NVDA) - around $5.1 trillion. The AI bellwether and the name Apple is framed against as an “AI laggard,” with little direct commercial tie since Apple designs its own silicon. The NVIDIA deep dive lays out the AI-capex franchise Apple is measured against and now the bigger TSMC customer. Bull: an effective monopoly on training-class accelerators with the CUDA moat. Bear: hyperscaler customer concentration and a peak-cycle valuation; any AI-capex digestion hits it hardest and reads through to the whole megacap multiple, Apple included.
Meta (META) - around $1.5 trillion. Facebook, Instagram, WhatsApp, ads, Reality Labs. The company most directly hurt by Apple’s App Tracking Transparency, and an XR competitor (Quest vs Vision). Bull: ad re-acceleration and AI-driven targeting lift engagement. Bear: Reality Labs burns cash and the ad business stays exposed to Apple’s privacy controls. The inverse exposure is the point: any forced opening of ATT would help Meta and hurt Apple’s small, fast-growing ad line.
The critical suppliers
TSMC (TSM) - around $2.0 trillion, NYSE ADR (primary listing Taiwan 2330). Apple’s most critical supplier, fabricating essentially all A-series and M-series silicon. Bull: the dominant leading-edge foundry with AI and smartphone demand filling 2nm and real pricing power. Bear: Taiwan geographic concentration is a tail geopolitical risk, and Apple is now only its number-two customer, weakening Apple’s priority claim on scarce capacity.
Broadcom (AVGO) - around $1.8 to $2.0 trillion. Wi-Fi, Bluetooth, and RF filter content in the iPhone under a multiyear deal. Bull: AI custom-ASIC and networking demand plus VMware software. Bear: Apple’s in-housing of connectivity erodes the iPhone content over time.
Qualcomm (QCOM) - around $225 billion. Apple’s modem supplier and a declining-dependence relationship; Apple is more than 10 percent of Qualcomm revenue today but is guiding that to near zero by about 2027 as the C-series modems take over. Bull: automotive, IoT, and PC diversification plus durable licensing royalties. Bear: losing the iPhone modem socket removes a major profit pillar.
Samsung Electronics (005930.KS) - around $1.5 trillion, Korea-listed (thin OTC ADR). The classic “frenemy”: Apple’s primary premium-phone rival and, through Samsung Display, the dominant supplier of iPhone OLED panels plus memory. Bull: an HBM and AI-memory upcycle plus OLED and foundry give multiple growth legs. Bear: memory is cyclical, Galaxy faces Chinese-OEM pressure at the high end, and the foreign listing means access friction for US retail.
Corning (GLW) - around $168 billion, NYSE. The Ceramic Shield cover glass on iPhones, with direct Apple investment behind it. Bull: AI-driven optical-fiber demand plus the durable cover-glass franchise. Bear: mobile glass is tied to smartphone unit cycles and a few large customers.
Sony Group (SONY) - around $120 billion, NYSE ADR (primary listing Tokyo 6758). The dominant supplier of the CMOS image sensors in iPhone cameras; also an entertainment and gaming competitor. Bull: image-sensor leadership plus a high-margin games, IP, and music portfolio. Bear: camera content is tied to iPhone cycles and Apple sourcing; note that Apple has signed Samsung Foundry to make image sensors in Texas, breaking Sony’s long exclusivity, with Samsung possibly taking 20 to 30 percent of Apple’s sensor volume by 2027.
The assemblers
Foxconn / Hon Hai (2317.TW) - around $120 billion, Taiwan-listed (thin OTC ADR). Apple’s largest final-assembly partner, making the bulk of iPhones in China and increasingly India, with Apple its single biggest customer. Bull: fast-growing, higher-value AI-server assembly diversifies away from thin phone-assembly margins. Bear: razor-thin margins, heavy single-customer dependence, and geopolitical and labor exposure.
Luxshare Precision (002475.SZ) - around $75 billion, Shenzhen-listed and effectively not US-buyable for retail. A fast-rising AirPods assembler and iPhone assembler, the leading mainland-China assembler, with Apple a dominant share of its revenue. Bull: climbing the value chain from components to full iPhone and AI-server assembly. Bear: extreme single-customer concentration plus China-geopolitical exposure, and the Shenzhen listing is largely inaccessible to US retail.
The thread running through the supplier and assembler list is the same: heavy single-customer (Apple) concentration, several of them being actively designed out (Qualcomm on modems, Broadcom on connectivity, Sony losing sensor exclusivity), and meaningful US-access friction on the foreign-listed names.
What the filings say
Everything in this section is from Apple’s own filings: the FY2025 10-K (year ended September 27, 2025), the Q2 FY2026 10-Q and 8-K (quarter ended March 28, 2026), the 2026 proxy, and Berkshire’s 13F.
The income statement. FY2025 total net sales were $416.161 billion, up 6 percent, on a total gross margin of $195.201 billion, or 46.9 percent, a record. Operating income was $133.050 billion, about 32 percent of sales. Net income was $112.010 billion and diluted EPS was $7.46, up from $6.08 the prior year. Then growth re-accelerated into FY2026: Q2 FY2026 revenue was $111.184 billion, up 16.6 percent and a March-quarter record, with net income of $29.578 billion and diluted EPS of $2.01. For the first half of FY2026, revenue was $254.940 billion, up 16 percent. R&D rose sharply, up about 33 percent in the first half, the spend signature of the AI and silicon build-out.
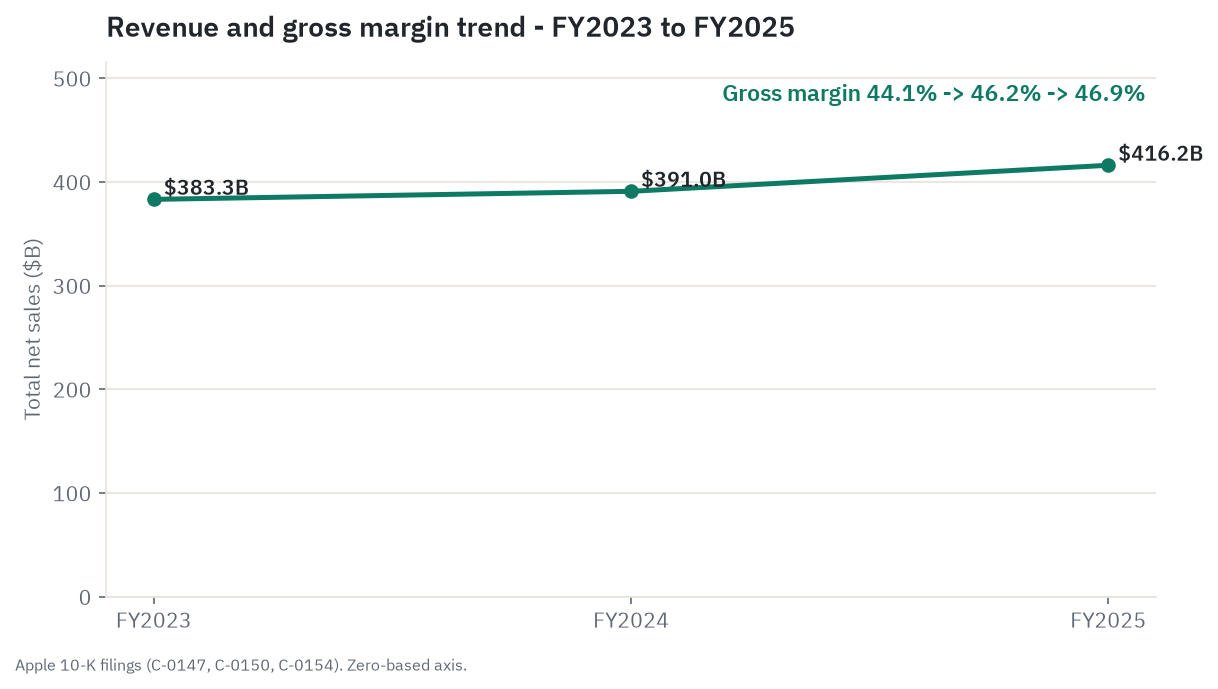
What drives the profit, again from the filing. Products gross margin was 36.8 percent and Services gross margin was 75.4 percent in FY2025. Services is about 26 percent of revenue but about 42 percent of gross profit, and its margin is still rising (73.9 to 75.4 percent year over year) while the Products margin slipped slightly (37.2 to 36.8 percent) on mix and, in the 10-K’s words, “tariff costs.”
Cash flow and the balance sheet. This is where Apple is in a class of its own. FY2025 free cash flow was about $98.8 billion (operating cash flow $111.482 billion minus capex $12.715 billion), and the model is capex-light. At March 28, 2026, Apple held $146.6 billion of cash and marketable securities against $84.7 billion of total debt, for a net cash position of about $61.9 billion, up from roughly $33.8 billion at the FY2025 close as the debt stack shrinks toward the company’s long-stated net-cash-neutral goal. Inventory was a remarkably lean $6.747 billion against $416 billion of revenue, the signature of a build-to-demand, outsourced model. There is no balance-sheet stress here of any kind.
Capital returns and dilution. Apple repurchased roughly $89.3 billion of stock in FY2025, announced a $100 billion buyback program in May 2025, and then on April 30, 2026 authorized an additional $100 billion program. The dividend was raised to $0.27 a quarter, announced with the Q2 FY2026 results. The buyback steadily shrinks the share count: diluted shares fell from about 15.02 billion in FY2025 to 14.726 billion in Q2 FY2026. Stock-based compensation is more than offset by repurchases, so the net count is meaningfully down over five years. That share-count reduction is quietly doing much of the EPS-growth work, a point that decides much of the five-year outlook below.
The risk factors Apple itself discloses. The 10-K names them plainly: single-product concentration (a “significant portion” of sales from one product, the iPhone at about half, where a demand decline “could significantly impact net sales and gross margins”); manufacturing concentration in Asia; complex and changing antitrust, privacy, and digital-platform laws (the legal backbone of the App Store and Google-payment risks); FX exposure on a majority-international revenue base; and tariffs and macro conditions as material to results.
Legal proceedings, in the filing’s own careful language. The EU fined Apple 500 million euros in April 2025 for anti-steering, ordered the removal of steering restrictions, and Apple has appealed; a final adverse Article 6(4) determination could in theory carry fines up to 10 percent of annual worldwide net sales, which on $416 billion is a roughly $40 billion-plus ceiling, a statutory maximum and not an expected charge. The US DOJ filed a civil antitrust suit in March 2024 alleging smartphone monopolization and seeking equitable relief, not damages; it is ongoing, with no merits ruling. Apple states it has meritorious defenses and believes it complies.
Ownership, insiders, and capital return
Institutional ownership runs around 64 percent. The only disclosed holders above 5 percent are Vanguard at about 9.6 percent and BlackRock at about 7.1 percent. Insiders as a group hold under 1 percent; all directors and executive officers together hold about 9.08 million shares, and CEO Tim Cook holds about 3.28 million, immaterial as ownership but a routine Form 4 signal source.
The single most notable ownership fact is the marquee seller. Berkshire Hathaway held about 227.9 million Apple shares worth roughly $57.8 billion at March 31, 2026, down from a peak near 915 million shares before its heavy 2024-2025 trimming. Apple is still a top Berkshire holding, but the multi-year unwind by Apple’s most famous long-term shareholder, selling into exactly the strength the current multiple reflects, is a signal worth sitting with. It is not a verdict on the business, which Buffett has praised repeatedly, but it is a reminder that a great business and a great stock at a given price are not the same thing.
The capital-return machine is the other side of the ownership story. About $200 billion a year flows back to holders through buybacks and dividends, funded by roughly $98.8 billion of annual free cash flow plus the balance sheet. The buyback shrinking the count about 3 percent a year is the mechanism that lets EPS grow even when revenue barely does. The risk embedded in that: if a combined Google-payment loss and a China give-back ever dented free cash flow at the same time, the pace of the buyback that is quietly doing the EPS work would be the thing to watch.
What the market is paying
All figures here are point-in-time as of June 22, 2026 and are press or analyst tier (data vendors), not primary.
Apple traded around $299.13 intraday, against a prior close of $298.01, inside a 52-week range of $198.96 to $317.40. That puts the stock roughly 84 percent of the way up its own one-year range, about 5.8 percent below the 52-week high. The market cap was about $4.39 trillion (vendor range $4.36 to $4.41 trillion), one of the two largest companies on earth. The trailing one-year total return was strong, about plus 51 percent, driven largely by the run off the 2025 lows near $199, while the 2026 year-to-date return of about 9 percent is more middling versus the AI-levered megacaps that led the year. Beta is a modest 1.09. Apple is roughly 6.8 percent of the S&P 500, the second-largest single name behind Nvidia.
The valuation is rich against both Apple’s own history and a fair-value lens, and this is the crux of the bear case:
- Trailing P/E around 36, well above Apple’s own roughly 28-to-30 five-year median.
- Forward P/E around 32 to 33 on the most-cited vendor. One vendor showed 28.7 on June 9, so the exact figure is disputed and turns on which forward EPS each house uses, but either way it is a premium multiple. On consensus FY2026 EPS near $8.75, the math lands at the low-30s.
- PEG around 2.4 to 2.85, meaning you pay up relative to expected growth.
- EV/Sales around 9.6 to 9.7, rich against Apple’s own roughly 7-to-8 historical band.
- Price-to-free-cash-flow around 30 to 34, high versus the low-20s the stock often carried before 2023.
- Dividend yield around 0.35 percent, immaterial; Apple returns cash mainly via buybacks.
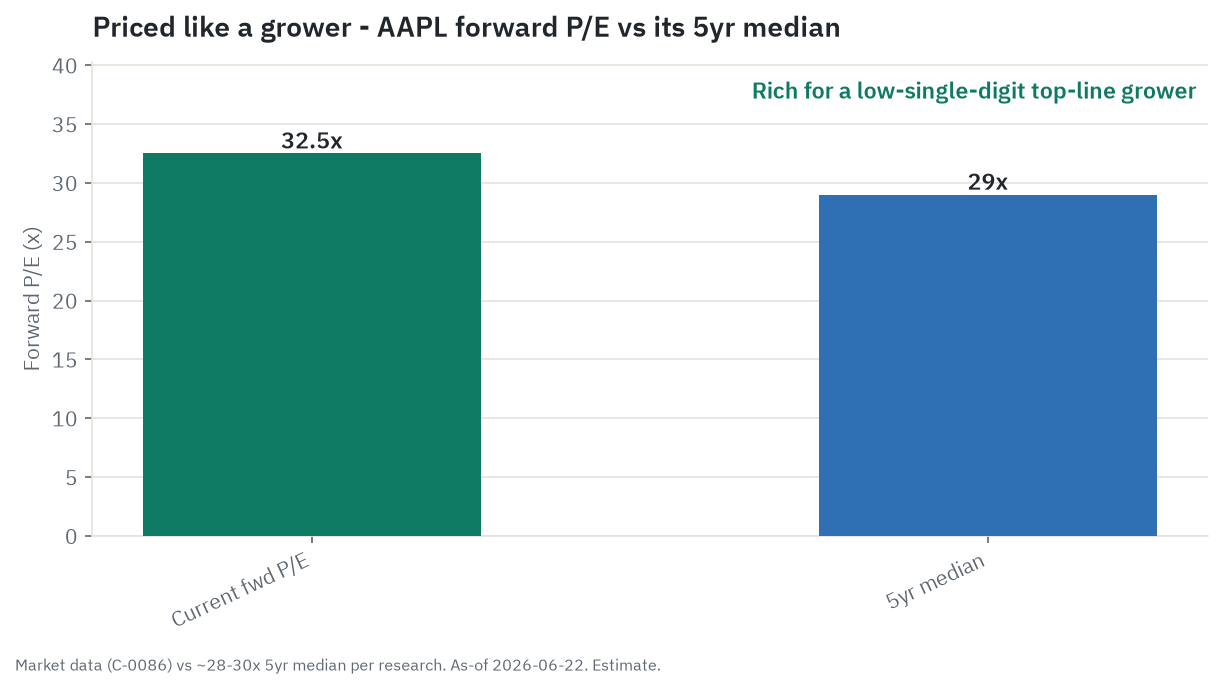
The read is straightforward. The multiple reflects the market paying for the installed-base annuity, the Services growth, and a flight-to-quality bid, not for high revenue growth. The figure hardest to defend is a roughly 33x forward P/E on a company whose top line grows low-to-mid single digits in a normal year. For context on where Apple sits in its market: by units it was the number-one smartphone vendor globally in Q1 2026 at 21 percent share (tied with Samsung), it led Europe at 30 percent (tied with Samsung), and in China it was number two at 19 percent behind a resurgent Huawei at 20 percent. It also holds roughly 60 percent of the premium segment and captures about 80 percent of industry operating profit.
On the sell-side, the consensus is a Buy or Moderate Buy from about 47 analysts, with an average 12-month price target near $314 against the roughly $299 spot, implying only about 5 percent upside. Targets are opinion, not fact. The more interesting signal is the spread: a high near $400 (Wedbush) against a low near $215, a band roughly $185 wide on a single megacap. That dispersion is itself the story. The Street does not agree on what Apple is, and the tails of the band encode the AI re-rate at the top and the regulatory de-rating at the bottom.
What the crowd is saying
This section is signal, not fact, and the softest data in the piece.
The dominant event of the window was WWDC 2026 on June 8 and 9, and it landed soft. Apple revealed the long-promised context-aware Siri and the next Apple Intelligence but gave no firm ship date, and the stock fell about 2 percent on day one and 3 percent the next session. Veteran Apple-watcher Gene Munster put it bluntly: the stock fell because there was no Siri timeline, and “the Siri story is already two years old.” Coverage is cooling on AI execution while staying constructive on cash flow and capital return. A secondary thread, narrative rather than numbers, is leadership: this was framed as Tim Cook’s final WWDC, a succession overhang.
Retail sentiment is neutral and recently bruised. StockTwits sentiment moved to neutral from bearish right after WWDC, reading as disappointment rather than capitulation. Attention spiked hard, message volume up 242 percent week over week and 580 percent month over month around the event, a real and datable attention surge, though attention is not direction. The chatter looks organic, a megacap with one of the largest natural followings on the market and no sign of a thin-float pump.
Now the useful part, where the crowd’s story diverges from the filings. Three narratives are fighting for control:
-
“AI laggard.” Apple is late, leaning on a Google deal to power Siri, with no monetization path and no ship date. The WWDC sell-off is this camp’s evidence. The divergence: the feared mechanism, AI failure compressing the upgrade cycle and Services growth, is a forward worry. The actual filings show intact margins, record Services, and a 2.35 billion-device base. The crowd is pricing an AI disappointment the income statement has not yet shown. That gap is the single sharpest divergence here, and it cuts both ways. The crowd may be pricing a disappointment the income statement keeps refusing to deliver, or the filings may be a lagging indicator of a platform shift the crowd is pricing early.
-
“Durable compounder.” The installed-base flywheel, Services growth, and the cash machine justify a premium multiple regardless of AI timing. This is the floor under the stock and why the average target still sits above spot. Its blind spot is the regulatory tail, which this camp largely ignores.
-
“Regulatory overhang.” The DOJ case, the EU DMA, and the existential risk to the $17-to-20 billion Google payment. Its blind spot: retail chatter barely prices this. The crowd is fixated on Siri while the real earnings-at-risk sits in the regulated profit pools. The crowd is watching the wrong risk relative to the filings.
Net: the market average, about 5 percent upside, effectively votes “durable compounder, fairly valued,” while the tails of the target band encode the AI-laggard and AI-re-rate extremes. The crowd’s mood is more bearish than the sell-side average. Discount every sentiment score heavily; trust the consensus structure and the WWDC event read.
Regulatory and legal exposure
This is the standalone risk that touches the most economics, and it deserves its own section because it is where the bear case actually lives. None of the matters below is settled, and none is stated here as a decided outcome.
The Google search payment. Covered above and worth repeating because it is the largest single at-risk item. Judge Mehta’s September 2025 remedy kept the payment but stripped exclusivity and capped the term at one year; the D.C. Circuit appeal, with Google’s opening brief filed May 22, 2026, could decide in 2027. JPMorgan’s worst case is about $12.5 billion of revenue and roughly 15 percent of EPS.
The US DOJ smartphone case. The DOJ and several state AGs sued Apple in March 2024 alleging monopolization of the smartphone market, targeting cloud streaming, super apps, smartwatches, messaging, and digital wallets. The court denied Apple’s motion to dismiss in June 2025, so the case proceeds to discovery, with trial not expected before about 2027 and equitable relief, not damages, sought. No merits ruling exists as of mid-2026.
The EU Digital Markets Act. The 500 million euro anti-steering fine of April 2025 is under appeal, alternative app stores and third-party payments are live in the EU, and Apple’s layered fee structure (a 2 percent acquisition fee, a 5-to-13 percent store-services fee, and a 5 percent Core Technology Commission, with a 0.50 euro per-install Core Technology Fee whose transition stalled) remains under Commission review, with the theoretical fine ceiling at 10 percent of global turnover (20 percent for repeat breaches).
The other jurisdictions. Japan’s Mobile Software Competition Act took full effect in December 2025 (alternative stores and 5-to-26 percent fees). South Korea mandates third-party payment providers. The UK granted Apple Strategic Market Status in October 2025 with conduct rules from April 2026. France fined Apple 150 million euros over its App Tracking Transparency implementation in March 2025, and Germany’s antitrust office is investigating ATT with a fine decision pending.
Quantifying the aggregate, carefully. No single published source adds up the total operating profit at risk across the Google payment, App Store erosion, and the ATT fines. The harness’s own illustrative estimate, explicitly a scenario synthesis and not a sourced figure, is that the combined operating-income-at-risk in a severe-but-not-total case is roughly $15 to $25 billion a year, with the Google payment dominating. Treat that band as illustrative arithmetic anchored on two verified pieces (JPMorgan’s roughly $12.5 billion Google worst case and the roughly $30 billion App Store commission line), not as a published number.
One geopolitical item belongs here and must be stated precisely. Chinese government agencies and state-backed firms have reportedly asked employees not to bring iPhones or other non-Chinese phones to workplaces, per Bloomberg reporting on informal restrictions that accelerated across state firms and agencies from late 2023. There is no nationwide statutory ban. Do not read this as “China banned the iPhone”; read it as reported, informal workplace conduct in a market where Apple’s China revenue still rebounded 28 percent in the March 2026 quarter.
The macro and micro backdrop
The scenarios below lean on two macro words, rates and China, so it is worth laying out the actual backdrop they are leaning on rather than assuming it. Apple is, underneath the compounder framing, a premium consumer-electronics maker with a Services annuity bolted on. The hardware roughly three-quarters of revenue rides the consumer-discretionary cycle; the Services quarter is far more insulated because it scales with the size of the installed base, not with this quarter’s spending mood. The whole point of the annuity is to smooth the hardware cycle. The macro question is whether that cycle is about to turn against it.
The US consumer in mid-2026 is resilient at the top and fraying at the bottom. This is a K-shaped economy, and Apple’s buyer sits in the upper leg, the high-income household that is still spending. Consensus 2026 real GDP growth is around 2.2 percent, unemployment is roughly 4.4 to 4.5 percent and stable, and recession odds sit in a wide band rather than a single number: roughly 15 to 30 percent, with Goldman around 30 percent as of spring 2026 and the more benign soft-landing models lower (the Sahm Rule at 0.10 against a 0.50 recession trigger, the New York Fed yield-curve model near 15 percent). The tell to watch is not the headline but the shape. Payroll gains had slowed to roughly 14,000 a month in the six months to January 2026, against a 122,000 monthly average in 2024. Growth is holding while hiring is thin. The single most dangerous macro turn for Apple is not a payroll wobble at the bottom; it is a wealth shock that hits the top leg of the K, an equity drawdown that dents exactly the household that buys a $1,000 phone.
Rates are the part that bears on the stock more than the business, and the distinction is the whole point. The Fed held the federal funds rate at 3.50 to 3.75 percent on June 17, 2026, its fourth consecutive hold, and the dots turned hawkish: the median end-2026 projection rose to 3.8 percent from 3.4 percent in March, nine participants now see at least one hike this year, and cuts have been pushed into 2027 and 2028. The reason is inflation, with headline CPI running about 4.2 percent in May 2026 (energy and the Iran conflict driving it) against a cooler core near 2.9 percent. Here is why that matters to a stock that grows its top line low-single-digits. Apple trades as a long-duration asset: most of the value the market pays for sits in Services cash flows years out. When rates stay high, the discount rate on those far-off flows rises, and a long-duration, low-growth multiple compresses. Think of it like a mortgage in reverse. The further out the payment, the more a higher rate shrinks what it is worth today, and Apple’s premium multiple is mostly a claim on far-out payments. The business itself is nearly rate-proof, a net-cash company with no funding need whose cash pile earns more when front-end rates are high. The risk from rates is a de-rating of the stock, not a miss on the earnings.
China is the swing factor, and right now it is swinging up on policy. After 18 months of decline, Greater China reversed hard in FY2026, with the December quarter up about 38 percent year over year to more than $25.5 billion and the March quarter up about 28 percent to $20.5 billion, an all-time China iPhone record. The engine behind the rebound is partly genuine iPhone 17 demand and partly Beijing, which expanded its consumer trade-in subsidy in 2026 to cover smartphones (a 15 percent subsidy capped at 500 yuan on phones under 6,000 yuan) and front-loaded 62.5 billion yuan, about $8.93 billion, of special bonds for the first quarter. The bear read is that subsidy demand is borrowed from the future, so once the trade-in money is spent a 2027 air-pocket is a live risk, the exact give-back the base and bear scenarios point at. The first sign of it would be Greater China revenue decelerating from those plus-28 percent prints toward flat or negative.
Two smaller backdrop lines round it out. About 60 percent of Apple’s revenue is international, so the dollar matters a point or two on reported growth. The Dollar Index roundtripped in 2026, dipping below 97 early (a mild tailwind to reported international revenue) then firming back above 100 after the June Fed hold, so the early-year help fades to a mild headwind if it holds. And tariffs, covered in the supply-chain section, are a contained margin tax of roughly $3 billion across 2025, absorbed and partly passed through, with the November 10, 2026 lapse of the reciprocal-tariff suspension the calendar tell to watch. None of these macro inputs points to a near-term demand cliff. The honest framing is that the backdrop is supportive but not pristine, and the two things most likely to flip it are a wealth shock to the high-income consumer and a 2027 China give-back, with higher-for-longer rates pressing on the multiple the whole time.
Durability and synthesis
Pull the threads together and the durability question splits cleanly, which is usually the honest answer.
What is durable: the installed base of 2.35 billion-plus devices is a real, sticky asset; the Services annuity compounds at double-digits on a 75.4 percent margin; the balance sheet is best-in-class with about $62 billion of net cash and $98.8 billion of free cash flow; total gross margin keeps climbing as the mix shifts toward Services; and about $200 billion a year of buybacks shrinks the count under any scenario. None of that depends on the AI narrative or the next demo. A patient owner can hold this as a slowly improving premium-ecosystem annuity with a capital-return engine attached, and the part of Services Apple prices directly (iCloud, AppleCare, Music, TV+, ads) is the piece no court can re-rate.
What is fragile is the multiple, not the business. You pay roughly 33x forward earnings for a company whose top line grows low-single-digits, whose two highest-margin profit pools are the exact two regulators are dismantling, and whose AI story is a defensive cost with no ship date and no revenue line. The premium is paid for durability and capital return, not for growth, which means any genuine crack in the durability story de-rates the stock hard with no growth cushion underneath it. The 2026 strength is also partly borrowed: the China rebound rests materially on Beijing’s expanded trade-in subsidy, and the iPhone 17 wave looks more like pent-up catch-up on a lengthening cycle than a form-factor supercycle.
So is the durability real? The business is. The price is the part that carries the risk. The most likely path is neither a collapse nor a moonshot. It is that the directly-priced annuity and the buyback keep compounding underneath while the market argues about the multiple and the two regulated pools, and the stock’s outcome over five years comes down to whether it still pays a Services multiple at the end of it.
The five-year outlook
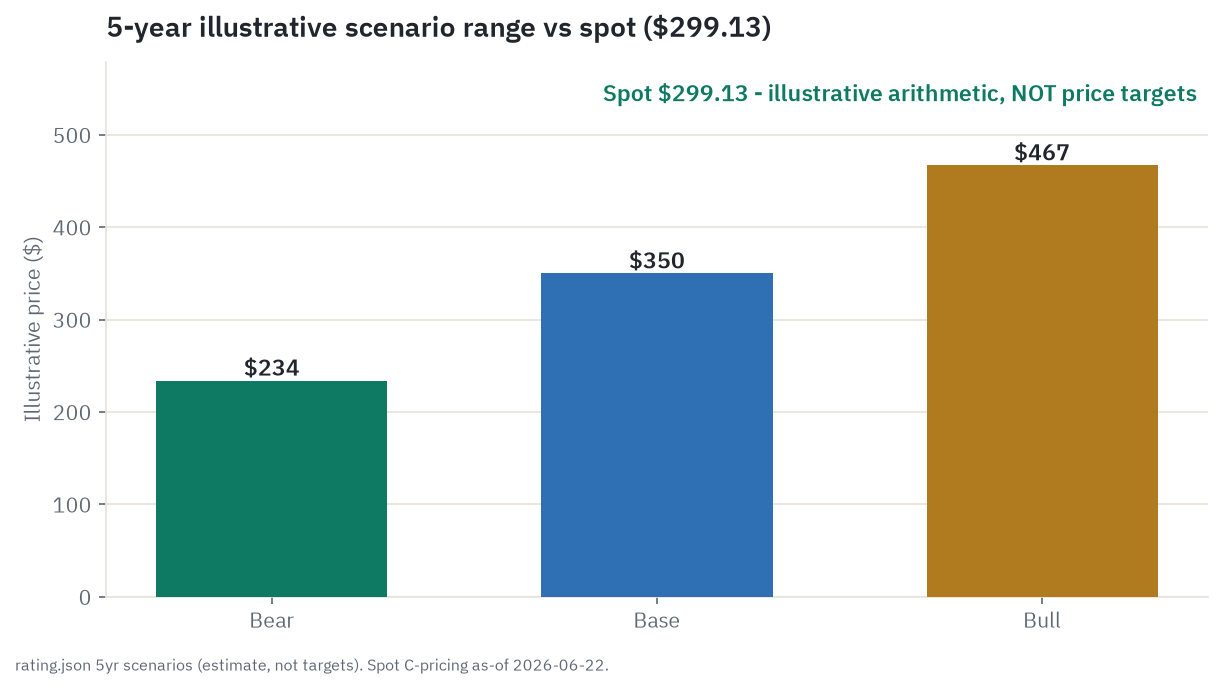
Everything here is an estimate, labeled as such. The illustrative valuations are simple arithmetic on stated assumptions, shown so you can see how a scenario translates into a stock. None of them is a price target. Spot anchor is about $299, with roughly 14.7 billion diluted shares shrinking about 3 percent a year on buybacks.
Four dials decide the outcome. One, Services compounding, the profit engine. Two, the two regulated profit pools, the swing on Services durability. Three, the iPhone cycle and ASP, the hardware base that feeds the annuity. Four, the multiple, where the stock actually moves. The scenarios are just different settings of these four dials.
Bull [estimate]
AI and Siri, once shipped, plus the 2026 foldable and an OLED MacBook line, shorten the upgrade cycle and lift units; revenue compounds 6 to 8 percent a year. Apple holds number one globally, roughly 60 percent of premium and 80 percent of industry profit. The Services mix pushes total gross margin past 48 percent, and the Google payment survives the appeal intact. The multiple re-rates as the “AI compounder” narrative wins and holds around 33 to 35x forward. Revenue grows from about $416 billion toward the mid-$500 billions; EPS compounds high-single to low-double-digits on growth plus the buyback. Illustrative arithmetic: FY2030E EPS around $13 to $14 at about 33x lands in a high-$400s area. What has to be true: Services keeps compounding double-digits AND the Google payment survives AND AI actually accelerates upgrades. What most likely breaks it: AI fails to move upgrades and the iPhone hits a plateau of utility while the Gemini bill keeps running.
Base [estimate]
The upgrade cycle stays long; revenue compounds low-to-mid single digits (3 to 5 percent), with iPhone roughly flat on units and ASP doing the work. Share is stable. The Services mix lifts gross margin gently; the Google payment survives but is re-bid at a flat-to-slightly-lower rate; the App Store rate erodes slowly at the edges, the slow leak rather than a cliff. The multiple compresses modestly from the low-30s toward the 28-to-30 median as rates stay higher-for-longer. EPS still compounds mid-to-high single digits because the buyback shrinks the count about 3 percent a year, so earnings grow faster than the tape. Illustrative arithmetic: FY2030E EPS around $12 at about 29x lands in a mid-$300s area. What has to be true: Services keeps compounding faster than the device base, no binary regulatory loss, and the buyback continues at scale. What most likely breaks it: a 2027 China give-back as the subsidy fades, swinging Greater China from plus 28 percent back toward flat or negative.
Bear [estimate]
This is the skeptic’s case, and it is a real one. You are paying low-30s forward for a low-single-digit grower whose two best profit pools are the live regulatory targets, while the marquee holder sells into the strength. A 2027 China air-pocket plus the lengthening cycle leave revenue flat-to-down for a stretch. The Google payment is stepped down or lost (about $12.5 billion of revenue and roughly 15 percent of EPS, JPMorgan’s worst case) and the App Store rate erodes faster across the EU, Japan, Korea, and the UK; the roughly $1 billion Gemini bill is a structural new drag with no AI revenue line. The multiple de-rates toward 25 to 28x on the durability crack plus higher-for-longer rates. The damage is to the multiple, not the balance sheet, because there is no solvency question with $62 billion of net cash and $98.8 billion of free cash flow. Illustrative arithmetic: FY2030E EPS around $9 to $10 (the base path minus the roughly 15 percent EPS hit from losing the Google payment, partly offset by the buyback) at about 25x lands in a low-to-mid $200s area, a roughly 15 to 25 percent drawdown from spot with earnings barely moving. What has to be true: an adverse Google-appeal outcome OR accelerated App Store erosion, AND a China give-back, AND AI failing to re-accelerate upgrades, AND rates staying high. The single thing that defends against it: the directly-priced annuity on a locked-in base, plus the buyback shrinking the count under the de-rating.
Catalysts and timeline
Near term: Q3 FY2026 earnings around late July or early August (China-rebound durability, Services run-rate, tariff trajectory); the fall 2026 launch (iPhone 18, the first book-style foldable at a reported $1,800 to $2,500, the OLED MacBook Pro); a firm Siri ship date, absent at WWDC and a sentiment catalyst either way; the Fed path, where the dots now see a possible hike; and the November 10, 2026 lapse of the reciprocal-tariff suspension. Multi-year: the roughly 2027 D.C. Circuit Google-appeal decision (the single biggest binary for the $20 billion payment); the roughly 2027 DOJ trial; the 2027 China subsidy give-back risk; full Qualcomm modem replacement by about 2027; 2nm at the A20 around the end of 2026 and the India-assembly shift; AI glasses around 2027; and the Tim Cook succession.
Leading indicators to watch
The handful of observable metrics that tell you in real time which scenario is winning: Services revenue growth rate (the master gauge; double-digits is base or bull, single-digits is the annuity cracking); Greater China revenue year over year (the +28 percent prints fading toward flat or negative is the first sign of the bear); Google-appeal headlines around 2027; iPhone units versus ASP (units re-accelerating on AI or the foldable is bull, ASP-only growth on flat units is the late-cycle base); total gross margin (climbing toward 48 percent is Services winning, a stall is tariff, memory cost, or App Store erosion biting); the buyback pace and share count; and a concrete Siri ship date with an early upgrade read.
Companies to watch (bull / base / bear)
Apple (AAPL) - the anchor, around $299 and a roughly $4.4 trillion cap at low-30s forward earnings.
- Bull: Services keeps compounding double-digits, AI eventually shortens the upgrade cycle, the Google payment survives the appeal, and the premium multiple holds.
- Base: steady low-single-digit revenue growth, Services-led, with EPS compounding faster on the buyback; the multiple normalizes partway toward the 28-to-30 median.
- Bear: the Google payment is stepped down or lost (about 15 percent of EPS), App Store rates erode across jurisdictions, a 2027 China give-back exposes the wave as borrowed, AI fails to move upgrades, and the stock de-rates toward the high-20s multiple with earnings barely moving.
- Watch: Services growth, Greater China year over year, the Google-appeal docket, total gross margin, and a Siri ship date.
Alphabet (GOOGL) - the search-payment counterparty.
- Watch: the same D.C. Circuit appeal that threatens Apple’s $20 billion also unwinds Google’s distribution; an adverse ruling hits both.
TSMC (TSM) - the silicon chokepoint.
- Watch: Taiwan-Strait risk on the one source with no second, and Apple’s weaker priority claim now that Nvidia is the bigger customer.
The India-supply-chain and assembler names (Foxconn, Tata-linked, Luxshare) - the diversification read.
- Watch: whether US-bound iPhones actually shift majority-to-India by end-2026, and whether the Chinese-subcomponent dependence narrows.
The megacap cohort (MSFT, AMZN, NVDA, META) - the multiple read-through.
- Watch: any AI-capex digestion at Nvidia or the cloud names that compresses the whole megacap multiple, Apple included.
Risk controls
Ranked roughly by how likely each is to bite, here is the honest risk stack.
- Valuation and multiple compression. At roughly 33x forward on a low-single-digit grower, about 5 percent above the consensus target, the biggest risk is simply that the durability premium decays toward the 28-to-30 median. The fundamentals are strong; the price is the exposure.
- The Google payment. About $20 billion of near-pure-profit on a one-year, non-exclusive term, with a 2027 appeal that carries a tail where it is capped or banned. A 33x multiple does not embed a 15 percent earnings air-pocket.
- App Store fee erosion. The slow leak across the EU, Japan, Korea, and the UK, grinding the highest-margin slice of Services jurisdiction by jurisdiction.
- A 2027 China give-back. The +28 percent rebound rests partly on a trade-in subsidy that can fade; watch Greater China revenue for the first crack.
- AI execution. No Siri ship date, a defensive Gemini cost with no revenue line, and an unproven super-cycle thesis. If AI fails to move upgrades, the upgrade-acceleration narrative dies while the bill runs.
- Supply concentration. One foundry (TSMC, in Taiwan), one dominant assembler (Foxconn), Chinese-subcomponent dependence even in India, and live tariff costs. No near-term route around the fab.
- Single-product concentration. Roughly half of revenue is one product, the iPhone, on a structurally lengthening upgrade cycle.
What would change the thesis, in either direction: a clean Google-appeal win removing the binary, or a multiple reset to the 28-to-30 median at the same earnings (both constructive); an adverse appeal, accelerated App Store erosion, a confirmed China give-back, or Services growth breaking below double-digits (all negative). None of these is a balance-sheet event; the debate is entirely about the multiple and the two regulated pools, not about whether the business breaks.
The rules-based rating that falls out of all this is Hold, with valuation flagged Overvalued. The composite is a +2 on an equal-weighted five-factor score: valuation -1 (rich for the growth), growth +1 (re-accelerated but structurally low-single-digit), quality +2 (best-in-class), risk -1 (the regulated pools and concentration), and a soft momentum +1. It is a transparent research signal, not advice, and it says what the whole piece says: this is quality you pay full price for.
Methodology, sourcing, and data-quality flags
This piece was built from parallel research streams: the installed base and demand, product and silicon and AI, the competitive map, policy and regulation, the SEC filings, market action and valuation, sentiment, the macro and micro economics, and a five-year forward outlook. Every load-bearing figure traces to an entry in the run’s claims ledger with a source and a tier. The source hierarchy, in order of weight, is primary (Apple’s FY2025 10-K, the Q2 FY2026 10-Q and 8-K, the 2026 proxy, Berkshire’s 13F, Federal Reserve and EU/regulator primary releases), then analyst (Counterpoint, JPMorgan, market-data aggregators), then reputable press, then estimate (model-computed or derived figures). Of the load-bearing claims, the large majority are verified; the unverified ones are live market figures, analyst interpretations, or the harness’s own scenario arithmetic, all hedged or attributed accordingly and never stated as bare fact.
Point-in-time note: every price, market cap, and valuation multiple is stamped to June 22, 2026. These figures move fast and may be materially stale by the time you read this.
Data-quality flags:
- Live price, market cap, and multiples: point-in-time and time-sensitive. Market cap spans roughly $4.36 to $4.41 trillion across vendor snapshots; one widely cited figure put it near $4.6 trillion in early June before drifting to about $4.4 trillion by June 22. The spot price ($299.13) is an unverified live quote. Verify before acting.
- Forward P/E (disputed): roughly 32.7x on the most-cited vendor versus 28.7x on another (June 9), driven by which forward EPS each uses. Both are premium multiples; the low-30s framing is the safe read.
- Installed base (2.35 billion devices): Apple’s own verbal earnings-call metric from January 2025, not an audited 10-K line. Directionally reliable, slightly stale; labeled Apple-reported.
- iPhone ASP (~$900-plus global, ~$985 US, ~$1,000 Q4 2025) and the iPhone 17 Pro Max BOM (~$408): analyst and estimate tier (Counterpoint). Apple does not disclose ASP or BOM; the BOM illustrates a component cost stack, not net unit margin.
- Segment gross-profit share (~42 percent Services): derived arithmetic on primary 10-K figures, recomputed exactly.
- App Store $1.3 trillion ecosystem: an Apple-commissioned Analysis Group study; the commissionable slice is only the roughly $131 billion digital-goods piece, and the “90 percent-plus pay no commission” framing is Apple’s own.
- Aggregate regulation-at-risk ($15 to $25 billion a year): the harness’s own illustrative scenario synthesis, not a published figure. Its anchors are verified (JPMorgan’s ~$12.5 billion Google worst case and the ~$30 billion App Store commission line); the combined band is labeled an estimate.
- AI monetization (indirect via the upgrade cycle and Services): analyst-commentary interpretation, not Apple-disclosed. Shipped only as attributed analyst framing.
- Macro figures: US recession odds are a wide band (roughly 15 to 30 percent; Goldman around 30 percent as of spring 2026; soft-landing models such as the Sahm Rule at 0.10 and the NY Fed near 15 percent more benign). Headline CPI ran about 4.2 percent in May 2026 (energy and Iran-conflict driven) versus core near 2.9 percent. The Fed held at 3.50 to 3.75 percent on June 17, 2026 with a hawkish dot path.
- Tariff composition (~22.5 percent electronics add-on; ~60 percent absorbed): the precise tariff split and the absorption share are industry inference, not company-disclosed; treat as approximate.
- China state-employee iPhone restrictions: Bloomberg-reported informal workplace restrictions across state firms and agencies; no nationwide statutory ban.
- Intel second-source and Apple-Intel foundry talks: preliminary, unconfirmed scope; framed as diversification chatter, not a committed deal.
- Berkshire share total: summed across multiple 13F manager line items (options excluded); the ~915 million peak is widely reported context, not from this filing.
- Peer and supplier market caps: point-in-time analyst/aggregator figures that drift daily; foreign-listed names (TSM, Samsung 005930.KS, Foxconn 2317.TW, Sony, Luxshare 002475.SZ) carry US-access friction, and 002475.SZ is effectively not US-buyable for retail.
Key sources: SEC EDGAR (AAPL CIK 0000320193) FY2025 10-K, Q2 FY2026 10-Q and 8-K, the 2026 DEF 14A, and Berkshire’s 13F; Federal Reserve June 2026 FOMC statement; European Commission, UK CMA, France’s Autorite de la concurrence, and Japan and Korea regulator releases; the September 2025 Google search-remedy ruling and the D.C. Circuit appeal docket; Counterpoint Research for share, ASP, and BOM; JPMorgan for the Google-payment EPS-at-risk; Bloomberg/Gurman for the Apple-Google Gemini terms; stockanalysis.com, companiesmarketcap, MarketBeat, and public.com for live price, market cap, multiples, and analyst targets; and reputable trade and financial press (CNBC, Fortune, MacRumors, TechCrunch, SemiAnalysis, DigiTimes, SCMP) for catalysts, the supply chain, and the regulatory timeline.
This document is OSINT research for educational purposes only and is not investment advice, not a recommendation, and not a solicitation. The author is not a financial advisor and holds no position presented here as a recommendation. All data is point-in-time as of June 22, 2026 and may be outdated; nothing here is guaranteed. Forward-looking statements and the five-year scenarios are illustrative estimates or attributed third-party views, not promises or price targets. Do your own due diligence and consult a licensed financial advisor before making any decision.