
Research date: July 2, 2026 | OSINT market research on GE Vernova Inc. (NYSE: GEV), the power-equipment and grid-technology maker spun off from General Electric in April 2024
Important disclaimer. This is OSINT-based research and educational analysis, not investment advice. I am not a financial advisor. Nothing here is a recommendation to buy or sell any security, and the scenarios below are illustrative, not price targets. Industrial capital-goods and power-equipment stocks are cyclical, litigation-exposed, and sensitive to tariff and energy policy, all of which can change without much warning. Market caps, prices, valuation multiples, and market-share figures are point-in-time (July 2, 2026), press-reported where noted, and move fast. Do your own due diligence and consult a licensed advisor.
Where this stock could be in 6 months, 1 year, 3 years, and 5 years
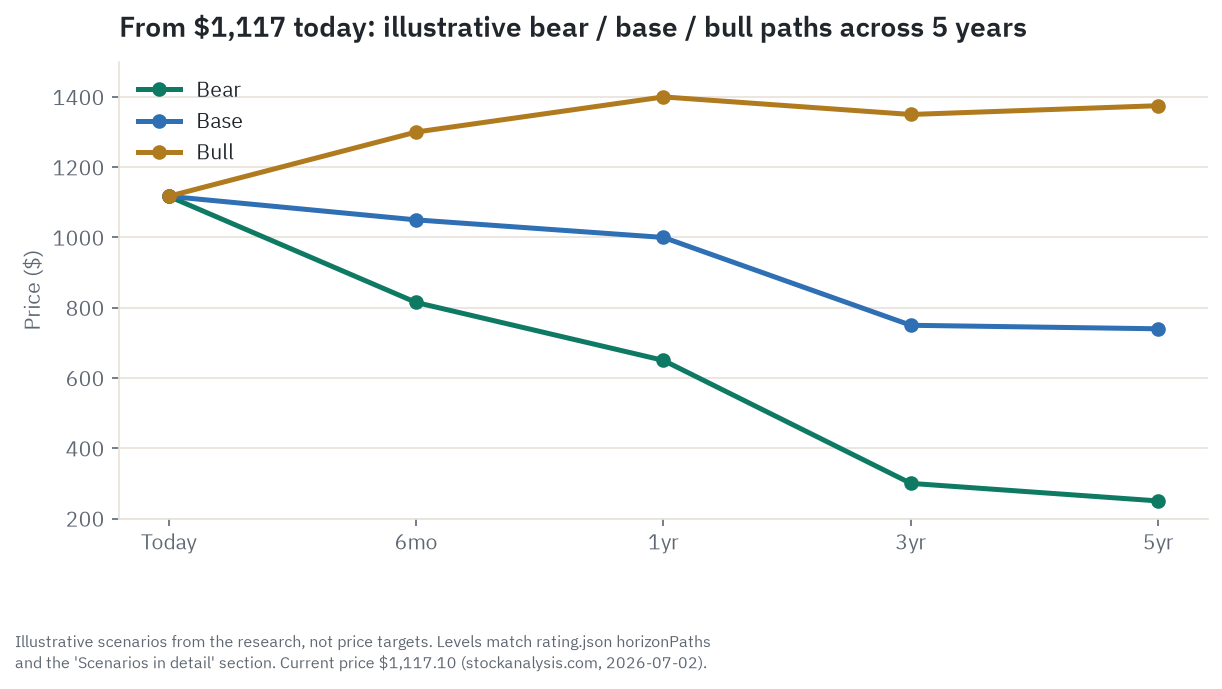
Six months. This window is decided by two more earnings prints and whatever the big cloud-computing spenders say about their own budgets. In the base case, GE Vernova reports results roughly in line with its already-raised full-year guide, the order machine keeps humming, and the stock trades sideways to a bit lower, around $1,050, as the market spends a couple of quarters digesting an extreme multiple rather than pushing it higher. Keep beating and raising guidance the way management has all year, and the bull case runs to $1,300. Miss on the Wind loss, show any softening in order growth, or have a hyperscaler signal a pause in its own capital spending, and the bear case is $815. The single thing most likely to flip this window is a data-center capex comment from Microsoft, Amazon, or Google on one of their own quarterly calls.
One year. By next July, the market has the full FY2026 scorecard and GE Vernova’s first look at FY2027. The base case assumes the company lands inside its guided range for revenue ($44.5 billion to $45.5 billion), margin, and free cash flow, growth is still strong but visibly decelerating from this year’s pace, and the market starts to price a stock that has to grow into its multiple rather than one still expanding it, landing around $1,000. A clean sweep of the top end of guidance plus a strong FY2027 outlook supports $1,400. A miss on free cash flow, tied to Wind or tariffs, or a visible deceleration in the order book, pulls the stock to $650. The variable to watch is the order-growth rate itself: this year’s orders grew 71 percent organically, and any material slowdown from that pace resets how the market prices the next leg.
Three years. By mid-2029, the driver tree that decides the whole thesis starts to dominate over any single quarter. The base case has GE Vernova roughly meeting its own 2028 targets of $52 billion in revenue and a 20 percent EBITDA margin, still growing but clearly past its fastest phase, with the market applying a much more ordinary industrial multiple to a much bigger earnings number and landing around $750, below today’s price even with strong execution, because today’s multiple was simply too rich to hold. Beat those targets, get the first revenue from the nuclear small-reactor program, and convince the market this is a multi-decade growth franchise, and the bull case is $1,350. Have the three gas-turbine makers collectively add more capacity than the market actually needs, watch pricing soften, and the bear case is $300. What flips this read is industry turbine-capacity utilization and new-order pricing data through 2028.
Five years. By mid-2031, the entire structural question is settled one way or another: did AI-driven power demand create a genuine, multi-decade step-change in what utilities and grid operators need to build, or was 2024 through 2028 a one-time surge followed by a normal replacement cycle, or worse, an outright overbuild? In the base case, GE Vernova is a roughly $58 billion revenue company with a 19 percent EBITDA margin, a good business trading at a fair multiple that still lands below today’s starting price, around $740, because the stock simply started too expensive. In the bull case, revenue reaches roughly $68 billion, margins expand further, nuclear is contributing real revenue, and the market pays up for a durable growth franchise at around $1,375. In the bear case, industry overbuild has arrived, margins have compressed hard, and the stock trades like an ordinary cyclical industrial around $250. The single variable is whether industry-wide capacity additions outrun demand by the end of the decade.
Where the read lands today. On balance the read holds at Hold: GE Vernova owns one of the two or three best power-equipment franchises on the planet at exactly the moment the world needs it most, but at roughly 61 times forward earnings the stock already needs years of close-to-flawless execution just to stand still, and the one segment that keeps missing its own guidance, Wind, is a live reminder of how that can go wrong. The single thing most likely to move this read in either direction is a hyperscaler capital-spending signal, for better or worse.
Companion tool
Jump to the interactive dashboard to sort and filter every company in this piece, or download the Excel model to flex the scenarios yourself.
TL;DR
The AI data-center buildout needs electricity that the US grid was not built to supply, and only three companies on earth can build the biggest gas turbines that generate it at scale: GE Vernova, Siemens Energy, and Mitsubishi Power. GE Vernova, spun off from the old General Electric in April 2024, sits at the center of that scarcity with a backlog that grew from 83 gigawatts to 100 gigawatts of gas-turbine bookings in a single quarter and pricing running 10 to 20 percent higher on new orders even as unit shipments climbed. Its grid-equipment business, Electrification, is doing the same thing with transformers and switchgear, growing orders 86 percent in the first quarter of 2026 with margins expanding nearly 700 basis points. The problem is the third segment: Wind lost roughly $600 million in 2025, worse than guided, and is tangled in active litigation over an offshore contract it is trying to exit. None of that changes the fact that the stock trades at close to 61 times forward earnings, a price that already assumes the good parts of the business keep compounding while the bad part stops getting worse. The single biggest risk is not that the demand story is fake. It is that the market is paying software-company prices for a heavy-industrial company, and heavy industry has a long, well-documented history of building too much capacity right as a boom starts to fade.
Explore it yourself: the interactive dashboard
Open the dashboard in a full screen
A sold-out machine shop with three different product lines
Picture a custom machine shop that builds exactly one kind of very large, very expensive piece of equipment, and picture a line of customers stretching out the door and around the block, each one willing to pay more than the last just to get a spot in the queue. That is roughly what GE Vernova’s Power segment looks like right now. Its heavy-duty gas turbines, the machines that burn natural gas and spin a generator to make electricity, are booked solid: management has guided gas-turbine backlog and slot reservations to at least 110 gigawatts by the end of 2026, up from 83 gigawatts at the start of the year, and has said the book is effectively sold out through 2029 and 2030. When a shop is that full, it does not need to compete on price. It sets the price. That is why pricing on new gas-turbine bookings has been running 10 to 20 percent above where it stood just a quarter earlier, even as the number of turbines shipped grew 32 percent year over year. Normally, in a capital-goods business, higher volume forces price concessions to keep the factory full. Here it is the opposite: volume and price are both rising, because the constraint is not demand, it is the physical ability to build the machines fast enough.
Next door in the same shop, a second, newer product line, Electrification, is running an almost identical playbook with transformers, switchgear, and the high-voltage equipment that moves electricity from a power plant to a substation to a factory or data center. Transformers in particular have become the industry’s most-cited supply-chain bottleneck, with lead times stretching into years across the whole sector, not just at GE Vernova. Grid-equipment orders grew 86 percent organically in the first quarter of 2026, with margins up nearly 700 basis points, because the same underlying dynamic applies: too few factories can build this equipment, and demand for it, from data centers, from grid modernization, from the plain fact that America’s transmission network is decades old, is outrunning supply.
Then there is the third product line in the same shop, Wind, and it is losing money. Onshore and offshore wind turbines are, in effect, commodity products in a business where GE Vernova signed a batch of large, multi-year, fixed-price contracts years ago, before steel, logistics, and labor costs moved sharply against it, and before a federal stop-work order froze several offshore projects it was contracted to build, including one called Vineyard Wind. Think of it like a contractor who quoted a fixed price to renovate a kitchen three years ago, before lumber prices doubled: the contractor is on the hook for the original price no matter what materials now cost, and the only way out is to eat the loss or fight the customer in court. GE Vernova is doing some of both. The segment lost roughly $600 million in 2025, worse than the roughly $400 million originally guided, and Vineyard Wind is now suing GE Vernova in Massachusetts state court over its attempt to exit that contract, a case in which the courts have so far sided with Vineyard Wind at every turn.
So this is not one story. It is three stories wearing one ticker: a scarcity-driven pricing machine in Power, a younger version of the same machine in Electrification, and a value-destroying, litigation-tangled legacy business in Wind. The stock price reflects a bet that the first two stories keep compounding and the third one stops getting worse.
How the money flows
flowchart TD
    TOP["AI/data-center + utility + industrial power demand"]
    TOP --> UTIL["Utilities/PPAs: NextEra, Constellation (rate base + hyperscaler PPAs)"]
    UTIL --> GEVPOWER["GEV Power: gas turbines, backlog ~100-110GW by YE2026"]
    UTIL --> GEVNUCLEAR["GEV/Hitachi nuclear: BWRX-300 SMR + large reactors"]
    UTIL --> GEVWIND["GEV Wind: onshore + shrinking offshore book, ~$600M FY25 loss"]
    UTIL --> GEVELEC["GEV Electrification: transformers, switchgear, HVDC, Prolec GE"]

    GEVPOWER --> STEEL["Steel/specialty alloys: turbine casings, rotors"]
    GEVELEC --> COPPER["Copper + electrical steel: ~60% of transformer mfg cost"]
    GEVWIND --> RAREEARTH["Rare-earth magnets (NdFeB): China ~90% processing share"]
    GEVNUCLEAR --> FUEL["Nuclear fuel cycle: Cameco, Urenco/Orano, Centrus, GNF fabrication"]

    STEEL --> CASH["GE Vernova cash generation: Power+Electrification margin expansion"]
    COPPER --> CASH
    RAREEARTH --> CASH
    FUEL --> CASH

    CASH --> RETURNS["Capital returns: doubled dividend + expanded buyback"]
    CASH --> CAPEX["~$10B cumulative 2025-2028 capex/R&D: turbine capacity, SMR program"]
Start at the top. The money originates with electricity demand that simply did not exist at this scale five years ago: hyperscalers such as Microsoft, Amazon, Google, and Meta racing to bring gigawatts of new data-center load online, layered on top of the older, steadier demand from utilities replacing aging power plants and from industrial electrification generally. NextEra Energy, one of the demand-side names profiled below, has told investors that 43 percent of projected US power-demand growth through 2030 is tied directly to data centers, which is about as clean a single data point as exists for the scale of what is straining the system.
That demand funnels through two channels before it reaches GE Vernova. Regulated utilities recover the cost of new plants and grid upgrades through the rates they charge customers, while merchant power generators sign long-term power-purchase agreements directly with hyperscalers, the model Constellation Energy has used for its nuclear fleet. Either way, the money eventually becomes a purchase order for physical equipment, and that is where GE Vernova sits: one of a small number of companies that can actually build the gas turbines, grid hardware, and wind turbines the buildout requires, plus, through a joint venture with Hitachi, an early position in the next generation of small nuclear reactors.
The chokepoints in this chain are not evenly distributed. Gas turbines and grid equipment sit behind genuine, industry-wide manufacturing bottlenecks, which is why GE Vernova can raise prices there even as volumes grow. Underneath all three of GE Vernova’s segments sits a narrower layer of physical inputs: steel and specialty alloys for turbine casings and rotors, copper and electrical steel that together can run up to roughly 60 percent of a transformer’s manufacturing cost, rare-earth magnets for offshore wind generators where China controls an estimated 90 percent of global processing capacity, and, for the nuclear business, a fuel-supply chain where GE Vernova’s own joint venture only covers the final fabrication step and depends on outside suppliers for everything upstream. Whatever cash makes it through that chain funds GE Vernova’s own capital returns, a doubled dividend and an expanded buyback authorization announced alongside the FY2025 results, and roughly $10 billion of capital spending and R&D planned for 2025 through 2028 to add turbine and transformer capacity and to advance the nuclear program.
The three businesses inside one ticker
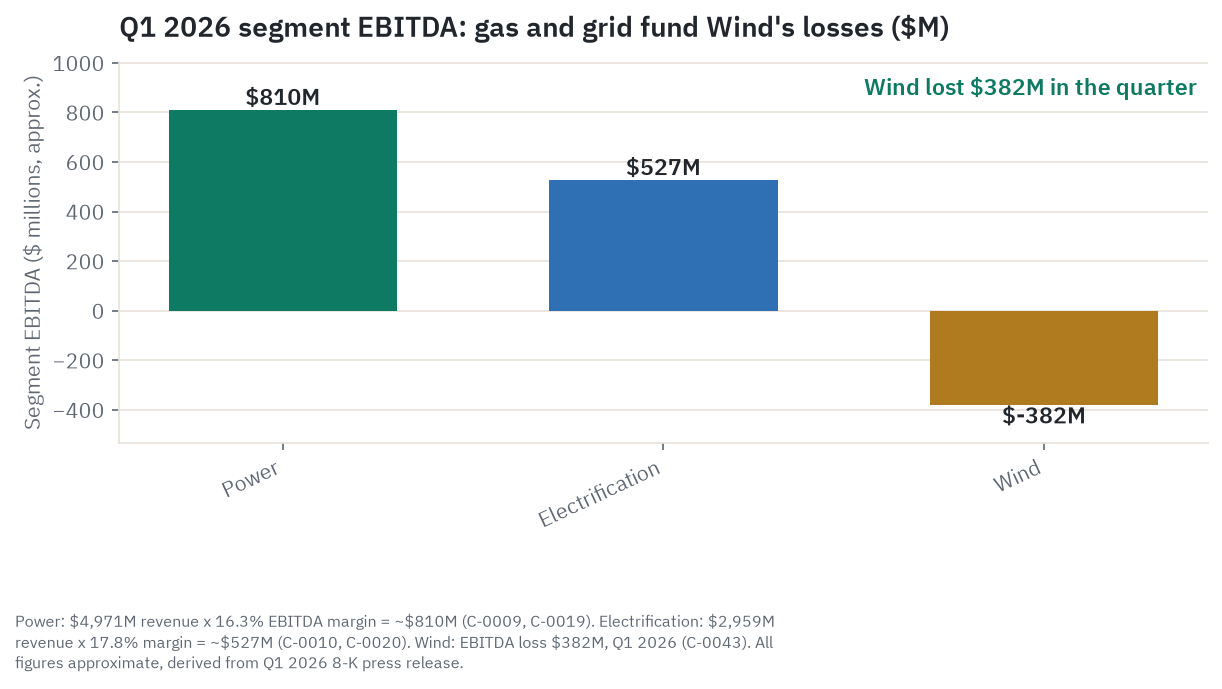
Power is the core of the company and the clearest expression of the scarcity story. It covers heavy-duty gas turbines (the HA-class fleet has now surpassed 128 units operating in 21 countries and more than 4 million cumulative operating hours), steam turbines, hydro, and the early-stage nuclear business. First-quarter 2026 revenue was $4,971 million, up 12 percent year over year, with segment EBITDA margin at 16.3 percent, up 470 basis points from a year earlier, and orders of $10.0 billion, up 59 percent organically. Full-year 2026 guidance calls for 16 to 18 percent organic revenue growth with a segment EBITDA margin of 17 to 19 percent. The company is racing to keep up with its own order book: annualized heavy-duty gas-turbine production capacity is set to reach 20 gigawatts by mid-2026 and as much as 24 gigawatts by mid-2028, funded by a multi-year capacity build at its Greenville, South Carolina and Schenectady, New York plants. Even that expansion only partially closes the gap between what customers want and what the industry can build before the early 2030s, which is precisely why pricing power exists in the first place.
Underneath the new-equipment number sits a second, quieter Power revenue stream: long-term service agreements on the installed base of turbines. Once a utility signs a 15-to-20-year service contract at commissioning, it has effectively no alternative supplier for the hot-gas-path parts, controls, and outage scheduling that keep the turbine running, the closest thing this business has to a toll road. That services tail does not disappear if new orders slow down, which is worth remembering the next time someone worries out loud about a gas-turbine downturn.
Electrification is the fastest-growing and highest-margin segment, covering transformers, switchgear, high-voltage direct-current systems, grid-automation software, and the recently consolidated Prolec GE distribution-transformer business, a Mexico-based joint venture GE Vernova took full ownership of in the first quarter of 2026, adding roughly $3 billion of annualized revenue. First-quarter 2026 revenue was $2,959 million, up 61 percent year over year, with segment EBITDA margin at 17.8 percent, up 670 basis points, and orders of $7.1 billion, up 86 percent organically, giving the segment a book-to-bill ratio of roughly 2.5 times, meaning orders are arriving far faster than the segment can ship product. Full-year 2026 guidance was raised to $14.0 billion to $14.5 billion in revenue with an 18 to 20 percent segment EBITDA margin.
Wind covers onshore and offshore wind turbines and is the one part of the business genuinely losing money. First-quarter 2026 segment revenue was $1,432 million, down 23 percent year over year, with an EBITDA loss of $382 million, a wider loss than the $146 million lost in the same quarter a year earlier. Full-year 2025 losses came in near $600 million, well above the roughly $400 million originally guided, driven mainly by a federal stop-work order that froze five offshore wind projects, including Vineyard Wind, and by blade-related issues at the Dogger Bank offshore project in the UK. Full-year 2026 guidance calls for a continued low-double-digit organic revenue decline and roughly $400 million more in EBITDA losses, meaning management is guiding losses to shrink from the 2025 level, not to disappear.
Who wins where
The gas-turbine market at the size GE Vernova competes in is a tight three-way oligopoly with Siemens Energy and Mitsubishi Power, together building an estimated two-thirds or more of the turbines going into gas-fired plants currently under construction. The precise ranking among the three shifts depending on the year and the methodology, whether measured by megawatts, unit count, or advanced-frame turbines specifically, so the safe read is not a single market-share number but the shape of the market: three companies control almost all of the world’s capacity to build the biggest gas turbines, and all three are reportedly sold out for years. That is a structurally different, and more durable, setup than a single company simply over-promising into softening demand, though it also means all three are adding manufacturing capacity at once, the exact mechanism that produced the last severe gas-turbine downcycle in 2013 through 2017.
In grid equipment, GE Vernova competes with Hitachi Energy, Siemens Energy, Eaton, Schneider Electric, and cable makers such as Prysmian and Nexans, but the binding constraint again is not competition, it is that transformer and high-voltage lead times are stretched industry-wide, so demand simply outruns what any of these companies can collectively ship.
Wind is the opposite kind of market: fragmented, overbuilt, and low-margin across the board. Vestas is the global leader by installed capacity, GE Vernova and Siemens Gamesa (part of Siemens Energy) compete for the rest, and offshore wind specifically has become a value-destroying segment for every Western manufacturer, not just GE Vernova, on a combination of contract losses and tariffs.
One layer further out, the demand side of this chain includes regulated utilities such as NextEra Energy, which fund equipment purchases through rate-based capital spending, and merchant generators such as Constellation Energy, which increasingly sign power-purchase agreements directly with hyperscalers. Neither is a GE Vernova competitor; both are customers whose own capital discipline is the swing factor for how much equipment gets ordered.
Company by company: who’s who
GE Vernova Inc (GEV), the primary name. First-quarter 2026 revenue was $9,339 million, up 16 percent year over year, with total backlog of $163 billion, up $13 billion in the quarter, and orders of $18.3 billion, up 71 percent organically. Full-year 2026 guidance, raised twice in five months, now stands at $44.5 billion to $45.5 billion of revenue, a 12 to 14 percent adjusted EBITDA margin, and $6.5 billion to $7.5 billion of free cash flow. Bull: gas-turbine and grid-equipment scarcity gives it rare pricing power right as AI and data-center demand accelerates, and Wind losses are, at least directionally, shrinking toward the company’s own targets. Bear: the stock already prices in years of flawless execution at roughly 61 times forward earnings, while Wind litigation, tariffs, and first-of-a-kind nuclear construction risk are all live and unresolved.
GE Aerospace (GE), the former parent. Spun off alongside GE Vernova in April 2024, GE Aerospace is a pure-play jet-engine and aftermarket-services company (the CFM LEAP joint venture with Safran, plus the GE9X, GEnx, and GE90 engine families) with no remaining ownership link to GE Vernova. First-quarter 2026 revenue was $12.39 billion, up 25 percent year over year, with orders up 87 percent to $23 billion and a backlog of $211.3 billion. It trades at a forward P/E of roughly 48.4 times, rich in its own right but noticeably below GEV’s 61.2 times, on an entirely different, aviation-cycle thesis that should not be conflated with GEV’s power-cycle exposure just because the two companies share a corporate history.
Siemens Energy AG (ENR.DE, primary listing Frankfurt/Xetra; thinly traded US OTC ADR SMEGF). GE Vernova’s closest full-portfolio peer, competing across gas turbines, grid technology, and wind turbines through its majority-owned Siemens Gamesa subsidiary. Its own record order backlog runs roughly 146 billion to 154 billion euros with a book-to-bill ratio of 1.72 times, and it has raised full-year guidance to 14 to 16 percent comparable revenue growth. It trades around 35 to 39 times trailing EV/EBITDA, a single-vendor read not independently reconciled here, but still well below GE Vernova’s 85.4 times, meaning an investor can access much of the same AI-power and grid-scarcity theme at a lower multiple, in euros, on a foreign exchange. Bull: the same tailwind as GEV, at a meaningfully lower multiple, with its own wind unit’s losses also narrowing. Bear: its US-tradable ADR is thin and unsponsored, so genuine access for US retail investors runs through an international brokerage account or not at all.
Vestas Wind Systems A/S (VWS.CO, primary listing Nasdaq Copenhagen; thin US OTC ticker VWSYF). The world’s largest wind-turbine maker by installed capacity and GE Vernova’s direct competitor in the one segment that is losing money. Its own trailing gross margins run around 12.7 percent, consistent with the industry-wide margin pressure GE Vernova describes in its own Wind segment. Bull: as a pure wind play, any industry-wide margin recovery flows through its results more directly than through GEV’s blended numbers. Bear: it has no Power or Electrification cushion to offset a wind cycle that is still working through losses.
Eaton Corporation plc (ETN). A downstream, adjacent electrification competitor and occasional customer-channel, selling switchgear and power-distribution equipment at the building and rack level rather than GE Vernova’s grid and substation level. First-quarter 2026 revenue was $7.5 billion, a first-quarter record on 10 percent organic growth, with data-center orders within its Electrical Americas business up 240 percent year over year. It trades at a forward P/E of 29.3 times. Bull: the same data-center electrification tailwind as GEV’s Electrification segment, expressed through a more diversified, historically higher-margin industrial franchise. Bear: it is separating its Mobility business, adding a corporate-action variable GEV investors do not have to underwrite.
Emerson Electric Co (EMR). An indirect peer whose automation and control systems sit inside the power plants and grid facilities that GE Vernova equips, making it more of an adjacency than a head-to-head competitor. It trades at a forward P/E of 20.5 times. Bull: picks-and-shovels exposure to the same buildout without GEV’s Wind-segment losses or turbine-specific execution risk. Bear: more diversified and less directly levered to the specific gas-turbine and grid-equipment scarcity driving GEV’s segment margins.
NextEra Energy Inc (NEE). A demand-side name, not a competitor: the parent of Florida Power & Light and the world’s largest generator of wind and solar power, and a customer whose capital spending funds equipment purchases from GE Vernova, Siemens Energy, and others. It announced an all-stock acquisition of Dominion Energy valued at roughly $67 billion in May 2026. Bull: the clearest single data point in this research for the scale of AI-driven demand, with management pointing to data centers as 43 percent of projected US power-demand growth through 2030. Bear: the Dominion deal, if completed, carries regulatory and integration risk unrelated to GE Vernova’s own execution.
Constellation Energy Corporation (CEG). Another demand-side, nuclear-adjacent name: the operator of the largest US nuclear fleet by output, selling power directly to hyperscalers through long-term agreements, including a Microsoft deal to restart the Three Mile Island reactor and a June 2026 Walmart agreement for output from its Dresden plant. It trades at a forward P/E of 20.7 times. Bull: every new data-center power-purchase agreement reinforces the pricing power of dispatchable clean generation, the same dynamic underpinning GEV’s Power and nuclear franchises. Bear: its re-rating on nuclear-to-AI deals is already a popular, well-covered trade, and a hyperscaler capex slowdown would pressure both names at the same time rather than diversifying the risk away.
What the filings say
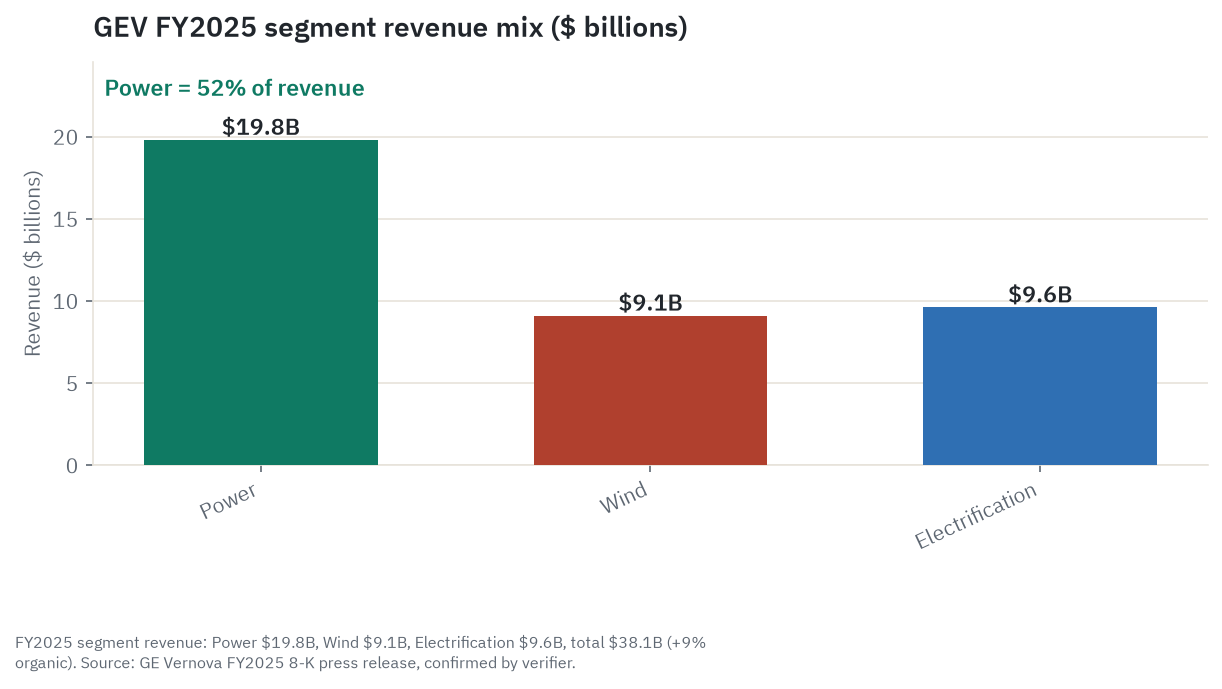
GE Vernova’s FY2025 income statement tells two different stories depending on which line you read. Total revenue was $38.1 billion, up 9 percent organically, and net income was $4.9 billion, a 12.8 percent margin, but that net-income figure includes a one-time $2.9 billion benefit from a US tax-valuation-allowance release, so it substantially overstates underlying operating profitability. Adjusted EBITDA, the cleaner operating read, was $3.2 billion, an 8.4 percent margin, still modest for an industrial company of this scale, reflecting the drag from Wind losses on an otherwise much stronger Power and Electrification margin profile. First-quarter 2026 revenue accelerated to $9,339 million, up 16 percent year over year.
By segment, FY2025 revenue split roughly $19.8 billion in Power, $9.1 billion in Wind, and $9.6 billion in Electrification. Power delivered high-teens organic revenue growth for the year, Electrification trended toward 25 percent organic growth with a 14 to 15 percent segment EBITDA margin, and Wind saw a low-double-digit organic revenue decline, a trajectory that has continued into 2026.
On cash flow and the balance sheet, FY2025 operating cash flow was $5.0 billion and free cash flow, the company’s headline non-GAAP metric, was $3.7 billion, up 118 percent year over year off a small FY2024 base. The company ended the year with $8.8 billion of cash and returned $3.6 billion combined in dividends and buybacks; alongside those results the board doubled the quarterly dividend and expanded the buyback authorization from $6 billion to $10 billion. Management’s updated multi-year framework now targets at least $22 billion of cumulative free cash flow from 2025 through 2028, against roughly $10 billion of planned capex and R&D over the same stretch, capital being redirected toward gas-turbine capacity expansion and the nuclear program. One caveat worth flagging plainly: the balance-sheet detail behind that clean picture, roughly $265 million of long-term debt at FY2025 year-end against $8.8 billion of cash, came from a secondary aggregator rather than a direct read of the 10-K, and that same aggregator showed a jump to roughly $2.8 billion of long-term debt by the first quarter of 2026, a move large enough that it should be confirmed against the primary filing before anyone treats the “clean net-cash balance sheet” story as fully settled.
FY2026 guidance, raised at the first-quarter print, now calls for $44.5 billion to $45.5 billion of revenue, a 12 to 14 percent adjusted EBITDA margin, and $6.5 billion to $7.5 billion of free cash flow, all raised from the levels management set just five months earlier. That is the single most decision-relevant fact in the filings for anyone trying to size the bull case: it is the company’s own forward-looking claim, made with real numbers attached, that the first quarter’s order and margin strength is durable rather than a one-time beat.
The company’s own risk disclosures, reconstructed here from secondary analysis of the 10-K rather than a verbatim primary read, center on four themes. Its large power, grid, and wind contracts are priced years before delivery, so cost inflation on contracts already signed is not always recoverable, the structural reason Wind’s losses happened even as orders grew across the rest of the business. It depends on a global network of suppliers for castings, forgings, and electronics, so a single-source disruption anywhere in that chain can delay deliveries and compress margins even when end demand stays healthy. Today’s demand-supply imbalance is explicitly framed by the company as a double-edged sword: a tailwind for pricing now, but an invitation for rivals and new entrants to respond, which could eventually pressure prices and contract terms. And tariffs cost the company roughly $300 million to $400 million in 2025, cutting adjusted EBITDA margin by about a percentage point, with offshore wind called out as the most exposed segment given how many borders its components cross before final assembly.
On ownership, roughly 76 percent of shares are held by institutions and well under 1 percent by insiders, an unusually low insider stake for a recent spinoff, though this figure came from a secondary aggregator rather than the primary proxy filing and should be read as directional. Vanguard is the largest disclosed institutional holder at roughly 9 percent of shares.
What the market is paying
Last read, GE Vernova traded at $1,117.10 (stockanalysis.com, July 2, 2026), sitting roughly 94 percent of the way up its 52-week range of $482.20 to $1,181.95 and close to, but not quite at, its all-time high. Market capitalization was approximately $300.2 billion against an enterprise value of roughly $291.75 billion, the gap explained by the company’s net-cash position. Shares outstanding stood at 268.72 million, down about 1.8 percent over the trailing year on modest buyback activity.
Return figures showed real dispersion across data vendors and should be read as directional rather than precise: a year-to-date return somewhere between 69 and 76 percent depending on methodology, and a one-year return anywhere from 127 percent (price only) to 243 percent (total return, a different vendor’s window). Even the low end of that range describes a stock that more than doubled over the trailing year, comfortably outpacing the Industrial Select Sector SPDR ETF’s own strong year, which returned an estimated 13 to 20 percent year to date and 29 to 35 percent over one year depending on source. GE Vernova has been one of the standout large-cap performers of the AI-power-demand theme this year, not simply riding a rising sector tide.
This is the section that most rewards a skeptical read. Trailing P/E sits at 33.19 times, but forward P/E, at 61.19 times, is actually higher, an unusual pattern for a company guided to grow earnings. The likely explanation is the same one-time $2.9 billion tax benefit that flattered FY2025 net income: it makes trailing earnings look artificially strong by comparison, which means the 33 times trailing figure probably understates how expensive the stock really is, and the 61 times forward figure is the more honest read of what the market is actually paying for GE Vernova’s expected earnings power. Trailing EV/EBITDA runs to 85.4 times, an extremely rich multiple in absolute terms, though it is mechanically depressed by Wind’s losses dragging down consolidated adjusted EBITDA; as those losses shrink per guidance, the multiple should compress somewhat even without any change in the share price, but 85 times trailing EV/EBITDA leaves essentially no room for a disappointment. EV/Sales runs to 7.41 times and price-to-sales to 7.56 times, multiples more typical of software than of a turbine and transformer manufacturer. Price-to-book sits at 21.90 times, and the PEG ratio, which adjusts the multiple for expected growth, is 1.94, meaning even after accounting for GE Vernova’s exceptional growth rate, the stock is not cheap; a PEG near 2 typically signals a stock priced for a good outcome, not merely a great one, with high execution expectations already baked in. The dividend yield is a token 0.18 percent; this is not an income name, and buybacks are doing most of the shareholder-return work.
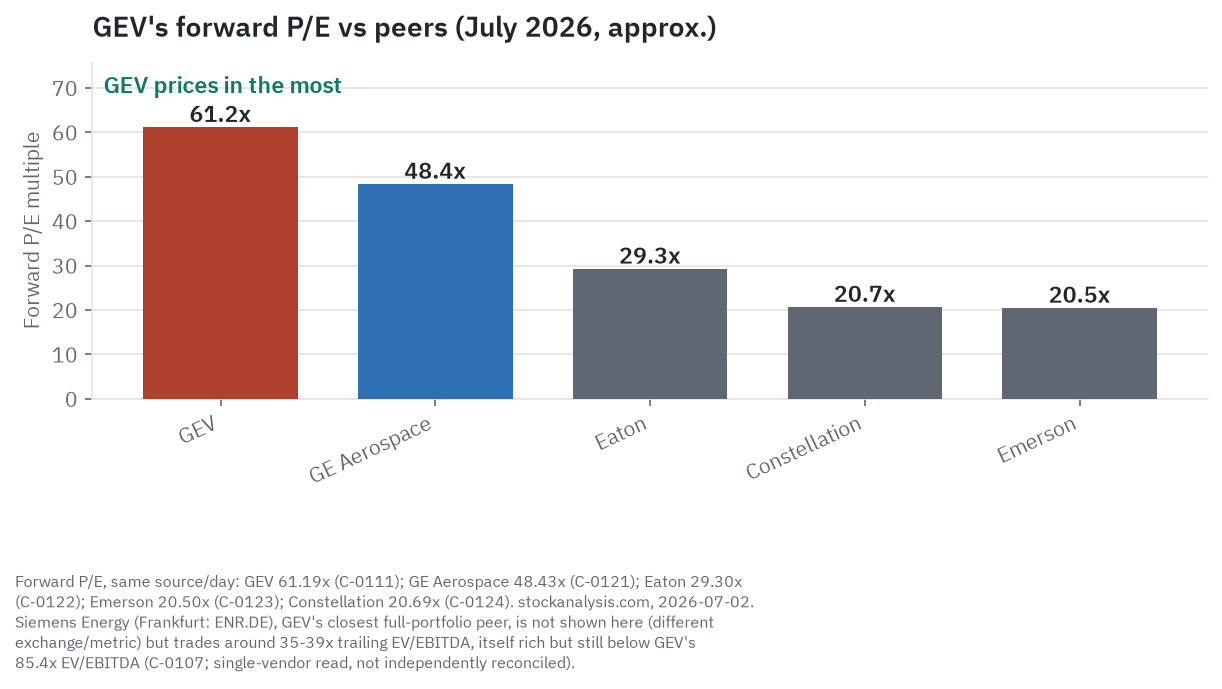
Set against peers, GE Vernova is unambiguously the name the market has paid up hardest for. Its 85.4 times trailing EV/EBITDA sits well above Siemens Energy’s already-rich 35 to 39 times, and its own forward P/E of 61.2 times towers over the rest of the industrial peer set profiled here, from GE Aerospace’s 48.4 times down to Emerson’s 20.5 times. Within this group, GE Vernova is priced as if it will convert essentially all of its record backlog into durable, high-margin revenue with no further Wind-related setbacks, a scenario the guidance supports directionally but has not yet fully delivered.
Short interest is modest and itself subject to some vendor disagreement, somewhere between 3.4 and 3.9 percent of float, indicating a liquid large-cap with some skeptical positioning but nothing close to a short-squeeze setup. Sell-side consensus is Buy, but the dispersion behind that headline rating is unusually wide for a large, well-covered stock: one 38-analyst poll put the mean price target at $1,212, about 9 percent above the current price, while a separate 34-analyst tracker showed a median target of $943.80, below the current price, with individual targets ranging from $836 to $1,424, close to a two-times spread from lowest to highest. Read the Buy consensus as real but not uniformly enthusiastic: the sell side itself does not agree on how much of this re-rating should still have room to run.
What the crowd is saying
The dominant financial-media narrative since the spinoff, and accelerating hard through the first half of 2026, is “GE Vernova as the picks-and-shovels supplier for the electricity the AI buildout needs.” Coverage volume is heavy and tends to recur around the same three data points: the gas-turbine backlog jump from 83 to 100 gigawatts, the 10-to-20-percent pricing gains on new bookings, and the stock’s record close of $1,174.86 on June 30, 2026. Headlines lean toward “power shortage winner” framing rather than “industrial capital-goods cyclical,” which matters because it shapes how the market prices the stock’s risk: a cyclical industrial trading at 61 times forward earnings should raise more eyebrows than an “AI infrastructure” stock at the same multiple, even though the underlying business is the same either way.
A second, cooler thread runs underneath: coverage of Wind’s losses and the Vineyard Wind litigation is present and persistent but rarely leads a story. Most outlets treat it as a manageable drag on an otherwise strong quarter rather than a thesis-breaker, which is itself informative: the market has already substantially discounted Wind as “the bad segment we knew about,” meaning further bad Wind news is less likely to move the stock materially, while any surprise in gas turbines or grid equipment, the segments actually carrying the valuation, would move it more. A third, thinner and newer thread covers valuation skepticism directly: Jefferies trimmed its price target to $1,210 from $1,350 in mid-2026 while maintaining a Buy rating, arguing that concerns about the Wind business were overextended relative to the data, a bull-leaning desk trying to separate signal from noise rather than capitulating on the thesis.
Retail sentiment on Stocktwits moved from “bullish” to “extremely bullish” following the April 2026 earnings beat and guidance raise, with message volume shifting to “high” or “extremely high.” That is a notably different retail posture than a century-old heavy-manufacturing business would normally attract, and GE Vernova is increasingly being swept into retail “AI infrastructure” stock baskets alongside data-center real-estate trusts and software names, despite an indirect AI exposure mechanism: it sells power equipment to utilities and data-center developers, it does not sell compute or software.
The most concrete, checkable signal in this section is not from social media but from an insider-trading disclosure: the CEO of GE Vernova’s Wind division reportedly sold approximately 5,000 shares, roughly 72 percent of his direct personal holding, in June 2026 at around $948 per share. This figure comes from a secondary aggregator and was not independently confirmed against the underlying SEC Form 4 filing in this research pass, and insiders sell for many reasons unrelated to their view of the business, so it should be read as one data point on a watch list, not a verdict. Its size and timing, concentrated in the company’s most troubled division, are what make it worth tracking rather than ignoring.
The sharpest divergence between the crowd’s story and the underlying numbers is the same one seen across most of this AI-power trade broadly: most of the coverage centers on the Power and Electrification story, and comparatively little on the fact that Wind lost roughly $600 million in 2025 and is in active, adversarial litigation with a major customer. That may not be a mispricing so much as the market correctly treating Wind as a bounded, shrinking-in-relevance drag, but the gap between how much airtime Wind gets and how much financial damage it is doing is real. No evidence surfaced of coordinated pump activity or thin-float manipulation dynamics; GE Vernova’s roughly $300 billion market cap and heavy trading volume make it structurally resistant to that kind of thing. What is present instead is ordinary narrative crowding: dense, largely one-directional bullish coverage built on genuine, sourced, dated results, concentrated enough that a single disappointing data point could produce an outsized reaction relative to its actual fundamental weight.
Is this demand real, and does it last
The honest answer splits by segment, and the split matters more than any single number in this article. Demand for gas turbines and grid equipment looks structural: the US Energy Information Administration projects electricity demand growing 0.9 to 1.6 percent a year through 2050, the strongest four-year demand-growth stretch since 2000, with data centers identified as the dominant driver, and that demand is being funded by well-capitalized, investment-grade buyers, hyperscalers and the utilities that serve them, signing long-dated, firm commitments rather than speculating on spot prices. Separately from AI entirely, the US and global transmission grid is aging and under-built relative to a broader electrification of transport and industry, a decades-in-the-making problem that will keep funding transformer and switchgear demand regardless of what happens to any single AI capex cycle. Demand for wind, by contrast, is a policy call option that has moved against the segment over the past 12 to 18 months: US federal tax credits for wind and solar are phasing down under recent legislation, and a December 2025 federal stop-work order directly halted several offshore projects, including one GE Vernova is contracted on.
The clearest evidence that Power and Electrification are early-to-mid in a genuine capacity up-cycle, not sitting at a cyclical peak, is the shape of the backlog itself. A company selling out multiple future years of capacity in real time, with pricing rising faster than input costs even as shipped volume grows, is the textbook signature of a supply-constrained upswing, not a late-cycle blowoff. The real cyclical risk sits further out: because gas turbines and large transformers have multi-year lead times, today’s order book is largely locked in with deposits and cancellation terms, so a hyperscaler capital-spending pause would show up first as slowing new orders and softening prices on future-year delivery slots, not as an immediate hit to backlog. That creates a lag of roughly 12 to 24 months between a hyperscaler capex signal and any visible hit to GE Vernova’s own order intake, and the most plausible timing for that risk to crystallize is 2027 or 2028, once the current wave of hyperscaler capex plans either converts into monetized AI revenue or does not. A second, slower-moving risk is straightforward industry overbuild: with GE Vernova, Siemens Energy, and Mitsubishi Power all adding turbine manufacturing capacity into the same demand cycle simultaneously, a repeat of the 2013-to-2017 pattern, where a demand miscalculation was followed by years of turbine-industry overcapacity and pricing pressure of 20 percent or more, is the textbook way a cycle like this ends. It is a multi-year risk, not an imminent one, most plausible from 2028 onward.
Two more questions belong in this picture: who could take this business away, and who could take the demand away. On the first, the technical and certification barriers to entering heavy-duty gas-turbine manufacturing from scratch are close to prohibitive on any five-to-ten-year view; nobody is going to show up as a fourth credible turbine maker before this cycle plays out one way or the other. The more realistic threat is not a new entrant but the three existing players collectively building too much of what they already know how to build, the overbuild risk described above. On the second, the customers funding this entire chain, hyperscalers and utilities, are not required to buy gas turbines specifically. Nuclear uprates and new small modular reactors, long-duration battery storage, and geothermal are all being pursued by the same buyers as substitutes or complements to gas for firm, always-on power, and GE Vernova is only partially hedged against that shift through its own nuclear joint venture, which has not yet converted its pipeline into disclosed order backlog. Outside the US and Europe, Chinese wind and grid-equipment makers compete aggressively on price and have closed much of their historical quality gap, a dynamic that weighs on Wind’s economics specifically since that segment lacks the scarcity protection Power and Electrification currently enjoy.
The most likely outcome, taken across both the macro demand picture and the segment-level economics, is a continued nuanced split: Power and Electrification stay in a genuine, multi-year structural up-cycle through at least 2027 or 2028, with margin expansion that reflects real supply-demand tightness rather than a one-off, while Wind remains a drag through at least 2027, shaped more by US federal policy and the Vineyard Wind litigation than by underlying wind demand itself. The base case is not a collapse. It is continued backlog growth and margin expansion in the core segments through the next couple of years, followed by a moderation, not a reversal, as the hyperscaler capex cycle matures and industry-wide turbine-capacity additions start to catch up with order growth.
The scenarios in detail
The five-year outcome for GE Vernova hinges on four variables, roughly in order of impact. First, whether data-center and grid power demand durability sustains and broadens through the decade, or crests after the first hyperscaler build wave; independent forecasts of 2030 US data-center power demand span more than a factor of two (roughly 380 to 790 terawatt-hours by one widely cited range), which is itself the point: the demand trajectory is genuinely uncertain, not just debated. Second, the pace of the consolidated margin trajectory, from 8.4 percent in FY2025 toward a targeted 20 percent by 2028, which depends on how fast Power and Electrification margins keep expanding while Wind’s losses shrink. Third, competitive intensity and the risk of capacity overbuild, since GE Vernova, Siemens Energy, and Mitsubishi Power are all expanding gas-turbine manufacturing capacity into the same demand cycle at once, the precise mechanism that produced the 2013-to-2017 downcycle. Fourth, how Wind resolves and whether nuclear optionality converts to real revenue: the BWRX-300 small modular reactor program has a first unit under construction at Ontario Power Generation’s Darlington site, is in NRC review for a site in Tennessee, and carries memoranda of understanding in Poland, the UK, and Southeast Asia, none of which has yet converted to disclosed order backlog as of mid-2026.
The bull case: the supercycle sustains and broadens. Data-center power demand grows at or above the high end of forecasts, and grid modernization, industrial electrification, and sovereign AI programs layer additional demand on top of the hyperscaler buildout. Revenue reaches roughly $52 billion in 2028, meeting management’s own target, and grows to around $68 billion by 2031 as nuclear begins contributing. Consolidated EBITDA margin reaches roughly 22 percent as Power and Electrification push toward 24 to 25 percent and Wind turns modestly profitable. On an estimated $42.9 of 2031 EPS at a premium 32 times multiple, appropriate for a secular-growth industrial franchise, this scenario is worth roughly $1,375 (estimate, not a price target). What has to be true: AI power demand proves structural and broadens beyond the first hyperscaler wave, all three turbine makers maintain pricing discipline rather than fighting for share, nuclear converts from memoranda of understanding to real backlog, and Wind litigation resolves without further large charges. What most likely breaks it: a synchronized hyperscaler capex pause in 2027 or 2028, triggered by disappointing AI monetization, that reveals the first wave of gas-turbine orders as demand pulled forward rather than a sustained structural shift.
The base case: execution meets targets, the multiple compresses. Data-center demand grows at the moderate end of forecasts, the buildout is real but its growth rate moderates after the initial surge, and revenue reaches roughly $50 billion to $52 billion by 2028, close to management’s target, then grows 4 to 5 percent organically to around $58 billion by 2031. Consolidated EBITDA margin reaches roughly 19 percent as Power and Electrification hit their guided 20 to 21 percent range and then plateau, and Wind approaches breakeven without becoming a real profit contributor. On an estimated $29.4 of 2031 EPS at a more ordinary 25 times multiple, appropriate for a mature, above-average-margin industrial no longer commanding a momentum premium, this scenario is worth roughly $740 (estimate, not a price target), below today’s starting price even with solid execution, because today’s multiple already priced in more than this outcome delivers. What has to be true: management delivers roughly on its 2028 targets within 5 to 10 percent, AI power demand stays positive even if it decelerates, and industry capacity additions stay orderly rather than becoming a glut. What most likely breaks it: Wind losses running persistently above guidance again, repeating the FY2025 pattern and diverting management attention from the growth segments.
The bear case: overbuild and demand deceleration. This is anchored on the strongest points from the skeptic’s case: AI monetization disappoints by 2027 or 2028, hyperscaler capex slows or pauses under investor pressure to show returns on the current buildout, and GE Vernova, Siemens Energy, and Mitsubishi Power collectively bring 50 to 70 gigawatts of additional annual turbine capacity online by 2029, just as new order flow decelerates, giving back 15 to 20 percent of the pricing gains booked in 2025 and 2026. Revenue peaks around $48 billion in 2028 or 2029, then declines to roughly $46 billion by 2031 as new-equipment orders slow, with services revenue providing a floor but not fully offsetting the equipment decline. Consolidated EBITDA margin compresses to roughly 13 percent as equipment pricing pressure hits Power and Electrification and Wind litigation produces additional charges. On an estimated $13.7 of 2031 EPS at a de-rated 17 times cyclical-industrial multiple, this scenario is worth roughly $250 (estimate, not a price target), a severe decline from today’s level. What has to be true: AI capex must meaningfully decelerate, not just moderate, industry capacity additions must genuinely outrun demand, and the market must re-rate GE Vernova from “AI power play” back to “cyclical industrial,” a shift in the dominant narrative, not just a soft quarter. What most likely breaks the bear case: demand proves genuinely structural and broadens to sovereign AI programs, defense, and industrial electrification beyond the initial hyperscaler wave, making the “this is a bubble” thesis wrong in the specific case of physical power infrastructure, even where it might prove right for other parts of the AI trade.
Catalysts and timeline. In the near term: second-quarter 2026 earnings in late July, which will show whether execution against the raised guide continues; the July 4, 2026 wind safe-harbor deadline, which could trigger a rush of US onshore wind construction starts ahead of a federal tax-credit step-down; the next ruling in the Vineyard Wind litigation; third-quarter 2026 earnings in October, which will show whether the first quarter’s extraordinary 71 percent organic order growth is sustaining or decelerating; and quarterly hyperscaler earnings from Microsoft, Amazon, Google, and Meta through the back half of the year, the single best leading indicator for GE Vernova’s own future order intake. Further out: full-year 2026 results in January 2027 and the first FY2027 guide; whether the 2028 management targets of $52 billion revenue and a 20 percent EBITDA margin are hit, missed, or exceeded, the single most consequential medium-term catalyst; industry capacity additions from 2028 through 2030 as all three turbine makers bring expanded capacity online; the BWRX-300’s first operation at Darlington, targeted for the late 2020s; and resolution, one way or another, of the Vineyard Wind and Dogger Bank offshore exposure.
Leading indicators to watch. Gas-turbine new-order pricing commentary on quarterly earnings calls: if “10 to 20 percent price growth on new bookings” softens to “pricing stabilizing,” the overbuild thesis is gaining ground. Hyperscaler quarterly capex guidance, the single best external leading indicator given the 12-to-24-month lag before it shows up in GE Vernova’s own order book. The Electrification book-to-bill ratio, roughly 2.5 times in the first quarter of 2026; a drop below 1.5 times would suggest the grid-equipment scarcity premium is easing. The quarterly Wind EBITDA loss run-rate against the roughly $400 million full-year guide. The conversion rate of gas-turbine slot reservations into firm orders at similar pricing, since the 100-gigawatt backlog includes both. New factory or capacity announcements from Siemens Energy or Mitsubishi Power, the earliest warning sign for industry overbuild. And the Vineyard Wind court calendar itself.
Companies to watch (bull / base / bear)
GE Vernova (GEV), the primary name. Bull: backlog conversion holds, Wind losses shrink on schedule, nuclear starts converting memoranda of understanding to orders. Base: execution roughly meets guidance while the multiple compresses as growth moderates. Bear: a Wind loss overrun (which happened once already, in FY2025), an adverse Vineyard Wind ruling with real financial teeth, or a hyperscaler capex pause. Watch: quarterly Wind EBITDA loss, gas-turbine order pricing commentary, and hyperscaler capex guidance.
Siemens Energy (ENR.DE). Bull: the same AI-power tailwind at a meaningfully lower entry multiple. Base: steady share gains in grid technology offset by continued Siemens Gamesa wind losses. Bear: limited US retail access through a thin, unsponsored ADR, and the same industry-overbuild risk GE Vernova carries. Watch: Siemens Gamesa loss trajectory and Frankfurt-listing liquidity for US investors.
Vestas (VWS.CO). Bull: a pure-play recovery vehicle if wind-industry margins genuinely turn. Base: continued thin margins as the industry works through tariff and cost pressure. Bear: no diversification cushion if the wind cycle stays weak. Watch: gross-margin trend and large-order announcements.
Eaton (ETN). Bull: the same data-center electrification demand, expressed through a more diversified, historically stable industrial. Base: steady growth at a lower multiple premium than GEV. Bear: the Mobility-segment separation adds execution risk unrelated to the core electrification thesis. Watch: Electrical Americas order growth and the pace of the Mobility separation.
Emerson (EMR). Bull: diversified automation exposure to the same power buildout at the lowest multiple in this peer set. Base: steady, less headline-driven growth. Bear: less direct exposure to the specific scarcity dynamics driving GEV’s fastest-growing segments. Watch: automation order trends tied to power and grid capex.
NextEra Energy (NEE). Bull: the Dominion Energy combination, if completed, creates a leading US renewables, storage, and nuclear platform, reinforcing the demand side of the whole thesis. Base: steady rate-based growth continues regardless of the AI narrative. Bear: regulatory and integration risk on a large, complex acquisition. Watch: Dominion deal regulatory progress and data-center power-purchase agreement volume.
Constellation Energy (CEG). Bull: every new hyperscaler nuclear power-purchase agreement reinforces the pricing power of dispatchable clean generation. Base: the Calpine-boosted earnings base continues to grow steadily. Bear: a well-covered, already-popular trade that would come under pressure at the same time as GEV if hyperscaler capex slows. Watch: new data-center power-purchase agreement announcements and nuclear uprate progress.
Risk controls
The single largest risk sitting underneath every other risk in this article is valuation, not the business. At roughly 61 times forward earnings, GE Vernova does not need anything to go wrong to underperform from here; it needs everything to keep going right, and for the market to keep paying a historically extreme multiple for a heavy-industrial company, for that to work. The clearest illustration: if the company delivers its 2028 targets essentially perfectly and the market assigns a still-generous 25 times multiple, a premium by any historical industrial standard, the stock is worth meaningfully less than it trades for today. That is the base-case math in the scenarios above, not a hypothetical stress case.
Segment concentration risk is real and specific: Wind has missed its own loss guidance once already, in FY2025, and is in active, adversarial litigation where the courts have so far sided against GE Vernova at every turn. A reader sizing this risk should watch whether Wind losses stay inside the roughly $400 million FY2026 guide or exceed it again, and should treat the Vineyard Wind litigation as a genuinely open, multi-hundred-million-dollar question rather than a settled, bounded item.
Cyclical and structural risk sits further out but is not smaller: GE Vernova, Siemens Energy, and Mitsubishi Power are all expanding gas-turbine manufacturing capacity into the same demand cycle simultaneously, the same setup that preceded the last severe industry downcycle in 2013 through 2017. This is not an imminent risk, most estimates point to 2028 or later, but it is a real one that the current backlog visibility does not eliminate, only defer.
Concentration on the demand side compounds the cyclical risk: a meaningful share of incremental gas-turbine and grid-equipment demand traces to a handful of hyperscalers’ data-center plans, so if two or three of the largest buyers pause or slow capital spending simultaneously, the order pipeline, not the already-placed and largely deposit-protected backlog, would be the first thing to soften, with a lag of roughly 12 to 24 months before it shows up in GE Vernova’s own numbers.
Finally, GE Vernova has been an independent public company for a little over two years. There is no through-cycle track record for this specific management team and capital structure, no demonstrated ability to navigate a demand downturn or a severe margin squeeze as a standalone entity, and the company’s capital-return promises, the doubled dividend and expanded buyback, are being made in the strongest demand environment the business has ever seen. Whether that discipline holds through a softer cycle is genuinely untested. A reader managing this risk should size any position with the valuation risk foremost, track the specific leading indicators listed above rather than the headline narrative, and remember that the bull case for the company and the bull case for the stock at this specific price are two different questions with two different answers.
Methodology, sourcing, and data-quality flags
This research draws on GE Vernova’s own FY2025 Form 10-K, its Q1 2026 Form 10-Q and accompanying 8-K press releases, its FY2026 proxy statement, third-party market-data aggregators for valuation multiples and technicals, trade press covering the gas-turbine and grid-equipment industry, and court filings and reporting on the Vineyard Wind litigation. Of 124 claims recorded in the underlying ledger, 73 are verified against primary or corroborated press sources, 4 are flagged as disputed across data vendors without being directionally misleading, and the remainder are unverified and, where load-bearing, explicitly hedged below rather than presented as settled fact. Direct fetches of sec.gov filing pages returned rate-limit errors throughout this research pass; the load-bearing financial figures were instead confirmed against GE Vernova’s own press releases, which reproduce the underlying 8-K financial-statement tables, and against the independent verification pass summarized in this section.
On valuation, the verified evidence shows GE Vernova trading at roughly 61 times forward earnings, 85.4 times trailing EV/EBITDA, and 7.4 times EV/Sales, all well above both its closest full-portfolio peer, Siemens Energy, at 35 to 39 times EV/EBITDA, and the same-day, same-source peer set profiled in the valuation chart above, from GE Aerospace’s 48.4 times forward P/E down to Emerson’s 20.5 times. The PEG ratio of 1.94 suggests the growth rate partially, but not fully, justifies the premium. Even the more optimistic 38-analyst sell-side consensus, with a mean target of $1,212, implies only about 9 percent upside, while a separate 34-analyst read with a median target of $943.80 implies downside. On every verified valuation metric, the stock is expensive relative to peers and to the growth it is currently delivering, and this is the binding constraint on the overall read.
On growth, first-quarter 2026 revenue grew 16 percent, organic orders grew 71 percent, total backlog reached $163 billion, roughly two and a half years of forward revenue, gas-turbine backlog grew from 83 to 100 gigawatts in a single quarter, Electrification’s book-to-bill ratio ran at roughly 2.5 times, and FY2026 guidance has been raised twice in five months. The 2028 management outlook of $52 billion in revenue, up from $38.1 billion in FY2025, is supported by verified backlog visibility. For a company of this scale, this is best-in-class growth, driven by the structural intersection of AI power demand and decades of grid underinvestment.
On quality, Power and Electrification segment margins are expanding rapidly, up 470 and 670 basis points year over year respectively in the first quarter of 2026, toward the 17-to-20-percent guided range. Free cash flow was strong, and the balance sheet, on the primary figures confirmed, is net-cash. Capital allocation looks disciplined: a doubled dividend, an expanded buyback, and a committed multi-year capacity build. The clear quality drag is Wind: a $382 million EBITDA loss in a single quarter, worse than the year-earlier period, with active litigation and a guidance-miss track record already on the books.
On risk, the extreme valuation itself is the primary risk factor, since any execution miss would likely be punished severely by a market pricing in near-flawless delivery. Specific risks layered on top include Wind losses that have already exceeded guidance once, in FY2025; Vineyard Wind litigation that has gone against GE Vernova at every court ruling so far; industry overbuild risk as all three major turbine makers expand capacity into the same cycle; concentration in a handful of hyperscaler customers; disclosed tariff costs of roughly $250 million to $350 million a year; and only a little over two years of track record as an independent public company. The net-cash balance sheet and large backlog provide real downside protection against a business-level shock, but they provide no protection against multiple compression, which is a market-level risk, not a business-level one.
On momentum, the stock is up an estimated 69 to 76 percent year to date and roughly doubled or more over the trailing 52 weeks by most reads, trading near its all-time high, with a Buy sell-side consensus. Retail sentiment reads as extremely bullish. The narrative is firmly “AI power play.” Cautionary signals worth weighing against that momentum include unusually wide analyst target dispersion, one consensus read showing a median target below the current price, and a reported, though not independently confirmed, large proportional insider sale by the head of the company’s most troubled division. Momentum is genuinely strong, but sentiment reads as crowded, and a narrative this one-directional increases vulnerability to a single disappointing data point.
Taken together, this is a rules-based research signal, not personalized investment advice: on balance, the read across these five factors lands at Hold. Strong, verifiable growth and improving quality in two of three segments are real and well-documented. They sit opposite a valuation that already assumes years of continued flawless execution, a third segment that keeps missing its own targets, and a momentum picture that looks crowded even though it is grounded in genuine results.
Data-quality flags:
- Return figures for GEV show real dispersion across vendors (year-to-date 69 percent versus 76 percent; one-year 127 percent price-only versus 243 percent total return) and could not be reconciled to a single precise number in this pass.
- Beta readings ranged from 0.69 to 1.05 depending on vendor, wide enough that none should be treated as precise, though all cluster around “roughly market-like.”
- Short interest readings (10.54 million shares/3.92 percent of float versus 9.19 million shares/3.42 percent) and technical readings (moving averages, RSI) both showed vendor disagreement wide enough to flag as directional rather than exact.
- Analyst consensus median target disagreed meaningfully between two reads ($1,235 versus $943.80); both are reported above rather than reconciled, since the disagreement itself is informative.
- Gas-turbine market-share figures by OEM are genuinely disputed across sources and methodologies (megawatt share versus unit count versus advanced-frame-only); this article states the oligopoly structure rather than a single precise share number.
- A reported $40 billion US-Japan government support figure for the BWRX-300 nuclear program is single-sourced to a blog aggregator and was not corroborated against a government release or an 8-K; it is not treated as a confirmed figure here and is omitted from the article body for that reason.
- Balance-sheet detail (long-term debt, total equity, shares outstanding, and specifically the reported jump in Q1 2026 long-term debt to roughly $2.8 billion) came from a single secondary aggregator, not a direct read of the 10-K or 10-Q, and is flagged above rather than treated as settled.
- The reported insider sale by GE Vernova’s Wind division CEO is sourced to a secondary aggregator, not independently confirmed against the underlying SEC Form 4 filing, and is presented as a watch-list item, not a conclusion.
- Peer forward P/E figures for GE Aerospace, Eaton, Emerson, and Constellation were pulled live from stockanalysis.com on the research date, the same source and method used for GE Vernova’s own verified multiple, specifically to build an apples-to-apples same-day comparison for the valuation chart above.
Key sources: GE Vernova FY2025 and Q1 2026 8-K press releases and investor materials (gevernova.com); stockanalysis.com for price, market cap, and valuation multiples across GEV and the peer set; Utility Dive, Windpower Monthly, and the Boston Globe for gas-turbine backlog and Wind-segment reporting; offshorewind.biz and windtech-international.com for Vineyard Wind litigation status; the US EIA Annual Energy Outlook 2026 and EPRI’s Powering Intelligence analysis for electricity-demand forecasts; and Stocktwits and Glassdoor for the sentiment and employee-signal reads flagged as soft data above.
Prepared July 2, 2026. Figures are point-in-time and will change. This is research and analysis for educational purposes, not investment advice, not a recommendation, and not a solicitation. Industrial capital-goods and power-equipment stocks are cyclical, litigation-exposed, and sensitive to tariff and energy policy, all of which can change without much warning. Verify all figures independently and consult a licensed financial advisor before making any decision.