
Research date: June 29, 2026 | OSINT market research on Caterpillar Inc. (CAT, NYSE), the world’s largest maker of construction and mining machinery and large engines, now in the middle of a re-rating from a deep cyclical into something the market wants to treat as an AI-power infrastructure stock. The most recent reported numbers are full-year 2025 (filed February 13, 2026) and the first quarter of 2026 (filed May 6, 2026). Q2 2026 results are expected in early August and are not yet out.
Important disclaimer. This is OSINT-based research and educational analysis, not investment advice. I am not a financial advisor. Nothing here is a recommendation to buy or sell any security, and the scenarios below are illustrative, not price targets. Caterpillar is a high-beta cyclical (five-year beta around 1.6) whose two largest end markets, construction and mining, swing hard with the global economy, whose fastest-growing segment depends on a hyperscaler data-center capex cycle that consensus itself expects to decelerate, and which trades near 50x trailing earnings against a five-year median closer to 17x, so the downside if the cycle or the multiple turns is large. Market caps, prices, valuation multiples, backlog figures, and market-share estimates are point-in-time (June 29, 2026), press-reported where noted, and move fast. Do your own due diligence and consult a licensed advisor.
Where this stock could be in 6 months, 1 year, 3 years, and 5 years
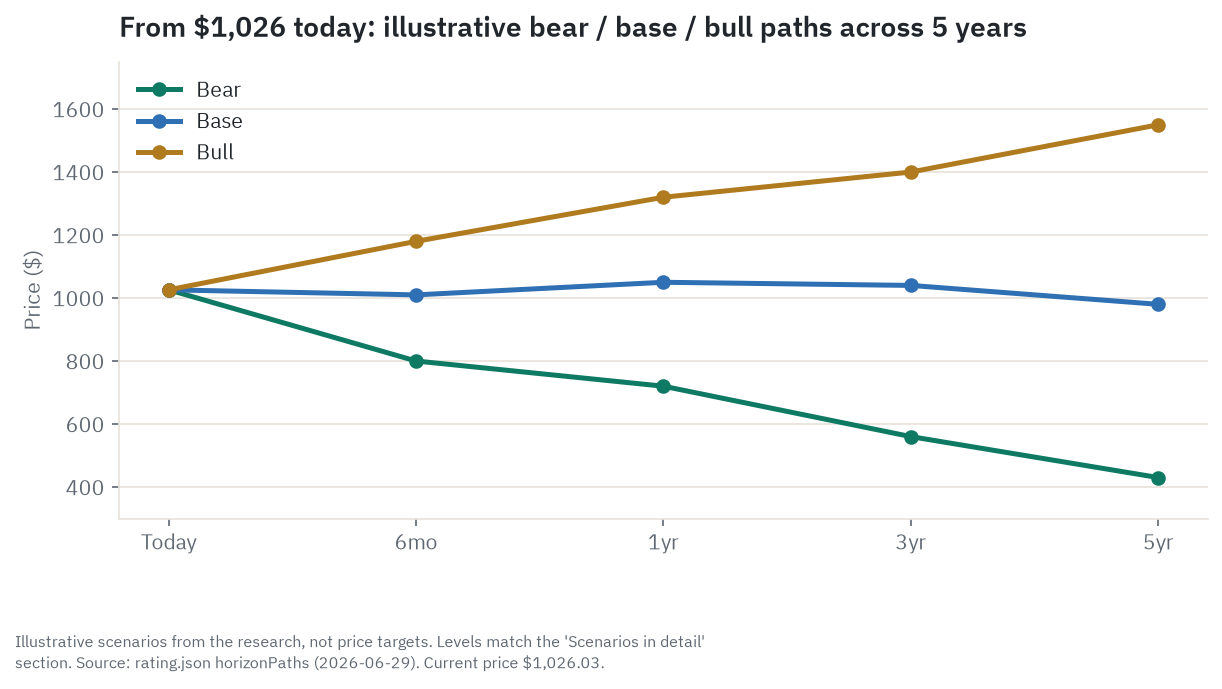
Every dollar range below is an illustrative estimate built from a stated 2030 earnings assumption times a stated exit multiple, net of buybacks. None of them is a price target, and nothing here is a forecast you should trade on. The stock was around $1,026 when this was written, just below its June 25 all-time high of $1,057 and up roughly 75 percent on the year; the quote above is the current number.
6 months (into late 2026). This window is about earnings prints and positioning, not anything structural. CAT is stretched. It sits well above its 200-day moving average, carries a beta near 1.6, and has already run 8 to 9 percent past the roughly $945 sell-side mean target, with insiders selling into the rally rather than buying. The base case is roughly flat, near $1,010, as more 2026 beats land but bump into a stock that has already outrun consensus. The bull case, near $1,180, needs fresh named gigawatt power contracts and another Power and Energy beat to carry it toward the $1,200 Street high. The bear case, near $800 and close to the April support around $792, is a hard mean-reversion if the first-quarter dealer-restock bump in Construction fades into a visible deceleration, or if a hyperscaler trims data-center capex guidance. The single thing most likely to flip this window is the Q2 and Q3 order rate and whether Construction end-user demand actually pulls through.
1 year (mid-2027). Here the dominant variable is whether the record $62.7 billion backlog is still growing, not just high. The base case, near $1,050, has the backlog holding, 2026 adjusted earnings landing around $24, and the multiple drifting down only modestly. The bull case, near $1,320, has the re-rate reinforced, the backlog growing again, and the market paying roughly 38x on rising earnings. The bear case, near $720, starts the moment the backlog prints flat-to-down for the first time, because that removes the load-bearing data point under the whole thesis and the multiple begins compressing toward peers (Deere trades near 35x) before earnings even roll. Watch the backlog trajectory and the four big hyperscalers’ capex guidance.
3 years (2029). Now the structural drivers show, and this is the skeptic’s break window. Consensus has hyperscaler AI capex growth decelerating from roughly 51 percent in 2026 to about 13 percent in 2027 and around 5 percent in 2028, which is exactly when Caterpillar’s tripled engine capacity (built mostly 2027 through 2029) and competitor supply both arrive. That combination compresses the 107-week lead times and the scarcity pricing that hold Power and Energy margins up. The base case, near $1,040, has demand moderating to mid-single-digit growth, earnings near $30, and the multiple settling around 30x, so the price ends roughly flat. The bull case, near $1,400, has power demand persisting past the digestion, earnings near $34, and the premium intact. The bear case, near $560, is the glut: the order rate slows on schedule into rising supply, P&E margin softens, Construction has lost its restock tailwind, mining is one copper scare away from a fleet-order freeze, and the market re-rates a “structural AI play” back toward a cyclical.
5 years (2030). This is the pure durability question. The base case, near $980, has revenue compounding 6 to 7 percent to about $92 billion and adjusted earnings near $33 on buybacks, but the multiple normalizing from today’s peak toward 28 to 30x, so the price ends roughly where it started and the return is mostly the small dividend plus buyback. The bull case, near $1,550, validates the power franchise as a permanently higher earnings base, around $100 billion of revenue, roughly $40 of earnings, and a sustained 35 to 38x. The bear case, near $430, is a 2027-08-style multi-segment downturn from a higher base that takes earnings toward $16 to $17 at a cyclical 25x, a level that lines up with GuruFocus’s GF Value estimate near $418. The widest gap is here: roughly $430 to $1,550, about 3.6x, which tells you how much of this is a bet on the multiple rather than the machines.
Where the read lands today. On balance, CAT looks like a Hold here. It is a best-in-class industrial franchise priced for near-perfection at roughly 50x trailing earnings, already 8 to 9 percent above the sell-side mean target, with a genuine new growth leg in data-center power bolted onto a business that is still two-thirds cyclical. The franchise quality and the real growth offset the rich valuation and the cyclical risk to something close to neutral. The single thing most likely to flip the read is the backlog: the first flat-to-down print, paired with a hyperscaler capex cut, would tip it bearish, while a clean multiple reset without an earnings break would make it look cheap enough to lean the other way.
Companion tool
Jump to the interactive dashboard to sort and filter CAT against its ten-company peer and customer set across valuation, growth, quality, risk, and momentum, or download the Excel model to flex the bull, base, and bear scenarios with your own earnings and multiple assumptions.
TL;DR
Caterpillar is the world’s number-one maker of construction and mining equipment and one of the largest makers of big engines, generators, and turbines, organized into three machinery-and-engine segments plus a captive lender. In 2025 it did a record $67.589 billion in revenue. The reason the stock has nearly doubled in a year is that one segment, the renamed Power and Energy unit, has become an AI-infrastructure story: hyperscalers cannot get grid power fast enough for data centers, so they buy Caterpillar reciprocating engines and Solar turbines for on-site prime and backup power, and that demand has pushed the company-wide backlog to a record $62.7 billion, up 79 percent year on year, with engine lead times stretched to 107 weeks. The durable core underneath is the dealer network and the roughly $24 billion aftermarket parts-and-service annuity that keeps earning long after a machine is sold. The problem is price. At about 50x trailing earnings against a five-year median near 17x, and already past the average analyst target, the market is paying a technology multiple for an earnings base that is still mostly cyclical, that is carrying a $2.2 to $2.4 billion tariff headwind management treats as roughly permanent, and whose fastest segment leans on a hyperscaler capex curve consensus expects to decelerate just as Caterpillar’s tripled capacity and competitor supply land in 2027 through 2029. Quality and growth are real; the valuation leaves no cushion. The read is Hold.
Explore it yourself: the interactive dashboard
What Caterpillar actually is today
Strip away the AI headlines and Caterpillar is a maker of very large, very expensive iron. It builds excavators, dozers, wheel loaders, and road machinery for contractors and governments; ultra-class haul trucks and mining shovels for copper, gold, and oil-sands operators; and reciprocating engines, industrial gas turbines, gensets, locomotives, and marine propulsion for power and energy customers. It reports three machinery-and-engine segments plus a financing arm:
- Construction Industries (CI) - the volume engine, roughly $25.1 billion of 2025 segment revenue. The most cyclically sensitive, tied to infrastructure, nonresidential building, and (indirectly) housing.
- Resource Industries (RI) - mining and heavy machinery, roughly $12.5 billion. The highest-beta segment, tied to commodity capex, and the one carrying the most margin pressure right now.
- Power and Energy (P&E) - the renamed and reorganized old Energy and Transportation unit, now the largest segment at roughly $32.2 billion and the fastest grower, powered by data-center and oil-and-gas demand.
- Financial Products (Cat Financial) - the captive lender, roughly $3.6 billion of revenue, that finances dealers and customers and keeps the iron moving.
Total 2025 revenue was a record $67.589 billion, up 4.3 percent on the year. That number understates how much the mix moved: in 2025 the company formally renamed Energy and Transportation to Power and Energy and shifted the Rail business into Resource Industries, restating prior years, which tells you where management thinks the story is headed.
Two facts frame everything else. First, this is not primarily an AI stock, however the tape behaves. Of $17.4 billion in first-quarter 2026 revenue, Power and Energy was $7.0 billion; the other $10.4 billion is still cyclical construction and mining. Second, the real durability of the business does not sit in new-machine sales at all. It sits in the installed base of three to four million machines in the field and the recurring parts-and-service revenue that only Caterpillar can economically supply. Think of each machine as a ticket sold once; the parts and service are the toll it pays for the next fifteen to twenty-five years. The new-equipment cycle is loud and volatile. The toll is quiet and durable. The investing question is how much of today’s earnings is toll and how much is a loud, possibly peaking, cycle.
How the money flows
flowchart TD
    CI_CUST["Construction customers\nContractors, govts, infrastructure"]
    MI_CUST["Mining customers\nBHP, Rio, Freeport-McMoRan"]
    PE_CUST["Power-energy customers\nData centres, oil-gas, utilities, rail"]

    CI_SEG["Construction Industries\n~$25.1B sales, 14.9% margin"]
    RI_SEG["Resource Industries\n~$12.5B sales, 10.7% margin"]
    PE_SEG["Power and Energy\n~$32.2B sales, 19.9% margin"]

    DEALERS["~160 independent dealers\nFinning, Toromont, WesTrac, Zeppelin"]
    PARTS["Aftermarket parts and service\n$24B of $67.6B total revenue"]
    CATFIN["Cat Financial\n$24.9B receivables, $3.6B revenue"]

    STEEL["Steel inputs\nNucor, SSAB; Section 232 tariff: $1.5-1.8B hit 2025"]
    ELEC["Electronics and semiconductors\nThird-party industrial suppliers"]
    MFG["CAT manufacturing\n65+ US plants; also UK, Brazil, China, India"]

    CI_CUST -->|equipment purchase / rental| DEALERS
    MI_CUST -->|equipment purchase| DEALERS
    PE_CUST -->|direct and dealer purchase| PE_SEG

    DEALERS -->|wholesale equipment buy| CI_SEG
    DEALERS -->|wholesale equipment buy| RI_SEG
    DEALERS -->|floor-plan financing| CATFIN

    CI_SEG --> MFG
    RI_SEG --> MFG
    PE_SEG --> MFG

    DEALERS -->|parts orders| PARTS
    CI_CUST -->|service and parts demand| PARTS
    MI_CUST -->|service and parts demand| PARTS

    CATFIN -->|retail loans and leases to customers| CI_CUST
    CATFIN -->|retail loans and leases to customers| MI_CUST

    STEEL --> MFG
    ELEC --> MFG
    MFG --> CI_SEG
    MFG --> RI_SEG
    MFG --> PE_SEG
Read the chart top to bottom. Demand starts at three separate customer pools, each on its own capital cycle: construction contractors and governments, mining operators, and power-and-energy buyers including data-center developers, oil-and-gas producers, utilities, and rail and marine fleets. Almost none of them buy directly from Caterpillar. Most equipment moves through one of roughly 160 independently owned dealers who hold the retail relationship, carry the inventory, arrange the financing, and service the machine.
The dealer layer is Caterpillar’s first structural advantage, and it is where the toll gets collected. Dealers earn a margin on each machine, but the real economics come after the sale: every machine in the field generates parts and service revenue for years, and Caterpillar controls that stream because the parts are proprietary, the dealers are the only authorized channel, and the company’s telematics platform (around 1.5 million connected assets) sees equipment health in real time and pre-positions service before a machine fails. In 2025 the company booked roughly $24 billion of services revenue out of $67.6 billion total. That recurring, capital-light stream is the high-value tier.
Sitting next to the dealer is Cat Financial, which lends dealers the money to stock inventory and lends customers the money to buy. It held about $24.9 billion in finance receivables at year-end 2025. By funding the purchase it pulls demand forward, keeps dealers solvent through downturns, and deepens the lock-in, because a machine financed through Cat Financial is a machine that stays in the Caterpillar service ecosystem. On the input side, steel is the single largest raw-material cost, which is exactly where the tariff problem bites. The duties in question are Section 232 tariffs, named for the provision of the Trade Expansion Act of 1962 that lets the US government tax imports it deems a national-security concern, here applied to steel and aluminum and their derivative products. That node in the diagram, marked with the Section 232 hit, is the chokepoint that compressed margins in 2025 and remains the most quantified near-term headwind.
The segments: where the revenue actually comes from
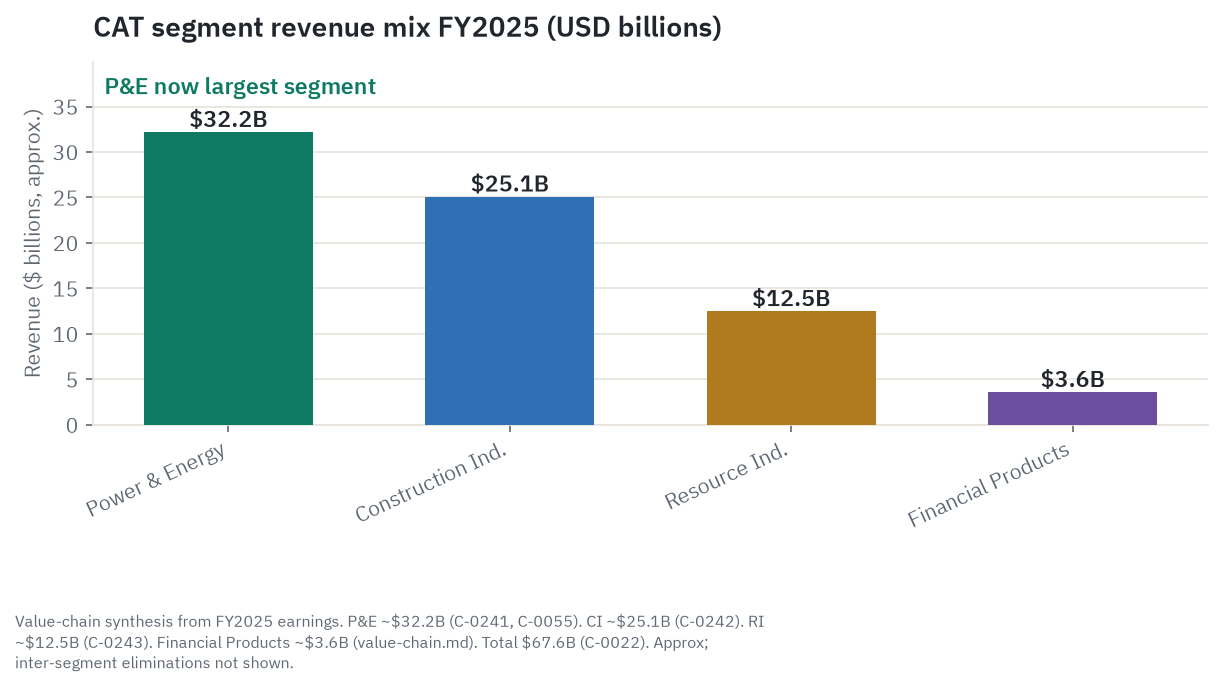
The chart shows how the weight has shifted. Power and Energy is now the biggest slice at about $32.2 billion, around 48 percent of the machinery-segment mix; Construction is second; mining and finance are smaller. One note on the arithmetic before the walk-through: those four figures add to more than the $67.589 billion headline, and that is not an error. The machinery and engine segments report sales that include what they sell to each other (Power and Energy engines that go into Construction and mining machines, for instance), and the consolidated total nets those inter-segment sales back out, with Financial Products revenue counted on a separate basis. So read the segment figures for the mix and the direction, not as a column that sums to the company total. Here is each in turn.
Construction Industries is the largest single revenue block by machine count and the most cyclical. In the first quarter of 2026 it posted $7.161 billion, up 38 percent year on year, at a 21.4 percent margin. That headline is flattering, and I will come back to why: end-user retail sales rose only 7 percent (North America up 12 percent, but Europe-Africa-Middle East down 2 percent), and the gap between that and the reported 38 percent was a roughly $1.5 billion dealer restock. The segment is exposed to US infrastructure spending, nonresidential building like data centers and chip fabs, and only indirectly to housing, since residential framing uses light equipment, not big dozers.
Resource Industries is the mining segment and the one under the most pressure. First-quarter 2026 revenue was $3.797 billion, up just 4 percent, at a 10.0 percent margin, down from roughly 17 percent a year earlier. Most of that 700-basis-point compression, about 500 basis points, was tariffs. The reason mining wears the heaviest tariff hit in percentage terms is structural: the tariff dollars split roughly half into Construction and a quarter each into Power and Energy and Resource Industries, but mining is less than a fifth of revenue, so the same share of cost lands on a thinner base. Mining machines are also the most metal-intensive things Caterpillar builds, since an ultra-class haul truck is hundreds of tonnes of fabricated steel, so steel and aluminum duties bite hardest there. And as the most commodity-linked, price-taking segment, mining has the least room to pass the cost straight through. The puzzle is that order intake in the quarter was the highest since 2012, driven by copper and gold, even as the margin trough deepened. Management’s explanation is long delivery lead times and tariff costs; the segment also now includes the reclassified Rail business, which muddies the year-on-year comparison. This is a fleet-refresh cycle, not a greenfield mine-building boom: as CEO Joe Creed put it, there aren’t many new mines going in, so customers keep updating an aging fleet.
Power and Energy is the segment doing the heavy lifting on the story. First-quarter 2026 revenue was $7.031 billion, up 22 percent, at a 20.6 percent margin, with the power-generation sub-segment alone up 48 percent year on year. It makes the large reciprocating engines (the Cat 3500 and 3600 families), Solar industrial gas turbines, oil-and-gas compression engines, and marine and rail propulsion. Power generation crossed $10 billion of full-year revenue in 2025. This is the highest-margin primary segment and the fastest grower, and it gets its own section below because it is the entire re-rating case.
Financial Products (Cat Financial) is the quiet enabler. It earned about $942 million in first-quarter 2026 revenue and $245 million of profit, up 14 percent, on roughly $24.9 billion of receivables. Credit quality is benign: past-due receivables were 1.39 percent at the end of the quarter, down from 1.58 percent a year earlier, with an allowance of 0.86 percent. The portfolio is match-funded, so net interest margin is relatively insensitive to which way rates move. Cat Financial is not a profit driver so much as a demand pump: it keeps the flywheel spinning through down-cycles by financing the dealers and the customers when the open market will not.
The dealer network and the aftermarket annuity
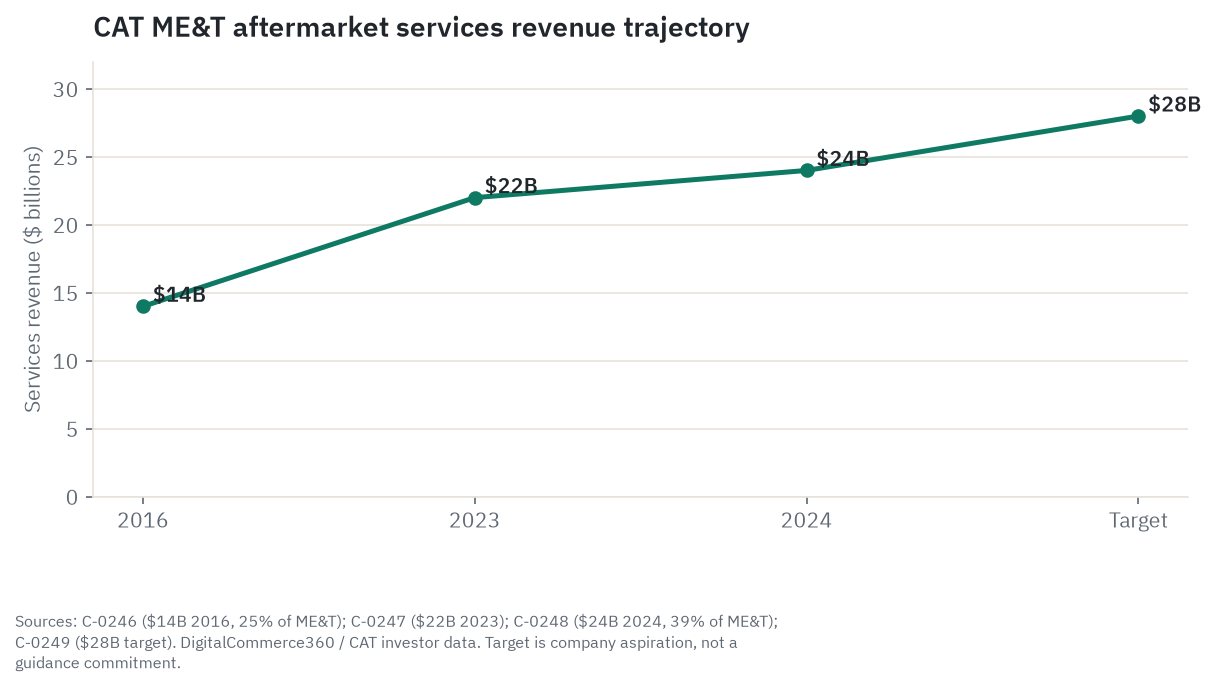
The $28 billion figure is the company’s services goal for roughly 2026; the data points are spaced by milestone rather than evenly by year, so read the line as direction, not slope.
If the AI-power thesis is the reason the stock moved, the dealer network and the aftermarket annuity are the reason the business is worth owning through a cycle at all. About 160 independent dealers operate across 197 countries with roughly 170,000 employees and 2,700-plus locations. In most markets a dealer cannot carry a competing brand, which makes each dealer a local parts-and-service monopoly inside its territory. Rebuilding that from scratch is a fifteen-to-twenty-year project, which is the real reason SANY and XCMG have not cracked North America and Europe even where their machines are price-competitive.
The economics live in the parts. Aftermarket parts carry structurally higher margins than new equipment for three reasons: there is no competitive manufacturing process for original-spec parts, dealers cannot cross-brand a Cat powertrain, and the only substitutes are gray-market or counterfeit parts that mining and contractor fleet managers reject on warranty and liability grounds. Caterpillar bundles this into Customer Value Agreements, maintenance plans now attached to more than two-thirds of new machines and engines sold, which convert a one-time sale into a recurring stream. Customers who use the company’s digital tools spend up to a third more on aftermarket services, and the parts e-commerce platform now runs more than $15 million a day. Downtime on a mining haul truck can cost more than $50,000 an hour, so a dealer that can deliver the part in 48 hours holds enormous pricing power.
The cushion is real, and so is the recent stall. In the 2015-16 mining bust, revenue fell about 33 percent peak to trough and the company cut more than 10,000 jobs, but parts declined less than new equipment and recovered first; the 2020 COVID year showed the same pattern. That is the through-cycle floor argument, and it is genuine. But the chart also shows the catch: services revenue grew from $14 billion in 2016 to $24 billion in 2024, then stayed flat at $24 billion in 2025. The original target of $28 billion by 2026 now needs a $4 billion step-up in a single year, and sources cannot even agree whether that target still stands or has quietly rolled into the $30 billion 2030 goal. Caterpillar does not publish a standalone parts line, so the magnitude of the downturn cushion cannot be stated as a hard fact, only as a qualitative pattern confirmed across two prior cycles. The flywheel is real. It is also, for the moment, not accelerating.
The AI data-center power thesis: the new secular tailwind
This is the part of the business that turned a cyclical industrial into a momentum stock, so it is worth being precise about what is real and what is hope.
The mechanism is simple and genuine. Training and running large AI models needs more uninterrupted power, at higher density, than the US grid can deliver on the timeline hyperscalers want. Grid interconnection queues run three to seven years in most US markets. Goldman Sachs has estimated the US data-center power shortfall at more than 11 gigawatts today, widening toward 45 gigawatts by 2028. So data-center developers do what oil rigs and hospitals have always done: they build their own power on-site, and increasingly they build it as prime, continuous-duty generation rather than just backup. Caterpillar’s large natural-gas reciprocating engines and Solar turbines are a primary tool for that, and the demand has been ferocious.
It helps to be clear that Caterpillar sells into the data center with two different machines, and that the choice between them is where the competitive risk hides. The first is the large reciprocating engine, essentially a giant industrial piston engine, deployed in arrays of many units. The second is the gas turbine, which is a jet-engine-style machine that spins a generator. Caterpillar plays in both: the 3500 and 3600 reciprocating-engine families, and the Solar Turbines line of mid-size industrial gas turbines. A data-center developer picks the architecture based on how it wants its power shaped. Reciprocating-engine arrays are modular, fast to deploy, easy to add or subtract in increments, and well-suited to behind-the-meter on-site prime and backup power, which is where Caterpillar is strongest. A single large utility-scale gas turbine is the choice when the developer wants centralized, continuous baseload power at the biggest campuses, and that is the heavy-duty, high-megawatt territory GE Vernova dominates with its HA-class machines. Caterpillar’s Solar turbines sit below that heavy-duty class, so they do not fully cover it. That is why GE Vernova winning a turbine socket is a direct threat rather than just context: a campus that standardizes on a large turbine architecture is power load that Caterpillar’s reciprocating engines, and its smaller Solar turbines, did not capture, and the two technologies are competing for the same data-center demand.
The evidence is in the order book. The large reciprocating-engine backlog has grown more than 3.5x since January 2024. Lead times on the 3600-family engines have stretched to about 107 weeks, described by Raymond James as the longest in its coverage history. There are at least six publicly announced agreements of one gigawatt or more, totaling at least 8.1 gigawatts of named data-center prime-power contracts: a 2-gigawatt deal for the Monarch compute campus in West Virginia tied to Microsoft and NVIDIA, a 4-gigawatt combined-heat-and-power agreement with Joule Capital at Wheeler in Utah, and a 2.1-gigawatt five-year framework with ProPetro’s ProPWR, among others. Management has committed to roughly tripling large reciprocating-engine capacity from 2024 levels and taking Solar Turbines capacity to about 2.5x, and it raised its long-term revenue growth target from 5-to-7 percent to 6-to-9 percent specifically because of this segment. This connects Caterpillar directly to the AI capex of the hyperscalers and to the broader data-center buildout that names like NVIDIA and Oracle anchor.
Now the three honest caveats. First, Caterpillar does not disclose what share of power-generation revenue is data-center versus other; management says “primarily data center,” but the exact number is not public, so the AI exposure is majority-but-unquantified. Second, the contracts are multi-year frameworks, not disclosed take-or-pay purchase orders, and Caterpillar publishes no cancellation rate or termination terms. Third, and most important, the thesis lives or dies on the order rate, not the backlog level. The current backlog covers deliveries through 2027 and into 2028. What matters for a long-term holder is whether new orders keep refilling it after that, and the timing here is uncomfortable: consensus syntheses have hyperscaler capex growth decelerating from roughly 51 percent in 2026 to about 13 percent in 2027 to around 5 percent in 2028, which is precisely when Caterpillar’s tripled capacity and competitor supply both arrive. Wartsila is bringing 35 percent more capacity online in the first quarter of 2028; Cummins, INNIO, and GE Vernova are all expanding. Building extra lanes onto the highway just as the traffic forecast thins is how you manufacture a glut, and a glut compresses the 107-week lead times and the scarcity pricing that hold the segment’s margins up. The structural case is real. Whether it is durable past 2028 is the single biggest open question in the stock.
The cyclicality engine: construction, mining, and oil and gas
The two-thirds of the business that is not the power story still moves the way it always has. Construction Industries sits mid-cycle and bifurcated. The public side is in the strongest stretch of its run: the Infrastructure Investment and Jobs Act committed roughly $550 billion of genuinely new money, and as of late 2025 agencies had obligated about $568 billion but outlaid only $119 billion, which means the physical spending wave is still ahead, not behind. US transportation construction is forecast to hit a record $209 billion in 2026. The private residential side is the mirror image, soft with mortgage rates above 6 percent, though Caterpillar’s residential exposure is limited. China is the swing factor: its property-led construction cycle stalled, and domestic brands took share with cheaper machines, so Asia-Pacific volume has been weak for several quarters.
Mining is in an early-to-mid upturn driven by copper and gold rather than the iron ore and coal that drove the last super-cycle. The top 20 miners are estimated to spend about $82.4 billion of capex in 2026, up 3.8 percent. The structural copper case is strong: global copper demand is projected to rise about 50 percent by 2040, an electric vehicle uses nearly three times the copper of a combustion car, and an AI data center needs roughly 27 to 33 tonnes of copper per megawatt. The catch is that mining capex is discretionary on a shorter horizon than construction. Caterpillar’s own history is the warning label: the 2014-16 commodity rout, triggered by a China slowdown, pushed revenue down roughly 18 percent and forced thousands of job cuts. China is still 50 to 60 percent of global copper demand, and a 10 percent copper-price drop is enough to freeze marginal-miner fleet orders within a quarter.
The oil-and-gas thread inside Power and Energy is a separate leg, driven by LNG export buildout and Permian gas processing rather than upstream drilling, and it runs on the same large engines as the data-center business, which is good for factory utilization but means a simultaneous shock to both would hit the segment hard. Names like ExxonMobil sit upstream of this demand. The key point for the cycle is that the three drivers are genuinely more diversified than in 2014: policy-funded infrastructure, commodity-linked mining, and contract-backed data-center power do not all move on the same trigger. That lowers the odds they roll over together. It does not eliminate them. A sharp global recession that froze hyperscaler capex and cracked commodity prices at the same time would hit all three at once, from a higher earnings base than 2014, so the dollar drawdown would be larger.
Company by company: who’s who
Caterpillar is the anchor; the rest are peers, power competitors, and customers that tell you whether the thesis is working. All figures are point-in-time and dated.
Caterpillar (CAT, NYSE) - the global number-one in construction and mining equipment and a leader in large reciprocating engines for power generation. Recent: Q1 2026 revenue $17.4 billion, up 22 percent; operating margin 17.7 percent; record backlog near $63 billion, up 79 percent; power generation retail sales up 41 percent; a $710 million quarterly tariff hit. Bull: AI and hyperscaler power demand re-rates Power and Energy into a structural growth engine, with capacity tripling to 2030 and the book sold out years forward. Bear: tariffs of $2.2 to $2.4 billion compress margins, the construction cycle is already elevated, and if AI capex moderates the backlog could soften faster than a 50x multiple implies.
The peers in earthmoving and engines:
Deere & Company (DE, NYSE) - the global number-one in farm equipment and a close construction-and-forestry competitor, around $165 billion market cap. Recent: Q1 fiscal 2026 net sales $9.6 billion, up 13 percent, with Construction and Forestry up 34 percent. Bull: construction momentum plus a precision-ag software layer each re-rating. Bear: this is the live example of a peer whose cycle already turned, with Production and Precision Ag operating profit down 59 percent in the quarter on tariffs and warranty costs. Deere is the honest mirror: its ag cycle is where CAT’s mining and construction cycles could go.
Komatsu (KMTUY OTC / 6301.T) - the global number-two in construction and mining, the closest rival in big haul trucks. Recent (data roughly one month stale, around May 2026): fiscal 2026 revenue near flat with management guiding meaningful profit declines on Asia weakness and tariffs. Bull: autonomy and electrification positioning. Bear: it is guiding profit down, the ADR is thin and unsponsored with currency risk, and on the autonomy metric the bull cites for CAT, Komatsu just crossed 1,000 autonomous trucks against CAT’s roughly 827, so CAT is actually behind on that count.
Cummins (CMI, NYSE) - the number-two global engine and generator maker, around $96 billion cap, and the cleanest comparison for the AI-power story. Recent: Q1 2026 revenue $8.4 billion, up 2.7 percent, with Power Systems at a record on data-center demand and North America power generation up 23 percent. Bull: Power Systems is the same data-center tailwind. Bear: its largest segment, trucks, is in a roughly 20 percent cyclical decline, and tariffs are compressing margins. Here is the tell: Cummins trades near 22.5x forward against CAT’s 37 to 39x while riding the same power tailwind. If the AI-power story were the whole re-rate, CMI at 22x says CAT’s premium is at least partly narrative.
The AI-power comparison set:
GE Vernova (GEV, NYSE) - the number-one gas-turbine maker, around $303 billion cap, with gas turbines sold out to 2029 and a $163 billion backlog. Bull: multi-year visibility at improving margins. Bear: the valuation prices flawless execution, and crucially this is a competitive threat, not just context. GE Vernova targets utility-scale turbines while CAT targets distributed on-site power, but every data center that picks a turbine architecture is load CAT’s reciprocating engines did not win.
Generac (GNRC, NYSE) - the US leader in residential standby generators, around $16 billion cap, growing in commercial and data-center backup. Bull: data-center and grid-resilience demand. Bear: it competes at lower power ratings and does not play in CAT’s multi-gigawatt hyperscale prime-power tier, so it cannot be used to corroborate CAT’s data-center addressable market.
Terex (TEX, NYSE) - a niche maker of aerial work platforms and material processing, around $8 billion cap. Bull: the aerials cycle is inflecting with a strong book-to-bill. Bear: tariffs pushed Q1 EBITDA margin to 9.9 percent and aerials to breakeven; it is a small-cap with no pricing power, useful mainly as a read-through on tariff pain.
Volvo Group (VLVLY OTC / VOLV-B.ST) - top-three in heavy trucks and top-five in construction equipment, around $69 billion cap. Bull: electrification and a possible European truck-cycle recovery. Bear: reported revenue down 9 percent on currency, a pressured truck cycle, and a thin unsponsored ADR with krona risk.
The customers that confirm or break demand:
BHP (BHP, NYSE ADR) and Rio Tinto (RIO, NYSE ADR) - two of the largest miners, each around $170 to $205 billion cap, both running large CAT fleets and both signing fleet-electrification and autonomy deals (CAT battery-electric 793 trucks went to the Pilbara in December 2025, and Escondida signed a full-fleet replacement with CAT). Bull: copper and energy-transition capex drives multi-year CAT orders. Bear: both are roughly half iron ore, hostage to Chinese steel demand, which is the exact variable that ended the last CAT cycle. They are as much a risk tell as a demand tell: an iron-ore or China rollover shows up in their capex within a quarter.
What the filings say
Start with the income statement. Revenue went from $59.4 billion in 2022 to a then-record $67.1 billion in 2023, dipped to $64.8 billion in 2024 on dealer destocking, and set a new record of $67.589 billion in 2025. The momentum carried into 2026: fourth-quarter 2025 revenue was a single-quarter record $19.133 billion, and first-quarter 2026 was $17.415 billion, up 22 percent.
The margin story is the more important one, and it is shown below.
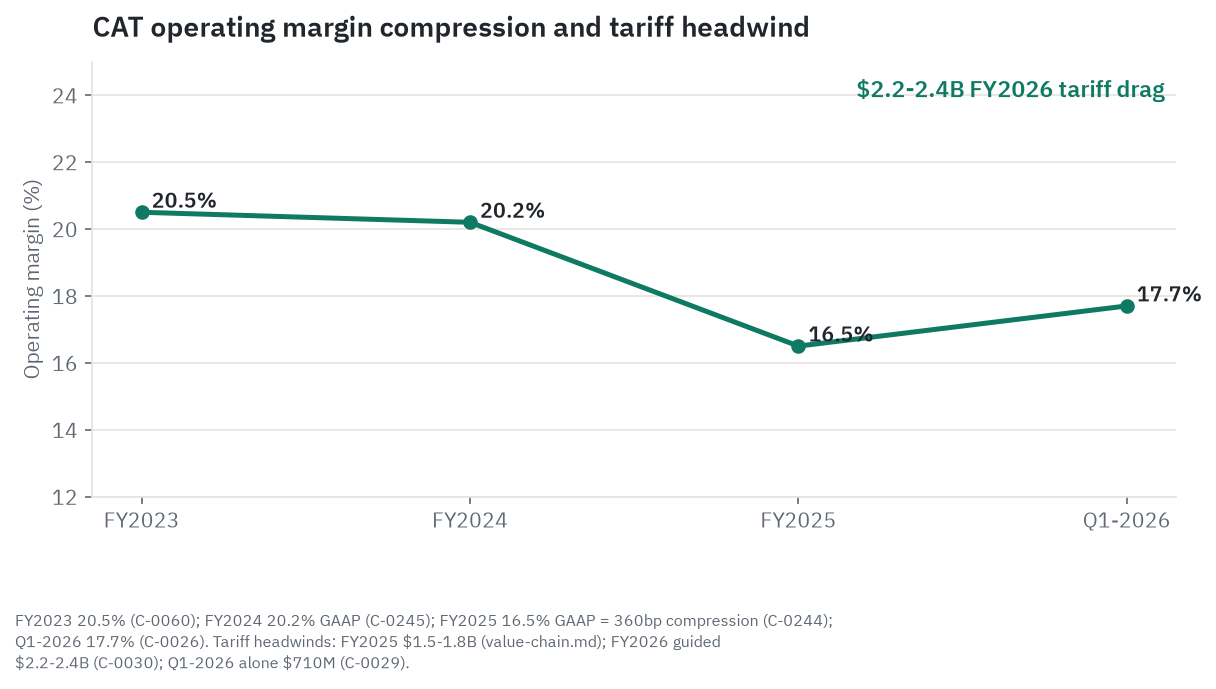
The vertical axis on this chart starts at 12 percent rather than zero, which visually magnifies the margin swing; the underlying move is from 20.2 to 16.5 percent.
GAAP operating margin fell from 20.2 percent in 2024 to 16.5 percent in 2025; on an adjusted basis it went from a 20.7 percent peak to 17.2 percent. That decline was almost entirely cost-driven, and the largest single cause was $1.7 billion of net tariff costs. The recovery began in the first quarter of 2026, with GAAP margin at 17.7 percent and adjusted at 18.0 percent, but here is the detail the bulls skip: that 18.0 percent was actually down from 18.3 percent a year earlier despite 22 percent revenue growth, because tariffs consumed what the extra volume would normally have added. GAAP diluted earnings were $18.81 for 2025 (adjusted $19.06), down from $22.05 in 2024, and $5.47 in the first quarter of 2026 (adjusted $5.54, up 30 percent).
Cash generation is elite and that is not in dispute. Machinery, Energy and Transportation free cash flow was $9.5 billion in 2025, the third straight year above $9 billion, on $67.6 billion of revenue. Management initially guided 2026 free cash flow slightly lower, then after the strong first quarter lifted that to above $9.5 billion. The company returns substantially all of it: 2025 shareholder returns were $7.9 billion ($5.2 billion of buybacks plus $2.7 billion of dividends), about 84 percent of free cash flow. The first quarter of 2026 was unusually aggressive, roughly $5.0 billion of buybacks in one quarter including a $4.5 billion accelerated repurchase, which drew enterprise cash from $10.0 billion at year-end to $4.1 billion at the end of March. The dividend was raised 8 percent to $1.63 a quarter in June, the 32nd straight annual increase, keeping the Dividend Aristocrat status intact.
On the balance sheet, enterprise debt was about $44 billion at year-end 2025, but roughly $28 to $30 billion of that sits inside Cat Financial, funded against receivables, which is the standard structure for a captive lender. Manufacturing-side net debt is materially lower and likely near zero or net cash. Credit ratings are A2 from Moody’s, A from S&P, and A+ from Fitch. The most concrete forward indicator in the filings is the backlog, which the next chart traces.
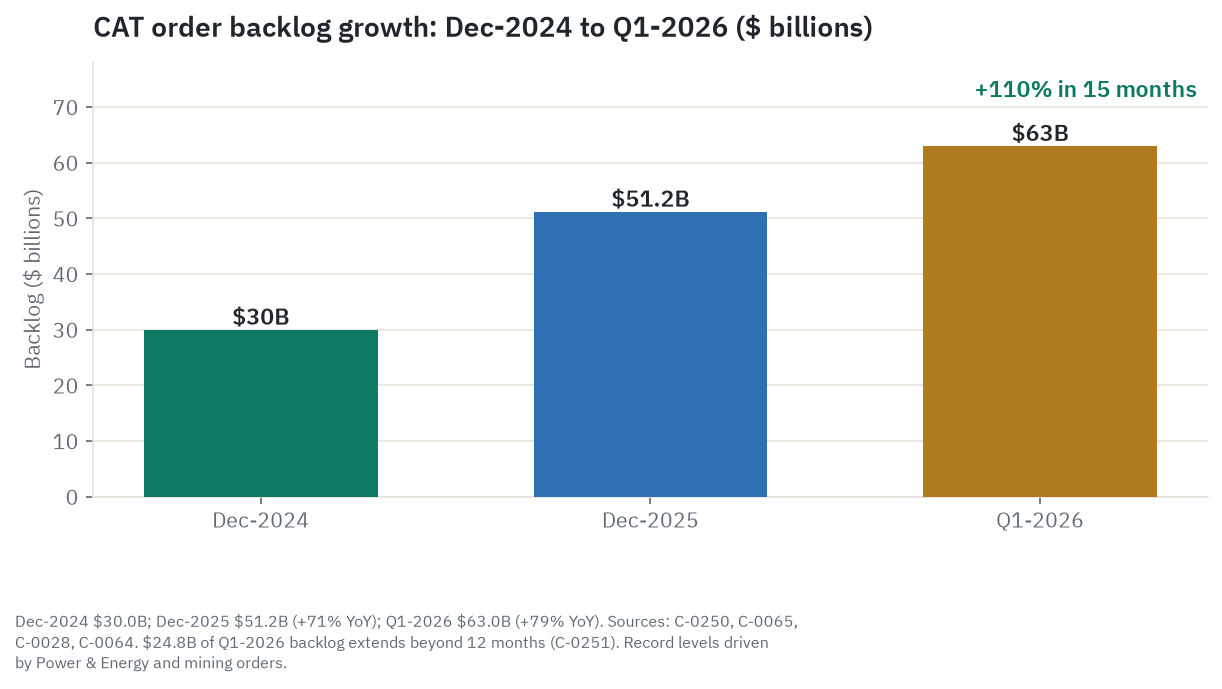
Backlog went from $30.0 billion at the end of 2024 to $51.2 billion at the end of 2025 (up 71 percent) to $62.7 billion at the end of the first quarter of 2026 (up 79 percent year on year), with $24.8 billion deliverable beyond twelve months. That is the number that anchors the whole bull case, and it comes with a major caveat the company itself creates: Caterpillar does not disclose a segment split of the backlog. Management only says all three segments contributed. The single quantified sub-figure is that the large reciprocating-engine book is up more than 3.5x since January 2024. There is no public firm-versus-framework breakdown and no disclosed cancellation terms. You can see the reservoir level. You cannot see the inflow pipe, or whether the contracts are firm or cancellable. That is a visibility claim, not visibility, and a 50x multiple is leaning hard on it.
The risk factors management itself discloses are worth taking at face value. The end markets are among the most cyclical in the global economy; revenue fell about 37 percent peak to trough in 2009, and the independent-dealer model amplifies the swing because dealers run down inventory when confidence breaks. Tariffs are flagged as the most quantified near-term risk, $2.2 to $2.4 billion for 2026, and management treats them as roughly permanent until trade policy changes. The reason it is treated that way, rather than as a one-off, is that the two obvious escapes are both slow: passing the cost through in price is partial and lagged, especially in the commodity-linked segments, and re-sourcing or reshoring the affected imported steel and components cannot be done quickly, so absent a policy change the cost simply stays in the run-rate. And Cat Financial’s reliance on commercial paper and notes is a funding risk: a credit-market disruption could impair the financing arm that moves the iron. On the insider side, the confirmed activity is selling rather than buying: the outgoing CFO sold about $11.5 million of stock at $571 to $575 just before the run toward $1,000. That is consistent with normal executive liquidity management ahead of a retirement, not a panic signal, but there is no open-market insider buying to point to either.
What the market is paying
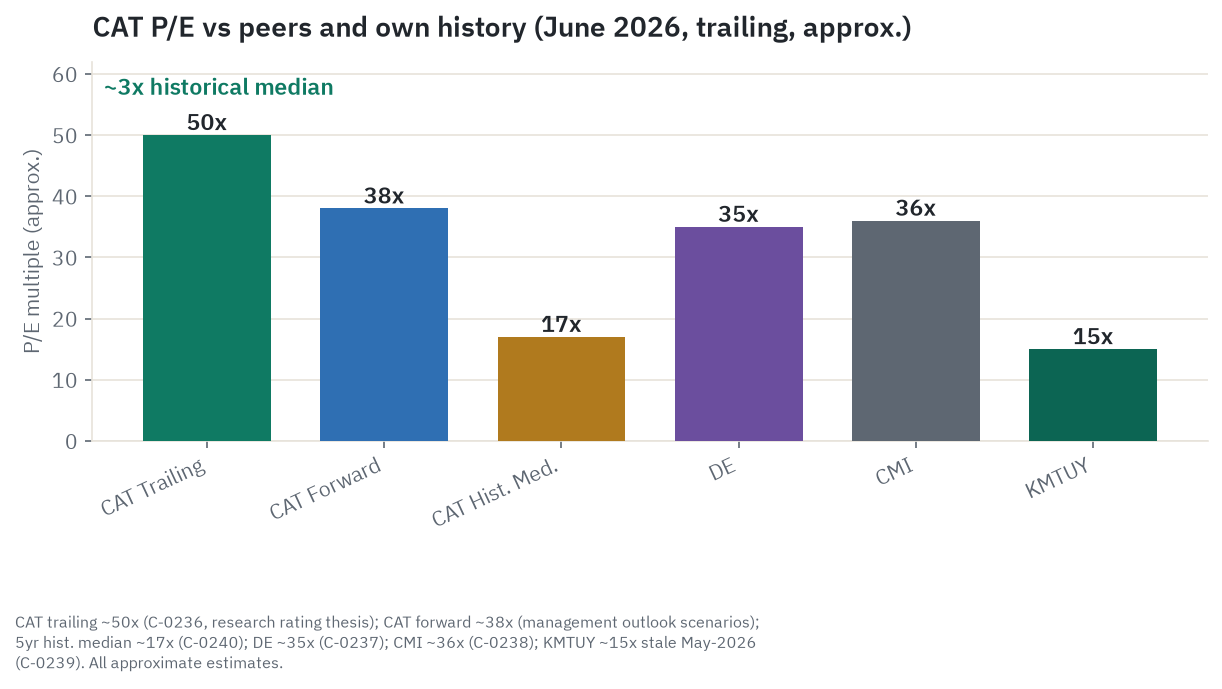
This is the crux. As of June 29, 2026, the stock was around $1,026, just below the June 25 all-time high of $1,057 and up 74.87 percent year to date on a total-return basis, against 7.47 percent for the S&P 500. Over the trailing twelve months it returned about 164 percent versus 21 percent for the index, and it has run at roughly 2.7x the year-to-date return of both Deere and Cummins, which are themselves strong performers. The whole gap traces to the AI-power narrative, since neither peer is as exposed to data-center power. Beta is about 1.6, and the maximum drawdown over the trailing year was a modest 13.88 percent, trough dated March 30, which is small for a high-beta name and shows how relentless the uptrend has been.
The valuation is rich on every axis. Trailing P/E is 49.67x. Forward P/E is disputed between sources at roughly 37 to 39x, and EV/EBITDA is disputed at roughly 30 to 34x, so I use the ranges rather than a single number. Price-to-sales is 6.47x and the dividend yield is just 0.59 percent. Against CAT’s own history, the five-year median P/E is roughly 17x (year-end multiples sat at 16 to 17x from 2022 through 2024), so today’s trailing multiple is about three times its own norm. Against peers, Deere trades at 34.75x trailing and 30.93x forward, Cummins at 35.62x trailing but only 22.51x forward, and Komatsu around 14 to 17x (data stale to roughly May 2026). CAT trades at a 43 percent premium to Deere and roughly three times Komatsu’s multiple.
The central question is whether the market is right to pay a technology multiple for this. The bull argument is that AI power has permanently raised the earnings base, so a higher steady-state multiple is warranted and the $63 billion backlog supports it. The bear argument is mean reversion: in every prior cycle CAT’s P/E compressed back toward 15 to 17x when orders turned, and if the roughly $20 of trailing earnings is itself a cycle peak inflated by above-trend power revenue and a one-time restock, then normalizing the segment would push earnings down and the multiple would have to expand further at the same price or the price would fall. A reset to 25x on flat earnings, still a generous premium to history, is around $502, a 51 percent drawdown. Both arguments are live, and the stock trading 8 to 9 percent above the $941 to $950 sell-side mean target tells you the price has already run past the people paid to be optimistic. The Street is a Moderate Buy with one Strong Buy, sixteen Buys, nine Holds, and no Sells, a $1,200 high target and a $500 low. Short interest is low at 1.84 percent of float, so there is no squeeze dynamic; this is a long-only momentum story, not a crowded short.
The ownership base is institutional and concentrated. Institutions hold roughly 71.85 percent of the shares, insiders about 1.13 percent, and retail and other accounts the remaining 27 percent or so. BlackRock is the top holder at about 37.17 million shares, around 8.07 percent, followed by the usual index and active heavyweights: Vanguard, State Street, State Farm, Geode, Fisher, Morgan Stanley, Bank of America, the Gates Foundation Trust, and T. Rowe Price. Two things follow from that. The Gates Foundation’s long-standing stake points to a long-horizon value orientation in the holder base. And with this much of the float in index and quasi-index hands, mechanical rebalancing flows can move the stock on their own, separate from any change in the fundamentals. There was no unusual block accumulation or disposition flagged in the latest 13F data.
What the crowd is saying
The narrative is the loudest part of this stock and it is worth reading as a signal rather than a fact. Since late 2025 and accelerating through the April 30 first-quarter print, the dominant story has been CAT re-rating from a cyclical machinery maker into an AI-infrastructure supplier. Coverage volume is high and the tone on the AI-power thread is enthusiastically warm, fed by datable hooks: power-generation revenue up 41 percent, the record backlog, and named multi-gigawatt contract wins. Running underneath, coverage of the traditional segments is cooler, and the tariff headwind, real as it is, rarely leads a story.
CAT is not a meme stock and its size makes it effectively immune to thin-float manipulation, but something unusual is happening: retail attention and message volume have spiked to levels abnormal for an industrial name, and the framing on retail platforms mirrors the institutional story almost exactly. That is the soft risk. When every outlet, forum, and sell-side note tells the same re-rating story at once, the signal value of any single positive item drops and downside surprises carry asymmetric punch.
The sharpest divergence between narrative and fundamentals is what the crowd is ignoring. The story treats the whole enterprise as if it carried the durability and growth of the power segment, but Power and Energy was $7.0 billion of a $17.4 billion quarter; the other $10.4 billion is still cyclical. Resource Industries’ margin collapsed to 10 percent. Construction’s 38 percent growth was substantially a dealer restock that management says does not repeat. The tariff headwind directly compresses the margin the market is paying 50x for. The crowd’s “CAT is an AI company with a construction business attached” is ahead of what the consolidated financials support. One more soft signal: Glassdoor reviews aggregate to a respectable 4.0 out of 5, but a cluster of layoff reviews describes teams cut without warning as the company reorganizes around the higher-growth segments, which fits the business narrative but suggests more internal friction than the headline rating implies. Treat the retail and search signal as impressions, not measurements; the news flow and the contract announcements are the checkable layer.
Durability and the moat: what survives the cycle
Put the pieces together and the durability verdict is nuanced. Three things are genuinely structural. The dealer network and the installed base are a distribution-and-service moat that no competitor can replicate inside a decade, and the switching cost for a mine standardized on Caterpillar trucks runs to tens of millions of dollars. The aftermarket annuity is real and proven to decline less than new equipment in a downturn, even if its precise magnitude is undisclosed and it has stalled at $24 billion. And the power-generation demand is contract-backed with investment-grade counterparties on multi-year delivery commitments, which is a different animal from the six-to-twelve-month discretionary orders that drive mining.
But the honest framing, which Caterpillar’s own macro analysis reaches, is that cyclicality here has been deferred and partially diversified, not transcended. The power segment is not yet large enough to insulate the company from a severe multi-segment recession, the two cyclical segments are still two-thirds of revenue, and the 2015-16 template remains the relevant downside analogy, only from a higher base. The structural layer is real. It is grafted onto a deep cyclical, not the other way around. An investor pricing in a permanent low-beta re-rating should want to see the power order rate persist past 2028, after the current contract book delivers and the new capacity lands, before treating the structural narrative as the base case.
The scenarios in detail
Four dials decide where CAT and the stock are in five years, and the bull, base, and bear cases are just different settings of the same four.
- The Power and Energy order rate, not the backlog level. This is the re-rate engine. The entire structural thesis depends on whether new hyperscaler orders keep refilling the book past 2028, when CAT’s tripled capacity and competitor supply both arrive and the consensus capex curve (51 percent growth in 2026, 13 percent in 2027, 5 percent in 2028) says the order rate slows exactly as supply lands.
- The cyclical core, construction plus mining, about two-thirds of revenue, driven by IIJA execution, chip-fab sitework, miner capex, and the copper-and-China swing. Genuinely cyclical, with two shared failure modes: a China-commodity shock and a rate-driven construction wobble.
- The margin trajectory. Adjusted margin fell to 17.2 percent in 2025 on the tariff hit, with mining troughing at 10 percent. The bull needs tariffs to ease and volume-plus-services mix to push the blend back toward 20 percent. The bear notes margin fell year on year even on rising revenue and that management treats the tariff as permanent.
- The multiple. Roughly 50x trailing today against a 17x median. Whether this settles toward a still-premium 28 to 30x or reverts toward a cyclical 17 to 25x is the largest single swing in the five-year price, bigger than the earnings themselves.
Bull case (illustrative valuation around $1,400 to $1,600, an estimate, not a target). The power order rate stays elevated past the 2027-08 digestion, oil-and-gas and LNG compression adds a second leg, revenue compounds 8 to 9 percent toward $100 billion by 2030, adjusted margin recovers to about 21 percent as tariffs ease and services finally hits the $30 billion target, and the multiple holds a structural 35 to 38x. Adjusted earnings run from about $19 in 2025 to roughly $24 in 2026 to about $40 in 2030. What has to be true: hyperscaler capex does not fully decelerate, or CAT’s share of named gigawatt load keeps rising fast enough to outrun the competitor supply landing in 2028. What most likely breaks it: the backlog stops growing as the order rate slows on schedule.
Base case (illustrative around $900 to $1,080). Power demand moderates after 2027 but stays structurally larger; the cyclical core grows with IIJA then flattens into the 2028-30 infrastructure cliff; mining is lumpy but positive on copper and gold. Revenue compounds 6 to 7 percent to about $92 billion, adjusted margin settles 18 to 19 percent, and the multiple normalizes from 50x toward a still-premium 28 to 30x. Adjusted earnings run roughly $19 to $24 to about $33 by 2030, but the price ends roughly flat because earnings growth and multiple compression cancel, leaving the dividend and buyback as the return. What most likely breaks it: the multiple compresses faster than earnings grow, pulling the base toward the bear.
Bear case (illustrative around $340 to $560, midpoint near $430). This is the skeptic’s sequence and it does not require anything exotic. Hyperscaler capex growth decelerates on the consensus schedule into 2028 exactly as CAT’s tripled capacity and Wartsila, Cummins, INNIO, and GE Vernova supply all land; the 107-week lead times normalize, scarcity pricing evaporates, and P&E margin softens. Construction has already lost its restock tailwind and runs on 7 percent end-demand with Europe negative; a China or copper shock freezes mining fleet orders. A 2015-16-style 15-to-18 percent multi-segment revenue decline from a higher base, with operating deleverage, takes adjusted earnings toward $16 to $17, and the market re-rates the “structural AI play” back toward a cyclical 25x. The damage is a de-rate first, an earnings miss second. The midpoint near $430 lines up with GuruFocus’s GF Value of about $418 and with the de-rate arithmetic of roughly $341 at 17x to about $502 at 25x on flat earnings. The asymmetry is the whole point: the bull needs the order rate to stay elevated past 2028, while the bear only needs it to decelerate on schedule, which is the consensus forecast.
Catalysts and timeline. Near term, watch Q2 2026 earnings in early August for the first read on whether construction growth survives the restock fade (management guided minimal change in dealer inventory) and the tariff run-rate; the August dividend; Q3 earnings for full-year guidance; the October 1 retirement of outgoing CFO Andrew Bonfield (Kyle Epley took over as CFO on May 1, 2026); and any new named hyperscaler gigawatt contract. Multi-year, the inflections are the 2027-29 capacity build landing as the order rate is forecast to slow, Wartsila’s 35 percent capacity expansion in the first quarter of 2028, the 2028-30 post-IIJA infrastructure cliff, and the 2030 Investor Day targets coming due.
Companies to watch (bull / base / bear)
These are the tickers whose prints confirm or break the CAT thesis before CAT’s own numbers do.
- The four hyperscalers (MSFT, GOOGL, AMZN, META). Watch: their quarterly data-center capex guidance leads CAT’s power order rate by one to two quarters. Two or more concurrent guidance cuts is the clearest early warning.
- Cummins (CMI). Base/bear tell: same power tailwind at 22.5x forward versus CAT’s 37 to 39x. If CMI’s Power Systems momentum stalls, CAT’s premium has no support; if it persists while CAT de-rates, the premium was narrative.
- GE Vernova (GEV). Bear tell: every gigawatt of data-center load that picks a GEV turbine is load CAT’s engines did not win. Turbine order momentum is a direct competitive read.
- Deere (DE). Bear tell: the equipment peer whose cycle already turned (ag down, Construction and Forestry still up). It is the live preview of what a CAT cyclical rollover looks like.
- BHP and Rio Tinto (BHP, RIO). Demand and risk tell: their capex confirms the mining fleet-refresh cycle, but both are half iron ore, so a China or iron-ore rollover in their numbers is the earliest sign the mining leg is cracking.
- Generac (GNRC). Context only: useful for the broader on-site power theme, but it does not compete in CAT’s hyperscale prime-power tier, so do not use it to size CAT’s data-center market.
Risk controls
The honest risk list, and what would change the read. This is a beta-1.6 cyclical trading near 50x on a base that is two-thirds cyclical and above the sell-side target, so the asymmetry is unfavorable at the high. The specific things that would tip the read bearish: the backlog prints flat-to-down for a quarter or two; a hyperscaler trims data-center capex; recip-engine lead times fall as Wartsila, Cummins, INNIO, and GE Vernova capacity lands; P&E margin slips below 18 percent; construction revenue converges down toward the 7 percent end-demand; or a copper break freezes mining orders. Any two of those together remove the support under the multiple. The things that would rescue the bull: a durable second wave of power demand (grid hardening, electrification, sovereign-AI buildout) that keeps the backlog growing into the new capacity, tariffs easing via trade policy, and services finally stepping up toward the $30 billion target. On liquidity and access there is no issue: CAT is a deeply liquid large-cap with roughly $3.7 billion of daily turnover. The risk is not getting in or out; it is the valuation after the run and the cyclicality underneath it.
Methodology, sourcing, and data-quality flags
This is a single-company deep dive built from primary filings (the FY2025 10-K filed February 13, 2026; the Q1 2026 10-Q filed May 6, 2026; the Q4/FY2025 and Q1 2026 8-K earnings releases; dividend, CEO, and CFO transition 8-Ks), management’s November 2025 Investor Day, point-in-time market data, and analyst and trade-press syntheses for the competitive and macro context. The source hierarchy is primary filings first, then analyst-tier estimates (TrendForce-style, Goldman, Dell’Oro, Raymond James), then reputable trade press, then labeled estimates. Every load-bearing figure traces to the claims ledger.
Data-quality flags:
- Power and Energy full-year revenue is an estimate near $32.2 billion. This is the figure used throughout and in the segment chart; it was corrected up from a lower-end press figure of about $28.6 billion that circulates in some sources. CAT does not publish a single-line full-year P&E total in its press releases, so the figure is an additive-and-corroborated estimate pending the clean 10-K segment note. Earlier internal drafts carried a $28.6 billion figure; do not use it.
- The $62.7 billion backlog has no public segment split and no disclosed firm-versus-framework or cancellation terms. Management says only that all three segments contributed; the one quantified sub-figure is the recip-engine book up 3.5x since January 2024. Treat the backlog as company-level and undisaggregated; it is a visibility claim, not contracted revenue.
- Data-center share of power-generation revenue is undisclosed. Management says “primarily data center”; the AI exposure is majority-but-unquantified.
- Forward P/E and EV/EBITDA are disputed. Forward P/E is 39.33x (StockAnalysis) versus 36.62x (GuruFocus, dated May 7), so I use 37 to 39x. EV/EBITDA is 34.17x versus 30.17x depending on the EBITDA definition, so I use 30 to 34x.
- The historical P/E of roughly 17x is from a single aggregator (companiesmarketcap/MacroTrends via search summary). Directionally robust, but a single source.
- Year-to-date and trailing returns are point-in-time (June 26 to 29, 2026) and the 3- and 5-year returns are press-tier (FinanceCharts via search summary, the direct site returned an error). The 50- and 200-day moving averages disagree across vendors by up to $300, so I avoid precise technical levels.
- Komatsu (KMTUY) data is roughly one month stale (around May 2026) and its P/E is disputed (14 to 17x). The peer comparison carries that caveat.
- Tariff figures ($1.7 billion for 2025, $2.2 to $2.4 billion guided for 2026) are management and press, consistent across the earnings releases but not isolated to a single primary 10-K line; treat them as guidance.
- The aftermarket downturn cushion is qualitative only. CAT publishes no standalone parts line, so the magnitude of the cushion cannot be stated as fact, only the pattern (parts declined less than equipment and recovered first in 2015-16 and 2020).
- The forward earnings, revenue, and scenario valuations are estimates, built as stated earnings assumptions times stated exit multiples net of buybacks. They are illustrative, not price targets.
On the five-factor read, in plain prose:
Valuation is the clearest negative. At roughly 50x trailing, 37 to 39x forward, and 30 to 34x EV/EBITDA against a 17x five-year median, trading 8 to 9 percent above the $945 sell-side mean target with GF Value near $418, the stock prices a structural-technology outcome into a still-largely-cyclical earnings base. There is no cushion.
Growth is the best part of the story and genuinely strong: a record $62.7 billion backlog up 79 percent, low-double-digit 2026 revenue guidance, power generation up 48 percent in the quarter, a raised 6-to-9 percent long-term target, and a real multi-year runway in power, infrastructure, and mining. The caveat is that some of the near-term print is channel-fill and the order rate is forecast to decelerate after 2027.
Quality is top-tier: $9.5 billion of free cash flow for a third straight year, A-band credit ratings, a 32-year Dividend Aristocrat record, a near-monopoly aftermarket annuity with telematics lock-in, and elite returns on capital. This is one of the highest-quality industrial franchises in the market.
Risk nets negative. Beta near 1.6, two-thirds of revenue deeply cyclical, a $2.2 to $2.4 billion tariff headwind treated as roughly permanent, a segment-opaque and framework-heavy backlog, hyperscaler-capex concentration in the fastest segment, and an asymmetric de-rate setup. The strong balance sheet, with most debt sitting in the captive finance arm, keeps this at moderate rather than severe.
Momentum and sentiment are positive but get low weight: up about 75 percent year to date, above every major moving average, with a warming AI-power narrative, tempered because the stock is extended, past the mean target, with insiders selling and a one-thesis crowd.
The overall lean is a Hold. A high-quality, structurally improving franchise priced at a peak multiple already above where the sell-side thinks fair value sits, where the franchise quality and real growth offset the rich valuation and cyclical risk to roughly neutral. This is a labeled, rules-based research signal, not personalized investment advice. See the disclaimer.
Key sources: Caterpillar FY2025 10-K (SEC EDGAR, CIK 0000018230); Q1 2026 10-Q; Q4/FY2025 and Q1 2026 8-K earnings releases (investors.caterpillar.com, prnewswire.com); June 2026 dividend 8-K; November 2025 Investor Day; StockAnalysis, MarketBeat, GuruFocus, and TIKR for point-in-time market data (June 29, 2026); Raymond James (engine lead times); Goldman Sachs and Dell’Oro (data-center power gap and hyperscaler capex); Manufacturing Dive, Power Engineering, and Microgrid Knowledge (named power contracts); Mining Technology and EY (miner capex and copper demand); CreditSights/Allianz-style consensus (hyperscaler capex curve).
Prepared June 29, 2026. Figures are point-in-time and will change. This is research and analysis for educational purposes - not investment advice, not a recommendation, and not a solicitation. Caterpillar is a high-beta cyclical trading near 50x trailing earnings with a fast-growing segment dependent on a hyperscaler capex cycle that consensus expects to decelerate, so the downside if the cycle or the multiple turns is large. Verify all figures independently and consult a licensed financial advisor before making any decision.