
Research date: June 25, 2026 | OSINT market research on Exxon Mobil Corporation (XOM, NYSE), integrated oil and gas supermajor, Pioneer acquisition closed May 2024, operator of the Guyana Stabroek Block, four operating segments: Upstream, Energy Products, Chemical Products, Specialty Products.
Important disclaimer. This article is OSINT research produced for educational and informational purposes only. It is not investment advice, not a solicitation to buy or sell any security, and not a personalized recommendation. All prices, market capitalizations, dividend yields, and financial figures are point-in-time as of June 25, 2026, and move continuously - oil-price-driven names such as XOM can reprice materially within hours of a Brent or WTI move. The stock closed at $137.54 and Brent crude (the North Sea grade that serves as the global benchmark oil price) at roughly $74 per barrel on the research date; both are fast-moving figures that will differ from current reality by the time you read this. Key risks specific to this company include commodity price risk, energy-transition and stranded-asset risk, geopolitical risk (Guyana Stabroek Block, Middle East supply lanes), active climate litigation (Massachusetts and others), refining-margin cyclicality, chemical-margin cycle depth, and Pioneer integration execution risk. Nothing here constitutes a guarantee of future returns, a dividend guarantee, or a prediction of litigation outcomes. Conduct your own due diligence and consult a qualified financial adviser before making any investment decision.
Where this stock could be in 6 months, 1 year, 3 years, and 5 years
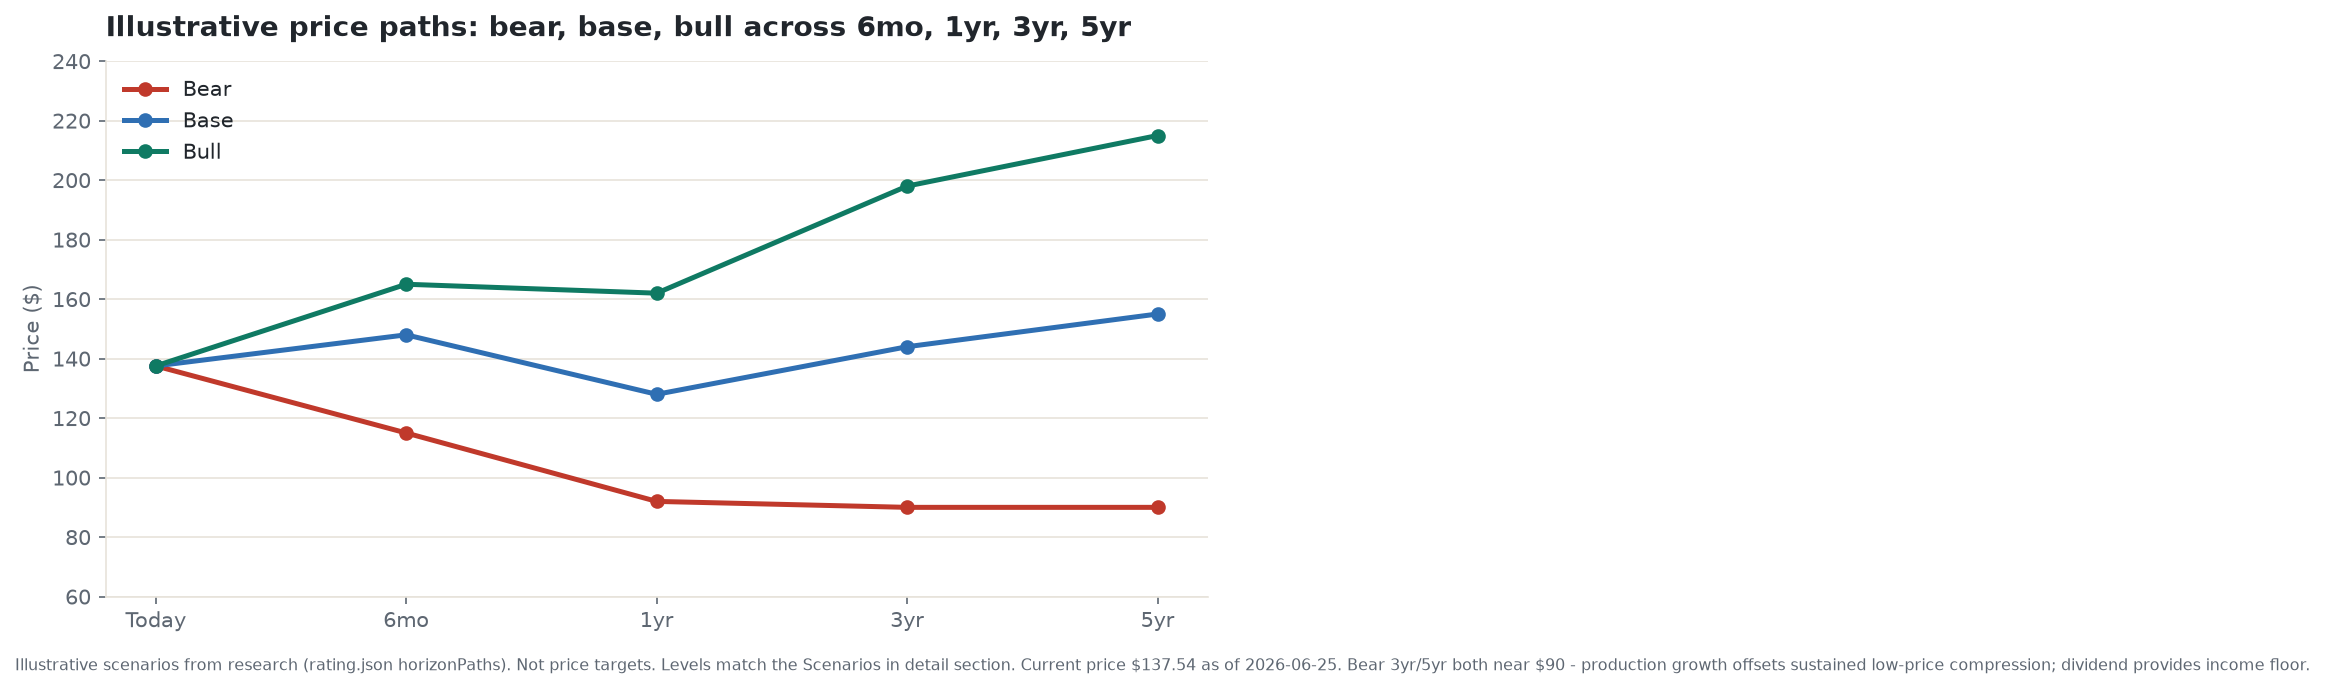
XOM closed at $137.54 on June 25, 2026 - roughly 22 percent below its 52-week intraday high of $176.41, which was struck in late March when Brent crude was surging toward $115 during the Strait of Hormuz conflict. The ceasefire signed June 17 sent crude into a rapid 36 percent retreat. All ranges below are estimates derived from stated scenario assumptions. They are not price targets.
6 months. The window to approximately December 2026 belongs to one dominant event: Q2 2026 earnings, due July 31, which will reflect April and May war-era prices and should produce a very strong print. But it is the forward guidance - management’s read on H2 Brent and full-year production - that will move the stock. In the base case, Brent stabilizes in the $70-75 range, the production ramp is confirmed intact, and XOM bounces from oversold technical territory (14-day RSI near 35 on the research date) toward an estimated $148. In the bull case, Q2 earnings materially beat, oil holds $78-85, and the stock re-rates toward the sell-side mean near an estimated $165. In the bear case, Iranian supply returns faster than expected, Brent slides toward $62-68, and the market pre-prices 2027 EPS of roughly $5.75-6.00 (skeptic estimate), pulling XOM toward an estimated $115 and threatening the 200-day moving average around $135. The single thing most likely to flip the 6-month read is the pace of Iranian crude production returning to global markets through H2 2026.
1 year. By approximately June 2027 the 2027 oil price path will dominate. Goldman Sachs models 2027 average Brent at roughly $75 (estimate); Morgan Stanley’s more constructive view sits at roughly $80 (estimate); JPMorgan’s commodity desk is at $64 (estimate). The spread from $64 to $80 captures the market’s genuine uncertainty about how fast OPEC+ cohesion holds and Iranian supply returns. The IEA’s June 2026 Oil Market Report projected a potential surplus of around 5 million barrels per day in 2027 as Gulf and Iranian production returns while demand recovers only 2 million barrels per day. In the base case ($70-75 Brent), production growth from the Uaru FPSO coming online in 2026 and continued Permian ramp support EPS of an estimated $8-9.50, and with a 14x multiple the stock sits near an estimated $128 - roughly $9.50 below today’s entry price of $137.54. Including the $4.12 annual dividend, the 1-year total return in the base case is approximately negative 4 percent. That is not a reason to sell; the Hold reflects a 3-to-5-year production-growth and dividend-compounding thesis, not a near-term price re-rating. Investors who need a 12-month payoff from this stock at this entry price are holding the wrong instrument. In the bear case ($62-65 Brent), EPS compresses toward an estimated $5.75-6.00, and at 13-14x the stock slides toward an estimated $92 - though the dividend at roughly $4.30 per year provides an income floor. In the bull case ($80-88 Brent), EPS could approach an estimated $11-13.50, and at 14.5x the stock reaches an estimated $162. The single most important observable is Iranian crude output.
3 years. By approximately June 2029, structural production growth starts to show clearly. Permian will be approaching 2.3-2.5 million boed, Guyana’s Whiptail FPSO (targeted 2027) will have added another roughly 113,000 boed net, and Golden Pass LNG Trains 1-3 will be fully operational. Chemical Products may be recovering from its multi-year trough. In the base case ($72-78 Brent), management’s 2030 production targets are substantially on track and the stock reaches an estimated $144. In the bull case ($83-90 Brent), all growth pillars are firing and Chemical Products is recovering, supporting an estimated $198. In the bear case ($60-65 Brent), production growth partially offsets sustained low prices and the stock sits near an estimated $90 - where the dividend yield would be around 5 percent, providing a practical income floor for long-term holders. The thing most likely to break the 3-year base case is an OPEC+ fracture delivering a sustained sub-$65 Brent environment through 2027-2029.
5 years. By approximately June 2031, the question is whether ExxonMobil’s 2030 corporate plan delivered what it promised: 5.5 million boed production, return on capital employed above 17 percent, and Chemical Products near mid-cycle. In the base case ($70-75 Brent with Chemical Products partial recovery), EPS could reach an estimated $10.50-12.50 and with a 13.5x multiple the stock reaches an estimated $155 - total return including roughly $4.50-plus per year in dividends (growing toward roughly 4 percent per year). In the bull case ($85-92 Brent, full plan execution), EPS reaches an estimated $14-17 and the stock reaches an estimated $215. In the bear case ($55-62 Brent sustained), production growth partially offsets price compression, and with EPS of an estimated $7-8.50 and an 11x multiple the stock sits near an estimated $90 - but the dividend, covered to approximately $40-45 Brent by company guidance, provides a roughly 5 percent income yield at that level. The bear 3-year and 5-year scenarios converge near $90 because volume growth offsets further price erosion once production has ramped.
Where the read lands today. At $137.54 and a yield of roughly 3 percent, I’d call ExxonMobil a Hold for income-and-total-return investors with a 3-to-5-year horizon. The production growth story is real and visible. But the current price reflects a Brent scenario that requires crude to hold near $72-75 through 2027, a level the IEA’s modeled supply surplus and JPMorgan’s $64 base case put at credible risk. This is an income compounder, not a growth stock. It rewards patience when oil cooperates and punishes it when the cycle turns.
Companion tool
Jump to the interactive dashboard to sort and filter every company in this piece, or download the Excel scoring model to flex the scenarios yourself.
TL;DR
ExxonMobil sits at the intersection of two growth engines that no other supermajor can match simultaneously. In the Permian Basin, the May 2024 Pioneer acquisition gave XOM the largest contiguous acreage position in the basin at a cost-of-supply below $35 per barrel. Off the coast of Guyana, it operates the Stabroek Block at a royalty of only 2 percent - versus a 60-80 percent government take that is normal for deepwater globally - turning those barrels into the most profitable offshore production in the company’s portfolio at roughly $40 per barrel of implied net earnings at $69 Brent (a derived estimate from press-reported figures, not a primary company disclosure). Production hit a company record of 4.736 million barrels of oil equivalent per day in FY2025, and the 2030 corporate plan targets 5.5 million boed with a stated surplus of roughly $145 billion in cash at $65 real Brent. The capital return program returned $37.2 billion in FY2025 - $17.2 billion in dividends and $20 billion in buybacks - against free cash flow of $26.1 billion; operating cash flow of $52 billion fully covered all distributions. The 43-year consecutive dividend growth streak is one of the strongest records in US equities. The tension is real and two-sided. Earnings fell from a peak of $55.7 billion in FY2022 to $28.8 billion in FY2025 as Brent declined, and the IEA’s June 2026 Oil Market Report models a potential 5 million barrel per day supply surplus in 2027 that banks like JPMorgan think could push Brent to $64 (estimate). The current EV/EBITDA - enterprise value (market cap plus net debt) over earnings before interest, taxes, depreciation and amortization, the standard valuation multiple for oil companies because it strips out distortions from different debt levels and depreciation policies across peers - of roughly 10.5x sits approximately 36 percent above the 10-year historical median of about 7.83x (per GuruFocus, single source, directional). Chemical Products earned only $0.8 billion in FY2025 - versus $7.0 billion at the 2021 peak - and industry analysts at ICIS and Wood Mackenzie do not see ethylene markets recovering before 2028-2029 (per search-result summaries, paywalled sources, confirm directional). The $20 billion buyback requires roughly $60-65 Brent to be self-funded; below that, the balance sheet absorbs the gap. On balance, the lean is Hold.
Explore it yourself: the interactive dashboard
Open the dashboard in a full screen
What ExxonMobil actually is: the 90-second primer
ExxonMobil is an integrated energy company, which means it participates at every stage of the hydrocarbon supply chain from finding oil in the ground to selling finished products at the pump and to industrial buyers. That integration is what distinguishes it from a pure upstream exploration company like ConocoPhillips (which only finds and produces) or a pure refiner like Valero (which only processes crude into fuels).
Think of it like a large food conglomerate that farms its own ingredients, runs its own processing plants, and sells finished products under its own brand. The farm is volatile - prices for raw ingredients swing wildly with weather and supply. But the processing and branding add margin stability that a simple farmer does not have. When commodity prices fall, the processing plants benefit from lower input costs, partially offsetting what the farm loses.
XOM reports four operating segments. Upstream earns money finding, drilling, and producing crude oil, natural gas, and liquids - it contributed $21.4 billion of earnings in FY2025, or about 74 percent of total segment earnings. Energy Products is the refining and fuels business: 21 refineries running roughly 4 million barrels per day, generating $7.4 billion. Chemical Products makes ethylene, polyethylene, and aromatics for industrial buyers - it earned only $0.8 billion in FY2025 because global oversupply has compressed margins to a decade low. Specialty Products makes premium synthetic lubricants and basestocks under the Mobil 1 brand and earned $2.9 billion, staying in a $2.4-3.3 billion range across every year from 2021 through 2025 regardless of where crude went.
The scale is significant. Total production of 4.736 million barrels of oil equivalent per day in FY2025 was the highest in over 40 years. The Pioneer acquisition, which closed in May 2024 at an announcement-date equity value of $59.5 billion (the actual closing value was approximately $63 billion in share fair-value plus roughly $5 billion in assumed debt, approximately $68 billion enterprise value at close), doubled the Permian footprint and added roughly 1.4 million net acres in the Midland and Delaware sub-basins. Guyana is operated at a 45 percent working interest with Chevron (formerly Hess, 30 percent) and CNOOC (25 percent), and that block reached 900,000 gross barrels per day in early 2026 on its way toward 1.7 million barrels per day of installed capacity by the end of the decade. These two positions - Pioneer-enhanced Permian and Guyana Stabroek - are the growth engines that separate XOM’s production trajectory from every other supermajor through 2030.
How money flows through an integrated oil major
flowchart TD
    DEMAND["Global hydrocarbon end demand<br/>XOM $332B revenues; $28.8B net income FY2025"]

    FUELB["Transport and industrial fuel buyers<br/>21k+ Exxon/Mobil/Esso stations; fleet, aviation, marine"]
    CHEMB["Petrochemical product buyers<br/>PE, PP, aromatics; packaging, autos, construction"]
    LUBB["Premium lubricant buyers<br/>Mobil 1 auto; OEM fill; industrial MRO"]
    LNGB["LNG buyers<br/>Asian utilities; European spot and long-term contracts"]

    EP["ENERGY PRODUCTS - $7.4B FY2025<br/>21 refineries; 3,979 kbd; integration hedge vs crude"]
    CP["CHEMICAL PRODUCTS - $0.8B FY2025 trough<br/>US ethane crackers; Huizhou naphtha cracker"]
    SPP["SPECIALTY PRODUCTS - $2.9B FY2025<br/>Mobil 1 plus basestocks; stable $2.4-3.3B across cycle"]
    LNGE["UPSTREAM LNG EQUITY<br/>PNG 33.2% op; Golden Pass 30%; Rovuma 25% pre-FID"]

    UPST["UPSTREAM CRUDE AND GAS - $21.4B FY2025<br/>74% of segment earnings; $700M per $1 per bbl Brent"]

    PERM["Permian Basin - 1.7M boed Q1 2026<br/>~36 active rigs; largest US acreage; Pioneer $4B synergy target"]
    GUY["Guyana Stabroek - 900k+ bopd gross<br/>XOM 45% op; CVX 30%; CNOOC 25%; 2% royalty PSA"]
    INTL["GOM plus Canada plus Bass Strait<br/>Legacy production; mature asset base"]
    PNGL["PNG LNG - 8.6 MT shipped FY2025<br/>XOM 33.2% operator; Santos 39.9%"]
    GPL["Golden Pass LNG - 18.1 mtpa cap<br/>XOM 30%; QatarEnergy 70%; Train 1 live Apr 2026"]

    PIPE["Wink-to-Webster Pipeline JV - 1.5M bpd<br/>Chokepoint: ~93% utilized May 2025; XOM operator"]
    FPSO["FPSO contractors - SBM Offshore plus MODEC<br/>Toll-taker: only 2 global builders at scale; 5-6yr lead"]
    OFS["Oilfield services - SLB, Halliburton, Baker Hughes<br/>~36 XOM Permian rigs; BKR Guyana FPSO chemicals"]
    STEEL["OCTG plus steel inputs<br/>Section 232 tariff exposure on imported pipe"]

    DEMAND --> FUELB
    DEMAND --> CHEMB
    DEMAND --> LUBB
    DEMAND --> LNGB

    FUELB --> EP
    CHEMB --> CP
    LUBB --> SPP
    LNGB --> LNGE

    EP --> UPST
    CP --> UPST
    SPP --> UPST
    LNGE --> PNGL
    LNGE --> GPL

    UPST --> PERM
    UPST --> GUY
    UPST --> INTL

    PERM --> PIPE
    PERM --> OFS
    PERM --> STEEL
    GUY --> FPSO
    GUY --> OFS
    FPSO --> OFS
The chart above traces where cash originates and where it flows. Notice three things. First, every dollar of oil-price movement hits the Upstream box first and hardest - roughly $700 million per $1 per barrel in after-tax upstream earnings, per the 2025 Annual Report to Shareholders, the primary source. Second, a crude price decline partially helps Energy Products by cutting feedstock costs, so the two largest boxes work in opposite directions. Third, Chemical Products and Specialty Products each have their own demand streams that are only loosely connected to crude - chemicals track industrial production and capacity utilization, while Specialty Products tracks engine-oil change cycles. The integration is not a full hedge; a $20 per barrel move in Brent still moves XOM’s blended earnings by roughly $8 billion (estimate, derived from the $410 million per dollar net integrated sensitivity - an editorial calculation from FY2025 data, not a company-disclosed figure). But it is a genuine partial hedge that pure-play producers cannot match.
The four segments: where earnings actually come from
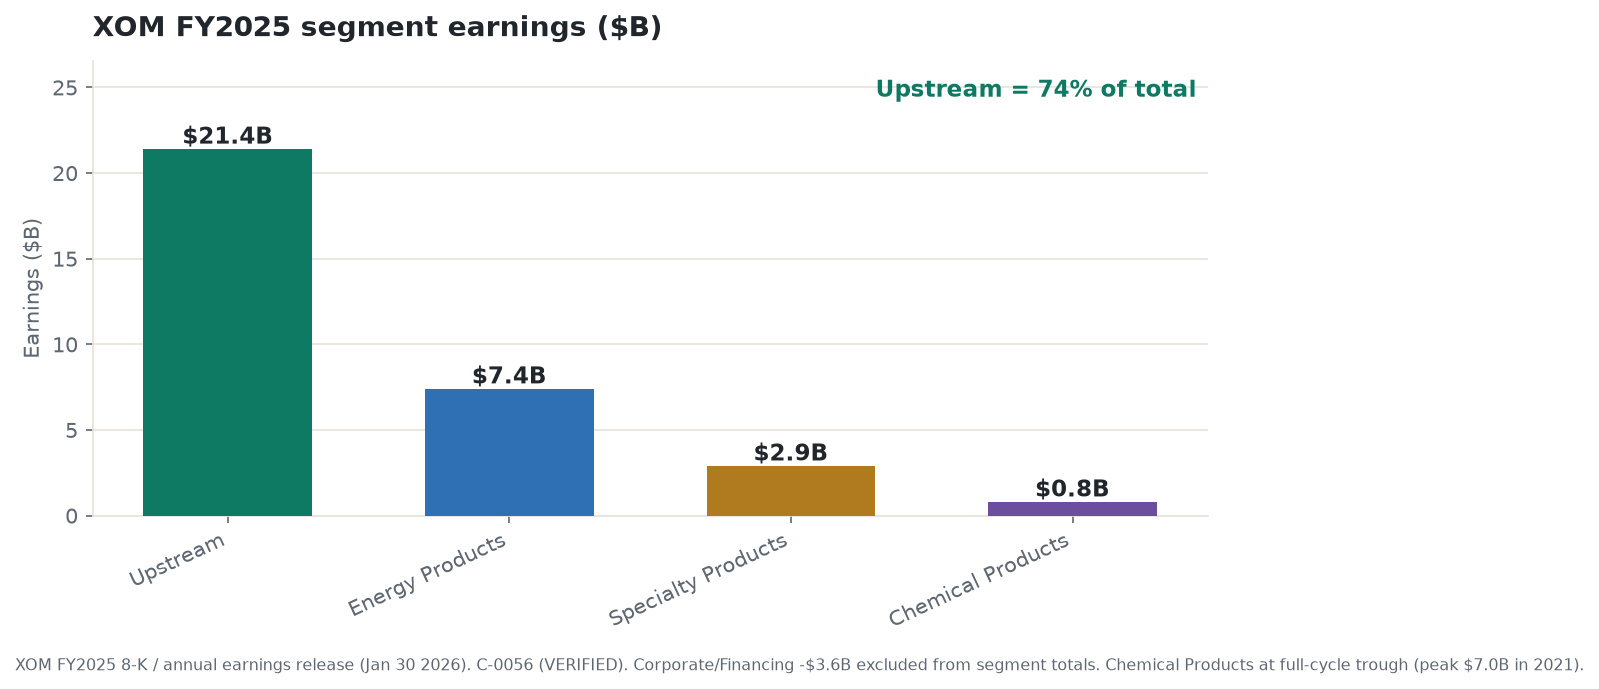
Upstream - $21.4 billion in FY2025, down from $25.4 billion in FY2024. The decline reflects lower crude realizations: Brent averaged $69.06 per barrel in 2025 versus $80.76 in 2024. Volume growth from Pioneer-boosted Permian production and the Guyana ramp partially offset the price headwind. US upstream earned $5.1 billion; non-US (dominated by Guyana and legacy international positions) earned $16.3 billion. The non-US skew reflects Guyana’s exceptional per-barrel economics, which I cover in the next section.
Energy Products - $7.4 billion in FY2025, up sharply from $4.0 billion in FY2024. This is the refining and fuels business running 21 refineries at record throughput of 3,979 thousand barrels per day, the highest on a same-site basis since the Exxon-Mobil merger. Refining margins typically improve when crude falls - the integration hedge at work. Q4 2025 alone contributed $3.4 billion as crack spreads - the margin between the cost of a barrel of crude oil and the market value of the refined products (mainly gasoline and diesel) that barrel yields - surged on Middle East supply disruptions. Q1 2026 showed the volatility of this segment acutely: a $3.33 billion adverse mark-to-market timing effect from Middle East hedge disruptions produced a reported GAAP loss of $1.3 billion, even though the underlying refining economics were solid, with adjusted earnings around $2.8 billion.
Chemical Products - $0.8 billion in FY2025, down from $2.6 billion in 2024 and from $7.0 billion at the 2021 peak. This is a full-cycle trough caused by a global ethylene glut. Between 2020 and 2025, global ethylene capacity expanded roughly 40 million tonnes while demand grew only about 27 million tonnes - roughly 70 percent of the capacity additions coming from state-directed Chinese buildout. XOM’s US-based ethane crackers in Baytown and Beaumont Texas have a feedstock cost advantage over naphtha-fed crackers in Europe and Asia, but that advantage has not been enough to offset the operating-rate collapse. Q1 2026 earned only $110 million. ICIS and Wood Mackenzie - the two principal industry forecasters - place the recovery at 2028-2029 at the earliest (per search-result summaries of their analyses; full reports are paywalled and were not accessed directly). Mid-cycle earnings could approach $3-5 billion (an editorial inference from management’s statement that FY2022’s $3.5 billion was “above the 10-year average”; XOM has never stated a specific mid-cycle dollar target).
Specialty Products - $2.9 billion in FY2025, down only slightly from $3.1 billion in 2024. This segment - Mobil 1 synthetic motor oil, premium lubricant basestocks, waxes, and related products - is XOM’s most cycle-stable business. Across the entire 2021-2025 commodity cycle, it held within a $2.4-3.3 billion band while Chemical Products fell 89 percent from peak and Energy Products swung from $15 billion in 2022 to $4 billion in 2024 and back to $7.4 billion. The stability comes from branded pricing and proprietary basestock technology: the EHC Group II/III basestock grades command specification-based premiums from automakers and industrial buyers who buy on performance, not spot price. The new Singapore Resid Upgrade, which started production in Q2 2025, converts 20,000 barrels per day of low-value residual fuel oil into Group II basestocks - expanding supply for Asia-Pacific markets.
The return on capital employed in FY2025 was 9.3 percent, down from 12.7 percent in FY2024 and 15.0 percent in FY2023. Analysts estimate XOM’s weighted average cost of capital at roughly 8-9 percent (range from four independent sources: Alpha Spread, GuruFocus, Finbox, and valueinvesting.io; none is a company disclosure). The ROCE-WACC spread in FY2025 was close to zero by that reckoning - barely covering the cost of capital in a trough year. The 2030 corporate plan targets ROCE above 17 percent, which would represent clear value creation. Getting there requires the production ramp, Chemical Products recovery, and cost savings all working simultaneously.
The Permian growth engine: Pioneer and what comes next
The Pioneer acquisition made ExxonMobil the largest operator in the Permian Basin by a wide margin. At the announcement date in October 2023, the all-stock deal was valued at $59.5 billion in equity. At close in May 2024, the share fair-value had moved to approximately $63 billion, with XOM also assuming roughly $5 billion in Pioneer debt, putting the total enterprise value near $68 billion. The acquisition added roughly 660,000 barrels of oil equivalent per day of production on day one, roughly 1.4 million net acres across the Midland and Delaware sub-basins, and 16 billion barrels of oil equivalent in estimated resource.
Permian production in Q1 2026 hit 1.7 million boed, up 17 percent year-over-year. XOM has identified a clear path to 2.5 million boed by 2030. The stated cost of supply for Pioneer assets is below $35 per barrel, making these among the most economic oil barrels in North America. For comparison, the Dallas Fed’s industry-wide new-well breakeven in the Permian ranges from $63 to $69 per barrel - but that is an industry average across all operators, not XOM’s actual per-barrel lifting cost, which benefits from the scale, cube development, and proprietary technology that XOM brings.
The synergy targets tell the integration story clearly. At announcement in October 2023, XOM guided $2 billion per year in run-rate synergies. By December 2024 that had risen to $3 billion plus. The December 2025 corporate plan doubled the original target to $4 billion per year, with categories spanning higher resource recovery, lower development costs, and lower operating costs. FY2025 realized cumulative synergies of $2 billion, hitting the original annual target ahead of schedule.
One genuine constraint: shale wells decline fast. Permian wells typically lose 65-85 percent of their peak production in the first year (per IHS and SPE industry data, not XOM-specific figures). A 1.6 million boed Permian base requires roughly 1,000 or more well completions per year just to hold flat, not grow. This is sometimes called the treadmill problem - XOM is running hard just to stay in place, and running faster to grow. Roughly 50-70 percent of upstream capex (industry norm for unconventional) is sustaining rather than growth capital. XOM mitigates this through cube development (drilling multiple formations from a single pad to reduce surface costs), lateral extensions, and its proprietary petcoke proppant technology that management says delivers around 20 percent more oil per well and is being deployed to 50 percent of wells in 2026. The treadmill runs cheaper every year, but it never stops.
The pipeline infrastructure is approaching a constraint. The Wink-to-Webster Pipeline JV, which XOM operates in partnership with Plains All American, MPLX, Delek US, Lotus Midstream, and Rattler Midstream, carries crude from the Permian to the Gulf Coast at 1.5 million barrels per day design capacity. As of May 2025 it was running at roughly 93 percent utilization. Getting from 1.7 million boed today to 2.5 million by 2030 will require additional takeaway capacity, and no announcement of a parallel system has been confirmed publicly.
A regulatory note from the Pioneer deal: the FTC raised concerns that Scott Sheffield, Pioneer’s former CEO, had allegedly communicated with OPEC officials about production levels in a way that could raise antitrust concerns around market coordination. The allegation was that Sheffield informally exchanged information with Saudi Aramco officials about Permian production plans - communications the FTC described as potentially in tension with US antitrust law, though no charges were filed against Sheffield or any other individual. Sheffield was ultimately excluded from XOM’s board as a condition of the FTC’s approval of the acquisition. XOM was not alleged to have participated in or known about any such contacts, and no finding of wrongdoing against XOM has been made. The Permian production integration has proceeded without restriction from the FTC outcome.
Guyana: the offshore growth engine
The Stabroek Block - 6.6 million acres offshore Guyana - holds an estimated 11 billion barrels of recoverable resource across 30-plus discoveries and is, by almost any measure, one of the most valuable oil positions discovered in the 21st century. XOM operates it at a 45 percent working interest with Chevron at 30 percent (acquired through the Hess transaction, which I discuss below) and CNOOC at 25 percent.
Four floating production, storage, and offloading vessels are producing today. Liza Phase 1 (Liza Destiny FPSO, nameplate 120,000 bopd, first oil December 2019), Liza Phase 2 (Liza Unity, 220,000 bopd, February 2022), Payara (Prosperity, 220,000 bopd, November 2023), and Yellowtail (ONE GUYANA, 250,000 bopd) - which reached first oil in August 2025, four months ahead of schedule and the fastest ramp to full capacity of any Guyana FPSO. Combined, these four vessels can produce over 900,000 barrels per day, and Q1 2026 gross production hit 900,000 barrels per day, a company record.
Three more FPSOs are sanctioned. Uaru (5th project, Errea Wittu FPSO from MODEC, 250,000 bopd, FID April 2023, first oil targeted 2026). Whiptail (6th project, Jaguar FPSO from SBM Offshore, 250,000 bopd, FID April 2024, targeted 2027). Hammerhead (7th project, MODEC EPCI contract awarded September 2025, $6.8 billion investment, 150,000 bopd, first oil 2029). An 8th project is in discussion with the Guyanese government. At 1.7 million barrels per day of installed capacity by the end of the decade, XOM’s net share at 45 percent would be roughly 765,000 bopd - more net barrels from one block than most national oil companies produce in their entirety.
Why Guyana earns so much per barrel. The 2016 Stabroek Production Sharing Agreement is the key. The royalty rate is 2 percent of gross oil produced - compared with 12.5-18.75 percent in the US Gulf of Mexico and 60-80 percent effective government take in most global deepwater agreements. After the royalty, up to 75 percent of monthly production can be applied to cost recovery. The remaining profit oil is split 50/50 with the government and the national oil company. Under Article 15.4, the Government of Guyana pays the contractors’ income taxes from its own profit-oil share, meaning XOM writes no check for Guyanese corporate tax. The effective government take works out to roughly 14.5 percent of gross revenues. Development costs of roughly $7.9 per barrel (per Rystad Energy analysis) compare with a global deepwater FPSO average of $13 per barrel.
In FY2025, press-reported figures (from Motley Fool and Energy News Beat, not a primary XOM filing - XOM does not separately disclose Guyana earnings) attribute approximately $4.67 billion in profit to XOM’s Guyana stake. Dividing that by XOM’s approximate net production share (roughly 115 million barrels at 45 percent of 700,000-plus gross average) implies a derived estimate of roughly $40.6 per barrel of net earnings to XOM at $69 average Brent. That is an editorial calculation from press-tier figures - I flag it as an estimate, not a company-verified number. But even directionally, Guyana earns something like three times XOM’s blended upstream average per barrel.
Rystad Energy’s analysis attributed an internal rate of return of approximately 44 percent and a 2.4-times capital return to the Liza Phase 1 project - extraordinary by any measure for deepwater oil production, and the clearest single illustration of why Guyana commands a different per-barrel story than any other XOM asset. The per-project all-in breakevens are $25-35 per barrel (per Rystad and S&P Global analyst data), with Liza Phase 2 around $25 per barrel, Payara around $32 per barrel, and Yellowtail around $29 per barrel. The country-level average breakeven is around $36 per barrel per S&P Global Commodity Insights and the International Energy Forum’s 2024 estimates. For comparison, Brazil’s pre-salt average is roughly $40 per barrel and the US Gulf of Mexico is higher still.
The Chevron-Hess arbitration is resolved. XOM claimed a right of first refusal over Hess Corporation’s 30 percent Stabroek stake under the joint operating agreement, triggered by Chevron’s $53 billion acquisition of Hess. The ICC tribunal ruled in July 2025 that the right of first refusal applied to direct asset sales, not whole-company corporate acquisitions. Chevron completed the Hess acquisition on approximately July 18, 2025. The new Stabroek ownership is XOM 45 percent (operator), Chevron 30 percent, CNOOC 25 percent. XOM retained full operatorship and its 45 percent economic interest - the outcome that matters most for development pace and economics. Chevron replacing Hess is arguably neutral to slightly positive: Chevron is a larger company with more balance-sheet capacity to co-fund the Uaru through Hammerhead development sequence.
The political risk. The 2016 Stabroek PSA terms are extraordinarily contractor-favorable, and Guyana’s government knows it. Kaieteur News reported that the government waived approximately $525 million in taxes for XOM in 2025 under Article 15.4 - a figure that is politically difficult to sustain in a young oil-producing nation. New Guyana PSAs for future blocks already carry a 10 percent royalty versus the Stabroek 2 percent, signaling the market rate has already moved. President Ali stated in May 2026 that the government is “not changing the terms” of XOM’s contract and that “the sanctity of contract is important.” That statement is recent and explicit. But the asymmetry is real: XOM has everything to gain from the current terms; each year Guyana produces at these levels, domestic political pressure for better terms builds. A contract renegotiation would be subject to international arbitration under UNCITRAL rules - a process that tends to favor contract terms over unilateral government action - but production could be disrupted pending resolution. I present this as a political-risk scenario, not a near-term base case.
The FPSO supply chain bottleneck. Only two companies in the world can build and operate 250,000 barrel per day deepwater FPSOs at the complexity and speed XOM requires: SBM Offshore and MODEC. Building an FPSO at this scale demands specialized floating-hull naval engineering, deepwater mooring expertise, subsea processing systems capable of handling produced water and gas at reservoir pressure, and the yard capacity to manage a $2-4 billion shipbuilding project while maintaining the multi-decade safety track record that regulators require before granting installation permits. Hull engineering complexity, finite fabrication yard capacity, and a barrier defined by twenty-plus years of successive multi-billion dollar projects have kept the credible market to these two players. Baker Hughes holds a multi-year specialty chemicals contract for both the Uaru and Whiptail FPSOs. Any contractor delay - as XOM experienced with Zachry Holdings’ Chapter 11 filing on the Golden Pass LNG project - directly defers production by years. Building a new FPSO takes 5-6 years from FID. The Guyana growth timeline is therefore hostage to a two-firm supply chain.
Downstream and chemicals: the counter-cyclical ballast
Refining as a hedge. The way refining interacts with crude oil prices is the opposite of upstream. When crude falls, upstream earnings compress, but refinery feedstock costs also fall - and since refined product prices fall more slowly than crude, the margin between crude input and finished fuel output widens. In FY2025, Brent fell roughly $11.70 per barrel year-over-year, reducing upstream earnings by $4.0 billion while Energy Products earnings rose $3.4 billion. The net change to combined Upstream plus Energy Products was roughly $0.6 billion. A pure-play upstream company would have lost something like $8.2 billion on the same crude-price move, using the $700 million per dollar upstream sensitivity.
XOM’s refining position is not just large - it is deeply integrated. Roughly 80 percent of its 21 refineries with roughly 4.34 million barrels per day of distillation capacity are integrated with chemical or lubricant basestock production. That means a molecule entering the Beaumont or Baton Rouge complex can be routed to its highest-value outlet at any given moment - gasoline, diesel, ethylene feedstock, lubricant basestock - in real time. Pure-play refiners like Marathon Petroleum or Valero cannot do this. Beaumont at 609,000 barrels per day (expanded in a $2 billion project completed March 2023, the largest US refinery expansion since 2012) is integrated with 816,000 tonnes per year of ethylene cracking. Singapore hosts the world’s only steam cracker capable of processing crude oil directly.
PNG LNG and Rovuma: the other two legs. The oldest and largest of XOM’s LNG positions is PNG LNG in Papua New Guinea, where XOM is the operator at 33.2 percent (Santos 39.9 percent), and gas piped 700 kilometers from remote Hela Province highlands is liquefied at the Caution Bay terminal and shipped primarily to Japanese and Chinese utilities. PNG LNG shipped 8.6 million tonnes in FY2025, producing steady cash flow with no material new capital requirement - the longest-running fully operational LNG asset in XOM’s portfolio. A third LNG option is taking shape in Mozambique: XOM holds a 25 percent indirect interest in Area 4 of the Rovuma basin through its stake in Mozambique Rovuma Venture. Force majeure - suspended after insurgent attacks in Cabo Delgado Province in 2021 - was lifted in 2025 as the security environment improved. An FID is targeted for 2026, with first LNG not before 2030. Country risk is the highest of any XOM asset; this is optionality, not a near-term earnings story, but the 2026 FID decision is a genuine near-term catalyst to watch.
Golden Pass LNG. XOM owns 30.33 percent of the Golden Pass LNG facility at Sabine Pass, Texas, with QatarEnergy holding 70 percent. Total authorized capacity is 18.1 million tonnes per year across three trains. Train 1 produced its first LNG on March 30, 2026, and shipped its first export cargo on April 22, 2026 - making it the 9th US LNG export terminal and adding roughly 5 percent to US LNG export capacity. Train 2 is expected mechanically complete in fall 2026; Train 3 in Q1-Q2 2027. The project was significantly delayed from its original 2024 schedule after lead EPC contractor Zachry Holdings filed Chapter 11 in May 2024 with cost overruns exceeding $2.4 billion. McDermott and Chiyoda completed the work.
XOM has not separately disclosed the annual run-rate earnings contribution from Golden Pass at full capacity, so I cannot state a specific dollar figure without inventing one. Management has cited Golden Pass as part of its “advantaged LNG assets” in the 2030 corporate plan alongside Permian and Guyana. The strategic timing worked out: Train 1 came online during the Middle East disruption that lifted LNG spot prices sharply.
Chemical Products: the long trough. The core problem is simple arithmetic. Between 2020 and 2025, the global ethylene industry built roughly 40 million tonnes of new capacity while demand grew only about 27 million tonnes. Roughly 70 percent of those additions came from state-directed Chinese construction. Average global operating rates fell from above 90 percent pre-2019 to roughly 80 percent in 2025 - the level at which pricing power disappears. XOM’s US ethane crackers in Baytown and Beaumont have a structural cost advantage because US ethane prices are largely decoupled from crude oil; when crude rises, European naphtha-cracker margins get squeezed and XOM’s ethane-cracker economics widen relative to peers. But this feedstock advantage has been insufficient to offset the operating-rate collapse.
Wood Mackenzie estimates that roughly 24 percent of global ethylene capacity - around 55 million tonnes - faces closure risk (per their publicly accessible press release). If that capacity exits, plus demand grows, operating rates could recover toward 85-plus percent. ICIS places the recovery at 2028-2029 at the earliest. This is not a 2026 or 2027 earnings story. The $6.2 billion gap between the 2021 peak and FY2025 trough in Chemical Products represents latent earnings power that the market does not price today - but will not recover on schedule.
XOM’s Huizhou, China chemical complex (Phase 1 operational July 2025, $10 billion investment, 1.6 million tonnes per year of ethylene) uses naphtha and LPG feedstock - it does not share the ethane advantage. It was built for China market access, not cost leadership.
Specialty Products: the quiet cash engine. Mobil 1 is the world’s best-selling synthetic motor oil. The Specialty Products segment’s operating margin of roughly 16-17 percent (derived from $17.3 billion in FY2025 revenue against $2.9 billion in earnings) exceeds Energy Products by a wide margin and is far more stable. The segment held within a $2.4-3.3 billion earnings band across the entire 2021-2025 period. XOM’s proprietary EHC Group II and III basestock grades - produced using a hydrocracking technology process XOM developed - command specification-based pricing from automakers and industrial buyers who purchase on performance criteria, not commodity spot price. The main long-term risk here is the gradual electrification of the passenger vehicle fleet: EVs require no engine oil changes. That is a multi-decade headwind, not a near-term one. For a five-year horizon, Specialty Products is the most durable earnings stream in the portfolio.
Capital allocation: dividend aristocrat, buybacks, and the 2030 plan
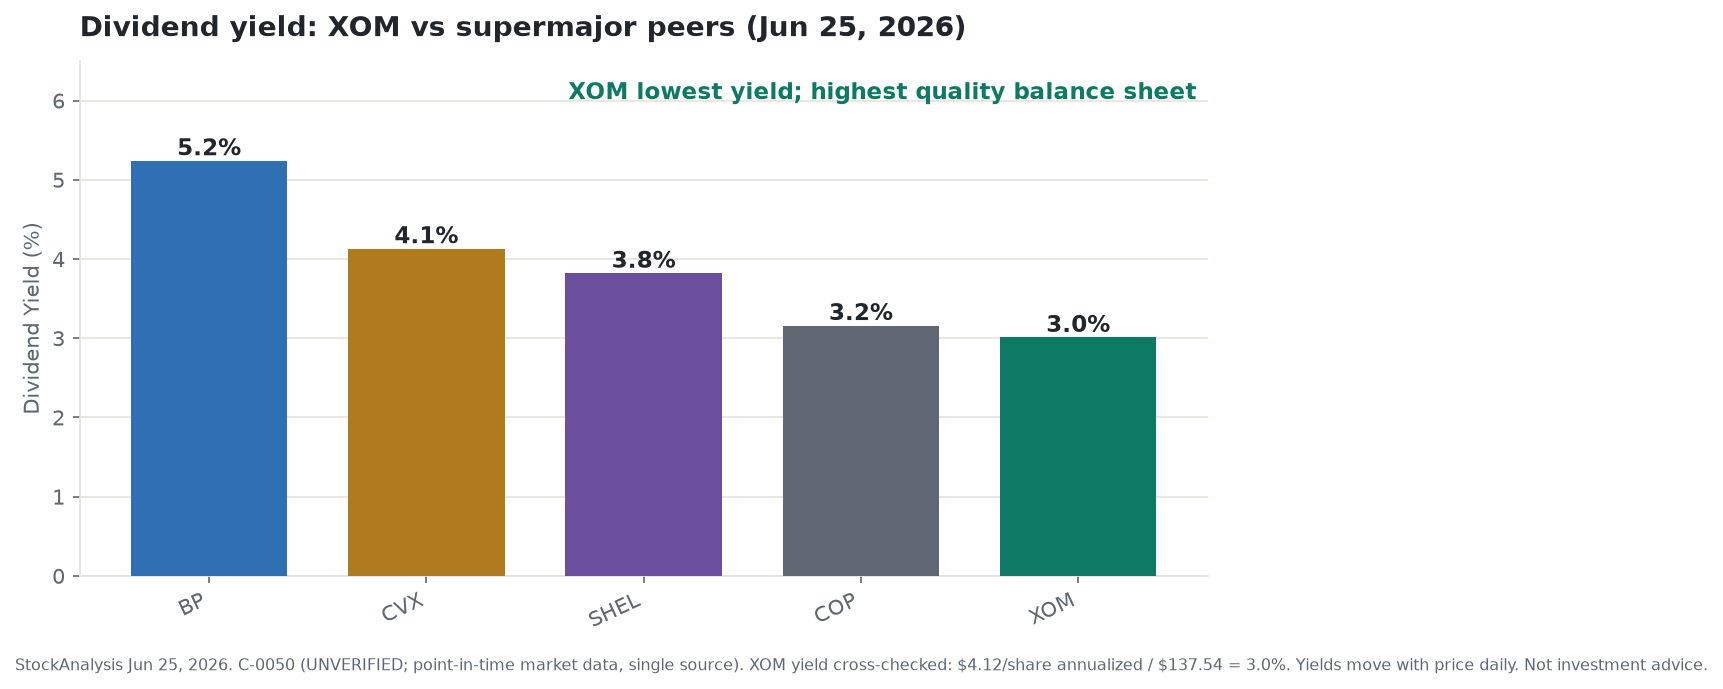
The dividend record. XOM has raised its annual dividend in each of the past 43 consecutive years - qualifying it as both a Dividend Aristocrat (an S&P 500 designation for companies with at least 25 consecutive annual dividend increases) and placing it on track for Dividend King status, the 50-year threshold, in the early 2030s. (Different sources cite 42-44 consecutive years depending on counting convention; the Aristocrat qualification is not in dispute.) The current annual rate is $4.12 per share, at $1.03 per quarter - a rate confirmed for Q2 2026. That annualizes to a yield of roughly 3.0 percent at the research-date price of $137.54. That yield is below CVX at 4.13 percent, SHEL at 3.82 percent, and BP at 5.24 percent; the growth streak, not the current payout, is the argument for paying an XOM premium over peers. The dividend has grown at roughly a 3.4 percent five-year CAGR from the 2021 annualized rate.
The historical record through oil downturns is the important fact here. XOM covered its dividend at sub-$50 Brent in 2020 without cutting - a stress test no European major passed. In April 2020, US crude (WTI) briefly went negative intraday; XOM still covered its dividend. That was possible because of structural cost reductions that had been building for years.
Three different Brent thresholds matter, and it is worth separating them clearly. The dividend breakeven - the price at which free cash flow from sustaining capex and dividend (no growth spending, no buybacks) is fully covered - is targeted at roughly $35 per barrel by 2027 and $30 per barrel by 2030, per analyst sources citing management commentary. The actual 2020 precedent suggests the effective threshold is closer to $40-45 per barrel at XOM’s current cost structure, which management has cited as the practical floor. These two numbers apply only to the dividend; they are not the full-program planning price. The $65 per barrel corporate planning price is a different number entirely: that is the level at which the complete capital return program - dividends plus the $20 billion buyback plus growth capex - is entirely self-funded from operating cash flow with surplus to spare. XOM plans at $65 because a company committing to a $20 billion annual buyback has to know whether that program is sustainable or balance-sheet-funded. Below $60 Brent, buybacks slow or pause. Below $45, capex is reviewed. The dividend only comes under real pressure approaching $30-35 per barrel by 2030 under the plan. A reader tracking dividend safety should watch the $40-45 threshold. A reader tracking buyback sustainability should watch the $60-65 threshold. They are not the same number.
XOM’s stated $145 billion in cumulative surplus cash through 2030 at $65 real Brent provides the plan’s buffer above those thresholds. The dividend is not guaranteed, and no historical data guarantees its continuation.
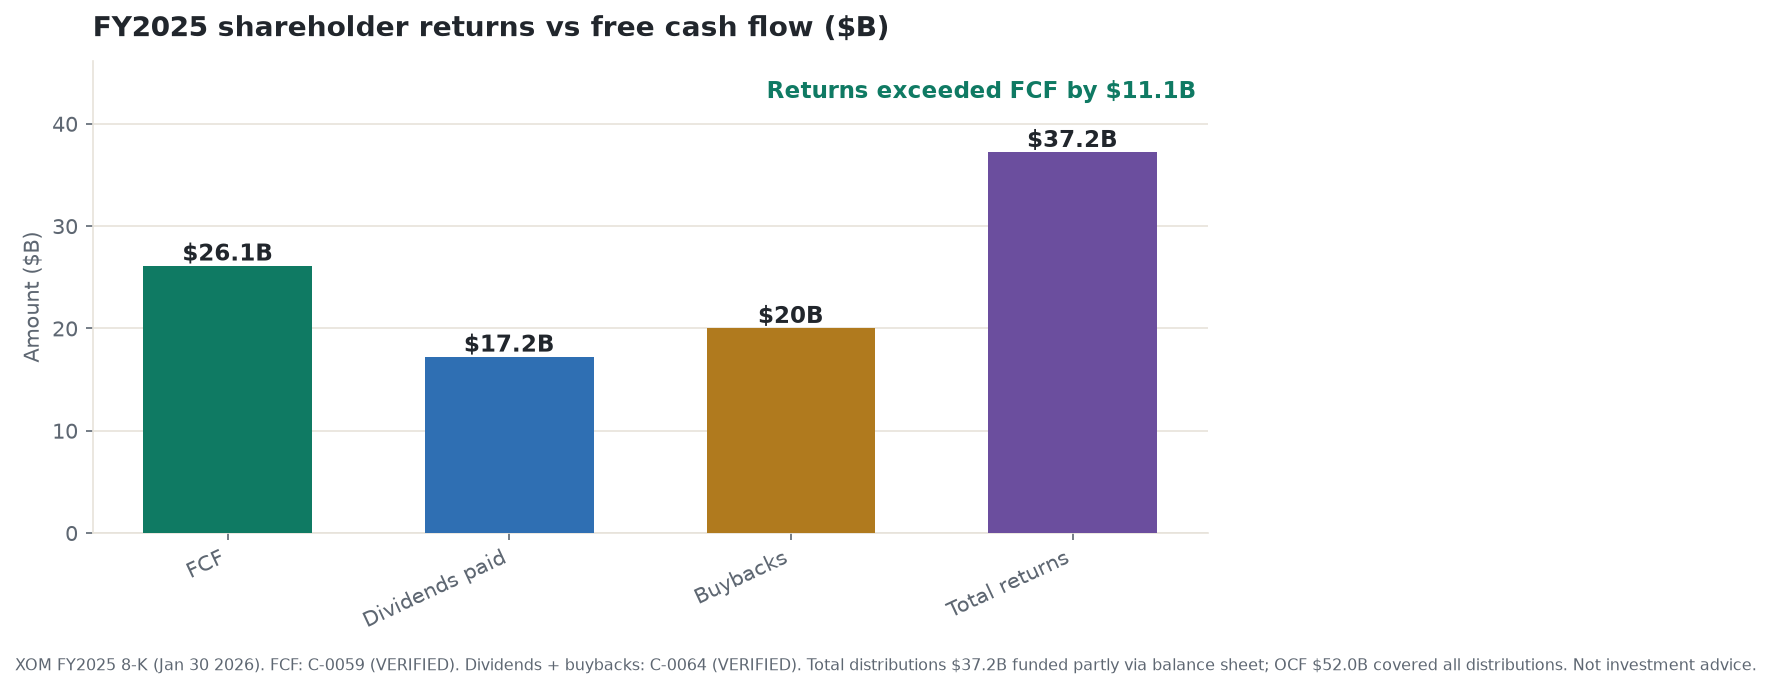
Buyback program. XOM completed $20.0 billion in share repurchases in FY2025, reducing the diluted share count by approximately 108 million shares (roughly 2.4 percent year-over-year). The 2026 commitment is another $20 billion, “assuming reasonable market conditions” - the conditionality is in the company’s own language and the article honors it. Q1 2026 was on pace at $4.9 billion. At $20 billion per year against a market cap of roughly $574.7 billion as of the research date (4,179 million shares at $137.54), the buyback yields roughly 3.5 percent in annual share count reduction - a meaningful per-share earnings tailwind.
The buyback sustainability question is the most important capital-allocation tension in the XOM story. In FY2025, total shareholder distributions of $37.2 billion exceeded free cash flow of $26.1 billion by $11.1 billion. Operating cash flow of $52.0 billion fully covered all distributions with $14.8 billion to spare - so no debt was required to fund the return program in a cash-flow sense. The FCF gap reflects capital expenditure of $29.0 billion sitting between operating cash flow and free cash flow. At $65 Brent (XOM’s own planning price), the 2030 corporate plan projects roughly $145 billion in cumulative surplus cash through 2030 - approximately $29 billion per year - which management says is sufficient to sustain returns. Below $60 Brent, buybacks would slow or pause. Below $45 Brent, based on management’s own breakeven language, the dividend remains covered but buybacks would stop and capex would be reviewed. This is the Brent-sensitivity that investors are implicitly underwriting when they hold XOM for total return.
Structural cost savings. Since 2019, XOM has reduced its structural cost base by $15.1 billion cumulatively through FY2025, reaching $15.6 billion through Q1 2026. The 2030 target is $20 billion - raised by $2 billion at the December 2025 plan update from the prior $18 billion target. The company states this exceeds the combined savings of all other international oil companies. The categories are operational efficiency, workforce optimization, divestiture of higher-cost businesses, supply chain and procurement, and IT modernization - no dollar breakdown by category is publicly disclosed.
The 2030 corporate plan. Published December 9, 2025 and confirmed in subsequent earnings disclosures, the plan targets: production of 5.5 million boed by 2030 (from 4.736 million in FY2025); Permian at 2.5 million boed; earnings growth of $25 billion versus the 2024 baseline at constant prices and margins (roughly 13 percent per year CAGR); cash flow growth of $35 billion versus 2024; ROCE above 17 percent; and roughly $145 billion in cumulative surplus cash at $65 real Brent. The $25 billion earnings target at constant prices is management’s single most ambitious claim, and it requires all four major pillars - Permian ramp, Guyana ramp, Chemical Products recovery, and structural savings - to work simultaneously. Missing any two of those pillars materially reduces the final number.
Energy transition: Low Carbon Solutions and XOM’s strategic bet
ExxonMobil’s position on the energy transition is the most clearly differentiated strategic posture of any supermajor. XOM does not invest in wind or solar power generation, full stop. CEO Darren Woods has cited lack of competitive advantage in those technologies. Instead, XOM focuses on carbon capture and storage, blue hydrogen, and lithium extraction - technologies adjacent to its existing subsurface engineering and pipeline capabilities. This is distinct from BP (which executed a near-complete reversal of its 2020 renewables pivot in 2025, raising upstream oil and gas capex and cutting clean energy spending by over $5 billion) and from Shell (which announced no new offshore wind projects and capped low-carbon capital below 10 percent of total capex). TotalEnergies invested approximately $5 billion in low-carbon energies in 2024 and represents the middle ground XOM has explicitly avoided.
Carbon Capture and Storage. XOM acquired Denbury Inc. in November 2023 for $4.9 billion in all-stock, gaining the largest owned and operated CO2 pipeline network in the US: over 1,300 miles of CO2 pipelines plus 15-plus onshore CO2 storage sites. The business model is fee-for-service: XOM transports CO2 from industrial emitters through its pipeline and injects it into geological storage formations, earning a transport and storage fee underwritten in large part by the 45Q tax credit, which the Inflation Reduction Act set at $85 per metric ton for geological sequestration.
As of December 2025, XOM had contracted approximately 9 million metric tonnes per year of CO2 across at least six customers spanning ammonia production (CF Industries Donaldsonville, first commercial project launched July 2025), natural gas processing, industrial gases (Linde, H2 2026 startup), steel (Nucor, H2 2026), bioenergy, methanol, and power generation (Calpine, agreement April 2025). The 2030 target is 30 million mtpa - implying 21 million tonnes of additional contracts to be secured in four years. The gap is large.
The 45Q credit was preserved in the “One Big Beautiful Bill Act” signed July 4, 2025, at $85 per ton for geological sequestration. That policy certainty through the decade is genuinely new and underpins the CCS economics. XOM has also been developing plans for a gas power plus CCS data-center complex, with FID targeted for late 2026. The theoretical capacity of XOM’s Gulf Coast CO2 network is reportedly 100 million tonnes per year - roughly 10 times the 2030 target - representing optionality contingent on additional contracts and investment.
Hydrogen: paused. ExxonMobil announced in November 2025 that it was halting plans for its flagship Baytown, Texas blue hydrogen and ammonia facility. Blue hydrogen is natural gas-derived hydrogen with CO2 captured at the point of production; gray hydrogen is the same process without capture. The Baytown project would have produced 1 billion cubic feet per day of blue hydrogen with 98 percent CO2 capture. The pause reflects three failures that came together: insufficient offtake contracts at prices that cover blue hydrogen’s roughly 33 percent cost premium over gray hydrogen, the Trump administration’s withdrawal of federal funding in spring 2025, and the uncertainty around the 45V hydrogen tax credit that the same administration left unresolved. XOM has not formally cancelled the project, only paused it pending better market conditions. Hydrogen remains a stated long-term ambition, but as of mid-2026 there is no active commercial project.
Lithium. XOM’s Mobil Lithium subsidiary controls over 120,000 acres in the Smackover Formation in southwest Arkansas and estimates a resource of roughly 4 million tonnes of lithium carbonate equivalent. The Pine unit was approved for brine production by the Arkansas Oil and Gas Commission in April 2025. First commercial production is targeted for 2027. A non-binding memorandum of understanding with SK On for up to 100,000 metric tons of Mobil Lithium for US EV battery manufacturing was signed in June 2024. Initial-scale economics are modest: the Pine unit’s projected annual profit was reported at roughly $27 million at initial scale (per Arkansas trade press), which is a rounding error against XOM’s $28.8 billion in FY2025 earnings. This is a long-dated option, not a near-term earnings contributor.
The honest appraisal. The LCS capital envelope was cut from $30 billion to $20 billion for 2025-2030 at the December 2025 update, reflecting a more disciplined posture under the current policy environment. Proxxima is XOM’s proprietary thermoset resin and composite materials technology, targeting wind turbine blade and structural applications as a bio-based substitute for conventional epoxy resins - an early-stage materials business with no material commercial revenue as of mid-2026. XOM projects that the combined LCS businesses - CCS, hydrogen, lithium, Proxxima materials, data centers - could generate $13 billion in earnings by 2040, described as contingent on “supportive policy and broader market formation.” Analysts at Carbon Tracker characterize this as speculative optionality rather than base-case earnings, and that framing seems reasonable for a horizon 15 years away. The 45Q credit provides genuine economic foundation for CCS specifically; everything else is still in the building phase. Frame Low Carbon Solutions as a set of real, early-stage businesses that could add meaningful earnings in the 2030s if policy holds and markets develop - not as a near-term earnings driver that changes the 2026-2027 investment case.
A note on shareholder activism. Engine No. 1, a hedge fund holding approximately 0.02 percent of ExxonMobil’s shares, won three board seats at the May 2021 annual meeting - an outcome widely described in financial media as a watershed moment for ESG shareholder activism. XOM’s Low Carbon Solutions strategy and formal emissions target disclosures followed, though any causal link between the board campaign and those decisions is a reader inference. In January 2024, XOM sued activist investors Arjuna Capital and Follow This over a climate-resolution shareholder proposal. Arjuna subsequently withdrew the proposal and committed not to resubmit climate-related proposals to XOM shareholders. A federal judge ruled XOM could proceed with the lawsuit. The case was the first major corporate lawsuit of this type against climate-resolution shareholders. At the May 2026 annual meeting, say-on-pay passed at 92.6 percent approval and no material activist or ESG-related resolutions carried against the board.
The Massachusetts Attorney General’s lawsuit, which alleges climate deception and investor fraud - these are allegations, not court findings - proceeded toward trial after the Massachusetts Supreme Judicial Court denied ExxonMobil’s motion to dismiss in March 2026. The case is now in Suffolk Superior Court. ExxonMobil has not admitted wrongdoing. No judgment has been entered and no financial liability has been determined by a court.
Competitive position: XOM vs the supermajor peer set
| Company | Market Cap (approx, 2026-06-25) | Fwd P/E | Div Yield | Notes |
|---|---|---|---|---|
| XOM | ~$574.7B | 10.81-12.17x (disputed) | 3.01% | Largest US major; Permian + Guyana |
| CVX | ~$343B | ~10.38x | 4.13% | Hess/Guyana 30%; 60% of XOM scale |
| COP | ~$146B | ~10.22x | 3.16% | Pure-play upstream; no downstream offset |
| SHEL | ~$225B | ~7.61x | 3.82% | World’s largest LNG trader; EU listing discount |
| BP | ~$115B | ~7.67x | 5.24% | Cheapest forward P/E; strategic reset underway |
| TTE | ~$180B | est. 7-8x | est. 4-5% | Most diversified by energy mix; LNG powerhouse |
All peer figures are single-source from StockAnalysis and Yahoo Finance as of June 25, 2026 - point-in-time and fast-moving.
CVX is the closest US peer. At roughly $343 billion, it trades at 60 percent of XOM’s market cap. The Hess acquisition gave CVX a 30 percent stake in Guyana’s Stabroek Block, but that interest sits under XOM’s operational control - development pace, FPSO sanctioning, and day-to-day production decisions all run through XOM. CVX’s broader Permian position is smaller than XOM’s post-Pioneer. Q1 2026 adjusted earnings of $2.8 billion against XOM’s adjusted upstream alone of $5.74 billion illustrates the scale differential. CVX’s higher dividend yield (4.13 percent versus XOM’s 3.01 percent) offers more current income at lower entry valuation.
COP is the largest pure-play US E&P. Without refining or chemicals, its earnings are fully exposed to crude price moves - Q1 2026 earnings fell 21 percent year-over-year when oil prices softened, exactly the volatility XOM’s integration hedges. COP’s Willow Alaska and Montney Canada projects represent multi-decade organic growth, but at zero downstream offset, a $64 Brent 2027 scenario would compress COP earnings 25-35 percent versus XOM’s estimated 15-20 percent.
SHEL is the world’s largest LNG trader and closest European analog to XOM. At $225 billion and a forward P/E of 7.6x, it trades at a roughly 30 percent discount to XOM. Shell’s LNG volumes - roughly 68-70 million tonnes per year - dwarf XOM’s LNG exposure (30 percent of 18.1 million tonne Golden Pass, plus minority PNG LNG). The discount reflects the EU listing premium gap, strategic retreats from renewables, and BP-adjacent strategic uncertainty.
BP is the cheapest supermajor on forward P/E (7.67x) with the highest yield (5.24 percent). Under CEO Murray Auchincloss, BP reversed its 2020 green pivot in 2025, raising upstream oil and gas capex while cutting clean energy spending. The stock is up roughly 67 percent in the trailing year, but years of strategic direction changes have created a management credibility discount. Castrol lubricants competes directly with Mobil 1 - the only segment where XOM and BP face each other in branded consumer products.
TTE represents the middle path XOM rejected: genuine multi-energy exposure spanning LNG, deep water, and roughly 35.6 gigawatts of renewable capacity. Q1 2026 net income of $5.81 billion was up 51 percent year-over-year, demonstrating that TTE’s diversification can produce strong results. The forward P/E discount (estimated 7-8x) partly reflects French political risk and renewables-build drag on near-term returns.
OXY is the Permian peer most shaped by a single relationship: Berkshire Hathaway owns approximately 26.64 percent of the common stock, plus $8.5 billion in preferred shares and warrants. OXY is also divesting OxyChem to Berkshire in a separate $9.7 billion transaction. Without a downstream offset, OXY’s oil-price sensitivity is more acute than XOM’s. Its Stratos direct air capture plant in Texas captures CO2 at roughly $400 per ton of cost - compared to XOM’s point-source industrial CCS at roughly $100 per ton - making XOM’s CCS approach more commercially viable near-term. Investors interested in OXY as an adjacent Permian holding may wish to cross-reference Berkshire’s Occidental/OxyChem stake and how that strategic positioning informs the capital structure.
Financials from the filings
All figures below are GAAP unless noted. Sources are the FY2025 10-K (accession 0000034088-26-000045, filed February 18, 2026), the FY2025 earnings press release (January 30, 2026), the Q1 2026 10-Q (filed May 4, 2026), and the Q1 2026 earnings press release.
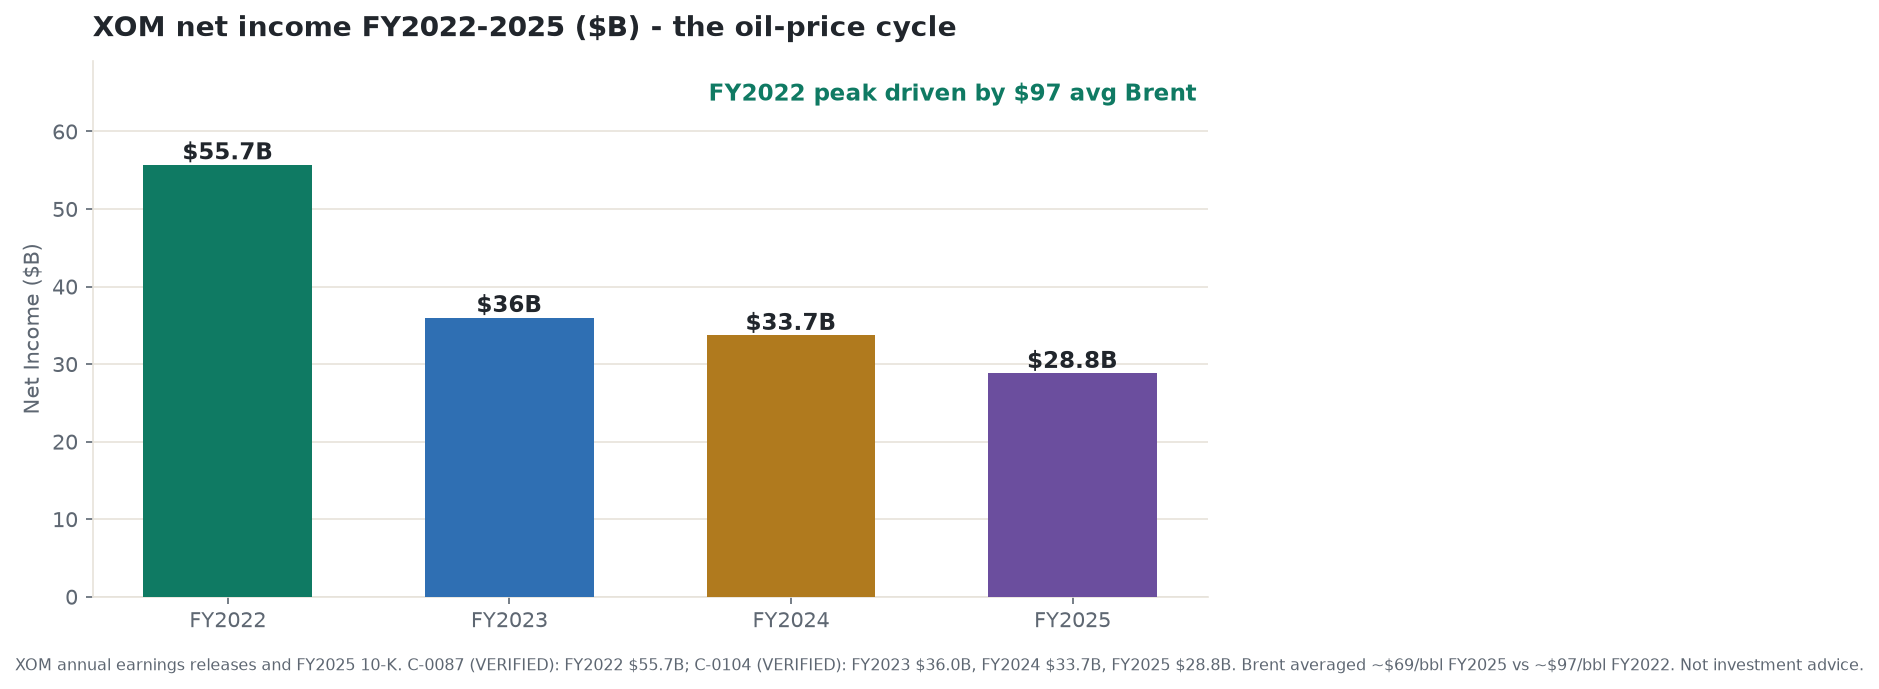
Income statement. GAAP total revenues: $413.68 billion (FY2022), $344.58 billion (FY2023), $339.25 billion (FY2024), $332.2 billion (FY2025) - declining four consecutive years as commodity prices normalized. Net income: $55.7 billion (FY2022), $36.0 billion (FY2023), $33.7 billion (FY2024), $28.8 billion (FY2025, EPS $6.70 diluted). Excluding identified items: FY2025 net income $30.1 billion, EPS $6.99. The step-down from $55.7 billion in FY2022 to $28.8 billion in FY2025 is almost entirely commodity-price driven. Brent averaged roughly $97 per barrel in FY2022 and roughly $69 per barrel in FY2025.
Q1 2026. Revenue $85.1 billion (versus $83.1 billion in Q1 2025, up 2.4 percent). Net income $4.2 billion (versus $7.7 billion in Q1 2025, down 45.8 percent). EPS $1.00 (versus $1.76). The sharp decline was almost entirely a timing effect: Energy Products reported a negative $3.33 billion mark-to-market derivative impact from Middle East supply disruptions that prevented physical delivery against hedges. Excluding that timing effect, EPS was approximately $2.09.
Cash flow and balance sheet. FY2025: operating cash flow $52.0 billion, capital expenditures $29.0 billion, free cash flow $26.1 billion. Q1 2026: operating cash flow $8.7 billion (excluding margin postings: $13.8 billion), capex $6.2 billion. Balance sheet at December 31, 2025: cash $10.7 billion, long-term debt $34.2 billion, short-term notes and loans $9.3 billion, total debt $43.5 billion, net debt $32.8 billion, total equity $266.6 billion, total assets $449.0 billion. Debt-to-capital 14.0 percent; net debt-to-capital 11.0 percent. By Q1 2026 (March 31), total debt had risen to $47.7 billion and net-debt-to-capital to 13.1 percent, reflecting seasonal working capital movements and continued buyback activity.
Segment capital and returns. Upstream received $24.7 billion of the $29.0 billion total capex in FY2025 - 85 percent of the total. Energy Products received $1.7 billion, Chemical Products $1.4 billion, Specialty Products $0.6 billion. ROCE: 9.3 percent in FY2025, 12.7 percent in FY2024, 15.0 percent in FY2023.
Pioneer integration on the balance sheet. The May 2024 acquisition added approximately $84 billion in property, plant, and equipment and $1 billion in goodwill to the balance sheet, with $16 billion in deferred tax liabilities assumed as a partial offset. The DD&A (depletion, depreciation, and amortization) load from this asset base is running through the income statement since Q2 2024, mechanically compressing reported ROCE even as production grows.
Key 2026 guidance (as of January 30 and May 1, 2026 disclosures). Capex $27-29 billion. Share repurchases $20 billion, assuming reasonable market conditions. Quarterly dividend $1.03 per share (declared for Q2 2026). Production growth consistent with the 2030 plan trajectory.
Market action and valuation
All figures are point-in-time as of June 25, 2026, and move continuously.
Price and range. XOM closed at $137.54 (or $137.55 by some data vendors - rounding difference). The 52-week range is $105.53 to $176.41 (Yahoo Finance and StockAnalysis, corroborated). At $137.54, the stock sits at roughly 45 percent of the 52-week trading band, near the lower half. The 52-week intraday high of $176.41 was struck around March 30, 2026, when Brent crude was near its conflict-era peak. From that high the stock has retraced roughly 22 percent. To put that pullback in context: XOM’s five-year total return through June 2026 is approximately 226 percent (CAGR roughly 25.6 percent, per FinanceCharts), driven by the post-COVID energy price surge. The 22 percent drawdown from the 52-week high is a retracement within a much larger upward cycle, not a structural breakdown. YTD performance is in a range of approximately +24 to +30 percent across sources - these figures are disputed depending on the measurement date and dividend inclusion methodology, and I present the range rather than picking one number.
Valuation multiples. Trailing P/E of 23.16x on TTM EPS of $5.94 (Yahoo Finance and StockAnalysis, corroborated). The TTM figure is distorted by two things: Q1 2026’s $3.9 billion timing effect, and FY2025 GAAP earnings already being below the $55.7 billion 2022 peak. Forward P/E is disputed: StockAnalysis shows 10.81x, Yahoo Finance shows 12.17x, both as of June 25 but using different NTM EPS assumptions (approximately $12.72 versus $11.30). The Street consensus for full-year 2026 EPS is approximately $11.32 across 24 analysts at StockAnalysis - but this consensus was set when Brent was trading near its war-era highs and will be revised lower if H2 2026 Brent averages $65-70. At $8-9 EPS (plausible if 2026 averages around $70 Brent after accounting for the low H2 prices post-ceasefire), the forward P/E is actually 15-17x on real delivered earnings - full for an oil major.
EV/EBITDA is approximately 10.5x (range 9.96-10.88x across valueinvesting.io, StockAnalysis, and GuruFocus). The 10-year historical median EV/EBITDA is approximately 7.83x per GuruFocus - single source, treat as directional. The current reading sits roughly 34-36 percent above that median. The premium reflects improved balance-sheet quality post-2020, Pioneer acreage, the Guyana PSA, and the market’s willingness to pay for dividend reliability. Whether the premium is fully earned is the central valuation debate.
Dividend yield context. XOM’s yield of roughly 3.0 percent at $137.54 trails the 10-year US Treasury at approximately 4.3-4.5 percent in the June 2026 rate environment. Income investors weighing XOM against risk-free paper face a negative yield spread. The XOM case rests on dividend growth (roughly 4 percent per year recent trajectory), buyback yield (roughly 3.5 percent), and eventual earnings recovery - none of which is guaranteed by the Treasury.
Sell-side consensus. 24 analysts cover XOM per StockAnalysis, with a Buy consensus (8 Strong Buy, 3 Buy, 12 Hold, 0 Sell, 1 Strong Sell). The mean target is $170.24 (StockAnalysis) or $170.43 (Yahoo Finance, rounding difference only), implying roughly 23.8 percent upside from $137.54. The low target is $130 - only 5.8 percent above the current price. Bank of America upgraded to Buy on June 16, 2026 - the same day the ceasefire confirmation sent crude crashing 36 percent - the most recent rating change, citing refining margin recovery and production growth. The timing is logical from a refining standpoint: lower crude expands crack spreads and Energy Products earnings, so a falling oil price is actually a net positive for the integrated refining segment. The BofA upgrade into a commodity price collapse illustrates that the integration thesis and the oil-price headline are pulling in opposite directions.
Technicals - context only, not a signal. XOM has fallen through all near- and medium-term moving averages: below the 5-day (~$138), 20-day (~$145), 50-day (~$149), and 100-day (~$152), and is hovering just above the 200-day (~$135, per Barchart, single source). The 14-day RSI near 35 approaches oversold territory. The nearest technical support before the stock would test its 52-week low zone is the 200-day around $135; below that, the prior consolidation in the $120-125 zone.
Short interest. Approximately 40-42 million shares, roughly 1.02 percent of the float (StockAnalysis, corroborated by MarketBeat at 0.99-1.02 percent as of early June 2026). Extremely low. XOM is not a conviction short target, and no meaningful short-squeeze dynamic exists.
Sentiment and narrative read
The news tone through Q2 2026 built steadily on a strong operational story, then cooled in the final 48 hours of the period on two political events.
The positive operational narrative: Q1 2026 adjusted earnings of roughly $4.9 billion beat consensus on record production of 4.6 million boed, Guyana’s Stabroek Block crossed 900,000 gross barrels per day with Yellowtail fully ramped, and the doubling of Pioneer synergy targets to $4 billion per year had been received almost uniformly positively by trade and financial press. The coverage framing by late May was something like: “production machine delivering ahead of schedule.”
Two events shifted the tone in the final days of the period.
First, on June 24, 2026, President Trump directed what the administration described as a price-gouging investigation naming ExxonMobil and Chevron, citing the gap between crude’s 36 percent decline from the May 2026 conflict-era high and pump prices that remained near $3.93 per gallon nationally (per NBC News, the primary press source for this story). No enforcement action, formal charge, or finding of violation has been issued as of this writing. Price-gouging findings against integrated majors are rare, and the institutional status of any subsequent DOJ proceedings has not been established. What this story does complicate is the prior bull narrative of “pro-fossil-fuel administration as regulatory tailwind” - a president willing to publicly accuse XOM of gouging is not an unambiguous policy ally.
Second, Bloomberg reported in mid-June 2026 that XOM was evaluating an early-stage bid for Woodside Energy Group (approximately $42 billion market cap). Woodside denied active discussions two days later. Investor reaction was cautious - the Pioneer integration is barely complete and a second mega-deal of similar scale would stretch the balance sheet further while ROCE is already near WACC.
Retail sentiment. XOM’s income-investor base on r/dividends is constructive, centered on the 43-year dividend growth streak, the $4.12 annual rate, and the stock’s pullback from its $176 high as a buying-opportunity narrative. StockTwits shows XOM with roughly 90,000 followers - the highest in its peer group - but daily mention volume placing it in the 23rd percentile for peer mentions: this is a high-conviction, low-churn income name, not an active trading vehicle. Retail tone shifted briefly bearish in the 24 hours following the Trump DOJ probe headline on June 24-25.
Five divergences between narrative and fundamentals. The most actionable: XOM is producing more oil per day than at any point in its history and returning $9.2 billion per quarter to shareholders, yet the stock sits 22 percent below its 52-week high because the crowd is repricing for lower Brent. The production-growth story argues for partial decoupling from the spot price; the crowd is trading the commodity. Second, the “regulatory tailwind” narrative has a fault line from the DOJ probe. Third, the income-investor enthusiasm for XOM’s dividend streak somewhat elides the fact that 3 percent yield is not exceptional in an energy peer set - the growth streak is doing the narrative work, not the current yield. Fourth, the Massachusetts climate lawsuit received low media salience but cleared a significant procedural hurdle in March 2026. Fifth, ESG activism has retreated materially since the Arjuna Capital precedent - what was a “watershed for ESG” in 2021 produced near-complete silence on XOM’s 2026 proxy ballot.
Macro context: the oil-price cycle and what drives XOM’s earnings
The macro context for XOM as of June 25, 2026 is not a normal cyclical moment. From late February to June 17, 2026, a US-Israel conflict with Iran closed the Strait of Hormuz to commercial traffic. Brent crude surged above $115 per barrel at the conflict peak, then crashed roughly 36 percent to approximately $74 on the research date as the ceasefire signed June 17 opened supply lanes. The entire 2026-2027 supply-demand picture is shaped by this shock and its aftermath.
Demand durability. The IEA’s June 2026 Oil Market Report projects 2026 global oil demand at 103.3 million barrels per day, down 1.1 million from 2025 - the decline being entirely war-related demand destruction from high prices and supply disruption. The IEA expects a 2.0 million barrel per day rebound to 105.3 million in 2027 as shipping lanes normalize. The structural underpinning for demand is EM urbanization, petrochemical growth, aviation (which has no substitute), shipping, and industrial energy. The petrochemical feedstock angle is particularly important for XOM: plastics, lubricants, synthetic materials, and agricultural inputs are slower to electrify than passenger vehicles. US electricity demand from AI data centers is expected to add 3-6 billion cubic feet per day of gas demand by 2030, supporting natural gas and LNG prices.
The peak-demand debate is not meaningfully resolved but is also not decisive for XOM’s 5-year horizon. Even the IEA’s Stated Policies scenario has demand at roughly 105 million barrels per day through the late 2020s. XOM’s own February 2026 Global Outlook projects roughly 105 million barrels per day in 2050 in the base case and 65 million even under aggressive decarbonization. At $30-35 per barrel cost of supply for its best assets, XOM is in the bottom quartile of the global cost curve and will run at full capacity even in a declining-demand world. The stranded-asset risk is real at a 20-30 year horizon but is not a 5-year investment case, and I frame it as a long-dated scenario, following Carbon Tracker’s analysis (which attributes this risk explicitly to companies planning for demand scenarios the analyst judges as inconsistent with Paris Agreement goals).
The 2027 supply overhang. The IEA’s June OMR flagged a potential surplus of around 5 million barrels per day in 2027 as Gulf and Iranian production returns post-ceasefire, OPEC+ voluntary cuts unwind, and non-OPEC supply from the Permian, Guyana, and Brazil’s pre-salt continues growing at 1-1.5 million barrels per day per year. JPMorgan’s commodity desk puts 2027 average Brent at $64 (estimate, attributed). Goldman Sachs models $75 (estimate, attributed). Morgan Stanley’s view is more constructive at roughly $80 (estimate, attributed). The range from $64 to $80 captures the genuine uncertainty about how fast OPEC+ cohesion holds and Iranian supply returns. JPMorgan separately has noted that Brent could test the $30s in a tail scenario if OPEC+ cohesion breaks entirely. Those are named bank estimates, not facts.
The closest historical analog for the current situation is 2014-2016, when a combination of rising US shale supply and OPEC’s decision to defend market share rather than price drove Brent from $115 per barrel to $27 per barrel in approximately 18 months - a longer and deeper decline than the 2022 Ukraine spike. XOM maintained its dividend throughout that entire downcycle. The $15.6 billion in structural cost savings booked since 2019 mean XOM’s minimum viable operating level is materially lower today than it was entering that cycle, and the $30 per barrel 2030 breakeven target reflects that improved cost position.
OPEC+ and ceasefire fragility. OPEC+ has been unwinding voluntary production cuts: 206,000 barrels per day in April, 188,000 barrels per day in June. UAE formally exited OPEC, removing a key swing vote on production discipline. Swiss ceasefire follow-on talks were abruptly postponed on June 19; Trump threatened fresh strikes as recently as June 22. The ceasefire is fragile, and oil-price tail risk is genuinely symmetric: the commodity can spike back toward $90-100 if hostilities resume as easily as it fell.
US energy policy as tailwind. The Trump administration lifted Biden’s LNG export pause on January 20, 2025. Offshore drilling permits increased 55 percent in the first year. Federal permitting is being streamlined. This is unambiguously supportive of XOM’s Permian development, Golden Pass LNG ramp, and LCS CCS business (45Q credit preserved). The DOJ probe on price-gouging is the first complication to that tailwind narrative.
Interest rates. The Federal Reserve held the federal funds rate at 3.50-3.75 percent at its June 17, 2026 meeting. The 10-year Treasury is estimated at roughly 4.3-4.5 percent. XOM’s investment-grade credit rating (AA- range) means it can access capital at favorable spreads regardless of rate moves - the business is not threatened by rates. But the yield differential (10-year Treasury at 4.3-4.5 percent versus XOM’s 3.0 percent dividend yield) is a modest headwind for income-seeking capital allocation decisions.
Micro economics: per-barrel profitability and returns
Upstream unit economics. Blended upstream earnings per barrel of oil equivalent were approximately $12.38 in FY2025 (derived: $21.4 billion earnings divided by 1,728 million barrels of annual production from the 4,736 kbd total - this is an editorial calculation, not a company-disclosed figure). The 2030 corporate plan targets over $15 per barrel in unit earnings - roughly 3 times the 2019 run-rate - driven by the mix shift toward lower-royalty Permian and Guyana barrels.
Guyana barrels dominate the economics. At roughly $40.6 per barrel of implied net earnings (derived from press-reported FY2025 Guyana profit of $4.67 billion divided by approximately 115 million barrels of net XOM production - an estimate from non-primary-filing sources, flagged as unverified at the primary level), Guyana earns something like 3.3 times the blended upstream average. This reflects the 2% royalty, Article 15.4 tax exemption, and $7.9 per barrel development cost versus a $13 per barrel global FPSO average.
Permian unit economics are harder to isolate. XOM states a cost of supply below $35 per barrel for Pioneer assets. The Dallas Fed reports new-well breakevens of $63-69 per barrel for the Permian broadly - but those are industry-average new-well costs, not XOM’s own lifting cost, which benefits from scale, cube development, and proprietary completion technology. The Pioneer integration’s $4 billion per year synergy target - categories spanning resource recovery, development cost, and operating cost - directly reduces per-barrel cost over time.
The integration hedge quantified. When Brent fell roughly $11.70 per barrel in 2025 versus 2024, the upstream sensitivity of $700 million per dollar implies upstream earnings should have fallen about $8.2 billion (estimate). They actually fell only $4.0 billion - partially because volumes grew - while Energy Products earned $3.4 billion more. The net change to combined Upstream plus Energy Products was roughly negative $0.6 billion. That is the integration hedge working in a real year of data. The implied downstream offset is roughly $290 million per dollar of crude decline (derived editorial estimate from that one year of data, not a published company figure). The net integrated sensitivity works out to roughly $410 million per dollar of Brent movement (editorial estimate, UNVERIFIED).
ROCE trajectory. ROCE fell from 15.0 percent in FY2023 to 12.7 percent in FY2024 to 9.3 percent in FY2025. The step-down is almost entirely cyclical: lower Brent, lower Chemical Products margins, and the Pioneer DD&A load ($84 billion in PP&E added at close). Estimated WACC of 8-9 percent (range across four analyst sources, no primary company disclosure) means the FY2025 ROCE-WACC spread was near zero to positive 1.3 points. The 2030 plan target of above 17 percent ROCE requires the full production ramp, Chemical Products recovery, and cost savings all landing simultaneously.
Capital intensity. FY2025 capex-to-OCF ratio was 55.8 percent ($29 billion divided by $52 billion). Upstream absorbed $24.7 billion. The Permian specifically absorbs a large portion of that because shale wells require continuous completion activity - roughly 1,000 or more per year just to maintain the existing 1.6 million boed base, let alone grow it. From 2027-2028 onward, as Guyana FPSOs reach plateau production with declining marginal capital requirements, XOM’s incremental FCF per dollar of capex should improve structurally. The 2030 plan’s projection of $35 billion more in cash flow at constant prices versus 2024, with capex staying in the same $27-32 billion range, depends on that dynamic.
Durability and synthesis
The integrated model’s resilience is real but not unlimited. The 2025 data point - a combined Upstream plus Energy Products earnings change of only negative $0.6 billion against an $11.70 per barrel crude decline - demonstrates the hedge working in a scenario where crude fell while crack spreads were supported by Middle East supply disruption. The hedge is partial and scenario-dependent: in Q2 2020 and much of 2023, crude AND product margins fell simultaneously, breaking the counter-cyclical relationship. Chemical Products correlates counter-cyclically in theory but has been in trough for three years regardless of oil-price direction, because the root cause is structural Chinese overcapacity, not cycle timing.
The three durable sources of economic advantage are ordered by durability.
First, the Guyana Stabroek position. The PSA contract terms - 2 percent royalty, approximately 14.5 percent effective government take, 50/50 profit oil after 75 percent cost recovery, and Article 15.4 tax indemnification - are locked in by an international contract with legal standing. Per-barrel economics at $40-plus net to XOM at $69 Brent are extraordinary. The political risk is real - new Guyana PSAs already carry 10 percent royalty - but retroactive renegotiation of an existing PSA would require XOM to invoke international arbitration, and the July 2025 ICC ruling on the Hess ROFR claim demonstrates that international arbitration works in this jurisdiction. As long as the contract holds, Guyana is the most valuable single position in XOM’s portfolio.
Second, the structural cost platform. $15.6 billion in cumulative savings (through Q1 2026) versus the 2019 baseline are permanent reductions in the cost floor, not cycle-dependent. These directly lower the Brent price at which XOM covers its dividend and sustaining capex. The breakeven target of $35 per barrel by 2027 is analyst-reported rather than company-disclosed in precise terms, but the direction is confirmed by the 2020 precedent - XOM covered its dividend at sub-$50 Brent without cutting.
Third, Specialty Products. Mobil 1’s branded pricing, EHC proprietary basestock technology, and demand tied to engine oil change cycles provide cycle-insensitive cash flow. The main long-term risk is EV penetration reducing the internal combustion engine population over the next 10-20 years - a structural headwind, but a gradual one.
The Permian is a capital factory rather than a durable moat: high volume, improving cost, but requiring continuous reinvestment that consumes roughly half of upstream capex. It is an earnings growth engine, not a pricing-power position.
The overarching durability risk. Energy transition is the long-term question that underlies every horizon scenario. XOM’s planning thesis - oil demand at roughly 105 million barrels per day through 2050 in the base case - is consistent with the IEA’s Stated Policies Scenario (which implies approximately 2.7 degrees of warming above pre-industrial levels, above Paris Agreement targets). If climate policy accelerates beyond that scenario, XOM’s long-life Permian and Guyana assets carry stranded-asset risk. This risk is real but its timing is uncertain and, for XOM’s 5-year analytical horizon, largely irrelevant: global demand will remain above 100 million barrels per day through 2030 under virtually every credible forecast, and XOM’s sub-$35 per barrel cost position means it will be producing at full capacity under any oil-demand scenario above that breakeven.
The scenarios in detail
The bull/base/bear dollar levels here match the lede chart exactly. All figures are estimates, not price targets.
Bull case: Brent averages $85-plus, full 2030 plan execution
The setup. Brent averages $82-92 per barrel from 2027 onward. The ceasefire proves fragile, or a new unrelated supply disruption re-emerges. OPEC+ maintains production discipline despite UAE’s formal exit. Iranian crude returns only partially. Global demand recovers on EM petrochemical growth and AI-driven gas demand.
The earnings path. Upstream earnings expand well beyond FY2025’s $21.4 billion. At $88 Brent versus $69 average in FY2025, the $19 per barrel improvement applied to the net integrated sensitivity of approximately $410 million per dollar implies roughly $7.8 billion of additional price contribution (estimate). Full Permian and Guyana production ramp adds another $10-13 billion at incremental margins (estimate from per-barrel production arithmetic applied to 2030 plan volume targets). Chemical Products recovers toward $4-5 billion by 2028-2030 (estimate; no company-stated target). Total 5-year earnings could reach $50-58 billion (estimate), EPS $14-17 (estimate), share count declining roughly 3.5 percent per year on full buyback.
At roughly $15.50 EPS (estimate) and a 15x multiple (estimate, peer-level for an integrated major with volume growth and quality premium), the stock reaches approximately $215 by 2031 (estimate). This requires oil holding above $82, all four sanctioned Guyana FPSOs ramping on schedule, no major acquisition diluting capital, and Chemical Products recovering by 2029.
The 6-month bull: ~$165 (estimate). The 1-year bull: ~$162 (estimate). The 3-year bull: ~$198 (estimate).
What breaks it. Oil falls back toward $68-72 before the production ramp fully materializes. The IEA’s 2027 supply surplus materializes on schedule, capping Brent below the bull threshold even if demand holds.
Base case: Brent $70-75, production ramp intact, chemical trough persists through 2027
The setup. Brent averages $70-75 per barrel from mid-2027 through 2030, reflecting gradual Iranian and Gulf supply return, partial OPEC+ discipline, and steady EM demand growth. This aligns broadly with Goldman Sachs’s 2027 estimate of $75 and with XOM’s own $65 real Brent planning price (which implicitly assumes nominal prices around $70-75 given the plan’s real-price framing).
The earnings path. FY2025 GAAP EPS of $6.70 at roughly $69 average Brent. At $72 Brent, the price adds roughly $3 times $410 million per dollar equals roughly $1.2 billion (estimate). Production growth from the Permian and Guyana ramp plus Golden Pass LNG’s full contribution by 2027 adds an estimated $8-12 billion over five years. Chemical Products stays near trough through 2027, then partially recovers to $2-3 billion by 2029-2030 (estimate, consistent with the ICIS/WoodMac 2028-2029 recovery timeline). By FY2031, base-case earnings of roughly $40-48 billion (estimate) and EPS of roughly $10.50-12.50 (estimate).
At $11.50 EPS (estimate) and a 13.5x multiple (estimate, consistent with US integrated peers at moderate oil prices), the stock reaches approximately $155 by 2031 (estimate). The $4.12 per year dividend growing roughly 4 percent per year toward $4.80 by 2031 (estimate) represents a yield of roughly 3 percent at that level. Total annualized return in the base: roughly 4-6 percent per year from today (estimate), counting dividends plus buyback plus modest price appreciation. This is an income compounder profile, not a growth story.
The 6-month base: ~$148 (estimate). The 1-year base: ~$128 (estimate). The 3-year base: ~$144 (estimate).
What breaks it. Brent drifts below $65 for more than two consecutive quarters as Iranian supply returns ahead of schedule and OPEC+ fails to coordinate offsetting cuts. On the upside, Chemical Products recovering faster than the 2029 consensus or a geopolitical re-spike tips the base toward bull.
Bear case: Brent $55-62 sustained, 2027 supply glut materializes, chemical trough persists
The setup. This is the skeptic’s strongest case. Iranian crude production returns to 3.8-4.0 million barrels per day by Q1 2027 (from roughly 3.2 million at war onset). Saudi Arabia faces internal budget pressure and does not enforce further OPEC+ cuts when they become politically difficult. UAE has exited OPEC. XOM’s own Permian and Guyana growth adds barrels to an already-glutted market. Global growth slows to 2.5-2.8 percent (consistent with the IMF’s more adverse scenarios), reducing oil demand growth to roughly 1 million barrels per day rather than the IEA’s 2 million barrel rebound. Brent drifts below $62 for H2 2026 and averages $57-62 for full-year 2027-2029. JPMorgan’s 2027 base of $64 is the near-side of this scenario.
The earnings path. At $59 Brent versus $69 FY2025 average, the $10 per barrel decline applied to the net integrated sensitivity of $410 million per dollar implies roughly $4.1 billion of earnings reduction (estimate). But production growth from the 2030 plan still adds roughly $6-9 billion by 2030 even at low oil prices - incremental barrels at $35 cost of supply and $59 Brent still earn roughly $24 per barrel of gross margin. Chemical Products stays near trough. Net FY2031 earnings: an estimated $28-33 billion, EPS an estimated $7-8.50. FY2027 is the worst year in this scenario: earnings could compress to an estimated $23-25 billion (skeptic estimate, C-0202 in the claims ledger), EPS an estimated $5.75-6.00, at which the trailing P/E on today’s $137.54 price would be roughly 23x - expensive for a commodity producer at trough earnings.
At an estimated $7.75 EPS (estimate) and an 11.5x multiple (estimate, bear-cycle multiple for an oil company with ROCE near WACC and trough earnings), the stock reaches approximately $89 by 2031 (estimate). This does not collapse to zero - the dividend at roughly $4.75 per year (estimate, growing toward $4.80 at the current pace but slowing if buybacks pause) represents roughly a 5.3 percent yield at that level, providing a real income floor. The 3-year and 5-year bear converge near $90 because production growth offsets further price erosion.
The 6-month bear: ~$115 (estimate). The 1-year bear: ~$92 (estimate). The 3-year bear: ~$90 (estimate).
What has to be true. All four supply-return legs fire simultaneously: Iran, Saudi Arabia, OPEC+ discipline collapse, and demand slowdown. A partial scenario - two legs rather than four - is more likely to produce the $64-68 Brent range, not the full $55-62 bear.
What breaks it. A credible OPEC+ cut announcement, a ceasefire breakdown in the Middle East producing a temporary spike, or Chinese stimulus driving demand upside by 1-1.5 million barrels per day. The ceasefire’s fragility (Swiss follow-on talks postponed June 19; Trump threats as recently as June 22) means oil-price tail risk is genuinely symmetric.
Companies to watch across the scenarios
XOM itself. In the bull case, XOM could reach an estimated $165-198 over 1-3 years as volume growth and price combine. In the base, it is a low-to-mid single-digit total-return compounder with the dividend as the anchor. In the bear, it is a $90-115 range where the income-investor bid provides support but price appreciation is limited or negative for years. Dividend safety is the constant: covered to approximately $40-45 Brent by company guidance, protected by $15.6 billion in structural savings, and tested successfully at sub-$50 Brent in 2020.
CVX (Chevron). In the bull case, CVX’s Guyana Stabroek 30 percent stake benefits from the same FPSO ramp XOM drives as operator - CVX gets the barrels without controlling the pace. In the base, CVX’s higher yield (4.13 percent) and lower forward valuation make it a legitimate alternative income play. In the bear, if XOM slows Guyana development in response to $60 Brent, CVX’s Guyana thesis softens simultaneously - the development pace is XOM’s decision. CVX’s 52-week high was $214.71 versus a current $172 (single-source, point-in-time), signaling the market has already partially re-rated the Hess acquisition’s expected returns. Whether the OxyChem sale to Berkshire changes Occidental’s competitive positioning in downstream chemicals is a separate thread.
COP (ConocoPhillips). COP’s pure-play upstream model captures the full commodity upside in the bull case - no downstream dilution. But Q1 2026 earnings fell 21 percent year-over-year when oil prices softened, illustrating the exact downside exposure XOM’s integration hedges. In the bear ($64 Brent sustained), COP’s earnings would compress 25-35 percent versus XOM’s estimated 15-20 percent - a more severe outcome from the same macro move.
OXY (Occidental). The Permian pure-play carrying the heaviest debt load among large caps, with CrownRock acquisition debt still being worked down. Berkshire Hathaway’s roughly 26.64 percent common equity stake (264.94 million shares) plus $8.5 billion in preferred shares plus warrants is a significant financial and reputational backstop. Without a downstream offset, OXY’s oil-price sensitivity is more acute than XOM’s - in the $64 Brent bear case, OXY faces earnings compression alongside higher net debt, a combination that creates more financial stress than XOM’s fortress balance sheet. OXY’s Stratos direct air capture plant captures CO2 at roughly $400 per ton versus XOM’s point-source industrial CCS at roughly $100 per ton - a scale and cost disadvantage that limits near-term CCS competition with XOM.
HES (Hess, now CVX’s subsidiary). Post-acquisition, Hess is no longer independently traded. The standalone Hess investment case is closed; the Guyana investment thesis now runs through CVX.
SLB / HAL / BKR (oilfield services). These three companies earn from XOM’s capital spending. SLB’s 17 percent seven-day decline as of June 25 (from roughly $85 billion to $70 billion market cap) is worth noting as a leading indicator - OFS stocks typically fall ahead of E&P capex reductions. If XOM reduces Permian drilling activity in a $60 Brent environment, HAL’s North American completions volumes would compress faster than its revenue model implies at current valuation. BKR’s Industrial and Energy Technology segment - which supplies LNG liquefaction turbomachinery - is a beneficiary of the global LNG buildout that XOM is helping drive through Golden Pass. Net income more than doubled at HAL Q1 2025 to Q1 2026, showing how a fixed cost base amplifies earnings on the upside. The same amplification works in reverse when volumes fall.
MPC / VLO / PSX (independent refiners). These names capture refining margins without the upstream production hedge XOM enjoys. Valero hit an all-time high of $265.61 on June 3, 2026 - potentially the refining margin peak before the post-ceasefire crude-price normalization compresses crack spreads. MPC’s Q1 2026 adjusted EBITDA of $2.8 billion was up 40 percent year-over-year; PSX beat consensus by 217 percent on Q1 2026 EPS, but the diversified chemicals and midstream model at PSX faces the same Chemical Products trough as XOM. In a bear crude scenario with crack spreads normalizing, these names face earnings compression without XOM’s upstream production as offset.
Risk controls
Commodity price risk. Every $10 per barrel move in Brent alters XOM’s earnings by roughly $4.1 billion (net integrated estimate). At $50 Brent, XOM remains profitable and covers its dividend but buybacks slow. At $45 Brent, buybacks stop and capex is reviewed. At $35 Brent - approaching the 2030 breakeven target - the dividend is covered but there is no surplus for returns. Monitoring: weekly Brent spot and 12-month forward curve. When the forward curve trades below $65, the bear scenario is the immediate operating reality.
Energy transition and stranded-asset risk. XOM’s 2030 production plan commits $100 billion in capital over 2026-2030 to hydrocarbons. If oil demand peaks materially before 2030 (not the base case of any major forecaster for the STEPS scenario) and Permian or Guyana resources become uneconomic at lower-equilibrium prices, those long-life assets carry write-down risk. This is a 2030-2040 scenario, not a 2026-2031 one. Carbon Tracker’s analysis (publicly available at carbontracker.org) attributes stranded-asset risk to companies planning for demand scenarios inconsistent with Paris Agreement goals.
Guyana arbitration risk. The Hess ROFR dispute is resolved (XOM lost, Chevron completed the acquisition). The remaining arbitration risk is the PSA itself: if a future Guyanese government seeks to renegotiate retroactively, international arbitration under UNCITRAL provides XOM’s legal defense. Production disruption pending resolution could delay Uaru through Hammerhead timelines.
Climate litigation. The Massachusetts Attorney General’s lawsuit, which alleges climate deception and investor fraud (these are allegations; no judgment has been entered; ExxonMobil has not admitted wrongdoing; the case is proceeding toward trial after the MA SJC denied XOM’s motion to dismiss in March 2026), carries unquantified long-term liability. No dollar exposure has been disclosed. Trial is multi-year away.
The DOJ price-gouging probe. On June 24, 2026, President Trump directed what the administration described as a price-gouging investigation naming ExxonMobil and Chevron (per NBC News reporting). No enforcement action, formal charge, or finding of violation has been issued as of the research date. Price-gouging findings against integrated majors are rare. The risk is reputational and narrative rather than near-term financial.
Woodside M&A. Bloomberg reported XOM was evaluating an early-stage bid for Woodside Energy Group (approximately $42 billion). Woodside denied active discussions. If executed, a Woodside deal would commit additional tens of billions in capital while Pioneer integration is still underway and ROCE is near WACC, likely triggering a credit-rating watch.
Chemical cycle duration. ICIS and Wood Mackenzie place the ethylene recovery at 2028-2029. If Chinese state-directed overcapacity continues, or if global demand growth slows, the trough extends and the “Chemical Products as a free option on cycle recovery” narrative breaks down.
Geopolitical risk. The Straits of Hormuz ceasefire is fragile (Swiss talks postponed June 19; Trump threats June 22). A ceasefire breakdown would spike Brent back toward $90-100 but simultaneously damage global economic growth and demand - oil-price risk is symmetric. Guyana maritime border dispute with Venezuela is an ongoing background concern.
Pioneer integration execution. Remaining execution risk: further operational integration, cultural assimilation of Pioneer’s workforce, and achieving the fourth year of the $4 billion per year synergy run-rate. The FTC exclusion of Scott Sheffield (Pioneer’s former CEO) from XOM’s board does not constrain the operational integration.
Methodology, sourcing, and data-quality flags
Primary sources. The load-bearing financial figures in this article - segment earnings, cash flow, balance sheet, production volumes, share counts, capex, dividend per share, and the 2030 corporate plan targets - are sourced from XOM’s FY2025 10-K (SEC EDGAR accession 0000034088-26-000045, filed February 18, 2026), the FY2025 and Q1 2026 earnings press releases (XOM investor relations), the Q1 2026 10-Q (filed May 4, 2026), the December 9, 2025 Corporate Plan Update press release, and the 2025 Annual Report to Shareholders (which is the source for the $700 million per dollar upstream Brent sensitivity, the only company-disclosed oil-price sensitivity figure). Guyana PSA terms are sourced from OilNow, S&P Global Commodity Insights, and Rystad Energy (analyst tier). Market action figures are from Yahoo Finance, StockAnalysis, and Barchart as of June 25, 2026 (press and market data tier, single-source or dual-source as noted).
Analyst and press tier. Sell-side consensus data from StockAnalysis and MarketBeat (24 analysts, dated June 25, 2026). Bank oil price forecasts (Goldman $75 2027, JPMorgan $64 2027) are named analyst estimates from publicly reported research - not proprietary or independently verified. ICIS and Wood Mackenzie chemical recovery timelines are from publicly accessible press releases and search-result summaries; full paywalled reports were not directly accessed. The ICIS 2028-2029 recovery date is directional, not a precise primary-source figure.
Estimates and UNVERIFIED claims. Several load-bearing figures in this article are clearly labeled as estimates or UNVERIFIED in the research claims ledger. The net integrated Brent sensitivity (~$410 million per dollar) is an editorial calculation derived from one year of data and is not a company disclosure - do not treat it as a precise fact. The Guyana implied unit earnings of ~$40.6 per barrel is derived from press-reported Guyana profit figures (Motley Fool, Energy News Beat) divided by estimated net production - it is an estimate from non-primary sources. Chemical Products mid-cycle earnings of $3-5 billion is an editorial inference from management’s statement that 2022’s $3.5 billion was “above the 10-year average.” XOM has never stated a specific mid-cycle target. The WACC estimate of 8-9 percent is from four independent analyst sources and is not company-disclosed. All forward scenario EPS and stock price levels throughout this article are estimates derived from stated scenario assumptions and stated multiples - they are not price targets.
Point-in-time flags. XOM’s stock price ($137.54), market cap (~$574.7 billion), Brent crude (~$74), dividend yield (~3.0%), EV/EBITDA (~10.5x), forward P/E (10.81x or 12.17x depending on vendor), sell-side targets, and all peer prices and market caps are point-in-time as of June 25, 2026 and will have moved by the time this article is read. The oil-price context is unusually volatile even by energy-sector standards: Brent fell roughly 36 percent in less than two weeks following the June 17 ceasefire.
Disputed figures. YTD 2026 total return: sources range from approximately +24 to +30 percent depending on measurement date and whether dividends are included - both ends of the range are presented without resolution. Forward P/E: StockAnalysis shows 10.81x, Yahoo Finance shows 12.17x, both as of June 25, 2026, using different NTM EPS denominators - both are presented as-is. The five-year monthly beta of 0.15 (Yahoo Finance) is a single-source figure that has not been corroborated; it is not used as a load-bearing claim.
Five-factor read in plain prose. The research points toward a Hold at $137.54 on June 25, 2026, grounded in five factors.
On valuation: XOM’s EV/EBITDA of roughly 10.5x sits roughly 34-36 percent above the 10-year historical median of about 7.83x (per GuruFocus, single source, directional). The trailing P/E of 23.16x on TTM EPS of $5.94 overstates the earnings distortion from the Q1 2026 timing effect and FY2025’s impairments, but the forward P/E of 10.81-12.17x (disputed) tells the valuation story only if 2026 EPS lands near $11.32 - a consensus set at higher Brent that will be revised downward as H2 2026 prices are incorporated. If 2026 EPS lands at $8-9 (plausible at $70 full-year Brent average), the true forward multiple is 15-17x, which is full for an oil major. The dividend yield of 3.0 percent trails the 10-year Treasury. Valuation nets to modestly overvalued versus history and rate-competitive context.
On growth: Permian production at 1.7 million boed is trending toward a company-targeted 2.5 million. Guyana is approaching 1.3 million gross barrels per day across sanctioned FPSOs. Pioneer synergies of $4 billion per year (doubled from initial guidance, VERIFIED) are still being harvested. Golden Pass Train 1 is live and Trains 2-3 follow through 2027. Chemical Products provides a real option on cycle recovery worth an estimated $2-6 billion in additional annual earnings at mid-cycle, though that recovery is 2-3 years away. Against: GAAP revenues have declined four consecutive years as commodity prices normalized, earnings growth is oil-price contingent rather than structural, and the chemical recovery timeline extends beyond 2027. Growth nets to positive, with commodity-price dependency and near-term chemical drag as the offsets.
On quality: Net debt of $32.8 billion against $52.0 billion in annual operating cash flow is a net-debt-to-OCF ratio of 0.63x, a fortress-grade debt position by any comparison among the largest industrial companies in the world. Debt-to-capital of 14.0 percent leaves ample headroom. The 43-year dividend growth streak is covered to approximately $40-45 Brent by company guidance and by the 2020 precedent. Structural cost savings of $15.1 billion through FY2025 are permanent reductions in the cost floor. The Guyana Stabroek position earns extraordinary per-barrel returns under a legally binding PSA. Against: ROCE of 9.3 percent in FY2025 was near the estimated WACC; shareholder returns exceeded FCF by $11.1 billion in FY2025, funded from the balance sheet; Chemical Products at $0.8 billion depresses blended capital efficiency. Quality nets to positive, offset by the ROCE/WACC spread being near zero in the most recent year.
On risk: The dominant risk is the plausibility of JPMorgan’s $64 2027 Brent base (an analyst estimate), supported by the IEA’s modeled 5 million barrel per day 2027 surplus. At $64 Brent, the skeptic’s EPS estimate of $5.75-6.00 for 2027 makes the current forward multiple expensive on delivered results. Shareholder returns exceeded FCF for at least one full year, requiring balance sheet support. The Massachusetts AG climate lawsuit (alleging climate deception and investor fraud; no judgment; XOM admits no wrongdoing; trial-bound after MA SJC denied dismissal March 2026) carries unquantified long-term liability. The DOJ price-gouging investigation (a reported investigation initiation per NBC News, June 24, 2026; no enforcement action) complicates the regulatory tailwind narrative. Guyana PSA political risk is a long-dated structural concern. Risk nets to negative.
On momentum and sentiment: Price at $137.54 is 22 percent below the 52-week high and below all short-to-medium term moving averages, with the 14-day RSI near 35 (approaching oversold). YTD return is solidly positive across the +24-30 percent disputed range. Sell-side consensus is constructive (Buy, 0 Sell analysts, mean target $170). BofA upgraded to Buy June 16, 2026. Short interest is extremely low at roughly 1 percent of float. Opposing signals - oversold technicals and sell-side upside versus oil-price weakness and price below moving averages - roughly offset each other. Momentum nets to neutral.
Taken together across these five factors, the overall lean is Hold. The business is exceptional; the price requires Brent to cooperate.
Legal disclaimer. The Massachusetts Attorney General’s lawsuit alleges climate deception and investor fraud. These are allegations; the Massachusetts Supreme Judicial Court denied ExxonMobil’s anti-SLAPP motion to dismiss in March 2026; the case is proceeding to trial in Suffolk Superior Court; no judgment has been entered; ExxonMobil has not admitted wrongdoing; no financial liability has been determined by a court. The Trump administration’s DOJ price-gouging investigation (June 24, 2026) is a reported investigation initiation per NBC News reporting, not a finding, charge, or enforcement action; no findings have been announced as of this writing.
This article is OSINT research, not investment advice. All figures are point-in-time as of June 25, 2026. The author holds no position in any security mentioned.