
Research date: July 1, 2026 | OSINT market research on Chevron Corporation (NYSE: CVX)
Important disclaimer. This is OSINT-based research and educational analysis, not investment advice. I am not a financial advisor. Nothing here is a recommendation to buy or sell any security, and the scenarios below are illustrative, not price targets. Oil and gas markets are volatile and subject to geopolitical, regulatory, and macroeconomic shocks; Brent and WTI crude prices in particular can move several dollars a barrel in a single session. Market caps, prices, valuation multiples, and figures throughout are point-in-time as of June 30, 2026, press-reported or filing-sourced where noted, and move fast. Do your own due diligence and consult a licensed advisor.
{
  "@context": "https://schema.org",
  "@type": ["Article", "FAQPage"],
  "headline": "CVX stock forecast: bear, base, and bull across 6 months to 5 years",
  "description": "Chevron (CVX) stock research: bear/base/bull scenarios across 6 months, 1 year, 3 years, and 5 years. Cheap at 10-11x forward, 4.2% yield, but all contingent on oil price.",
  "author": {
    "@type": "Organization",
    "name": "Market Supply Chain Research"
  },
  "datePublished": "2026-06-30",
  "dateModified": "2026-06-30",
  "articleBody": "Deep research analyzing Chevron Corporation's investment profile across multiple time horizons, from six months to five years, with detailed bear, base, and bull case scenarios based on Brent crude price assumptions.",
  "mainEntity": {
    "@type": "FAQPage",
    "mainEntity": [
      {
        "@type": "Question",
        "name": "What is the 6-month outlook for Chevron (CVX) stock?",
        "acceptedAnswer": {
          "@type": "Answer",
          "text": "In the base case with Brent crude in the mid-60s to low-70s range, CVX could drift near $170 while collecting a 4.2% dividend. The bull case assumes Brent toward $80-85 and points to roughly $188. The bear case, with OPEC+ choosing volume over price and Brent in the mid-50s, suggests roughly $148. The single dominant variable is Brent itself."
        }
      },
      {
        "@type": "Question",
        "name": "What is the 1-year forecast for CVX stock?",
        "acceptedAnswer": {
          "@type": "Answer",
          "text": "At a 1-year horizon with Brent holding the mid-60s to low-70s range, the base case points to roughly $178 as trough earnings begin to normalize and the buyback continues. The bull case, with oil above $80 and the buyback pulling the share count down, suggests around $205. The bear case, with Brent stuck near $55, projects roughly $140 on a re-expanded 'cheap' multiple."
        }
      },
      {
        "@type": "Question",
        "name": "What is the 3-year forecast for CVX stock?",
        "acceptedAnswer": {
          "@type": "Answer",
          "text": "By 3 years out, structural questions dominate: whether Tengiz's ramp delivers promised cash, whether Guyana production vessels come online on ExxonMobil's schedule, and whether return on capital employed recovers. In the base case at $67 Brent, the read is roughly $198. The bull case with oil above $85 and visible Hess accretion points to around $235. The bear case with oil stuck mid-50s to low-60s suggests roughly $135."
        }
      },
      {
        "@type": "Question",
        "name": "What is the 5-year forecast for CVX stock?",
        "acceptedAnswer": {
          "@type": "Answer",
          "text": "At the 5-year horizon, the question is whether Chevron's 2030 framework delivers more than 10% annual free cash flow and earnings growth. In the base case at $70 Brent, the stock compounds toward roughly $215 plus a growing dividend. The bull case with higher-for-longer oil at $85+ and full Guyana/Tengiz delivery points toward roughly $270. The bear case, with demand peaking early and Brent at $55-60, suggests roughly $130."
        }
      }
    ]
  }
}
Where this stock could be in 6 months, 1 year, 3 years, and 5 years
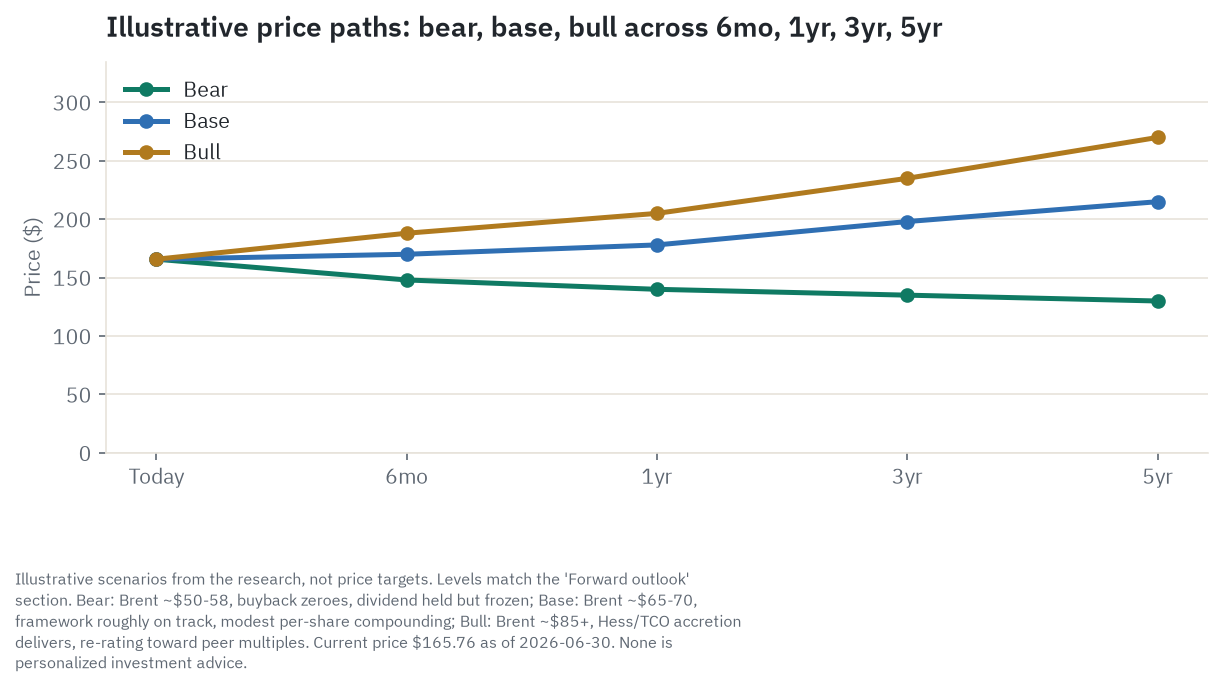
Six months. This window is almost entirely oil tape plus the next one or two earnings prints. Chevron’s own math is that after-tax earnings move roughly 550 million dollars for every dollar Brent moves, so a couple of quarters is mostly a referendum on where crude sits, not on anything the company does differently. In the base case, Brent holds in the mid-60s to low-70s, the stock drifts close to flat around 170 dollars, and a holder collects the dividend while waiting. A bull case needs Brent back toward 80 to 85, whether from a returning geopolitical premium or OPEC+ holding the line, and points toward roughly 188 dollars. The bear case is OPEC+ choosing volume over price as Iraq and the UAE keep producing above quota, pushing Brent into the mid-50s and the stock toward roughly 148 dollars on buyback-pace worry. The single variable that flips this horizon is Brent itself, specifically a decisive break below 60 or above 80.
One year. The dominant twelve-month question is whether 2026’s average Brent price lets the buyback keep running faster than the Hess-related share issuance that has been diluting the float. Base case, with oil holding the mid-60s to low-70s and trough earnings starting to normalize, points to roughly 178 dollars. A bull case, with oil above 80 and the buyback pulling the share count down for the first time since the Hess deal closed, points toward the low end of where sell-side targets already cluster, roughly 205 dollars. A bear case, with Brent stuck near 55, would zero out the buyback entirely and likely have the Street cutting forward earnings estimates back toward the current trough, re-expanding the “cheap” 10 to 11 times forward multiple into something less flattering, near 140 dollars. Watch the quarterly buyback dollar figure against the share count. That is the cleanest tell on whether the float is actually shrinking.
Three years. By this horizon the structural questions start to matter more than the daily tape: is Tengiz’s ramp delivering the cash Chevron said it would, are the next Guyana production vessels coming online on schedule under ExxonMobil’s operatorship, and is return on capital employed climbing back up from its current trough. In the base case, with the company’s 2030 framework partially delivering at around 67 dollars Brent, the read is roughly 198 dollars. The bull case, with oil above 85 and visible accretion from Hess pushing return on capital toward ExxonMobil’s level, points to a re-rating toward roughly 235 dollars. The bear case has oil stuck in the mid-50s to low-60s and returns still stuck in the mid-single digits, meaning Chevron stays exactly the laggard it has been for three and five years already, priced near 135 dollars. The flip here is the direction of return on capital employed and whether net debt is falling or still rising.
Five years. The long horizon comes down to whether Chevron’s 2030 framework, more than 10 percent annual growth in free cash flow and earnings per share, actually shows up, set against a genuinely contested debate about when global oil demand plateaus. Base case, with the framework roughly on track at 70 dollars Brent, is about 215 dollars, compounding mid-single digits in price on top of the dividend. The bull case needs higher-for-longer oil above 85 dollars meeting full delivery on Guyana and Tengiz, which would justify a multiple re-rating toward ExxonMobil’s level and points to roughly 270 dollars. The bear case has demand plateauing earlier than the company’s own planning assumes, Brent parked at 55 to 60, and the dividend held flat with no buyback running at all, near 130 dollars. What flips this horizon is structural: which of the International Energy Agency’s or OPEC’s demand forecasts turns out closer to right, and whether rising oilfield-service costs eat into the cost advantage that is Chevron’s entire moat.
Where the read lands today. On balance, the read holds at Hold, with a tilt toward accumulating on oil-driven weakness and owning the stock for the covered 4.2 percent yield rather than chasing it for a near-term re-rating. That flips up toward a stronger buy case if Brent re-establishes durably above 75 dollars and Guyana and Tengiz deliver on schedule, and it flips down toward a reduce if Brent settles below 60 for a sustained stretch and starts pressuring the buyback and the dividend’s cash coverage.
Companion tool
Jump to the interactive dashboard to sort and filter every company in this piece, or download the Excel model to flex the scenarios yourself.
TL;DR
Chevron is a fortress-balance-sheet, 39-year dividend grower trading at roughly 10 to 11 times forward earnings, a discount that only makes sense once you accept that its trailing price-to-earnings ratio near 29 to 32 times is a trough-earnings artifact, not a fair read of the business. The reason earnings look weak is simple: realized Brent crude averaged about 69 dollars in 2025, down from about 81 dollars in 2024, and Chevron’s profit moves almost dollar-for-dollar with that number because volumes barely respond to price. The 2025 Hess acquisition, a roughly 53 billion dollar all-stock deal that closed after Chevron won its arbitration fight with ExxonMobil over Guyana, added Chevron a 30 percent, non-operated stake in ExxonMobil’s giant Stabroek discovery plus Hess’s Bakken shale acreage, among the lowest-cost oil anywhere, but it has so far been dilutive rather than accretive: return on capital employed, meaning profit measured against all the capital, both equity and debt, tied up in the business, where a through-cycle 10 to 12 percent is considered healthy for an oil major, halved to 6.6 percent in 2025 and fell further to 4.5 percent in the first quarter of 2026, a clear sign of how much the oil-price trough and the newly enlarged, Hess-swollen capital base are weighing on returns. Debt rose to roughly 45 billion dollars, and the roughly 15 percent increase in shares outstanding, about 301 million new shares issued to Hess holders, has largely offset a year of buybacks rather than shrinking the float. The entire capital-return story, the dividend, the buyback, the “>10 percent” growth framework, sits on top of the oil price: the sub-50-dollar breakeven Chevron advertises covers capital spending and the dividend only, while the 10 to 20 billion dollar annual buyback needs Brent above roughly 60 dollars and effectively zeroes out below that. Berkshire Hathaway cut its Chevron stake by about 35 percent in the first quarter of 2026, and the stock has been the worst performer among its major peers on both a three-year and five-year view, so the “cheap laggard eventually re-rates” thesis has had years to prove itself and has not yet. The single biggest unresolved legal item, a 744.6 million dollar Louisiana jury verdict against Chevron over coastal erosion (one of several such coastal-erosion suits in which Louisiana parishes accuse oil and gas companies of accelerating wetland loss through decades of drilling and canal-dredging activity), was sent back to federal court by the Supreme Court in April 2026 rather than resolved, and remains a live, contested, unpaid dispute. Whether this is a name worth owning comes down to one bet: does Brent hold in the 65 to 80 dollar range long enough for Guyana and Tengiz to actually pay off.
Explore it yourself: the interactive dashboard
Open the dashboard in a full screen
What Chevron actually does
Strip away the ticker and Chevron is two businesses bolted together, plus a capital-allocation machine that decides where the cash from both of them goes. The first business is Upstream: finding oil and natural gas, drilling for it, and selling it into a global benchmark price that Chevron does not set and cannot influence, Brent for most of the world’s crude and WTI for the US barrel. The second is Downstream: buying crude (often, but not always, its own) and running it through refineries to make gasoline, diesel, jet fuel, and petrochemical feedstock, capturing whatever spread exists between the crude price and the finished-product price. In 2025, Upstream earned 12.8 billion dollars and Downstream earned 3.0 billion dollars; the two do not sum cleanly to the reported 12.3 billion dollars of net income because of roughly 3.5 billion dollars of corporate costs, interest expense, and pension items that sit below the segment lines.
Think of Chevron’s asset base as a barbell rather than a single pile of oil wells. On the low-cost end sits Guyana, the Stabroek Block offshore development that Chevron picked up through its 2025 acquisition of Hess Corporation, where a 30 percent, non-operated interest, ExxonMobil runs the block and controls the pace of new production vessels, sits alongside some of the cheapest oil in the industry, with producing-project costs estimated around 30 dollars a barrel. Also on the low end is Tengiz, the giant Kazakhstan field known as TCO, where Chevron is the largest owner and the operator, and where a recently completed expansion project pushed output toward roughly a million barrels a day gross. On the higher-cost end of the barbell sits the Permian Basin in west Texas and New Mexico, Chevron’s largest single US position and a mature area where new-well costs across the industry have climbed toward roughly 67 dollars a barrel, even though Chevron’s own legacy, largely royalty-free acreage there is cheaper than that industry average. In between sits the deepwater Gulf of America, where new technology capable of handling extremely high well pressures has opened fields that used to be considered too deep and too hot to develop economically.
Downstream is smaller by profit but not by revenue: Chevron runs five wholly owned US refineries, in Richmond and El Segundo, California, Salt Lake City, Pascagoula, Mississippi, and Pasadena, Texas, processing close to a million barrels a day, plus joint-venture refining stakes across Asia-Pacific that the company has been quietly shrinking, including a pending sale of its Singapore-area assets. A slice of the refined feedstock flows into Chevron Phillips Chemical, a 50-50 joint venture with Phillips 66 that converts it into the basic building blocks of plastics, ethylene and polyethylene, sold into industrial and consumer end markets far removed from a gas pump. None of this downstream business exists to make Chevron rich; it exists to partially offset the swings in the much larger Upstream business, because refining margins are driven by a different demand cycle, the demand for finished fuel, than crude oil prices are. The mechanism runs like this: when crude oil falls, refiners buy cheaper feedstock while pump and diesel prices tend to adjust downward more slowly, so the crack spread, the margin between the cost of crude and the price of the refined product, typically widens; when crude spikes, that same lag runs in reverse and squeezes the margin. Downstream earnings therefore often move partly opposite to Upstream earnings, cushioning the swing rather than eliminating it, since finished-fuel demand and refinery utilization matter just as much as the direction of the crude price. It is a partial offset, not a full hedge, which is exactly why Downstream’s own profit still fell alongside Upstream’s over the past two years rather than rising to compensate for it.
How the money flows
flowchart TD
    TOP["Global oil & gas demand: Brent/WTI/Henry Hub benchmark prices"]
    TOP --> RES["Reserves: Permian, TCO Kazakhstan, Guyana Stabroek, Gulf of America"]
    RES --> PERM["Permian Basin: ~1 MMBOE/d gross, breakeven ~$37-44/bbl"]
    RES --> TCO["TCO Tengiz (Chevron 50%): ~1 MMBOE/d gross post-FGP"]
    RES --> GUY["Guyana Stabroek (30% via Hess): breakeven ~$25-35/bbl"]
    RES --> GOA["Gulf of America deepwater: new wells ramping"]
    OFS["Oilfield services toll-takers: SLB, Halliburton, steel/OCTG"] --> PERM
    OFS --> TCO
    OFS --> GOA
    TCO --> CPC["CPC pipeline chokepoint: >80% of Kazakh exports, routes via Russia"]
    CPC --> UPCASH["Upstream cash flow: $12.8B 2025 earnings"]
    PERM --> UPCASH
    GUY --> UPCASH
    GOA --> UPCASH
    UPCASH --> REFIN["Refining: 5 US refineries ~1 MMbbl/d + Asia-Pacific JVs"]
    REFIN --> CPCHEM["CPChem 50/50 JV with Phillips 66: ethylene/polyethylene"]
    REFIN --> DOWNCASH["Downstream cash flow: $3.0B 2025 earnings, crack-spread driven"]
    UPCASH --> OCF["Operating cash flow"]
    DOWNCASH --> OCF
    OCF --> DIV["Dividend: 39th straight annual raise, $1.78/qtr"]
    OCF --> CAPEX["Organic capex: $18-19B guided for 2026"]
    OCF --> BUYBACK["Buybacks: flexible $10-20B/yr framework through 2030"]
    OCF --> BAL["Balance sheet / debt paydown"]
Follow the diagram from the top down and Chevron’s money starts underground, before a single barrel is even sold. (The diagram’s “MMBOE/d” shorthand means million barrels of oil equivalent per day, BOE/d for short, the standard unit that normalizes both oil and natural gas output into one comparable figure.) Every asset in the reserve base, Permian, Tengiz, Guyana, and the Gulf of America, carries its own cost of supply, the breakeven price at which the project clears its capital and operating costs. That is the barbell described above: Guyana and Tengiz around 30 to 32 dollars a barrel, Permian nearer 40 dollars on Chevron’s own legacy acreage (though the industry-wide new-well average has climbed to about 67 dollars). Oilfield service companies, drilling contractors, and steel-pipe suppliers sit as toll-takers on every one of these projects, collecting their cut of the well cost regardless of what price Chevron eventually realizes for the oil, which is why a rising services-cost index is a direct threat to the whole cost-of-supply advantage. That threat is already visible, not hypothetical: the Dallas Federal Reserve’s regional energy survey shows the industry-wide average Permian new-well breakeven climbing to about 67 dollars a barrel from 65 dollars a year earlier, and the same service-cost pressure applies to Guyana’s offshore installation work and Tengiz’s expansion activity. Chevron’s own 3-to-4-billion-dollar structural cost-cutting program, of which 1.5 billion dollars was delivered in 2025, is running directly against that inflation rather than banking a permanent advantage, which means the 30-dollar Guyana and 40-dollar Permian breakevens quoted throughout this piece are a current snapshot, not a fixed floor, and should be treated as directional rather than locked in for the next five years.
Tengiz’s crude has an unusual final step before it becomes cash: essentially all of it leaves Kazakhstan through the Caspian Pipeline Consortium, a single pipeline carrying more than 80 percent of the country’s crude exports to a Russian Black Sea terminal, Novorossiysk. That is a real chokepoint that Chevron does not control, kept open only through specific US Treasury sanctions exemptions that could, in theory, be revoked or disrupted by damage to Russian port infrastructure. Once the oil and gas clear production and export, whatever is left after royalties, lifting costs, and depreciation becomes Upstream cash flow, 12.8 billion dollars of it in 2025, which combines with the smaller, crack-spread-driven Downstream cash flow to form operating cash flow.
What happens to that operating cash flow is Chevron’s most disciplined, most public habit: the dividend gets paid first and is treated as close to untouchable, the company raised it for a 39th straight year in January 2026. Organic capital spending, guided at 18 to 19 billion dollars for 2026, comes next. Only after both of those are funded does management turn to the buyback, a flexible 10 to 20 billion dollar annual program through 2030 that management has explicitly said will scale up or down with the oil price. That last step, the buyback, is the shock absorber in the whole system. It is also, as the sections below lay out, the piece of the capital-return story that is genuinely at risk if crude prices weaken.
The asset portfolio: from Permian shale to Guyana’s giant discovery
Guyana (Stabroek Block). Chevron’s 30 percent stake here, picked up entirely through the 2025 Hess acquisition, is the newest and generally the lowest-cost barrel in the portfolio, with producing-project breakevens estimated around 30 dollars per barrel. It is critical to understand what “30 percent” means in practice: ExxonMobil operates the block with a 45 percent interest, and CNOOC holds the remaining 25 percent, so Chevron does not control the pace of new development, the capital budget, or the timing of new production vessels coming online. The block has discovered more than 11 billion barrels of oil equivalent in recoverable resources, and the operating partnership plans to have eight floating production vessels installed by 2030. Chevron picked up its stake only after an ICC arbitration panel ruled in mid-2025 that the Hess acquisition, as a whole-company transaction, did not trigger ExxonMobil’s right of first refusal over the Stabroek joint-operating agreement, a ruling that let the deal close.
Tengiz, Kazakhstan (TCO). Chevron owns 50 percent of this giant, low-decline field and operates it, alongside ExxonMobil’s Kazakhstan unit at 25 percent, the state oil company KazMunayGas at 20 percent, and Lukoil at 5 percent. A roughly 47 billion dollar expansion project reached first oil in January 2025, adding about 260,000 barrels a day of capacity and pushing total gross field output toward roughly a million barrels a day. Tengiz’s economics are excellent on paper, but every barrel it produces has to travel the Caspian Pipeline Consortium route through Russia to reach the water, the single geopolitical exposure that shows up repeatedly in Chevron’s own risk disclosures.
Permian Basin. Chevron’s largest US onshore position reached its own internal target of about a million barrels of oil equivalent a day in 2025 and has stayed above that level for several consecutive quarters. Management’s stated plan is to hold Permian output near that million-barrel level through 2040 rather than keep growing it, deliberately freeing up capital for the dividend and the buyback instead of chasing further volume. That decision matters because it means Permian’s role in the portfolio has shifted from growth engine to cash machine, even as industry-wide new-well breakevens there have climbed toward roughly 67 dollars a barrel on rising service costs.
Gulf of America deepwater. Chevron and partners brought the Anchor project onstream in 2024 using industry-first technology capable of handling 20,000 pounds per square inch of well pressure at roughly 34,000 feet below the sea floor, a breakthrough the company believes could unlock more than 5 billion barrels of previously stranded deepwater resource globally, not just in its own portfolio. Several other deepwater projects, Ballymore, Stampede, and Whale, ramped further in 2025, and a new discovery, Bandit, was disclosed in the first quarter of 2026.
Australia LNG (Gorgon and Wheatstone). These two liquefied natural gas facilities, three processing trains at Gorgon and two at Wheatstone, together account for a meaningful share of global LNG supply and carry oil-linked pricing formulas, meaning they behave more like an oil-price-sensitive gas business than a pure gas play. Both had cyclone-related disruptions in early 2026 that were resolved by late March.
Downstream and CPChem. Five wholly owned US refineries plus non-operated joint-venture refining stakes across Asia-Pacific make up the physical Downstream business, alongside the CPChem petrochemicals joint venture with Phillips 66. This is the segment most likely to move opposite to crude prices in a given quarter, though the correlation is not tight or guaranteed, and it is being deliberately shrunk in lower-return regions like Southeast Asia even as domestic US refinery throughput hit its highest level in twenty years in 2025.
Who wins where
Chevron sits in a value chain with a small number of distinct winners, and understanding who they are explains why the company’s own moat is narrower than it sounds. At the very top, the global oil price itself is set by OPEC+ and by worldwide demand, and no single producer, Chevron included, has any pricing power over that number. Below that, the winners split into four groups. The advantaged-barrel owners, Chevron among them alongside ExxonMobil in Guyana and the low-cost Permian operators, capture outsized economics specifically in a downturn, because their wells stay profitable at prices that would shut in higher-cost competitors. The oilfield-services companies, SLB, Halliburton, and the steel-pipe suppliers that build and maintain every well, are toll-takers who get paid roughly the same cut of a well’s cost whether Chevron ultimately sells that oil for 50 dollars or 100 dollars a barrel, which means rising service costs quietly eat into the advantaged-barrel owners’ edge rather than the other way around. The refiners and chemical makers capture a separate, thinner, crack-spread-driven margin that runs on its own cycle. And the equity holder captures whatever is left after all of that, through the strict capital-allocation waterfall described above.
Compare Chevron to its direct integrated peers and the picture sharpens. ExxonMobil is larger on every measure, produces more, spends more on capital projects, and returns more cash to shareholders in absolute dollars, and it has consistently earned a higher return on capital employed than Chevron, roughly 9.3 percent in 2025 against Chevron’s 6.6 percent. Yet Chevron trades at a discount to ExxonMobil on enterprise-value-to-EBITDA, about 9.7 times against ExxonMobil’s 10.8 times, which is either a mispricing waiting to close or the market correctly reflecting that Exxon’s balance sheet and returns profile deserve the premium. The European majors, Shell, BP, and TotalEnergies, generally trade at lower multiples than the US names for the same set of assets, a persistent valuation gap tied to domicile, regulatory posture, and, in BP’s case, a history of strategy reversals that has cost it credibility with investors. The pure exploration-and-production names, ConocoPhillips, Occidental, and EOG, carry no downstream refining business at all, meaning their results move even more directly with the oil price than Chevron’s do, for better or worse.
Company by company: who’s who
Chevron Corporation (CVX), NYSE. Market capitalization approximately 328 billion dollars as of June 30, 2026, at a share price of 165.76 dollars. The second-largest US integrated major behind ExxonMobil, running upstream production across the Permian, the Gulf of America, Kazakhstan, and, since the 2025 Hess acquisition, Guyana, plus downstream refining and the CPChem petrochemicals joint venture. First-quarter 2026 net income was 2.21 billion dollars (adjusted 2.79 billion dollars, adjusted earnings per share of 1.41 dollars, beating consensus estimates of 0.95 dollars), with worldwide production of 3,858 thousand barrels of oil equivalent a day, up about 15 percent year over year on the Hess integration plus Permian and Gulf of America growth, and 6.0 billion dollars returned to shareholders through dividends and buybacks that quarter. Bull: the Hess deal bolted on low-cost Guyana growth atop an already dominant Permian position, funding the group’s largest capital-return program. Bear: the same quarter’s net income was among the lowest in five years, showing margin compression at a mid-cycle oil price, and the Hess integration and its years-long Guyana arbitration fight remain lingering overhangs on returns.
ExxonMobil Corporation (XOM), NYSE. Market capitalization approximately 566.6 billion dollars, roughly 1.7 times Chevron’s size and the largest US oil major. First-quarter 2026 GAAP net income was 4.2 billion dollars, a five-year low for Exxon too, hit by hedge-timing effects tied to volatile oil prices; adjusted earnings were 4.9 billion dollars (adjusted earnings per share 1.16 dollars, a beat), on production of 4.6 million barrels of oil equivalent a day including record Guyana output above 900,000 gross barrels a day. Bull: the scale leader, with the group’s strongest balance sheet and a Permian-plus-Guyana growth engine outgrowing peers. Bear: the same quarter showed high sensitivity to geopolitical price shocks and hedge-timing mismatches, and the stock trades at a premium multiple that already prices in its quality.
Shell plc (SHEL), primary listing London, NYSE ADR. Market capitalization approximately 216.9 billion dollars, the largest European major and the world’s largest LNG trader. First-quarter 2026 adjusted earnings were 6.9 billion dollars, up 23 percent year over year and above consensus; net income attributable to shareholders was 5.7 billion dollars, and the company announced a new 3 billion dollar buyback plus a 5 percent dividend increase to 0.3906 dollars a share. Bull: an unmatched global LNG trading franchise paired with buyback discipline that has outrun peers on capital returns. Bear: the European domicile still draws a lower valuation multiple than the US majors, and the portfolio carries legacy, lower-return downstream and chemicals assets.
BP p.l.c. (BP), primary listing London, NYSE ADR. Market capitalization approximately 95.8 billion dollars, the smallest of the majors profiled here. First-quarter 2026 underlying replacement-cost profit was 3.2 billion dollars, up 128.6 percent year over year on strong oil trading and refining margins, with production of about 1.54 million barrels of oil equivalent a day and the dividend held flat at 8.32 cents a share. Bull: the cheapest major on most valuation multiples, with activist pressure, including from Elliott Management, pushing capital discipline, and a genuine trading and refining beat this quarter. Bear: the smallest balance sheet and highest relative debt load among the majors, plus a credibility deficit after repeated strategy reversals between renewables and core oil and gas. That trading beat is a single-quarter print off a weak base, not yet a durable earnings pattern.
TotalEnergies SE (TTE), primary listing Paris, NYSE ADR. Market capitalization approximately 172.6 billion dollars, the second-largest European major behind Shell. First-quarter 2026 adjusted net income was 5.4 billion dollars, up 28.6 percent year over year, with adjusted EBITDA of 12.6 billion dollars and cash flow of 8.6 billion dollars. Bull: the most diversified major across oil, gas, LNG, and power. Bear: the French primary listing and ADR structure mean thinner US liquidity than the NYSE-domiciled names, and a meaningful African asset base carries elevated political and expropriation risk.
ConocoPhillips (COP), NYSE. Market capitalization approximately 126.7 billion dollars, the largest pure-play US exploration-and-production company with no downstream refining, spanning the Permian, Eagle Ford, Bakken, and Alaska’s Willow project, plus assets absorbed in the 2024 Marathon Oil acquisition. First-quarter 2026 net income was 2.18 billion dollars, down from 2.85 billion dollars a year earlier on weaker natural gas and natural-gas-liquids pricing, with adjusted earnings per share of 1.89 dollars, a beat, production of 2,309 thousand barrels of oil equivalent a day, and 2.0 billion dollars returned to shareholders. Bull: the lowest-cost large-cap E&P with pure commodity-price leverage and a disciplined buyback-plus-dividend framework. Bear: no downstream business to hedge commodity swings, and still-digesting integration risk from the Marathon Oil deal.
Occidental Petroleum Corporation (OXY), NYSE. Market capitalization approximately 48.3 billion dollars, the smallest name here by market cap but the most levered to Permian and to direct-air-capture optionality, roughly 27 percent owned by Berkshire Hathaway. First-quarter 2026 net income attributable to common stockholders was 3.2 billion dollars (earnings per share 3.13 dollars, including a gain on the OxyChem sale); adjusted income from continuing operations was 1.1 billion dollars (adjusted earnings per share 1.06 dollars, beating consensus of 0.59 dollars by roughly 80 percent). Bull: Berkshire Hathaway’s large, long-held stake as a credibility anchor, top-tier Permian scale, and optionality on direct air capture if carbon-removal economics mature. Worth noting: Berkshire trimmed its other big energy position, Chevron, by about 35 percent in the same quarter, which softens how much weight the Occidental anchor argument should carry. Bear: the highest financial leverage among these peers, unproven direct-air-capture economics, and typically the most volatile stock of the group on oil-price swings.
EOG Resources, Inc. (EOG), NYSE. Market capitalization approximately 69.1 billion dollars, a premier US shale operator with no refining exposure across the Delaware Basin, Eagle Ford, and Utica. First-quarter 2026 net income was 1.98 billion dollars (diluted earnings per share 3.70 dollars); adjusted net income was 1.825 billion dollars (adjusted earnings per share 3.41 dollars), with 1.5 billion dollars of free cash flow and 544 million dollars in dividends plus 402 million dollars in buybacks. Bull: best-in-class shale full-cycle returns, a clean balance sheet, and consistent capital discipline through the cycle. Bear: smaller scale than the integrated majors, no downstream offset, and a pure-play bet on supportive oil and gas prices.
What the filings say
Figures below are drawn from Chevron’s FY2025 Form 10-K (filed February 24, 2026), its Q1 2026 Form 10-Q (filed May 7, 2026), Q1 2026 and Q4 2025 earnings releases, and the 2026 proxy statement, all point-in-time as of the filing date noted.
The income statement is a three-year story of falling prices, not falling volumes. Sales and other operating revenue declined for a third straight year, from 196.9 billion dollars in 2023 to 193.4 billion dollars in 2024 to 184.4 billion dollars in 2025. Net income attributable to Chevron fell more sharply, from 21.4 billion dollars in 2023 to 17.7 billion dollars in 2024 to 12.3 billion dollars in 2025, with diluted earnings per share dropping from 11.36 dollars to 9.72 dollars to 6.63 dollars over the same span. Return on capital employed, the company’s own preferred profitability measure, fell from 11.9 percent in 2023 to 10.1 percent in 2024 to 6.6 percent in 2025, and continued falling to 4.5 percent in the first quarter of 2026. The mechanism behind all of this is realized price, not lost volume: average realized Brent fell from about 81 dollars a barrel in 2024 to about 69 dollars in 2025, and Chevron’s own sensitivity, roughly 550 million dollars of after-tax earnings per dollar move in Brent, explains most of the gap. Management attributed most of the first-quarter 2026 year-over-year decline (2.2 billion dollars reported versus 3.5 billion dollars a year earlier) to about 2.9 billion dollars of timing effects from mark-to-market and inventory accounting, plus a 360 million dollar legal-reserve charge, rather than to any change in underlying operations.
Upstream generates essentially all of Chevron’s profit; Downstream is the volatile, smaller earner. In 2025, US and International Upstream together earned 12.8 billion dollars, versus 3.0 billion dollars for Downstream (US and International combined), with a roughly 3.5 billion dollar drag from corporate costs, financing, and pension items bringing the total to the reported 12.3 billion dollars. Downstream’s contribution swings hard by year: it earned 6.1 billion dollars in 2023, more than either segment earned in 2025, showing how much refining-margin cycles can move this business independent of the crude price. Worldwide production reached 3,723 thousand barrels of oil equivalent a day in 2025, up 12 percent from 3,338 thousand in 2024, and continued to 3,858 thousand in the first quarter of 2026, up 15 percent year over year, with the Hess acquisition (Guyana and Bakken) and Permian and Gulf of America growth driving the increase.
Cash flow held up better than earnings, but free cash flow is more oil-price-sensitive than it looks. Cash flow from operations was 33.9 billion dollars in 2025, actually up from 31.5 billion dollars in 2024, helped by higher Tengiz cash distributions and legacy-Hess contributions. Capital expenditure was 17.3 billion dollars, and free cash flow, cash flow from operations minus capital expenditure, was 16.6 billion dollars in 2025 versus 15.0 billion dollars in 2024 and 19.8 billion dollars in 2023. On an adjusted basis, stripping out working-capital timing, adjusted free cash flow was 20.2 billion dollars in 2025, 21.3 billion dollars in 2024, and 23.3 billion dollars in 2023, a flatter and gentler decline than the headline free-cash-flow number suggests, but a decline all the same. In the first quarter of 2026, a working-capital swing pushed reported free cash flow briefly negative, about negative 1.5 billion dollars, even though adjusted free cash flow was a healthier positive 4.1 billion dollars.
The balance sheet absorbed the Hess deal without threatening the credit rating, but leverage rose materially. Total debt jumped to 40.8 billion dollars at the end of 2025 from 24.5 billion dollars a year earlier, reflecting about 10.0 billion dollars of debt and finance leases assumed in the Hess acquisition (roughly 3.7 billion dollars of which is non-recourse Hess Midstream debt) plus 11.2 billion dollars of new bonds issued during the year. By the first quarter of 2026, total debt had risen further to roughly 45.4 billion dollars. Net debt rose to 34.5 billion dollars from 17.8 billion dollars, and the net-debt ratio climbed to 15.6 percent from 10.4 percent, still a conservative balance sheet by oil-major standards, and Chevron kept its AA-minus and Aa2 senior credit ratings from S&P and Moody’s through the deal.
Dividends kept growing; buybacks did not shrink the float. 2025 marked Chevron’s 39th consecutive year of raising the annual dividend per share. The board lifted the quarterly rate 4 percent to 1.78 dollars in January 2026, reaffirmed for the June 2026 payment, and total dividends paid rose to 12.8 billion dollars in 2025 from 11.8 billion dollars in 2024. Under a 2023 buyback authorization of 75 billion dollars with no expiration date, Chevron repurchased 79.9 million shares for 12.1 billion dollars in 2025, bringing the cumulative program total to 250.8 million shares and 38.5 billion dollars, leaving 36.5 billion dollars of authorization outstanding. Despite that spending, weighted-average diluted shares rose from 1,817 million in 2024 to 1,856 million in 2025, because the Hess deal itself issued about 301.25 million new Chevron shares, roughly 15 percent of the post-close share count, more than offsetting a full year of buybacks. Shares outstanding stood at 1,992,285,560 as of the March 16, 2026 proxy record date.
Management’s own guidance and cost program. The FY2025 10-K guided 2026 organic capital expenditure of 18 to 19 billion dollars (roughly 17 billion dollars of it Upstream, including about 6 billion dollars for US shale and tight-oil assets and about 7 billion dollars for global offshore growth in Guyana, the Eastern Mediterranean, and the Gulf of America), alongside a structural cost-reduction target of 3 to 4 billion dollars cumulative by the end of 2026, of which 1.5 billion dollars was delivered in 2025.
Disclosed risks that matter most. Chevron’s own 10-K leads with commodity-price exposure, warning that extended periods of low prices have had, and can again have, a material adverse impact, a risk that is more concentrated now that Upstream generates essentially all of segment profit. The 10-K separately flags the Hess integration and Tengiz’s dependence on the equity affiliate structure, noting Tengiz equity income fell from 3,033 million dollars in 2024 to 1,556 million dollars in 2025 even as its expansion project ramped, and that essentially all of its crude exits through the Caspian Pipeline Consortium route through Russia, a route the filings repeatedly tie to the Russia-Ukraine conflict as a named risk factor. The most legally consequential disclosed item is Louisiana coastal litigation: a jury awarded Plaquemines Parish 744.6 million dollars against Chevron entities in April 2025 in the Rozel case, against which Chevron has accrued only 131 million dollars, calling the verdict unsupported. The US Supreme Court ruled in April 2026 that the case belongs in federal court and sent it back for further proceedings, so the exposure remains open, not settled, and not paid. Separately, Chevron is a named codefendant in 34 US climate-change lawsuits where the company states it is unable to estimate any range of possible liability, and it frames the allegations as legally and factually meritless.
Who owns the stock. Per the 2026 proxy, the largest holders are index and asset managers: Vanguard at 8.56 percent, State Street at 7.50 percent, and BlackRock at 7.00 percent. Berkshire Hathaway had been a long-standing strategic holder, but its position looks different today than the proxy’s own record-date snapshot suggests. Berkshire’s Q1 2026 13F filing shows the firm cut its Chevron stake by roughly 35 percent, selling more than 45 million shares worth roughly 8 billion dollars at an average price near 182.59 dollars, taking its remaining position down to about 4.2 percent of the company, roughly 84.4 million shares. The proxy’s 6.70 percent figure, tied to an earlier record date, is now stale; the 13F cut is the more current read. Berkshire has historically behaved as a patient, long-only holder of quality businesses rather than a trader, so a firm with that reputation trimming about a third of a large, long-held energy position, and doing so at an average price above where the stock trades today, reads as a caution signal on risk-reward at this oil price, worth weighing even though 13F filings disclose the trade itself, not the motive behind it. On the insider side, John B. Hess, founder and former chief executive of Hess Corporation who joined Chevron’s board through the acquisition, sold 380,000 shares across seven tranches in May 2026 at prices between 191.52 and 197.45 dollars, roughly 73 to 75 million dollars gross. That reads more like diversification by a newly merged, concentrated shareholder than a signal about Chevron’s outlook specifically.
What the market is paying
All figures below are point-in-time as of June 30, 2026, unless otherwise noted, and move fast; oil prices especially can shift daily.
Chevron closed at 165.76 dollars on June 30, 2026, down 1.6 percent on the day, sitting in the lower third of its 52-week range of roughly 142.40 to 214.71 dollars, about 16 percent above the low and 23 percent below the high. On a price-return basis (excluding the roughly 4.2 percent dividend yield the stock also throws off), Chevron is up about 8.8 percent over six months and year-to-date but has trailed the S&P 500 and its own peer group on every window beyond one month: over three years, Chevron is up only about 7.5 percent versus ExxonMobil’s 32.5 percent, the energy sector ETF’s 31.5 percent, and the S&P 500’s 70.5 percent; over five years, Chevron’s roughly 59.3 percent trails ExxonMobil’s 123.3 percent, Shell’s 89.4 percent, TotalEnergies’ 75.4 percent, and even ConocoPhillips’ 72.9 percent. Chevron is, on these figures, the clear laggard among the majors on a multi-year view, a gap most plausibly tied to the years-long Guyana arbitration overhang that only resolved in mid-2025 and to the dilution from roughly 301 million shares issued to Hess shareholders. Its five-year monthly beta of about 0.47 looks low for an oil major, though that statistical calmness masks real swings: the 52-week high-to-low span implies a peak-to-trough decline of roughly 33 to 34 percent over the trailing year.
Valuation is where the story turns from “expensive laggard” to something more interesting. Trailing price-to-earnings sits around 29 to 32 times depending on the data source, which looks rich against Chevron’s own five-year median near 15.6 times. But that trailing multiple is a trough-earnings artifact: the forward price-to-earnings ratio collapses to roughly 10 to 11 times, reflecting a Street expectation that earnings recover sharply from today’s depressed, Hess-integration-cost-laden base. On enterprise value to EBITDA, Chevron trades at about 9.7 times against ExxonMobil’s 10.8 times, a discount to its closest peer that is more consistent with a post-acquisition-integration discount than with a structurally cheaper business. Price-to-free-cash-flow near 23.8 times and enterprise-value-to-free-cash-flow near 26.7 times look expensive in isolation, but they are distorted the same way trailing earnings are, by capex and deal-related cash costs that are temporarily elevated, not by any shrinkage in the underlying cash-generative capacity of the business. The honest summary: Chevron screens expensive on trailing multiples and cheap to fair on forward multiples and on its enterprise-value discount to ExxonMobil.
The dividend is the clearest reason to own the name for income: a roughly 4.2 to 4.3 percent yield (7.12 dollars annualized on the current 1.78-dollar quarterly rate), backed by a 39-year streak of increases. The trailing payout ratio of about 121 percent looks alarming in isolation, but it is a GAAP-earnings artifact of the same depressed trailing earnings described above; free cash flow of about 16.6 billion dollars in 2025 still covered the roughly 12.8 billion dollars actually paid in dividends that year, even if that coverage margin has narrowed considerably from prior years (one industry tracker puts free-cash-flow-to-dividend coverage at roughly 3.4 times in 2022, collapsing to around 1.3 times by 2025, a figure worth treating as directional given it comes from a single press source rather than Chevron’s own disclosure). Liquidity is not a concern: average trading volume runs 9 to 10 million shares a day, and short interest sits low, around 1.15 to 1.2 percent of float, below the peer-group average, meaning this is not a name the market is positioned against.
Sell-side analysts are constructively bullish but disagree meaningfully on the exact target. Two vendors, stockanalysis.com and TipRanks, cluster near a mean price target of roughly 217 dollars from 19 to 24 analysts; a third, MarketBeat, is an outlier with a mean target of 205.52 dollars from 25 analysts including 18 buys, 6 holds, and 1 sell. All three agree the consensus rating leans bullish, implying meaningful double-digit upside from the current price, but the roughly 12-dollar spread between vendors is itself informative: treat any single point figure with caution and read the range, roughly 205 to 220 dollars, as the honest picture rather than a precise number.
What the crowd is saying
The dominant news narrative through mid-2026 is warming, not cooling: coverage has centered on Hess integration execution, the production ramp (Guyana and Bakken volumes flowing in, Tengiz hitting record output in the first quarter), and the capital-returns drumbeat, the 39th straight annual dividend increase and a flexible multi-year buyback framework. A secondary storyline has attached itself to Chevron’s June 2026 power-supply agreement with Microsoft for a West Texas data center, framed in some coverage as “Chevron enters the AI power race.” That framing is legitimate reporting on a real deal, a roughly 2.67-gigawatt gas-fired power project targeted for first power in 2028, but it is incremental against Chevron’s roughly 18 to 19 billion dollar annual capital budget and should not be read as a pivot away from oil and gas.
Retail and social sentiment tells a much quieter story than the news headlines. StockTwits chatter has cooled from bullish to neutral with normal, not elevated, message volume, and Reddit mentions are sparse and organic, with no sign of coordinated promotion or thin-float hype. The dominant retail framing is “stable, high-yield cash machine with Guyana upside,” an income thesis rather than a speculative one, and attention trends are flat to slowly declining as retail focus has shifted elsewhere in 2026, toward artificial intelligence and semiconductor names and toward bonds. None of this points to a manipulation risk; Chevron is simply not where the speculative retail money is right now, and that itself is a useful, if soft, signal that the stock is trading on fundamentals rather than hype.
Employee sentiment is the one internal signal worth naming honestly. Chevron’s Glassdoor rating sits at 3.6 out of 5, roughly in line with the broader energy and utilities industry average, though the specific claim that it has fallen 7 percent over the past year could not be independently confirmed and should be treated as unverified. Reviews describe frequent reorganizations, job-security concerns, and a sense among some employees that leadership credibility is thin, a plausible byproduct of combining two large organizations through the Hess integration. This is a soft signal, self-selected and impossible to pin to a specific division, but it is a real data point suggesting internal friction that quarterly production and earnings numbers do not capture.
The sharpest divergence worth naming plainly: the crowd’s story, a safe, high-yield dividend compounder executing a clean Hess integration with Guyana and Tengiz providing multi-year upside, assumes oil prices cooperate. The filings tell a narrower story: free cash flow, the dividend’s true cash-coverage cushion, and the buyback’s very existence are all highly sensitive to where Brent actually sits, and one of the world’s most patient, long-only energy investors, Berkshire Hathaway, chose this exact period to sell roughly a third of its Chevron position. Whatever Berkshire’s specific motive (the filing states none, and none should be assumed), the action itself sits uncomfortably next to the “own the cheap compounder” framing that dominates retail chatter.
Durability: what has to keep being true, and what could break it
The structural case for durability rests on three legs. First, oil demand is the most diversified demand base this kind of analysis typically covers: roughly 55 to 60 percent transport fuel, split across gasoline, diesel, jet fuel, and marine bunker, funded by global economic activity and miles driven rather than by any single customer’s budget cycle, unlike a supplier dependent on a handful of large corporate buyers. Second, US shale, the marginal producer that historically capped oil prices whenever they rose, has structurally lost some of that role: the Energy Information Administration now forecasts US crude output actually declining slightly in 2026 for the first time since the pandemic, with the Permian, the last major growth basin, plateauing on cost inflation and capital discipline rather than running out of resource. That removes a natural ceiling that existed for roughly a decade. Third, natural gas and LNG demand growth is real and comparatively uncontested, unlike oil: US LNG export capacity is expanding to roughly 16.7 billion cubic feet a day in 2026 from 15.1 billion the year before as new export terminals ramp, underwriting a growing, somewhat less cyclical revenue stream for a company with Chevron’s Australian LNG position.
The cyclical case against it is just as real, and the trigger is identifiable. Oil cycles have historically ended one of a few ways: a demand-side shock, typically a recession; an OPEC+ cohesion breakdown that floods the market with supply; a shale overshoot; or a geopolitical premium unwinding once a disruption clears. The most visible crack in the current cycle is the second path: OPEC+ still holds roughly 3.6 million barrels a day of voluntary cuts off the market, but Iraq and the United Arab Emirates have both been producing above their assigned quotas, quietly eroding the group’s real spare capacity below the headline figure and leaving Saudi Arabia carrying a disproportionate share of the restraint. That is the textbook late-cycle dynamic that has broken down before, in 2014 and in 2020, and a similar break here, combined with any demand-side softening from a hard economic landing, is the single clearest path to Brent prices in the 30s or 40s that would test Chevron’s stated sub-50-dollar capital-spending-and-dividend breakeven directly, not just its buyback.
The most likely outcome, on the evidence gathered here, is neither extreme. A range-bound Brent price somewhere between roughly 65 and 80 dollars through the back half of 2026 sits comfortably above the industry’s rising shale-marginal-cost floor (Permian breakevens near 67 dollars) but below any renewed crisis-level spike, and this band sits close enough to Chevron’s own 70-dollar planning assumption that its 2030 targets, more than 10 percent annual free-cash-flow and earnings-per-share growth, an improvement in return on capital employed of more than 3 percentage points, remain achievable without requiring a bull case on price. The tail risk, a demand-led downturn compounding with an OPEC+ discipline break, carries a real, non-trivial probability and would be the scenario that tests the dividend’s cash coverage directly rather than just throttling the buyback.
The scenarios in detail
Every dollar figure and coverage ratio below is an illustrative estimate built from the assumptions stated, not a Chevron forecast, not a price target, and not personalized advice. The bull, base, and bear levels here match the chart at the top of this article.
The driver tree
Four variables decide most of what happens to Chevron over the next five years, and three of the four are downstream of the first.
- Brent, the master variable. Chevron’s own sensitivity, roughly 550 million dollars of after-tax earnings per dollar move in Brent, means earnings, free cash flow, return on capital employed, and the buyback all flex almost linearly with the oil price, because production volumes barely respond to it. Every scenario below starts as a Brent band.
- The capital-return stack, where the dividend is defended and the buyback is discretionary. The sub-50-dollar Brent breakeven Chevron advertises covers capital spending and the dividend only, with nothing left over. Above that floor, each extra dollar of Brent adds roughly 550 million dollars of after-tax cash, and that incremental cash is what funds everything else. On today’s post-Hess share count of about 1.98 billion shares, the annual dividend obligation runs above 14 billion dollars, and it takes most of what Brent generates in the 50-to-60-dollar band, which is why dividend coverage itself runs only about 0.67 times at 55 dollars, improves to about 1.09 times at 65 dollars, and reaches a comfortable 1.51 times at 75 dollars. The 10 to 20 billion dollar annual buyback, the mechanism behind most of the company’s “double-digit earnings-per-share growth” framing since production itself is only growing 2 to 3 percent a year, sits on top of that dividend cushion and so needs Brent above roughly 60 dollars just to have anything left over, and effectively zeroes out in the 50 to 60 dollar band.
- Hess, Guyana, and Tengiz execution, where the accretion is entirely forward-looking and conditional. The Hess deal was a roughly 53 billion dollar all-stock transaction, closed in mid-2025 after Chevron won an arbitration fight with ExxonMobil over Guyana, that handed Chevron a 30 percent, non-operated stake in the Stabroek block plus Hess’s Bakken shale acreage. Non-operated means exactly what it sounds like: ExxonMobil, not Chevron, decides the pace of new development, the capital budget, and the timing of new production vessels. Tengiz is a low-cost engine that exits through a pipeline running through Russian territory on revocable US sanctions exemptions. So far, the Hess deal has been return-dilutive, not accretive: return on capital employed halved, debt rose, and the roughly 301 million new shares issued to Hess holders, about 15 percent dilution, has largely offset a year of buybacks rather than shrinking the float. The accretion is a 2027-to-2030 story that still has to be delivered, and it is conditional on both the oil price and on a partner’s execution timeline, not Chevron’s own.
- The slower-moving question of peak demand and cost inflation. The International Energy Agency’s longer-term view sees oil demand plateauing later this decade, with China’s demand potentially peaking as soon as 2027, while OPEC’s outlook is considerably more bullish on continued growth through 2030. No single number can honestly split that roughly 8-million-barrel-a-day disagreement. Meanwhile, rising oilfield-services costs are quietly narrowing the cost-of-supply spread that is Chevron’s entire competitive edge.
Bull case: Brent around 85 dollars or higher, sustained
Brent averages 85 dollars or more; the buyback runs at the top of its 10-to-20-billion-dollar range and the share count finally falls below its Hess-inflated level; Guyana’s production vessels and Tengiz both deliver the promised accretion, pushing return on capital employed up toward 9 to 10 percent; and the market re-rates Chevron’s forward multiple from roughly 10 to 11 times toward ExxonMobil’s 13-to-15-times range as the “laggard discount” closes. Under this path, adjusted free cash flow and earnings per share compound at more than 10 percent a year as management’s own framework describes, with normalized earnings per share building from the 2025 trough of 6.63 dollars toward the high teens by 2030. An illustrative valuation, applying a peer-like multiple of roughly 13 to 14 times to that normalized earnings estimate, points to a price range of roughly 255 to 285 dollars (midpoint around 270 dollars), price only, plus a growing dividend on top; this is a method, not a forecast. What has to be true: OPEC+ holds price discipline or demand surprises to the upside, Guyana and Tengiz execute on schedule, and the Hess accretion turns real. The single thing most likely to break this case is the oil price itself; a demand-driven or supply-driven break in Brent takes the whole stack down regardless of how well the company executes everything else.
Base case: Brent in the mid-60s to low 70s, the framework roughly on track
Brent holds around 65 to 70 dollars; the dividend stays comfortably covered; the buyback runs somewhere in the lower-to-middle part of its range; and return on capital employed recovers only partway, to the mid-to-high single digits, while the forward multiple holds around 10 to 12 times as trailing earnings normalize off today’s trough. Earnings per share normalizes from 6.63 dollars toward roughly 11 to 14 dollars by 2030, and the stock compounds price at a mid-single-digit rate on top of the roughly 4.2 percent yield. An illustrative valuation, applying about 15 times to a normalized earnings estimate near 13 to 14 dollars, cross-checked against a price compounding around 5 to 6 percent a year, points to a range of roughly 205 to 225 dollars (midpoint around 215 dollars), price only. What has to be true: oil holds the mid-to-high 60s, the dividend stays covered, and Hess stops being a drag on returns by around 2027 to 2028. The single thing most likely to break this case is Brent drifting into the mid-50s, which would zero the buyback and stall the per-share compounding this case depends on.
Bear case: Brent in the mid-50s to low 60s
The oil-market cushion of the past year finishes unwinding and OPEC+ discipline frays further as Iraq and the UAE keep producing above quota; Brent settles into the mid-50s to low 60s. The buyback zeroes out entirely; free cash flow slips below the dividend obligation, meaning the 39-year streak would have to be funded from the balance sheet rather than from cash generated that year; return on capital employed stays stuck in the mid-single digits; Hess remains return-dilutive given its non-operated Guyana structure and the debt taken on to fund it; and one or more of the stacked geopolitical or legal tails, disruption to the Tengiz export route, a revocation of the Venezuela operating license, a materially adverse outcome in the Rozel litigation, actually fires. The forward multiple that looked cheap at 10 to 11 times re-expands toward the trailing 29-times level as the Street cuts its forward earnings estimate back down toward the trough. An illustrative valuation, applying a de-rated 13-to-14-times multiple to a trough-like normalized earnings estimate of roughly 9 to 10 dollars, floored by a dividend yield of about 4.5 to 5 percent, points to a range of roughly 120 to 140 dollars (midpoint around 130 dollars), price only. What has to be true for this case: oil stays in the mid-50s for a sustained stretch, OPEC+ discipline keeps eroding, and no offsetting cost cuts arrive fast enough to matter. The one thing most likely to rescue the stock from this case is a supply shock or a re-tightening of OPEC+ discipline that snaps Brent back above 70 dollars; the stock’s unusually low statistical volatility and its covered dividend mean the downside here is real but cushioned, not a cliff.
The numbered dividend and buyback coverage model
This is the arithmetic that should replace any hand-wavy claim about “the dividend is safe” or “the buyback will keep running.” It anchors on Chevron’s actual 2025 free cash flow of roughly 16.6 billion dollars at a realized Brent average of about 69 dollars, then flexes that figure using the roughly 550-million-dollar-per-dollar Brent sensitivity described above. The annual dividend cash obligation is roughly 13.2 billion dollars at the 2025 weighted-average share count of 1,856 million shares, and it rises toward roughly 14 billion dollars at the current, larger post-Hess share count near 1.98 billion shares, meaning actual coverage today is somewhat tighter than the table below shows at the 2025 share count. Every figure here is illustrative scenario arithmetic, not a Chevron forecast.
| Brent price | Estimated free cash flow | Dividend obligation | Free-cash-flow-to-dividend coverage | Buyback capacity after the dividend | What it means |
|---|---|---|---|---|---|
| 55 dollars | about 8.9 billion dollars | about 13.2 billion dollars | about 0.67 times, not covered | zero; the buyback stops | The dividend is under-covered by roughly 4 billion dollars. The 39-year streak would survive only by drawing on debt or selling assets. This is survival mode, not a healthy scenario. |
| 65 dollars | about 14.4 billion dollars | about 13.2 billion dollars | about 1.09 times | roughly 1.2 billion dollars, likely balance-sheet-funded if pursued at all | The dividend is just covered; the buyback throttles down to nearly nothing, and per-share growth stalls. |
| 69 dollars (2025 actual) | about 16.6 billion dollars | about 13.2 billion dollars | about 1.3 times | about 3.4 billion dollars of organic headroom, yet Chevron actually repurchased 12.1 billion dollars in 2025 | The real 2025 result: buybacks already exceeded organic after-dividend cash flow, which is exactly why debt rose to roughly 45 billion dollars. |
| 75 dollars | about 19.9 billion dollars | about 13.2 billion dollars | about 1.51 times | roughly 6.7 billion dollars, the low-to-middle part of the 10-to-20-billion-dollar framework | Comfortable. The dividend is safe and the buyback funds genuine float shrinkage. This is the level at which the whole thesis works as advertised. |
The takeaway a holder should carry from this table: the buyback, the mechanism behind most of the “double-digit earnings-per-share growth” story, needs Brent above roughly 60 dollars and is essentially gone below that; the dividend itself stays covered by cash flow down to somewhere in the low 60s and slips to about two-thirds covered near 55 dollars, at which point the streak is being maintained by the balance sheet rather than by operations; and even at 2025’s actual 69-dollar average, Chevron spent more on buybacks than its organic after-dividend cash flow supported, adding to debt in the process. That last point is the clearest, most quantified version of the bear case: the capital-return stack currently sits on top of a Brent floor above 60 dollars, not the widely advertised sub-50-dollar breakeven, because that lower figure only covers capital spending and the dividend, never the buyback.
Catalysts and the timeline
In the near term, watch the second-quarter 2026 earnings release (expected late July or early August) for the first clean read on realized prices, free cash flow, and the buyback dollar figure against shares issued; the quarterly buyback pace against the dilution rate is the single cleanest tell on whether the float is actually shrinking. Watch Tengiz distribution updates each quarter, since Chevron raised its full-year 2026 affiliate-distribution guidance by more than 2 billion dollars versus first-quarter levels, though the field had unplanned downtime earlier in the year, a reminder this is not a perfectly smooth ramp. Watch the Rozel litigation’s path through federal court following the Supreme Court’s remand; independent legal commentary expects the verdict is more likely to be vacated and retried than upheld as-is, but this remains a live, open matter, not a resolved one. And watch Guyana’s Hammerhead development, the seventh project in the Stabroek block and already at the final-investment-decision stage, for construction milestones toward the block’s plan for eight production vessels by 2030, all on ExxonMobil’s operating timeline, not Chevron’s.
Further out, the Tengiz ramp toward full nameplate capacity through 2026 and 2027, the pace of new Guyana production vessels through 2030, the Project Kilby gas-power partnership with Microsoft (targeting a final investment decision by the end of 2026 and first power in 2028, an early step in diversifying cash flow away from the oil-price cycle), the roughly 36.5 billion dollars remaining on the buyback authorization and how fast it depletes, and the slow-moving peak-demand debate between the International Energy Agency and OPEC through the end of the decade are the multi-year inflection points that will decide which of the three scenarios above actually plays out.
Leading indicators worth tracking
Brent itself dominates every other indicator on this list: a sustained hold above roughly 70 dollars points toward the base or bull case, while a sustained hold below 60 points toward the bear case. Behind that, watch the quarterly buyback dollar figure against shares issued to see whether the float is actually shrinking; the trajectory of return on capital employed off its 4.5-to-6.6-percent trough, climbing toward management’s own targeted improvement or staying stuck; the direction of net debt, falling meaning capital returns are self-funded, rising further meaning they are increasingly financed; the pace at which Guyana’s net 30 percent barrels and Tengiz’s cash distributions actually show up, on schedules set by others; and whether Chevron’s own structural cost-cutting program is outrunning or losing to rising oilfield-services cost inflation.
Companies to watch (bull, base, bear)
Chevron (CVX): the name itself. Bull: a low-cost, well-run major trading at a forward-earnings discount, with Guyana and Tengiz as genuine, if not yet delivered, growth legs. Base: a covered, growing dividend and a modest buyback that scales with the oil price. Bear: the dividend-and-buyback stack needs Brent above roughly 60 dollars, return on capital employed has halved, the Hess deal is dilutive so far, Berkshire cut about 35 percent of its position, and the stock has been the worst three-year and five-year performer among its peer set. Watch: the quarterly buyback figure, return on capital employed, and Brent itself.
ExxonMobil (XOM): the scale leader. Bull: the largest balance sheet, the best returns among the majors, and a Permian-plus-Guyana growth engine outgrowing peers. Base: a premium multiple that already prices in most of that quality. Bear: that same premium, an enterprise-value-to-EBITDA multiple above Chevron’s despite similar oil-price exposure, is itself a compression risk in a genuine downcycle; do not assume Exxon is automatically safer just because it is bigger. Watch: whether Exxon’s return-on-capital lead over Chevron widens or narrows as both integrate their respective Guyana-adjacent deals.
Shell (SHEL): the LNG trading franchise. Bull: the world’s largest LNG trader with consistent, sizable buybacks. Base: a persistent valuation discount tied to European domicile. Bear: legacy lower-return downstream and chemicals assets remain a drag. Watch: buyback pace and further gas-weighted portfolio moves.
BP (BP): the cheapest, most contested turnaround. Bull: the lowest multiples in the group plus real activist pressure pushing capital discipline. Base: a genuine trading-and-refining beat this quarter. Bear: the highest relative debt load and a credibility deficit from repeated strategy reversals; a single strong quarter is not yet a durable earnings base. Watch: whether the current quarter’s trading strength repeats or reverses.
TotalEnergies (TTE): the diversified major. Bull: the most balanced portfolio across oil, gas, LNG, and power among the majors. Base: thinner US liquidity as a Paris-listed ADR. Bear: meaningful African asset exposure carries elevated political and expropriation risk. Watch: African-asset headline risk and LNG contract renewals.
ConocoPhillips (COP), Occidental (OXY), and EOG (EOG): the pure-play E&Ps. Bull: lower-cost, more direct commodity leverage without a downstream business diluting the upside. Base: disciplined capital-return frameworks similar in spirit to the majors’. Bear: no refining hedge means results move more directly, in both directions, with the oil price; Occidental in particular carries the highest leverage of the group and unproven direct-air-capture economics, and its bull case leaning on Berkshire’s stake as a credibility anchor looks softer given Berkshire just cut its other major energy position. Watch: Permian well costs and each company’s own buyback pace as a read on how confident management is in near-term prices.
Risk controls
The single largest risk to this entire thesis is concentration in one variable: the oil price. Chevron’s earnings, free cash flow, return on capital employed, and its buyback all move together with Brent, and there is no meaningful diversification within the company’s own portfolio that offsets a sustained price decline, since Downstream is a partial, imperfect hedge at best. A reader building a position around this name should size it understanding that a sustained move to the mid-50s in Brent would not just compress the stock’s multiple, it would mechanically zero the buyback and strain the dividend’s cash coverage, as the numbered model above shows.
The Hess acquisition adds a second, related risk: it has raised debt to roughly 45 billion dollars, diluted the share count by about 15 percent, and has not yet, on the evidence available, produced the accretion management promised, since return on capital employed has halved rather than improved since the deal closed. That accretion is possible and even plausible, but it depends on execution by a partner, ExxonMobil, that operates Guyana on its own schedule, and on Tengiz continuing to run smoothly through a single, geopolitically exposed export pipeline.
Legal and geopolitical tails sit outside the base-case framework entirely and are worth naming plainly rather than glossing over. The Rozel litigation, a 744.6 million dollar jury verdict against Chevron entities over Louisiana coastal erosion, was not resolved by the Supreme Court’s April 2026 ruling, only redirected to federal court; Chevron has accrued just 131 million dollars against it and is contesting the verdict, and independent legal commentary expects it is more likely to be vacated and retried than paid as awarded, but a reader should treat this as a live, unresolved, potentially material liability, not as a closed matter and certainly not as an admission of wrongdoing. Chevron is also a codefendant in 34 broader US climate-change lawsuits that it says it cannot estimate the possible liability from. Separately, Tengiz’s crude exits Kazakhstan only through a pipeline running via Russian territory, kept flowing by specific, revocable US Treasury sanctions exemptions, and a piece of Chevron’s Venezuela production operates under a similarly revocable license from the US Office of Foreign Assets Control. None of these is currently disrupting production, but each is a binary risk that sits entirely outside the range of outcomes the base-case scenario above assumes.
Finally, the “cheap laggard eventually re-rates” logic that underpins much of the bull case has had three full years and five full years to play out against ExxonMobil and the broader energy sector, and it has not yet. A reader should not assume the market is simply wrong about Chevron; it may instead be correctly pricing in lower current returns on capital, higher debt, and a crown-jewel asset that Chevron does not operate. The access itself carries no complication: this is a highly liquid, NYSE-listed mega-cap directly buyable by any US retail investor, with no structural barrier to entry or exit.
Methodology, sourcing, and data-quality flags
This piece draws on Chevron’s FY2025 Form 10-K, its Q1 2026 Form 10-Q, quarterly earnings releases and 8-K exhibits back through Q4 2025, the 2026 proxy statement, Berkshire Hathaway’s Q1 2026 13F/13G filings, the actual US Supreme Court opinion in Chevron USA Inc. v. Plaquemines Parish, and cross-checked market data from stockanalysis.com, Yahoo Finance, barchart.com, TipRanks, and MarketBeat, alongside company peer filings for ExxonMobil, Shell, BP, TotalEnergies, ConocoPhillips, Occidental, and EOG. Every figure above was checked against at least one source and, where load-bearing, against a second; every one of 104 load-bearing claims recorded for this research was independently re-verified, with 101 confirmed directly against primary filings or cross-corroborated vendors.
A handful of data-quality flags are worth stating explicitly rather than burying. Sell-side price targets are genuinely disputed between vendors: two sources cluster near 217 dollars while a third shows 205.52 dollars, a real methodology difference between panels, not a stale read on either side, so this piece presents the range rather than a single figure. Berkshire Hathaway’s Chevron stake is reported two different ways depending on the source date: the 2026 proxy’s 6.70 percent reflects an earlier record date and is now stale; the Q1 2026 13F showing a roughly 35 percent cut to about 4.2 percent is the current, and more informative, figure, and this piece uses the latter throughout. Research drafts for this piece initially treated a reported March 2026 spike in Brent crude toward 112 dollars a barrel (with Dubai crude reportedly touching 166 dollars) as an established fact tied to a Strait of Hormuz disruption; that specific spike could not be corroborated against the market-data vendors used for this piece’s valuation work and is deliberately excluded here, on the view that an unconfirmed number should never anchor an earnings-quality argument. What is confirmed and used instead is Chevron’s own reported 2025 realized Brent average of about 69 dollars, down from about 81 dollars in 2024, as the verified driver of the year’s earnings decline. The Rozel verdict is stated throughout as a contested jury verdict under appeal and remand, not a final judgment, a settled claim, or an admission of liability; Chevron has accrued 131 million dollars against a 744.6-million-dollar verdict and disputes the balance. The International Energy Agency’s specific 2030 demand-plateau figure traces most cleanly to the agency’s longer-range World Energy Outlook rather than to the shorter-term monthly Oil Market Report sometimes cited alongside it, so this piece frames the IEA-versus-OPEC demand debate directionally, as a genuine, roughly 8-million-barrel-a-day disagreement about magnitude and timing, rather than attaching a single precise figure to a specific, potentially mismatched report. A Tengiz free-cash-flow-to-Chevron figure of roughly 6 billion dollars a year at 70-dollar Brent, sourced to a financial blog’s summary of an earnings call rather than to the call transcript itself, is used here as a labeled, unconfirmed estimate rather than a hard number. Enterprise-value-to-EBITDA for Chevron varies by vendor and calculation convention, from roughly 8.9 to 9.7 times depending on the add-back methodology used; this piece uses the more commonly cited 9.7 figure but notes the range exists.
The five-factor read, in full. On valuation, Chevron screens rich only if a reader stops at the roughly 29-times trailing price-to-earnings ratio, which is a trough-earnings artifact from depressed realized prices and Hess-integration costs. On the numbers that matter for a cash-generating business, a roughly 10-to-11-times forward multiple, an enterprise-value discount to ExxonMobil, and a roughly 4.2 percent dividend that free cash flow still covers, the honest read is undervalued, not expensive. On growth, the case is real but entirely oil-contingent and so far unproven: management’s guided more-than-10-percent annual free-cash-flow and earnings-per-share growth assumes 70-dollar Brent, rides on production growing only 2 to 3 percent a year, and depends on a buyback that itself needs oil above 60 dollars; Guyana is a 30-percent, non-operated stake, and the Hess accretion remains forward and conditional rather than delivered, a middling growth read rather than a strong one. On quality, Chevron ranks among the best in its sector on the durable measures that matter, advantaged low-cost barrels, a fortress balance sheet still rated AA-minus and Aa2, and a 39-year dividend-increase streak, blemished specifically by returns: return on capital employed has halved to 6.6 percent, 4.5 percent in the first quarter of 2026, and the crown-jewel asset is operated by a rival. On risk, essentially everything rides on one commodity price: the buyback zeroes below roughly 60-dollar Brent, dividend coverage slips to about two-thirds near 55 dollars, debt has risen to roughly 45 billion dollars post-Hess, and a stack of geopolitical and legal tails, the Russia-routed Tengiz export pipeline, a revocable Venezuela operating license, the unresolved Rozel verdict, and a genuinely contested long-run demand outlook, sit entirely outside the base-case framework; this is an elevated-risk profile. On momentum, the signal is soft, low-weight, and leans negative: Chevron is the three-year and five-year price laggard of its peer set, it fell about 9 percent in the trailing month, and Berkshire cut its stake by roughly 35 percent in the first quarter of 2026, though low short interest and constructive, if disputed, sell-side targets offer some offsetting comfort. Taken together, as a labeled research signal rather than as advice, this reads as a cheap, high-quality, income-paying major whose entire forward case is a leveraged bet on an oil price sitting at 70 to 74 dollars with OPEC+ discipline visibly fraying at the edges, attractive on valuation and yield, held back by a re-rating that has failed to arrive for five years running and by a Hess deal that remains dilutive rather than accretive so far. The lean is Hold, with a tilt toward accumulating on oil-driven weakness and owning the position for its covered yield, not a table-pounding buy and not a sell.
Data-quality flags:
- Sell-side price targets are disputed between vendors (roughly 205 to 220 dollars); presented as a range, never a single point figure.
- Berkshire Hathaway’s ownership stake is reported two ways depending on filing date; this piece uses the current Q1 2026 13F figure (about 4.2 percent) rather than the stale 2026 proxy figure (6.70 percent).
- A previously circulated March 2026 Brent price spike to roughly 112 dollars a barrel could not be corroborated against this piece’s market-data sources and is not used; the verified driver of 2025’s earnings decline is the confirmed realized Brent average of about 69 dollars, down from about 81 dollars in 2024.
- The Rozel verdict (744.6 million dollars) is a contested jury verdict under appeal and remand to federal court, not a final judgment, a paid claim, or an admission of liability.
- The IEA-versus-OPEC 2030 oil-demand outlook is a genuine, roughly 8-million-barrel-a-day disagreement between the two most-cited forecasting bodies; no single consensus figure exists and none is presented as fact here.
- A cited roughly 6-billion-dollar annual Tengiz free-cash-flow contribution to Chevron is sourced to a secondary summary of an earnings call, not the call transcript itself, and is labeled an unconfirmed estimate throughout.
- Enterprise-value-to-EBITDA for Chevron ranges from about 8.9 to 9.7 times depending on vendor calculation convention; this piece uses 9.7 times but notes the range.
- All prices, market caps, multiples, and oil benchmarks are point-in-time as of June 30, 2026, and move fast; treat every figure in this piece as a photograph, not a forecast.
Key sources: Chevron Corporation FY2025 Form 10-K and Q1 2026 Form 10-Q (SEC EDGAR); Chevron Q1 2026 and Q4 2025 earnings releases (8-K exhibits); Chevron’s 2026 DEF 14A proxy statement; Chevron’s November 2025 investor day materials; the US Supreme Court’s opinion in Chevron USA Inc. v. Plaquemines Parish, No. 24-813; Berkshire Hathaway’s Q1 2026 13F and Schedule 13G/A filings; ExxonMobil, Shell, BP, TotalEnergies, ConocoPhillips, Occidental Petroleum, and EOG Resources quarterly earnings releases; stockanalysis.com, Yahoo Finance, barchart.com, TipRanks, and MarketBeat market data; the US Energy Information Administration and the Dallas Federal Reserve Energy Survey; and the International Energy Agency and OPEC’s respective oil market outlooks.
Prepared July 1, 2026. Figures are point-in-time and will change. This is research and analysis for educational purposes, not investment advice, not a recommendation, and not a solicitation. Energy markets, commodity prices, and energy companies’ valuations are highly volatile and subject to geopolitical, regulatory, and macroeconomic shocks. Verify all figures independently and consult a licensed financial advisor before making any decision.