
Research date: July 2, 2026 | OSINT market research on Shell plc (NYSE: SHEL), the Anglo-Dutch integrated oil and gas major and the world’s largest LNG trader.
Important disclaimer. This is OSINT-based research and educational analysis, not investment advice. I am not a financial advisor. Nothing here is a recommendation to buy or sell any security, and the scenarios below are illustrative, not price targets. Energy stocks move with commodity prices that can swing sharply and unpredictably within a single quarter, as Shell’s own 2026 results show. Market caps, prices, valuation multiples, and market-share figures are point-in-time (July 2, 2026), press-reported where noted, and move fast. Do your own due diligence and consult a licensed advisor.
Where this stock could be in 6 months, 1 year, 3 years, and 5 years
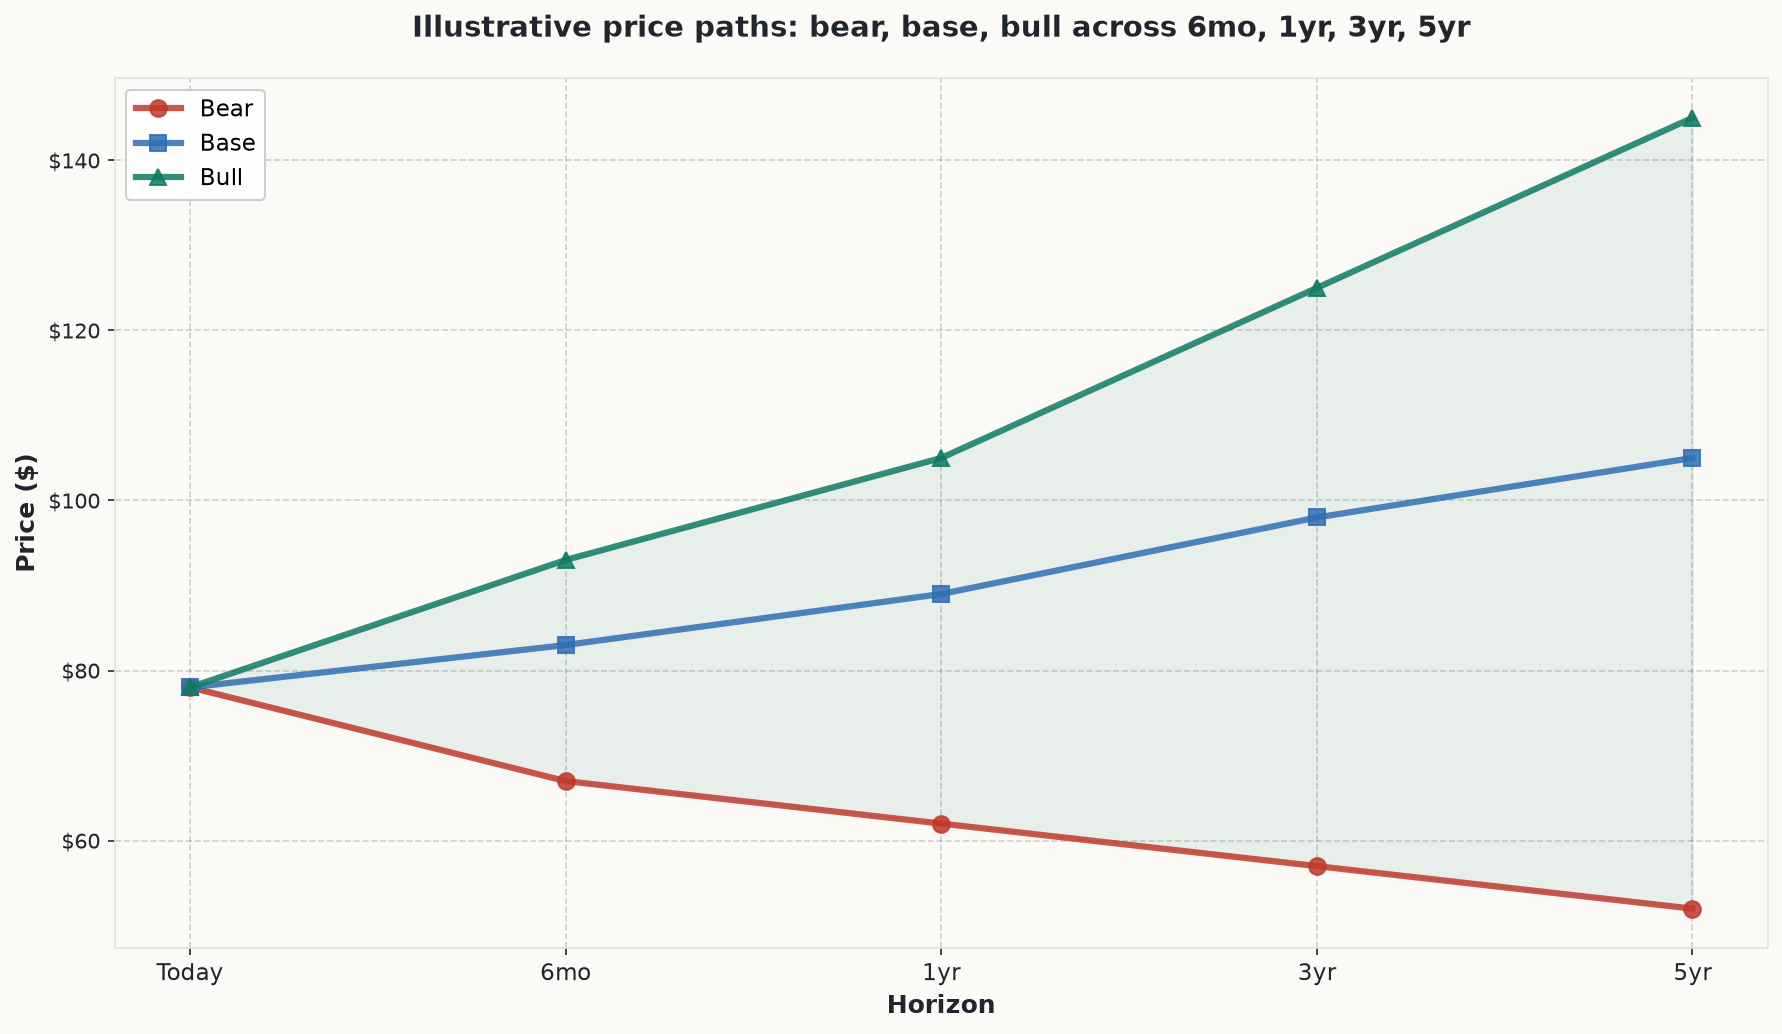
The next six months come down to two dates already on the calendar: the ARC Resources shareholder vote in July 2026, which decides whether Shell’s $16.4 billion Montney gas deal closes or stalls, and whatever Brent crude does once the buyback pause that runs through July 14 lifts. A re-escalation in the Middle East or an OPEC+ decision to hold the line on production cuts would push Brent back above $85 and the stock toward the bull case near $93; a clean deal close, a resumed buyback, and Brent settling in its recent $70-80 band is the base case near $83; a vote delay or an OPEC+ unwind of voluntary cuts that lets Brent slide toward $60 is the bear case near $67.
A year out, the single dominant variable is whether Brent can hold above roughly $65 for long enough that Shell’s $12 to $14 billion annual buyback pace survives intact, because that buyback is the main engine of Shell’s earnings-per-share growth in a business where oil production is otherwise close to flat. If Brent holds near $80 and LNG Canada is running at full rate with ARC integrated cleanly, the bull case points toward $105. A grinding, uneventful year of $70-75 Brent and a buyback trimmed to $10-12 billion lands close to the base case at $89. If Brent falls to the $55-60 range that several major banks now use as a working assumption for 2026, the buyback could be cut to $5 billion or less and the bear case is closer to $62.
By three years, the questions turn structural. Has global oil demand actually started to plateau, the way the International Energy Agency’s May 2026 report suggests it might as soon as 2027, or does OPEC’s own outlook of continued growth to mid-century prove closer to the mark? Has the LNG supply wave that analysts widely expect to hit in 2026-2028 come and gone, or is Shell still selling new cargoes into a glutted market? Has ARC actually made Shell’s Montney and LNG Canada businesses more profitable together than apart? A favorable resolution on all three, with the buyback compounding the share count down 15-20% from today, supports a bull case near $125. A middling outcome, where LNG margins compress but Shell’s trading book absorbs some of the blow, points to a base case near $98. A world of sustained $50-60 Brent, an LNG glut that does not clear, and a dilutive ARC integration is the bear case near $57.
Five years out, this becomes a single question: is Shell’s integrated model, cheap upstream barrels feeding a trading and marketing machine that dwarfs any single-basin competitor, a durable way to compound cash through an energy transition, or is it a high-quality business riding a shrinking pool of demand? If gas keeps winning the transition argument and Shell’s LNG book, deepwater cost position, and ARC-secured feed gas combine to produce $25-30 billion of annual cash flow, the bull case reaches $145. If oil demand plateaus without collapsing and LNG demand digests the supply wave by the early 2030s, a reasonable base case sits near $105. If oil demand peaks hard, EV adoption cuts materially into Shell’s marketing volumes, and European carbon costs keep climbing, the bear case falls to $52, a level that would likely force another dividend reset the way 2020 did.
Where the read lands today. On balance the read holds at Buy: Shell’s discount to Exxon and Chevron looks wider than its risk profile justifies, and the LNG trading franchise gives it a genuine edge the market is not fully paying for. The single thing most likely to flip that read is Brent settling durably below $60, which would gut the buyback that currently does most of the heavy lifting for the stock’s total return.
Companion tool
Jump to the interactive dashboard to sort and filter every company in the piece, or download the Excel model to flex the scenarios yourself.
TL;DR
Shell is an integrated oil and gas major that has spent the last several years deliberately narrowing its bet: it walked away from a costly renewables buildout, high-graded its refining footprint from fourteen sites toward six, and doubled down on the two parts of the hydrocarbon business it does best, low-breakeven deepwater oil and the world’s largest LNG trading and marketing operation. That discipline shows up in the numbers: a 9.4 percent forward price-to-earnings multiple, a 4.7 times enterprise-value-to-EBITDA ratio, and a 12.1 percent free-cash-flow yield, all cheaper than Exxon or Chevron on the same measures. The catch is timing. Shell’s strong first-quarter 2026 results were substantially a byproduct of a Middle East supply shock that spiked Brent to $120 and then faded, not a structural re-rating, and the company is now spending $16.4 billion to buy Canadian gas producer ARC Resources and add twelve million tonnes of new LNG capacity by 2030 right as a well-telegraphed global LNG glut and a mainstream bank consensus around $57-60 Brent threaten to compress the margins on both. The dividend is safe deep into a downturn; the buyback, which does most of the work behind the stock’s total return, is not. This is a real value story with a real cyclical trap built into its own growth plan, and the next eighteen months of oil and gas prices will decide which one the market ends up pricing.
Explore it yourself: the interactive dashboard
Open the dashboard in a full screen
The toll booth in the middle of the energy transition
Picture Shell less as a single company and more as a chain of toll booths spread across a global highway that most of the world’s energy still has to pass through. At one end sit the wells: deepwater platforms off the coast of Texas and Brazil pumping oil that costs Shell under $35 a barrel to produce. At the other end sit refineries, gas stations, and long-term contracts with Asian utilities. In between sits the piece that actually makes Shell different from most of its peers: a trading and marketing desk that moves the largest volume of liquefied natural gas in the world, roughly 65 million tonnes a year to more than 30 countries, and can shift cargoes between markets to capture whatever price dislocation shows up that week.
The bet Shell’s management has made since 2025 is that the toll booth matters more than owning every mile of highway. It sold off wind farms, wrote down a billion dollars on an offshore project in New Jersey, and scaled back green hydrogen investment because those businesses were destroying capital at sub-hurdle returns. It kept, and is now expanding, the parts of the business where it has genuine structural advantages: the low-cost oil, the trading book, and a growing pipeline of new LNG supply. The article that follows walks through what that portfolio actually looks like, what the filings say about how it is performing, what the market is paying for it, and where the real risks sit, because Shell’s own bet is running headfirst into two commodity cycles turning at once.
How the money flows
flowchart TD
    subgraph INPUTS["INPUT SOURCES"]
        GoM["Gulf of Mexico\ndeepwater\n(Whale, Perdido)"]
        Brazil["Brazil pre-salt\n(Mero, Santos Basin)"]
        Nigeria["Nigeria\n(Bonga North, onshore)"]
        Canada["Canada Montney\n(ARC Resources)\n+LNG Canada feed"]
        Qatar["Qatar JVs\n(NFE/NFS stakes)"]
        Other["Other upstream\n(North Sea, Australia,\nMalaysia, Oman)"]
    end

    subgraph EXTRACTION["EXTRACTION & PRODUCTION"]
        Upstream["Upstream E&P\n2,752 kboe/d\nbreakeven ~$35/bbl"]
        GasProduction["Gas production\nfor LNG feed"]
    end

    subgraph LNG_CHAIN["LNG VALUE CHAIN"]
        Liquefaction["Liquefaction\nLNG Canada 14 MTPA\nQatar JVs\nNigeria NLNG\n+12 MT by 2030"]
        LNGShipping["LNG Shipping\n& Trading\n~65 MT marketed/yr\nworld's largest"]
        Regas["Regasification\n& delivery to\nend markets"]
    end

    subgraph DOWNSTREAM["REFINING & CHEMICALS"]
        Refining["6 core refineries\nDeer Park, Norco\nPernis, Bukom\nRheinland, Scotford"]
        Chemicals["Petrochemicals\n(rationalizing)"]
    end

    subgraph DISTRIBUTION["MARKETING & DISTRIBUTION"]
        Trading["Trading desk\ncommodity arbitrage\nprofit center"]
        Retail["~47,000 retail\nstations globally"]
        B2B["B2B fuel supply\nlubricants, aviation"]
        EVCharging["EV charging\n(growing slowly)"]
    end

    subgraph CUSTOMERS["END CUSTOMERS"]
        AsianUtilities["Asian utilities\n& power gen\n(LNG buyers)"]
        EuropeGas["European gas\nbuyers"]
        Transport["Transport\n(road, marine, aviation)"]
        Industrial["Industrial\n& petrochemical\nfeedstock"]
    end

    GoM --> Upstream
    Brazil --> Upstream
    Nigeria --> Upstream
    Other --> Upstream
    Canada --> GasProduction
    Qatar --> GasProduction

    Upstream --> Refining
    Upstream --> Trading
    GasProduction --> Liquefaction

    Liquefaction --> LNGShipping
    LNGShipping --> Regas
    LNGShipping --> Trading

    Refining --> Retail
    Refining --> B2B
    Refining --> Chemicals
    Chemicals --> Industrial

    Trading --> LNGShipping
    Trading --> Refining
    Trading --> B2B

    Regas --> AsianUtilities
    Regas --> EuropeGas
    Retail --> Transport
    B2B --> Transport
    EVCharging --> Transport

    style LNGShipping fill:#2d5016,color:#fff
    style Trading fill:#2d5016,color:#fff
    style Upstream fill:#1a3a5c,color:#fff
    style Liquefaction fill:#1a3a5c,color:#fff
Start at the left edge of the chart. Oil and gas come out of the ground in the Gulf of Mexico, Brazil’s pre-salt basins, Nigeria, and, pending the ARC Resources close, Canada’s Montney shale. None of that production sets its own price. Shell is a price-taker on every barrel and every molecule of gas it pulls out of the ground, which is why the only lever available at this stage is cost, and Shell has spent years pushing that cost down. Its newest deepwater projects, led by the Whale platform in the Gulf of Mexico, break even below $35 a barrel, which means Shell keeps earning cash on that oil even in a serious downturn long after higher-cost shale and marginal offshore projects go negative.
From there, the gas splits into two paths. Some feeds Shell’s liquefaction plants, most importantly LNG Canada, where Shell holds a 40 percent stake in a 14-million-tonne-per-year facility that shipped its first cargo in June 2025 and brought a second production train online that November. Liquefied gas then moves through the middle of the chart, the piece that is genuinely hard to copy: Shell’s trading and marketing desk, which does not just sell the gas Shell itself produced but arbitrages across its entire 65-million-tonne annual marketing book, redirecting cargoes toward whichever region is paying the most that month. A single-basin LNG producer can only sell what it makes. Shell can move volume from wherever is cheap to wherever is expensive, in real time, which is the closest thing this business has to a moat.
The oil, meanwhile, flows into refining and chemicals, a business Shell has been deliberately shrinking, rationalizing fourteen refineries down toward six integrated hubs, because refining margins are a pass-through of global capacity utilization that Shell barely influences and chemicals face structural Chinese overcapacity that has made the segment a persistent money-loser. What survives that downstream funnel reaches the end customer through roughly 47,000 branded retail stations, direct fuel contracts with airlines and shippers, and long-term LNG supply deals with Asian utilities and European gas buyers. The shape of this chain is the investment case in miniature: Shell makes the most durable money in the middle, on trading and liquefaction, keeps a genuine cost advantage at the wellhead, and is actively retreating from the two stages, refining and chemicals, where it has never had real pricing power.
Field guide: the five segments that make up Shell
Integrated Gas covers Shell’s LNG value chain from upstream gas production through liquefaction, shipping, and the trading desk that markets it. This is the earnings anchor of the group and the segment where Shell’s structural edge is clearest. It delivered $9.1 billion of adjusted earnings for full-year 2025 by one estimate built from quarterly disclosures (the exact full-year segment table was not independently pulled from Shell’s 20-F in this research pass, so treat the FY2025 figure as a reasonable estimate rather than a confirmed line item), against a confirmed $1.82 billion in the first quarter of 2026 alone. Shell’s own equity liquefaction volume ran 28.4 million tonnes in 2025, down 2 percent year over year, while the marketing and trading book moved roughly 65 million tonnes, a gap that reflects how much of Shell’s LNG business is trading third-party cargoes rather than just selling its own gas.
Upstream is straightforward oil and gas exploration and production, concentrated in the Gulf of Mexico and Brazil’s Santos Basin, plus Nigeria and a slate of smaller international assets. Total production ran 2,801 thousand barrels of oil equivalent per day in 2025, down about 1 percent year over year, with an adjusted earnings contribution of roughly $7.5 billion for the full year and $2.38 billion confirmed for the first quarter of 2026. The segment’s defining feature is cost, not price: Shell cannot control what Brent crude sells for, but its newest projects, Whale in the Gulf of Mexico and the Mero-4 floating platform in Brazil with 180,000 barrels a day of nameplate capacity, sit at the low end of the global cost curve.
Marketing is the retail and commercial fuels business: roughly 47,000 branded gas stations, lubricants sold under the Shell and Pennzoil names, aviation and marine fuel contracts, and a slowly growing EV charging network. It contributed about $2.8 billion of adjusted earnings for 2025 and $1.33 billion in the first quarter of 2026, more than double the prior quarter on stronger fuel margins. This is the smallest segment by earnings dollars but the one with the most genuine brand-driven pricing power, and the steadiest, least cyclical margin in the portfolio.
Chemicals and Products combines refining and petrochemicals and has been the weak link in the portfolio, posting an adjusted-earnings loss in the roughly $0.5 to $0.8 billion range for full-year 2025 by the same estimate noted above, before swinging to a $1.93 billion profit in the first quarter of 2026 as refining margins spiked from about $6.20 a barrel a year earlier to a guided $17 a barrel, a move driven overwhelmingly by the same Middle East shipping disruption that lifted the rest of Shell’s results rather than a structural recovery in refining economics. Management is actively divesting refineries and chemical assets here, aiming for something like a 15 percent improvement in the segment’s underlying returns.
Renewables and Energy Solutions houses what remains of Shell’s power-trading and low-carbon business after the retreat from renewable generation: some carbon capture projects in Canada and the Netherlands, blue hydrogen, sustainable aviation fuel, and a trading-led power business rather than an owned-generation one. It posted a loss of roughly $0.5 to $0.8 billion for 2025 and a modest $348 million profit in the first quarter of 2026. Management has explicitly said this segment is no longer a strategic priority for capital, and its earnings swings matter less to the consolidated numbers each year as it shrinks.
Who wins where
The clearest winner in Shell’s own value chain is the LNG trading and marketing layer, an oligopoly-adjacent position shared by a small handful of global players, Shell, TotalEnergies, ExxonMobil, and QatarEnergy, at the liquefaction and marketing stage. Shell’s scale as the largest LNG trader gives it a genuine edge over single-basin liquefaction operators, because trading income can be earned on volatility itself, not just on the absolute level of gas prices. The second-clearest winner is Shell’s low-cost deepwater upstream position: Whale and Mero-4 sit below a $35-a-barrel breakeven, which buys real downside protection through a normal price cycle, if not through a multi-year low-price regime. Retail marketing is a smaller but genuinely durable winner, protected by brand loyalty at the pump even if the dollars involved are modest next to the other segments.
The clear losers, in the sense of holding the least pricing power, are refining and chemicals. Refining margins are set globally by capacity utilization that Shell influences only at the margin through its own turnaround scheduling, and chemicals face structural, multi-year overcapacity out of China that no amount of European asset rationalization fully offsets. That is precisely why Shell is shrinking both rather than defending them, and why chemicals showed a loss in the segment table for most of the recent quarters reviewed here even as the rest of the portfolio performed well. Newer entrants into US Gulf Coast LNG, competing on cheaper Henry-Hub-linked contracts, are a genuine threat to Shell’s higher-cost, oil-indexed liquefaction volumes in Qatar and Nigeria, and are part of what is pressuring the global LNG price outlook described later in this piece.
Company by company: who’s who
Shell plc (SHEL), NYSE-listed ADR (also LSE primary listing SHEL.L), is the integrated major at the center of this piece: upstream production, the world’s largest LNG trading and shipping business, refining and chemicals, and a marketing arm, with a market capitalization of approximately $215.8 billion as of July 2, 2026. First-quarter 2026 adjusted earnings of $6.9 billion more than doubled the prior quarter’s $3.3 billion and beat consensus estimates near $6.4 billion, helped by stronger trading and LNG results even as a Middle East disruption briefly took out roughly 3 percent of world gas supply. Shell launched a new $3.0 billion buyback alongside the results and raised its dividend 5.3 percent to $0.3906 a share. Bull: the LNG trading franchise gives Shell earnings resilience that pure-upstream peers lack, and management kept funding buybacks straight through a soft-price quarter. Bear: earnings still swing hard with oil and gas prices and Middle East supply risk, Shell’s returns lag Exxon’s on a per-barrel basis, and the company is juggling a slower, lower-return low-carbon wind-down while integrating a large new acquisition.
ExxonMobil (XOM), the largest US-listed major, with a market capitalization of roughly $568 billion, reported first-quarter 2026 GAAP net income of $4.2 billion and adjusted earnings of $4.9 billion, beating consensus EPS by about 14 percent, and returned $9.2 billion to shareholders in the quarter while holding 2026 capital spending guidance at $27-29 billion. Bull: scale, balance-sheet strength, and low-cost Permian and Guyana barrels give Exxon the best structural cost position of any Western major. Bear: earnings are down year over year on softer commodity prices, and its giant capex program leaves less room for surprise upside if oil stays range-bound. Exxon trades at roughly 25.2 times trailing earnings and 7.8 times enterprise value to EBITDA, both meaningfully richer than Shell, with the trailing multiple inflated by a weak year-ago comparison; the forward multiple is closer to 14-15 times.
Chevron (CVX), the second-largest US major at roughly $335 billion, reported first-quarter 2026 GAAP earnings of $2.2 billion, down from $3.5 billion a year earlier, though adjusted earnings of $2.8 billion beat estimates by more than 45 percent as worldwide production rose 15 percent on the ramp of its Hess acquisition. Bull: post-Hess production growth, including the Tengiz expansion in Kazakhstan and Guyana exposure, gives Chevron one of the best volume-growth stories among the majors just as capital spending peaks. Bear: reported earnings fell sharply year over year on weaker prices and a legal-reserve charge, and the debt and integration risk from the Hess deal is a lever that could work against shareholders in a downturn. Chevron trades at roughly 32.6 times trailing earnings, the richest multiple of the group, reflecting depressed year-ago earnings rather than a premium the market is knowingly paying.
TotalEnergies (TTE), the French major with a market capitalization near $170 billion, is listed in the US as an ADR of shares whose primary market is Euronext Paris. First-quarter 2026 adjusted net income of $5.4 billion was up 29 percent year over year, beating consensus, on stronger refining margins and LNG trading gains, and the company raised its interim dividend 5.9 percent while announcing up to $1.5 billion of additional buybacks. Bull: the best-diversified major on renewables and power trading gives TotalEnergies a growth lever the pure-hydrocarbon peers lack. Bear: the ADR structure means US holders carry currency and dual-listing considerations, and the stock trades at a persistent valuation discount to Exxon and Chevron, currently 4.2 times EV/EBITDA versus Exxon’s 7.8 times, that its renewables diversification has not closed.
BP plc (BP) is the smallest of the majors profiled here at roughly $101 billion and the clearest mid-turnaround story, with first-quarter 2026 underlying profit of $3.2 billion, up sharply from $1.5 billion the prior quarter, on strong upstream reliability and a standout oil-trading result, though net debt rose to $25.3 billion. Bull: the cheapest of the majors by market cap, with asset sales and a strategy reset back toward core oil and gas that could re-rate the stock if execution holds. Bear: BP carries the highest debt load and lowest returns of the group, and a multi-year track record of strategy reversals, a green pivot followed by a pivot back, has cost it credibility with investors that a single good quarter does not repair.
ConocoPhillips (COP), at roughly $128 billion, is the only pure exploration and production name in this group, with no refining or chemicals business to smooth commodity swings. First-quarter 2026 net income of $2.18 billion came with production of 2,309 thousand barrels of oil equivalent per day, slightly below year-ago levels, and cash from operations fell to $4.30 billion from $6.12 billion a year earlier. Bull: as a pure E&P, ConocoPhillips gives the most direct leverage to any oil-price recovery, and its post-Marathon Oil scale in the Permian and Eagle Ford supports disciplined capital returns. Bear: with no downstream business to offset commodity swings, its cash flow is the most exposed of the group to falling oil and gas prices, and operating cash flow already fell nearly 30 percent year over year in the most recent quarter.
What the filings say
Shell files a 20-F annual report and 6-K quarterly and current reports with the SEC as a foreign private issuer, and the picture those filings paint is of a company whose full-year trend and single strong quarter tell two different stories. Full-year 2025 revenue came to $273.7 billion, down 5.3 percent year over year, and adjusted earnings fell 22 percent to $18.5 billion from $23.7 billion in 2024, driven by weaker realized oil and LNG prices, softer trading and optimization contributions, and thinner chemicals margins. Cash flow from operations dropped to $42.9 billion from $54.7 billion, and free cash flow fell to $26.1 billion from $39.5 billion, even as cash capital spending held at $20.9 billion, within Shell’s guided range.
Then the first quarter of 2026 flipped the script. Adjusted earnings jumped to $6.9 billion, more than doubling the prior quarter’s $3.3 billion, with net income of $5.7 billion. The segment breakdown for the quarter, confirmed directly from Shell’s own release, shows Integrated Gas contributing $1.82 billion, Upstream $2.38 billion, Marketing $1.33 billion, Chemicals and Products swinging to a $1.93 billion profit from a $100 million loss the prior quarter, and Renewables and Energy Solutions a modest $348 million, against a $904 million corporate cost line, for a total of $6.9 billion. Adjusted EBITDA for the quarter came to $17.7 billion. The swing in Chemicals and Products, from loss to a near-$2-billion profit in a single quarter, traces almost entirely to the same refining-margin spike, from about $6.20 a barrel to a guided $17, that the Middle East supply shock produced across the whole industry, not to a structural improvement in Shell’s chemicals economics.
Cash flow told a more cautious story than earnings did. First-quarter cash flow from operations fell to $6.1 billion, sharply below the prior quarter, largely because of an $11.2 billion working-capital outflow as commodity price swings moved the value of inventory and receivables. Free cash flow for the quarter came to $2.9 billion. Shell still completed $3.2 billion of buybacks during the quarter and announced a new $3.0 billion program, and raised its quarterly dividend 5.3 percent to $0.3906 a share, but doing so while operating cash flow was this soft pushed leverage higher: net debt rose to $52.6 billion from $45.7 billion at the end of 2025, and gearing, Shell’s preferred measure of leverage, climbed to 23.2 percent from 20.7 percent in a single quarter. That gearing trend, up from 18.8 percent as recently as the third quarter of 2025, is worth watching closely, because it means Shell has been returning more cash to shareholders than its underlying free cash flow has fully supported in a softer-price environment.
Shell’s balance sheet remains investment-grade at the high end of the spectrum: S&P rates it A+ (recently downgraded from AA-, reportedly on energy-transition-related considerations, though the exact primary rating-action document was not directly pulled for this research pass and this detail should be read as press-reported rather than independently confirmed), Fitch rates it AA- with a stable outlook, and Moody’s rates it Aa2 stable. Total debt stood at $75.6 billion as of the end of the first quarter, and shareholder equity was approximately $177.8 billion. Return on average capital employed, Shell’s preferred profitability measure, came in at 9.4 percent for full-year 2025 by the company’s own reporting, down from 11.3 percent in 2024 and a 2022 supercycle peak of 20.4 percent; third-party financial data aggregators show figures for the same period ranging as high as 11.9 percent depending on exactly how the calculation window is drawn, a discrepancy that reflects differing methodologies across data providers rather than any dispute about Shell’s underlying performance, but is worth flagging as a genuine data-quality wrinkle rather than papering over.
On capital return, Shell distributed $22.4 billion to shareholders in 2025, about 52 percent of cash flow from operations and well above the 30-40 percent of CFFO management describes as its baseline target, split between $13.9 billion of buybacks and $8.5 billion of dividends. The buyback has shrunk the share count by roughly 6.5 percent over the past year, and this repurchase pace, not organic earnings growth, is the main reason Shell’s earnings per share has been rising even in years when total adjusted earnings fell. The pending ARC Resources acquisition, still awaiting a shareholder vote and deal close as of this writing and described here as agreed but not completed, will issue approximately $10.2 billion of Shell stock, roughly 131 million new ADRs at recent prices, a dilution of about 2.3 percent to the current share count, or roughly half a year’s worth of the recent buyback pace given back in the transaction.
Institutional ownership is broad and diversified with no controlling shareholder: Vanguard Group holds about 3.20 percent of shares, BlackRock’s institutional trust arm about 3.07 percent, the Norwegian sovereign wealth fund Norges Bank about 2.57 percent, and Fidelity’s FMR entity about 1.72 percent, consistent with a large, widely held supermajor. No unusual insider selling has surfaced in recent filings reviewed for CEO Wael Sawan or CFO Sinead Gorman, both of whom are compensated primarily in performance shares and restricted stock rather than through material open-market transactions.
Shell’s own 20-F discloses the risk factors an investor would expect: oil and gas price volatility as the dominant earnings driver, climate-change litigation and regulation, EU carbon pricing as a direct cost on European operations, geopolitical risk concentrated around the Middle East and Russia sanctions, long-run energy-transition and stranded-asset risk, operational and safety risk tied to deepwater and LNG facilities, foreign-exchange exposure from a dollar-denominated revenue base against a partly euro-, sterling-, and now Canadian-dollar-denominated cost base, integration risk specifically flagged around the pending ARC acquisition, and standard cybersecurity exposure.
What the market is paying
Shell’s shares have traded in a 52-week range of $68.63 to $94.90, and as of July 2, 2026 sat roughly 36 percent above the low and 18 percent below the high, near their 50-day moving average of about $77-78 and just under the 200-day average near $79.42. The stock has had a rough recent stretch by simple price change, down roughly 6 percent year to date and 10 percent over the past three months as Brent softened, broadly in line with the Energy Select Sector SPDR fund’s own decline over the same windows. On a total-return basis, including dividends, the picture looks considerably better: up approximately 31.5 percent over one year, an annualized 16.6 percent over three years, and 162.7 percent cumulatively over five years, all of which comfortably outperformed the S&P 500 over the three- and five-year windows, a legacy of the 2021-2023 commodity supercycle re-rating and a sustained buyback program.
On valuation, Shell screens cheap against both its own history and its US peers. Its forward price-to-earnings multiple of roughly 9.4 times sits below its own ten-year median of about 12-14 times, and its enterprise-value-to-EBITDA multiple of 4.7 times is below its own ten-year median of roughly 5.0-5.5 times, historically cheap territory even though the trailing price-to-earnings ratio of 12.4 times looks closer to mid-cycle. Against peers, Shell is materially cheaper than Exxon (14-15 times forward earnings) or Chevron (12-13 times forward), though TotalEnergies screens similarly cheap on an EV/EBITDA basis at 4.2 times. Shell’s 12.1 percent free-cash-flow yield is the highest in the peer group reviewed here, ahead of TotalEnergies at 10.5 percent and well ahead of Exxon’s 4.6 percent, and its dividend yield of roughly 3.8-3.9 percent sits in the middle of the pack, below BP’s 5.1 percent but above Exxon’s 2.7 percent.
Shell’s beta has run anomalously low, even slightly negative, at roughly -0.21 to -0.24 versus the S&P 500 over the trailing five years, a statistical quirk of measuring against a window that included the sector’s unusual behavior in 2020-2022 rather than a reliable signal about how the stock will actually move going forward; treat it as an artifact, not a forecast. Liquidity is not a concern for a company this size: average daily volume on the NYSE ADR runs an estimated 8-12 million shares, with additional depth on the London primary listing, and short interest is negligible at roughly 0.22 percent of shares outstanding, with an estimated one to two days needed to cover, meaning there is no meaningful short thesis playing out against the stock in the market today.
Sell-side analysts remain net bullish but genuinely divided on where the stock should trade. Different trackers put the mean 12-month price target anywhere from about $97 to just over $100, implying 23-28 percent upside from the roughly $78 level the stock traded at when this research was compiled, with a wider range across houses running from roughly $77 to $106. Jefferies raised its target to $122.40 after the ARC deal was announced, arguing the transaction strengthens Shell’s LNG feedstock security, while Morgan Stanley and Erste Group both moved the other way, citing concerns about the sustainability of recent profit levels and valuation after the stock’s multi-year rally, respectively. Worth noting: the stock price has been drifting down toward the sell-side’s consensus target over recent months rather than the target pulling the price up, which is a reminder that analyst targets are opinions with their own track record of being revised, not a reliable floor.
What the crowd is saying
The dominant news story through the middle of 2026 has been Shell’s own strategic pivot: the $16.4 billion ARC Resources acquisition announced in April, paired with a more than $1 billion planned divestment of its offshore wind portfolio announced in June, both amplifying CEO Wael Sawan’s repeated message of performance, discipline, and simplification. Mainstream business coverage largely treats the ARC deal as a significant, deliberate capital-allocation decision; reaction splits between commentators skeptical of net-zero rhetoric, who frame it as doubling down on fossil fuels, and value-oriented investors who see it as disciplined deployment into higher-return assets. The wind-portfolio sale reads in the press as confirmation of an already-known strategic retreat rather than a surprise.
Retail sentiment on platforms like StockTwits ran bullish in mid-June 2026 with ordinary, not elevated, message volume, a pattern more consistent with organic interest than a coordinated promotional push. The chatter that does exist centers on three themes: the production and LNG Canada synergy upside from the ARC deal, the current dividend yield of roughly 3.9 percent alongside the prospect of the buyback resuming after mid-July, and the stock’s discount of roughly 18 percent from its 52-week high. Search and retail attention around a $16.4 billion transaction has been fairly muted, though, consistent with energy stocks generally carrying lower retail salience than technology or consumer names, and with Shell’s status as a mature, complex, dividend-oriented multinational rather than a story stock. No pump-and-dump patterns, coordinated posting, or thin-float hype signals turned up in this research; Shell is simply too large and too liquid for that kind of activity to move the needle.
Employee sentiment offers a useful, if soft, internal read: Shell carries a 4.0-out-of-5 overall rating on Glassdoor across more than 13,600 reviews, with 74 percent of reviewers recommending the company, but career-opportunity scores sit lower at 3.5 out of 5, and a recurring theme in reviews is “reorganizations every 2-3 years”, a plausible reflection of the ongoing restructuring tied to the renewables retreat and portfolio high-grading. This is a signal of internal friction around structural change, not a red flag for near-term operations.
The sharpest divergence worth flagging explicitly is between Shell’s stated position and its recent actions. The company maintains a formal net-zero-by-2050 commitment across its full emissions footprint, a commitment a Dutch appeals court in November 2024 effectively reinforced in principle even while overturning the specific 45-percent-by-2030 emissions-cut order a lower court had imposed. At the same time, Shell is targeting roughly one million barrels of oil equivalent per day of net production growth by 2030, acquiring a Canadian gas producer that adds hundreds of thousands more barrels a day of production, and has weakened its interim 2030 carbon-reduction targets while continuing to divest renewable generation assets. The market, reflected in a sell-side consensus that remains more than 70 percent Buy or Overweight, currently accepts Shell’s framing that pursuing higher-margin LNG and deepwater oil is compatible with a long-run decarbonization path. Climate-focused critics and activist shareholder groups read the same set of facts as evidence the net-zero commitment is more rhetorical than operational. Both readings are internally consistent with the same underlying facts; which one the market ultimately prices is itself a live question, and one that would most likely shift if energy-transition policy tightened meaningfully or if oil prices stayed weak for an extended period, conditions that as of this writing have not yet arrived.
Cycle or structure: what wins over the next five years?
The bull case for owning Shell rests on the idea that this time really is different, not because the oil and gas business has stopped being cyclical, but because Shell has deliberately concentrated its bet on the two parts of the hydrocarbon complex with the best structural demand support. Deepwater oil at sub-$35-a-barrel breakevens keeps generating cash through a normal down-cycle long after higher-cost producers stop. LNG remains a genuine, multi-decade Asian coal-to-gas substitution story, now reinforced by the same AI and data-center electricity demand that is pulling gas turbines and LNG-fired power generation into conversations that used to be dominated by renewables alone. Management has walked away from the lower-return renewables buildout that has destroyed capital for peers, redirecting cash instead toward buybacks, dividends, and the ARC acquisition, which raises reserve life and secures feedstock for LNG Canada. US energy policy under the current administration, faster permitting and LNG export approvals among them, is a tailwind rather than a headwind for the first time in years. If oil demand does not peak by 2030, as OPEC’s own outlook argues, and LNG demand growth outpaces the current oversupply wave once it clears by around 2028-2029, Shell’s smaller, higher-quality asset base captures outsized returns relative to a decade ago.
The bear case is that cyclicality has never actually been repealed in this industry, and 2026 has already demonstrated why. Brent jumped from roughly $72 a barrel in late February to a peak near $120 in March after strikes on Iran raised fears of a Strait of Hormuz closure, whipsawed through the spring as the crisis alternately escalated and de-escalated, and settled back to $71-80 by early July as US-Iran talks progressed. Shell’s strong first-quarter results were substantially a byproduct of that spike, not a structural re-rating, and the spike is fading. Layered on top is a well-telegraphed supply problem in LNG: more than 150 million tonnes per year of new global liquefaction capacity, led by Qatar’s North Field expansions and a wave of US Gulf Coast projects, is set to come online between 2026 and 2028, pushing global LNG supply toward roughly 594 million tonnes a year by 2030, a 42 percent increase, right as Shell is spending capital to grow its own LNG volumes 4-5 percent a year into that same glut. Multiple major banks now forecast Brent averaging in the high $50s to $60 range for 2026, well below the roughly $70-80 Brent that produced Shell’s recent strong quarters, and mainstream forecasters see a global oil surplus running into the millions of barrels a day this year as OPEC+ continues unwinding voluntary production cuts it began restoring in April. European carbon costs continue rising on a chemicals and refining segment that is already the portfolio’s weakest link, and the ARC deal adds Canadian-dollar and Montney-gas exposure right into the part of the gas cycle where prices are more likely to fall than rise over the next two years.
The most likely outcome splits the difference rather than resolving cleanly in either direction. Shell’s earnings strength through the first half of 2026 should be read as cycle-elevated, not a new run rate, and adjusted earnings and refining margins should be expected to normalize lower over the next twelve to eighteen months as the geopolitical premium in oil prices fades, independent of anything Shell-specific. At the same time, the LNG supply glut is a highly telegraphed, near-certain headwind for Shell’s Integrated Gas margins through 2026-2028 even as underlying Asian gas demand keeps growing; Shell’s trading and marketing scale should let it monetize volatility better than pure-play liquefaction competitors, but that is a genuine partial offset, not full insulation, and it has never fully protected margins during a prior glut either. European carbon costs and the weakness in Chemicals and Products are a slow, multi-year drag rather than a near-term catalyst either way. Put together, Shell looks likely to prove a resilient, well-covered dividend story through a downturn of ordinary size, but the market should be cautious about extrapolating the first half of 2026’s earnings level, and the honest, quantified version of the bear case, worked through below, deserves to be taken seriously rather than waved away.
It is worth being specific about what a genuinely bad scenario looks like in dollar terms, because the qualitative version, “buybacks slow, gearing rises”, understates how much of Shell’s equity story depends on the buyback specifically. If Brent settles in the high $50s to $60 range for an extended stretch, roughly the base case several major banks are using for 2026 and 2027, a reasonable estimate is that Shell’s annual cash flow from operations would fall from the $42.9 billion generated in 2025 to somewhere in the $30-35 billion range. Against 2026 capital spending guidance of $24-26 billion, which now includes roughly $4 billion for the ARC transaction, and dividend payments running near $8.5-9 billion a year, the cash left over for buybacks would narrow to something like zero to $3 billion, an 80-90 percent reduction from the $13.9 billion pace of 2025. The share-count reduction that has been driving Shell’s earnings-per-share growth would effectively stop. Gearing, already at 23.2 percent, would likely climb further, pressuring the credit rating that has already been trimmed once this cycle. The dividend itself would very likely remain safe, management has said it is covered near $40 Brent, but the total-return story that justifies buying Shell at a discount to Exxon in the first place would be substantially gone, and the stock would more plausibly trade as a pure income vehicle in the high-single-digit forward-earnings-multiple range rather than the low-double-digit multiple it enjoys today. This is not the base case in the outlook above, but it is a real, quantifiable bear scenario that a reader weighing this stock should hold in mind alongside the more optimistic framing.
The scenarios in detail
The next five years for Shell’s equity value turn on four variables working together, not any single one in isolation.
Brent crude oil price is the single largest earnings driver. A rough rule of thumb suggested by Shell’s own recent disclosures is that every $10-a-barrel move in Brent shifts annual adjusted earnings by something like $4-6 billion and cash flow from operations by roughly $8-10 billion. The gap between $60 Brent and $80 Brent is the gap between a company that can barely fund its dividend and buyback together and one that comfortably returns $20 billion or more to shareholders in a year.
LNG pricing and the coming supply wave will decide whether Shell’s Integrated Gas segment, its highest-return business, sustains something like an $8-10 billion annual earnings contribution or drops toward $5-7 billion as more than 150 million tonnes per year of new global capacity lands into the same market Shell is expanding into.
ARC Resources integration and capital discipline is the wild card. If the roughly $16.4 billion deal closes cleanly and delivers the promised feed-gas security for LNG Canada along with the approximately 370,000 barrels of oil equivalent a day of added production, it strengthens the whole LNG thesis. If integration goes poorly, or if it closes into weak Canadian gas prices, it adds dilution without adding much accretion, at the worst possible moment for Shell’s balance sheet.
The capital-returns framework is, in a real sense, Shell’s equity story. At $12-14 billion a year, the buyback retires something like 6.5 percent of shares annually, compounding earnings per share even when total earnings are flat or falling. That mechanism only works reliably above roughly $60 Brent. Below that level, the buyback slows or stops, and the market is likely to re-rate the equity down to reflect it.
Over the next six months (to roughly January 2027): the catalysts on the calendar are the ARC shareholder vote and expected deal close, the resumption of the buyback after the mid-July pause lifts, second- and third-quarter 2026 earnings, and wherever Brent settles as Strait of Hormuz tensions and OPEC+ supply decisions play out. A re-escalation scenario with Brent near $85-95 and a smooth ARC close and full-pace buyback resumption points to a bull case around $90-95. A base case of $70-80 Brent, an on-schedule ARC close, and solid quarterly earnings points to roughly $80-85. A bear case with Brent at $55-65 as OPEC+ unwinds cuts further, a delayed ARC vote, and a slower buyback pace points to roughly $65-70.
Over the next year (to roughly July 2027): the dominant variable is whether Brent holds above or below approximately $65 through the back half of 2026 and into 2027, because that threshold determines whether the $12-14 billion annual buyback pace is sustainable. A bull scenario of Brent above $80, LNG Canada running at full rate, an accretive ARC integration, and earnings per share near $8 or better points to roughly $100-110. A base scenario of $70-75 Brent, a trimmed but ongoing $10-12 billion buyback, and earnings per share around $6.50-7.50 with the multiple holding near 11-12 times points to roughly $85-92. A bear scenario of $55-60 Brent, a buyback cut to around $5 billion, gearing near 28 percent, and earnings per share falling to $4.50-5.50 with the multiple compressing toward 10 times points to roughly $58-65.
Over three years (to roughly July 2029): the questions shift to structural ones. Has peak combustible-fuel demand actually materialized around 2027, as the IEA’s own outlook flags as a possibility? Has the LNG supply wave run its course or is it still weighing on prices? Has ARC delivered on its promised production and cost synergies? Has the European carbon-cost burden kept growing? A bull scenario, where Brent holds above $75, LNG demand growth absorbs the new supply, ARC proves fully accretive, and the buyback has compounded the share count down 15-20 percent, with earnings per share of $8-10 and a re-rating toward 12-14 times earnings, points to roughly $115-135. A base scenario, where Brent runs $65-75, LNG margins compress but Shell’s trading book cushions the blow, ARC is neutral to modestly accretive, the buyback runs $8-10 billion a year, and earnings per share sits at $6-8 on an 11-12 times multiple, points to roughly $90-105. A bear scenario, where Brent is stuck at $50-60 on a combination of peak demand and restored OPEC supply, LNG oversupply cuts Integrated Gas earnings by 40 percent or more, ARC proves dilutive, the buyback is suspended, and gearing exceeds 30 percent, with earnings per share falling to $3-5 on a 10-11 times multiple against those lower earnings, points to roughly $50-65.
Over five years (to roughly July 2031): the durability question is whether Shell’s integrated model can create value through a potential oil demand peak, an LNG supply cycle, and an accelerating energy transition, or whether this is a high-quality business in structural decline. A bull scenario, where gas and LNG emerge as the clear transition winner and Shell’s LNG franchise, ARC integration, and deepwater cost position together generate $25-30 billion of sustained annual cash flow, with the buyback compounding shares down 25-30 percent, earnings per share of $9-12, and the market re-rating Shell toward 13-15 times earnings as something closer to a transition-era gas utility, points to roughly $130-160. A base scenario, where oil demand plateaus without collapsing, LNG demand resumes 3-4 percent annual growth once the supply wave is digested, Shell earns $20-25 billion of cash flow through the cycle, the buyback holds near $8-10 billion, and earnings per share runs $6.50-8.50 on an 11-12 times multiple, points to roughly $95-115. A bear scenario, where oil demand peak accelerates, Brent stays below $55 for a sustained period, EV adoption cuts marketing volumes by 20 percent or more, European carbon costs exceed €100 a tonne, LNG oversupply drags on for years, the ARC deal is written down, gearing exceeds 35 percent, and the dividend is cut again the way it was in 2020, with earnings per share falling to $2-4 on an 8-10 times multiple, points to roughly $45-60.
Catalyst timeline: the ARC Resources shareholder vote lands in July 2026 and is a straightforward go or no-go event, with a failed vote a near-term negative. Shell’s buyback resumes shortly after, removing a near-term technical overhang. Second-quarter 2026 earnings arrive in late July, carrying the first full read on how much of the oil-price pass-through and trading gains persist as the geopolitical premium fades. The ARC deal is expected to close in the second half of 2026, beginning integration, alongside the full ramp of both LNG Canada production trains to their 14-million-tonne nameplate capacity. Third-quarter earnings in October give the first full quarter after the buyback resumes. 2027 is the year the IEA flags as a possible peak for combustible oil demand, a genuine structural test for the oil side of the business. The 2027-2028 window is when the LNG supply wave is expected to peak, the real test of Integrated Gas margins. Bonga North’s startup and the Qatar North Field expansions ramp through 2028-2030, testing whether Shell’s production-growth pipeline delivers on schedule, with 2030 itself the target date for the full +12-million-tonne LNG capacity build.
Leading indicators worth tracking: Brent above $70 leans toward the base or bull case, below $60 leans bear. The Asian JKM LNG spot price above roughly $12 per million British thermal units signals healthy LNG margins, below $8 signals the glut has arrived in earnest. Shell’s own quarterly buyback announcement is a direct read: $3 billion or more per quarter is consistent with the bull case, below $2 billion signals the bear scenario is playing out. OPEC+‘s monthly production decisions, whether it continues unwinding voluntary cuts or holds the line, are the single biggest lever on medium-term Brent. Chinese monthly LNG import volumes indicate whether Asian demand growth or plateauing is winning out. The EU’s ETS carbon price above €80 a tonne signals a rising headwind specifically for Shell’s European operations. Shell’s own gearing ratio below 22 percent signals comfort, above 25 percent signals stress. And the AECO Canadian natural gas price is the specific number that will determine whether the ARC acquisition’s Montney economics work out as modeled.
Companies to watch (bull / base / bear)
Shell (SHEL) is the core name in this piece: the discount asset with the LNG trading edge. Bull: Brent holds above $70, ARC closes cleanly and proves accretive, the buyback resumes at full pace, and the market narrows Shell’s discount to Exxon. Base: earnings normalize lower as the Middle East premium fades, LNG margins compress moderately, and the buyback continues at a reduced but still meaningful pace. Bear: Brent settles near $55-60 for an extended period, the ARC deal proves dilutive into a weak Canadian gas market, the buyback is cut sharply, and gearing climbs toward levels that pressure the credit rating. Watch: the July ARC vote, Q2/Q3 2026 earnings, and Shell’s own gearing trend.
ExxonMobil (XOM) is the scale leader and the valuation benchmark Shell is priced against. Bull: Permian and Guyana production growth continues to outrun peers at industry-low costs. Bear: at 25.2 times trailing earnings, XOM is pricing in growth that a sustained low-$60s Brent environment would not deliver, and its $27-29 billion annual capex program becomes a cash drag rather than a virtue if oil stays range-bound. Watch: quarterly Permian and Guyana volume growth against the capex guide.
Chevron (CVX) is the most levered name to a price recovery among the US majors, post-Hess. Bull: Tengiz and Guyana production growth via the Hess deal continues to ramp faster than peers. Bear: reported earnings already fell from $3.5 billion to $2.2 billion year over year in the most recent quarter even as production rose, at a 32.6 times trailing multiple that leaves little room for disappointment, and Hess-related debt and integration risk cut against shareholders in a downturn. Watch: Hess integration cost synergies and net debt trend.
TotalEnergies (TTE) is the most diversified major on renewables and power trading. Bull: that diversification becomes a genuine earnings offset if oil and gas cycles turn down together. Bear: the market has not rewarded that diversification with a higher multiple in years, and the persistent discount to Exxon and Chevron may simply be structural rather than an opportunity. Watch: whether the EV/EBITDA discount to US peers narrows or widens.
BP (BP) is the cheapest major and the clearest turnaround narrative, if the execution holds this time. Bull: continued asset sales and a disciplined return to core oil and gas re-rate the stock from its currently depressed multiple. Bear: the highest debt load and lowest returns in the group, layered on a decade of strategy reversals that have already cost the company credibility once. Watch: net debt trajectory and whether the current strategy survives past the next commodity downturn.
ConocoPhillips (COP) is the pure-play proxy for the oil price itself. Bull: any sustained oil-price recovery flows straight through to COP’s earnings with no refining business diluting the effect. Bear: that same lack of a refining offset means COP’s cash flow already fell nearly 30 percent year over year in the most recent quarter and has the least cushion in the group against a sustained downturn. Watch: quarterly cash-from-operations trend against the production decline curve.
Risk controls
The single largest risk to this thesis is oil price. Shell’s earnings, cash flow, and above all its buyback capacity are directly geared to Brent crude, and the recent strength that made the first half of 2026 look good was substantially a geopolitical spike, not a durable re-rating. A reader building a position here should have a clear view on where they think Brent settles over the next year or two, because that single number does more to determine the outcome than anything company-specific.
The second risk is concentration in a coming LNG glut that is unusually well forecast in its timing, if not its exact severity. Shell is spending real capital, including the pending ARC acquisition, to grow LNG volumes directly into a market that a wide range of analysts expect to move from tight to oversupplied between 2026 and 2028. The trading and marketing scale that should partially offset this has never been shown to fully protect margins during a prior glut, and Shell does not break out its trading profit separately, which makes that offset genuinely hard to size with any precision.
The third risk is execution on the ARC Resources deal itself, which remains pending, not closed, as of this writing, and requires a shareholder vote and deal close still ahead. The transaction is roughly three-quarters funded in Shell stock, meaning it dilutes the share count by an estimated 2.3 percent regardless of how well it performs, and its accretion case depends on Canadian gas prices that are currently soft and forecast by some analysts to stay that way through 2026.
The fourth risk is valuation-after-a-run risk in reverse: Shell trades cheap relative to Exxon and Chevron today, but that discount has persisted for years and may reflect structural factors, a European domicile, litigation tail risk, rising EU carbon costs, that the market is pricing correctly rather than mispricing. A reader should not assume the discount must close simply because it looks wide on a chart.
The fifth risk is regulatory and legal tail risk, low-probability but real. The Hague Court of Appeal’s November 2024 reversal of the original Milieudefensie climate ruling was a win for Shell, but the door to further climate litigation, both in the Netherlands and elsewhere, remains open, and EU carbon and sustainability-disclosure rules are a live, rising cost specifically on Shell’s European refining and upstream footprint.
What would meaningfully change this thesis: Brent settling durably below $60 for more than two quarters, a failed or significantly delayed ARC shareholder vote, Integrated Gas segment margins declining for two consecutive quarters as the LNG glut materializes, or Shell’s own gearing climbing durably above 25-28 percent. Access and liquidity are not concerns here; Shell is a large, heavily traded, investment-grade name with negligible short interest, so any risk in this name is a risk of being wrong about the fundamentals, not a risk of being unable to trade the position.
Methodology, sourcing, and data-quality flags
This research draws on Shell’s own SEC filings (20-F annual report and 6-K quarterly and current reports), Shell investor-relations materials and press releases, third-party financial data aggregators (StockAnalysis, MarketBeat, GuruFocus, financecharts.com) for market and valuation data, analyst and industry sources (the International Energy Agency, OPEC, Morgan Stanley, BNP Paribas, and other named research houses) for forward-looking commodity and demand estimates, and reputable business press (CNBC, Reuters-class outlets, Forbes, trade press including Rigzone, Energy Connects, and Natural Gas Intelligence) for recent corporate developments including the pending ARC Resources acquisition. Every figure in this piece traces to a claim recorded with its source and an as-of date; where a figure could not be confirmed directly from a primary Shell filing, that is noted explicitly in the text rather than presented as settled fact.
A handful of data-quality flags are worth stating plainly. Market capitalization and share-count figures for Shell and its five peers were captured across slightly different dates in June and July 2026 by different aggregators; treat every market-cap figure in this piece, including the roughly $215.8 billion figure for Shell itself, as an approximate, dated snapshot rather than a precise, same-instant figure, and expect it to have moved by the time you read this. Peer earnings comparisons mix “adjusted earnings” (Shell’s, TotalEnergies’) with GAAP net income (Exxon’s, Chevron’s, ConocoPhillips’) because that is how each company reports; these are directionally useful but not strictly apples-to-apples without further normalization. Shell’s full-year 2025 segment-level adjusted earnings, Integrated Gas at roughly $9.1 billion, Upstream at roughly $7.5 billion, and so on, were built from quarterly press-release disclosures rather than extracted directly from a single confirmed table in the 20-F, and should be read as well-sourced estimates rather than a primary-confirmed figure; the first-quarter 2026 segment table, by contrast, is confirmed directly from Shell’s own release. Shell’s oft-cited position as the “world’s largest LNG trader” and any implied market-share percentage built from combining its roughly 65-million-tonne marketing book against roughly 422 million tonnes of total global LNG trade is this author’s own derived arithmetic, not a figure Shell or an analyst house publishes directly, and conflates equity-produced volume with third-party trading volume; it should be read as directional color, not a precise market-share statistic. Forecasts for Brent crude and Asian LNG spot prices diverge meaningfully across banks and agencies, from the high $50s to $60s on the bearish end to well above $80 on the bullish end for Brent in 2026-2027; this piece presents the range rather than a single consensus number because no single number would honestly represent the disagreement among credible forecasters. Shell’s own return-on-capital-employed figure for 2025 is reported by the company at 9.4 percent, while third-party calculators show figures as high as 11.9 percent for what should be a comparable period, a discrepancy driven by differing calculation methodologies rather than a factual dispute. Finally, the Hague Court of Appeal’s November 2024 ruling overturning the original 2021 emissions-reduction order against Shell is a matter of public court record and is described here only as that specific, dated outcome; the door to further climate litigation against Shell remains open and unresolved, and this piece does not speculate on the outcome of any future proceeding.
On the five-factor read behind the rating stated at the top of this piece: valuation nets out clearly favorable, Shell trades at a forward price-to-earnings multiple and enterprise-value-to-EBITDA multiple below its own ten-year medians and well below Exxon’s and Chevron’s, with a free-cash-flow yield above 12 percent that provides a real margin of safety even if the European-domicile discount persists. Growth is modestly positive: the +12-million-tonne LNG capacity expansion by 2030 and the roughly 370,000 barrels a day the pending ARC deal would add are real, but oil production is close to flat outside that acquisition, the capital program funding this growth is large at $24-26 billion for 2026, and most of the near-term earnings-per-share growth is coming from the buyback rather than from underlying earnings expansion. Quality reads as genuinely strong: the LNG trading franchise has no close peer in scale, the deepwater cost position below $35 a barrel is competitive with anyone in the industry, the credit rating remains investment-grade at the high end, and management has shown real capital discipline under the current CEO, evidenced by shareholder distributions running above the company’s own stated baseline even in a softer year. Risk skews negative and is the most important factor working against the bull case: oil-price sensitivity is the dominant swing factor, gearing rose from 20.7 to 23.2 percent in a single quarter, the pending ARC deal adds real integration and Canadian-currency exposure, European carbon costs are a structural, rising headwind, the climate-litigation tail remains open-ended, and the coming LNG oversupply cycle is arriving right as Shell expands into it. Momentum is mildly negative: the stock sits roughly 18 percent below its 52-week high and just under its 200-day moving average, near-term price performance has been negative, and the buyback pause running into mid-July removed a technical source of support, though sell-side sentiment remains net bullish with meaningful implied upside to consensus price targets. Taken together, the read lands at Buy: the valuation discount looks wider than the risk factors on their own would justify, though the risk factors, oil price chief among them, are real enough that this is a research signal, not a guarantee, and it should be revisited if Brent settles durably below $60.
Data-quality flags:
- Market-cap and share-count figures for Shell and its five named peers were pulled across slightly different dates in June-July 2026; treat all as approximate, point-in-time snapshots.
- Full-year 2025 segment-level adjusted earnings for Shell are estimated from quarterly press disclosures, not directly extracted from a single confirmed 20-F table; first-quarter 2026 segment data is confirmed from Shell’s own primary release.
- Peer earnings figures mix “adjusted earnings” and GAAP net income conventions across companies and are not strictly comparable without further normalization.
- Shell’s implied roughly-15-percent share of global LNG trade is this author’s own derived estimate from two separately sourced Shell figures, not a published market-share statistic.
- Brent crude and Asian LNG price forecasts for 2026-2028 diverge meaningfully across banks and agencies; this piece presents the range rather than a false single consensus.
- Shell’s FY2025 return on average capital employed is reported by the company at 9.4 percent; third-party aggregators show figures up to 11.9 percent for methodological reasons.
- The ARC Resources acquisition is pending as of this writing, awaiting a shareholder vote and deal close; all related figures describe agreed terms, not a completed transaction.
- The S&P credit-rating downgrade from AA- to A+ is press-reported; the primary rating-action rationale was not independently confirmed in this research pass.
Key sources: Shell plc 20-F and 6-K filings (SEC EDGAR); Shell investor relations quarterly results and presentations; globenewswire.com Shell Q4/FY2025 and Q1 2026 results releases; stockanalysis.com; marketbeat.com; gurufocus.com; financecharts.com; the International Energy Agency’s Oil Market Report (May and June 2026 editions) and Global EV Outlook 2026; OPEC’s World Oil Outlook 2026; cnbc.com and forbes.com coverage of the ARC Resources acquisition; energyconnects.com and ieefa.org on the global LNG supply outlook; naturalgasintel.com on LNG contract economics; spglobal.com on European refining and CBAM; hfw.com and climatecasechart.com on the Milieudefensie litigation.
Prepared July 2, 2026. Figures are point-in-time and will change. This is research and analysis for educational purposes, not investment advice, not a recommendation, and not a solicitation. Energy stocks move with commodity prices that can swing sharply and unpredictably within a single quarter. Verify all figures independently and consult a licensed financial advisor before making any decision.