
Research date: July 2, 2026 | OSINT market research on Analog Devices, Inc. (ADI, Nasdaq), the number-two analog and mixed-signal chipmaker, the company that builds the parts converting real-world signals, voltage, temperature, motion, light, into digital data and back, sitting inside factories, cars, hospitals, and now a growing slice of the machines that power AI data centers.
Important disclaimer. This is OSINT-based research and educational analysis, not investment advice. I am not a financial advisor. Nothing here is a recommendation to buy or sell any security, and the scenarios below are illustrative, not price targets. ADI carries real sector-specific risk: the analog semiconductor cycle is genuinely boom-and-bust, roughly a fifth of revenue is tied one way or another to China at a moment of active trade friction, and a meaningful part of the current stock price rests on an AI data-center growth story that is still a small slice of total revenue. Market caps, prices, valuation multiples, and market-share figures are point-in-time (July 2, 2026), press-reported where noted, and move fast. Do your own due diligence and consult a licensed advisor.
Where this stock could be in 6 months, 1 year, 3 years, and 5 years
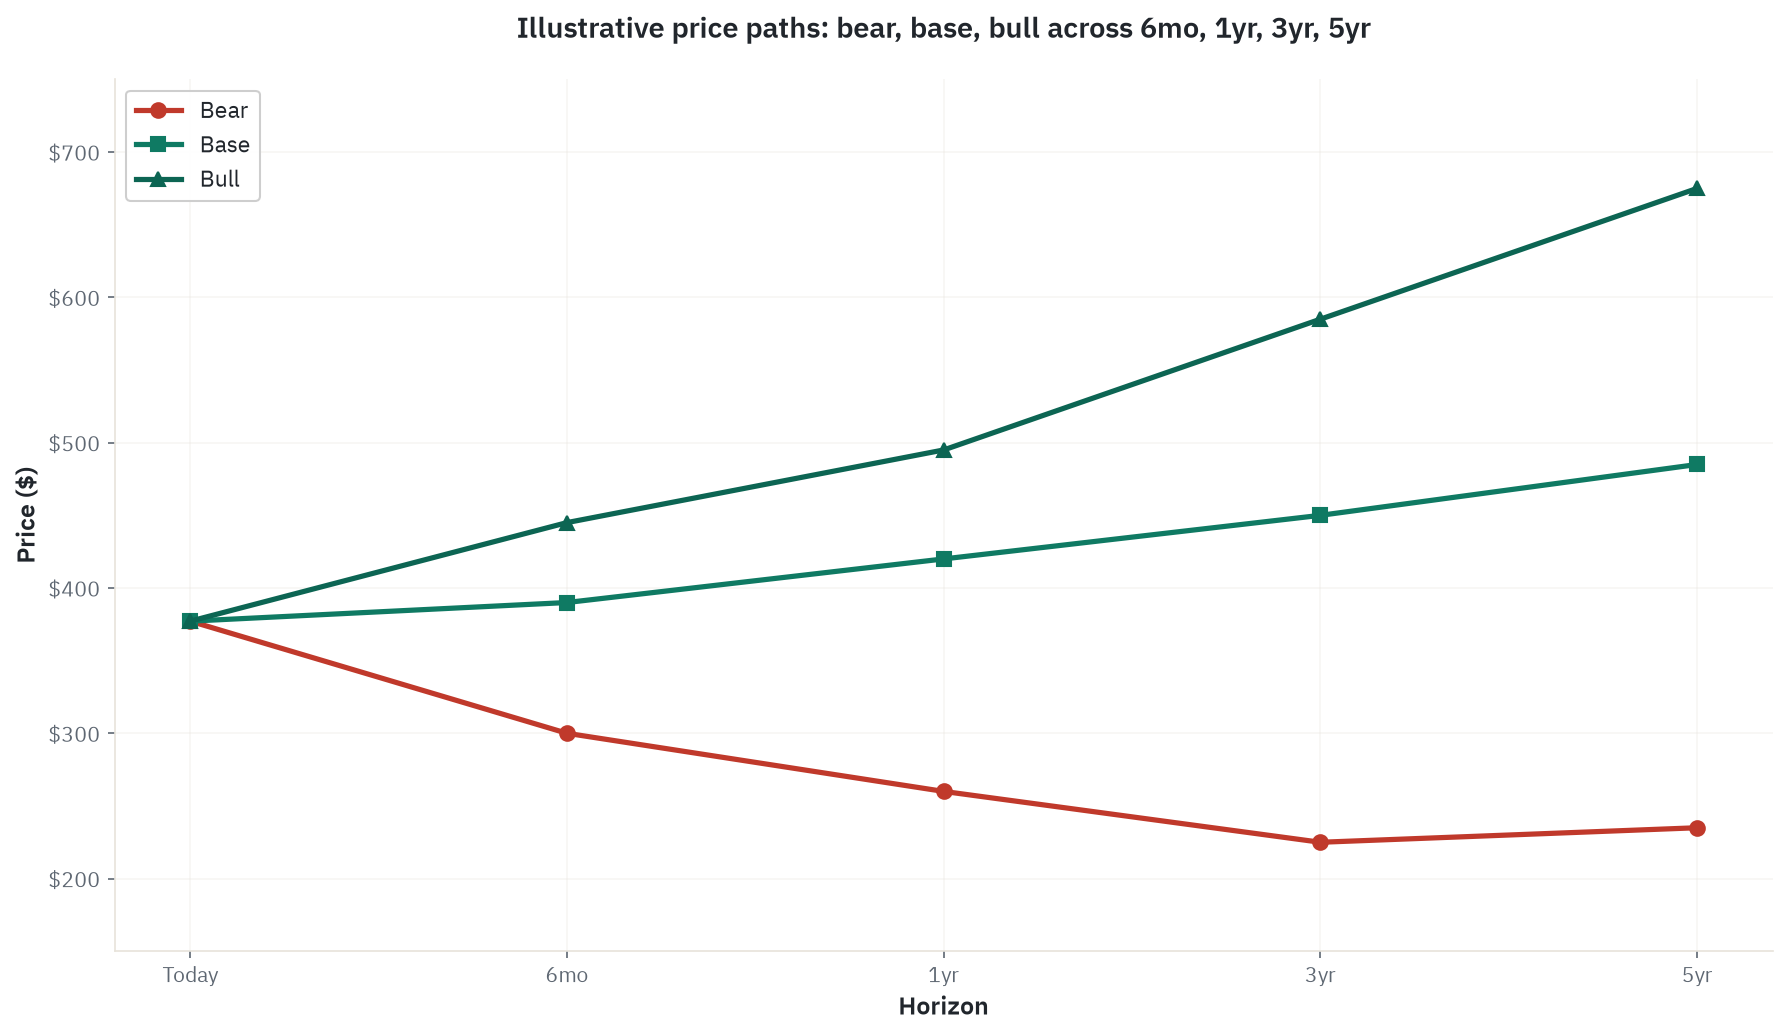
Every dollar figure below comes from the same method: a stated adjusted-earnings-per-share estimate at that horizon, built from a stated revenue and margin assumption, multiplied by a stated forward price-to-earnings exit multiple. None of it is a price target. The full arithmetic is laid out further down in “The scenarios in detail.”
6 months. By the time this window closes, ADI will have reported third-quarter fiscal 2026 results in August (already guided to $3.9 billion in revenue and $3.30 in adjusted earnings per share), full fiscal-year 2026 results in November or December, and an initial read on fiscal 2027 guidance. The base case has fiscal 2026 finishing near $14.8 billion with the current execution holding, and the stock trading sideways to modestly higher around $390 while the market waits for proof that growth survives the end of the restocking cycle. The bull case has ADI beating and raising through the back half of the year, a strong initial fiscal 2027 outlook, and the Empower Semiconductor deal closing on schedule, carrying the stock back toward its recent high near $445. The bear case has inventory building further, a softer fourth quarter, or a cautious fiscal 2027 outlook, combined with any further AI-capex headline scare, pulling the stock to roughly $300. The single number most likely to flip this window: days of inventory, currently 139 by one measure, 19 percent above the ten-year median of 117. A move above 150 in the next two quarterly reports is the double-ordering signal the bear case is watching for.
1 year. By the middle of 2027, the market will have two or three quarters of actual fiscal 2027 results to judge the thesis against. The central question shifts to whether industrial growth, which ran at 56 percent year over year in the most recent quarter, has settled into a mid-single-digit pace, proving the skeptical read that most of the recent surge was catch-up from the fiscal 2024 trough, or is holding above 10 percent, suggesting a genuine secular lift from automation and defense spending. The base case has ADI tracking toward $16 to $17 billion in annual revenue with the stock near $420, earnings growth roughly offsetting a modest pullback in the multiple. The bull case has data-center revenue exceeding a fifth of the total, Empower’s integrated voltage regulator technology beginning to ship, and the stock near $495. The bear case has the post-restocking slowdown hitting hard, automotive still stalled, and the AI narrative losing its grip on the multiple, with the stock near $260. What flips this window: the gap between bookings growth and revenue growth in the first couple of quarters of fiscal 2027. A wide gap, bookings slowing while revenue is still rising, is usually how the next correction announces itself before the numbers do.
3 years. By mid-2029, ADI will be roughly halfway along the road to management’s own long-range “$20 billion by 2030” vision, a target the company itself has called an aspiration voiced on an earnings call, not formal multi-year guidance. The base case has revenue around $17 to $18 billion, data center at 15 to 18 percent of the total, operating margin holding near its current 49 percent adjusted level, and the stock near $450, meaningful but unspectacular appreciation from today. The bull case has ADI clearly on pace for that $20 billion-plus target, Empower’s technology fully ramped at hyperscalers, data center at a fifth to a quarter of revenue, and the stock near $585. The bear case has growth stalling near $14 billion after a fiscal 2027-2028 correction, AI-linked capex having peaked, and Texas Instruments’ newer, cheaper 300-millimeter wafer capacity visibly taking share in mid-range analog, with the stock back near $225, roughly where it traded in mid-2025. What flips this window: whether Texas Instruments’ cost advantage is showing up as real design losses in ADI’s mid-range industrial catalog, something that would show up first as gross-margin compression, not as a headline.
5 years. By mid-2031, the structural picture is largely settled one way or the other. The base case has ADI near $19.5 billion in revenue, roughly on track for the $20 billion vision, with the stock around $485, a return of roughly 5 percent a year plus a dividend yield near 1.1 percent at today’s price. The bull case has ADI beating that vision at more than $23 billion, AI data center standing as a quarter or more of revenue, margins expanding to 50 to 52 percent, and the stock near $675, a return of roughly 12 percent a year. The bear case has revenue stuck around $14.5 billion, the AI data-center tailwind having faded, Texas Instruments’ cost advantage having compressed margins toward the mid-40s, and the stock near $235, a capital loss of roughly 38 percent from today. What flips this window: the long-run competitive contest with Texas Instruments. If TI’s newer fabs narrow the performance gap in mid-range analog, ADI’s addressable catalog shrinks and growth stalls with it; if ADI’s design-IP moat holds and that gap stays wide, the higher-end mix shift keeps compounding.
Where the read lands today. On balance the lean is Buy: this is a genuinely high-quality analog franchise with a real, if still small, new growth leg in AI data-center power, generating serious free cash flow and returning nearly all of it to shareholders. But the stock already carries a lot of that story in its price, trading at a clear premium to its own decade-long history, and the single thing most likely to flip the read toward Hold or worse is the inventory-days number ticking up while revenue growth slows, the same pattern that preceded the last 24 percent revenue drop.
Companion tool
Jump to the interactive dashboard to sort and filter ADI against its analog and power-semiconductor peer set, or download the Excel model to flex the scenario assumptions yourself.
TL;DR
Analog Devices designs and builds the chips that sit at the boundary between the physical world and digital computing: converting a voltage, a temperature, a vibration, or a sound into data a computer can use, and back again. It just posted a record quarter, $3.62 billion in revenue for the second quarter of fiscal 2026, up 37 percent year over year, as industrial demand rebounds hard from the 24 percent revenue collapse of fiscal 2024 and a new data-center power and optical business, booked inside the Communications segment, grows above 90 percent year over year on AI infrastructure buildout. Adjusted gross margin of 73 percent is the highest in the analog peer group, and the company returned 96 percent of free cash flow to shareholders in fiscal 2025 through a dividend raised for 22 consecutive years and steady buybacks. The catch is in the price: at roughly 56 to 58 times trailing earnings, a level the stock has not carried in years, the market has already paid up for a recovery to continue and for the data-center story to keep expanding from a base that is still only around 12 to 15 percent of revenue. Inventory sitting 19 percent above its ten-year median, an automotive segment barely growing at 2 percent, and Texas Instruments’ cheaper new wafer capacity all argue the same direction: this is a real business having a genuinely strong cyclical year, wearing a growth-stock multiple that assumes the strong year is now the normal year.
Explore it yourself: the interactive dashboard
Open the dashboard in a full screen
Fifty years of analog design wearing a growth-stock multiple
Most semiconductor stories run on Moore’s Law: shrink the transistor, double the density, sell the next generation. Analog Devices does not get that lever. There is no equivalent of “just move to the next node” for a chip whose job is to measure a real-world voltage without adding noise to it. Improving an analog circuit is closer to a chef refining a recipe over decades than to a factory installing faster machines: the gains come from accumulated design know-how, careful process tuning, and thousands of small choices about layout and materials, not from a scheduled upgrade. ADI has been doing this for roughly fifty years and has built a catalog of around 75,000 products as a result, many of them, in high-precision data conversion especially, without a direct functional equivalent anywhere else in the industry.
That slow-compounding, unglamorous business is not, on its face, a growth story. And for most of ADI’s history, the market has not priced it as one: it has traded as a high-quality, cyclical industrial supplier, prone to sharp downturns when its customers over-order and then digest inventory, as happened as recently as fiscal 2024, when revenue fell 24 percent from the prior year’s record. What has changed in 2026 is that a slice of ADI’s business, delivering power and optical signals to AI data centers, is growing fast enough that index providers and analysts have started treating the whole company as a growth stock rather than a defensive one. On June 27, 2026, Russell’s index reclassification moved ADI out of its value and defensive benchmarks and into its growth benchmarks, a mechanical, rules-based reshuffling rather than a fundamental change in the business, but a real signal of how the market currently frames the story. The trouble, as the rest of this piece works through, is that the data-center slice generating that reclassification is still a minority of ADI’s revenue, and the multiple has moved a lot faster than the mix has.
How the money flows
flowchart TD
    DEMAND["End demand\nIndustrial 50% + Automotive 24% + Communications 15% (data center >75% of this) + Consumer 11%"]
    DESIGN["ADI design and IP\n~75,000-product catalog: data converters, amplifiers, power management, RF/microwave, sensors"]
    OWNFAB["ADI internal fabs\nWilmington MA, Limerick Ireland, Beaverton OR, Camas WA (150mm/200mm, specialty processes)"]
    EXTFAB["External foundries\nTSMC, GlobalFoundries (standard CMOS volume)"]
    EQUIP["Fab inputs\nASML, Applied Materials, Shin-Etsu/SUMCO wafers"]
    GOV["CHIPS Act funding\nUp to $105M preliminary award tied to OR/WA/MA capacity"]
    ATP["Assembly, test, packaging\nInternal plus outside partners"]
    DIST["Distribution\nDirect sales ~50% + Arrow/Avnet ~50%"]
    RETURNS["Shareholder returns\n22 straight years of dividend growth, $4.40/share annualized"]
    CHINA["China exposure\npress-estimated 15-22% of revenue; active regulatory scrutiny"]

    EQUIP --> OWNFAB
    EQUIP --> EXTFAB
    GOV -.-> OWNFAB
    DESIGN --> OWNFAB
    DESIGN --> EXTFAB
    OWNFAB --> ATP
    EXTFAB --> ATP
    ATP --> DIST
    DIST --> DEMAND
    DIST --> RETURNS
    CHINA -.-> DIST
Read the chain top to bottom the way the actual dollars move. ADI’s engineers design a circuit, then decide where it gets built: proprietary, high-voltage, or radio-frequency processes go to ADI’s own fabs in Wilmington, Massachusetts, Limerick, Ireland, Beaverton, Oregon, and Camas, Washington, all running on older 150-millimeter and 200-millimeter wafers, while standard, high-volume manufacturing gets outsourced to TSMC or GlobalFoundries. Both paths depend on the same upstream toolmakers as the rest of the chip industry, lithography from ASML, deposition and etch tools from Applied Materials, and bare silicon wafers from suppliers like Shin-Etsu and SUMCO. The U.S. government sits in that fab-investment leg too, though modestly: a preliminary, non-binding CHIPS Act award of up to $105 million is earmarked to expand capacity at the Oregon, Washington, and Massachusetts sites, a small figure next to the $6.6 billion Texas Instruments has received for its own, much larger, 300-millimeter fab buildout described in this site’s Texas Instruments coverage.
Once a chip is built, tested, and packaged, it moves out through a distribution split that runs roughly half direct to large industrial and automotive customers and half through distributors like Arrow and Avnet to a long tail of smaller buyers, with no single customer accounting for more than 10 percent of revenue. The final link is capital return: because an ADI part, once designed into a customer’s product, typically keeps shipping unchanged for seven to fifteen years or longer, each design win becomes a long, high-margin annuity once the initial engineering work is paid for, which is why ADI could return 96 percent of free cash flow to shareholders in fiscal 2025 and has now raised its dividend for 22 consecutive years.
The dotted lines matter as much as the solid ones. Roughly 15 to 20 percent of revenue is tied to China by geography, with one press-reported figure putting fiscal 2024 China revenue closer to $2.1 billion, or about 22 percent of that year’s total, a detail not independently re-verified in this research pass but consistent with the general range. That exposure sits inside an increasingly active U.S.-China trade relationship: press reports describe an anti-dumping investigation opened by China’s Ministry of Commerce into imported analog chips, effective around September 2025, naming U.S. suppliers including ADI and Texas Instruments. This detail is sourced to trade and financial press rather than to ADI’s own filings, and it should be read as a live, developing risk to watch rather than a settled fact about ADI’s China business today.
What Analog Devices actually makes
Data converters are ADI’s signature product and the reason the company is often described as the industry’s benchmark: chips that translate an analog signal into digital data (an analog-to-digital converter, or ADC) or digital data back into an analog signal (a digital-to-analog converter, or DAC). These parts show up in medical imaging machines, industrial instrumentation, and communications equipment, and at the high-precision end, 18-bit, 20-bit, and 24-bit converters, ADI and Texas Instruments are effectively the only two credible suppliers, with ADI generally holding the performance edge.
Amplifiers and linear products condition a signal before it reaches a converter or leaves a system: operational amplifiers, instrumentation amplifiers, comparators. This is the deepest part of the catalog, spanning thousands of individual part numbers built up over decades.
Power management, including battery management systems (BMS), voltage regulators, and DC-DC converters, is both an automotive growth driver, since every electric vehicle needs sophisticated battery monitoring, and the newest AI data-center growth vector. The $1.5 billion acquisition of Empower Semiconductor, announced May 19, 2026 and expected to close in the second half of calendar 2026 pending antitrust clearance, brings integrated voltage regulator technology designed to deliver power closer to the AI processor itself, aimed at next-generation 800-volt data-center power architectures. Press coverage of the efficiency benefit is inconsistent, some accounts cite a 10 to 15 percent reduction in data-center compute power, others cite roughly 20 percent system-level power reduction, and still others cite a fourfold reduction in power footprint, and this research could not resolve those figures to a single ADI-stated number, so none of them should be read as a confirmed fact.
RF and microwave products handle high-frequency signal processing for 5G base stations, radar, electronic warfare, and satellite communications, work concentrated at ADI’s Chelmsford, Massachusetts facility, the same site slated for CHIPS Act-funded expansion.
Sensors and MEMS, accelerometers, gyroscopes, and temperature sensors, feed automotive stability control and driver-assistance systems as well as industrial vibration monitoring.
Digital signal processors are a legacy strength that has increasingly been absorbed into mixed-signal system-on-chip designs rather than sold as standalone parts.
Across all six lines, the economics run the same way. A chip that costs perhaps fifty cents to three dollars to actually manufacture, wafer, packaging, and test combined, can sell for anywhere from fifty cents to over one hundred dollars depending on performance tier, because the customer is paying for the engineering and the IP behind the part, not the silicon itself. That gap is why ADI’s adjusted gross margin sits at 73 percent, the highest in its peer group, and why a customer, once it has designed an ADI part into a product, rarely bothers to switch: re-qualifying an entire analog signal chain (layout, noise performance, thermal behavior, firmware) for a marginally cheaper competing part takes six to eighteen months of engineering time to save a few dollars on a bill of materials that is itself often only one to five percent of the total product cost. It is the electrical equivalent of re-plumbing a house to save a few dollars a month on a water bill: technically possible, rarely worth the disruption.
Who wins where
At the top of the analog food chain sit the two names with the broadest catalogs and the deepest design libraries: Texas Instruments, the clear scale and cost leader with its newer 300-millimeter wafer fabs, and Analog Devices, the performance leader with the highest margins in the group and the broadest industrial exposure. Between them they hold something close to a duopoly in the highest-precision data-conversion tier, where no third supplier currently competes credibly.
Below them, the field splits by end market rather than by technology. Infineon Technologies and STMicroelectronics lead in European automotive and industrial power, both pushing into silicon carbide for electric-vehicle powertrains. NXP Semiconductors is the purest automotive play in the group, with the broadest radar and in-vehicle networking position, but the least diversified revenue base, leaving it most exposed to the current soft auto cycle. ON Semiconductor has repositioned around silicon carbide and image sensors, smaller than the leaders but with the most operating leverage if a recovery broadens. Microchip Technology competes across a similar analog-plus-microcontroller footprint to ADI and TI but at meaningfully smaller scale, without the same pricing power in high-performance parts.
A commodity fringe sits underneath all of this: domestic Chinese analog suppliers such as SG Micro, 3Peak, and Silergy, which press coverage describes as expanding quickly in lower-performance segments and, in 3Peak’s case, explicitly targeting industrial and automotive categories that overlap with ADI’s core catalog. None of these names currently threaten ADI’s highest-performance products, where decades of accumulated design expertise are the real barrier, but the pressure on the commodity tail is real and, on the evidence available here, has not yet been sized precisely by any single named analyst report.
The reasoning that actually decides who keeps the economics in this industry is straightforward: value concentrates wherever a part cannot be easily substituted once it is designed in. That favors ADI and TI in high-precision analog, favors the automotive specialists only as long as their content-per-vehicle keeps rising, and leaves the commodity fringe fighting on price for parts a system designer would happily swap out if a cheaper option worked just as well.
Company by company: who’s who
Analog Devices (ADI) is the profile of this piece: the number-two pure-play analog and mixed-signal chipmaker by revenue, with a market capitalization reported around $184 billion to $190 billion depending on whether the figure is taken from an intraday quote or the prior day’s close (as of July 1-2, 2026; the gap is timing, not disagreement, on roughly 487 million shares outstanding). Second-quarter fiscal 2026 revenue was a record $3.62 billion, up 37 percent year over year, with adjusted operating margin at 49 percent and adjusted earnings per share of $3.09, up 67 percent. Bull: the broadest industrial exposure in the peer group, spanning factory automation, aerospace and defense, and instrumentation, is recovering fastest in the current cycle, with a genuinely new data-center power and optical leg emerging on top of it. Bear: at 56 to 58 times trailing earnings, well above its own ten-year average of roughly 38.5 times, the stock already prices in a great deal of that recovery holding, and the same industrial strength driving the beat is largely a bounce back from a trough, not yet proven as a new, higher sustainable growth rate.
Texas Instruments (TXN) is the largest pure-play analog chipmaker and the cost leader of the group, having started production at its first new 300-millimeter wafer fab in Sherman, Texas in December 2025, per trade-press coverage, with output expected to ramp through 2026 and a second site in Utah to follow. TI’s own disclosures put that wafer format at a 20 to 40 percent lower cost per die than the 150-millimeter and 200-millimeter lines ADI and most of the rest of the industry still run. Reporting a market capitalization near $270 billion as of July 1, 2026, TI trades at a forward price-to-earnings multiple of roughly 36 times, the richest in the peer group, and its stock is up around 69 percent year to date, ahead of ADI’s own strong year. Read the fuller picture in this site’s dedicated Texas Instruments deep dive. Bull: the cost advantage compounds as the new fabs ramp toward full utilization, letting TI price aggressively in commodity and mid-range analog exactly where ADI’s catalog is most exposed. Bear: the capex required to build that advantage has weighed on free cash flow until utilization catches up, and roughly half of TI’s revenue is tied to products shipped into China.
Infineon Technologies (IFX, XETRA) is Europe’s largest power-semiconductor and automotive-chip supplier, with roughly 106 billion euros in market capitalization as of July 1, 2026 and a stock up around 107 percent year to date in euro terms, among the strongest performers in the group. Bull: global leadership in silicon carbide for electric-vehicle powertrains, rising content per vehicle, and grid-modernization demand all sit ahead of it. Bear: intensifying Chinese silicon-carbide competition and a still-soft European automotive cycle are pressuring exactly the segment it leads.
STMicroelectronics (STM, NYSE) is a diversified European mixed-signal supplier with automotive as its largest end market, trading around $65 billion in market capitalization and up roughly 164 percent year to date, a move flattered by a deeply depressed earnings base after net income fell 86.6 percent year over year; its trailing price-to-earnings ratio of roughly 427 times is a statistical artifact of that collapse, not a meaningful valuation signal. Bull: the cheapest name in the group on forward estimates once earnings normalize, with a silicon-carbide ramp and a major customer relationship with Apple. Bear: heavy customer concentration and a European cost base leave it more exposed than peers if the recovery stalls.
NXP Semiconductors (NXPI, Nasdaq) is the purest automotive semiconductor play in the group, with roughly $71 billion in market capitalization and the weakest year-to-date stock performance of the peer set, up about 26 percent, reflecting a soft global auto cycle. Bull: leadership in radar and in-vehicle networking positions it well if autonomous-driving content per vehicle accelerates as expected. Bear: the heaviest automotive revenue concentration in the group, over 60 percent by some estimates, makes it the name most directly exposed if the auto recovery keeps disappointing.
ON Semiconductor (ON, Nasdaq) has repositioned from a broad commodity supplier toward silicon carbide and image sensors, with roughly $37 billion in market capitalization, up about 69 percent year to date, and a trailing price-to-earnings ratio near 63 to 67 times that, like STM’s, reflects depressed cyclical earnings rather than a settled valuation. Bull: silicon-carbide leadership for EV traction inverters and automotive image sensors give it real content-growth exposure. Bear: its recently announced roughly $7 billion Synaptics acquisition has drawn analyst skepticism over dilution and strategic fit.
Microchip Technology (MCHP, Nasdaq) rounds out the peer set with a broad analog-plus-microcontroller catalog similar in shape to ADI’s and TI’s but at meaningfully smaller scale, around $49 billion in market capitalization. Bull: a track record of accretive acquisitions and straightforward cyclical recovery leverage as its own end markets normalize. Bear: less differentiated in high-performance analog than ADI or TI, and recent convertible-note issuance signals a more leveraged balance sheet heading into the recovery.
What the filings say
ADI’s fiscal year ends on the first Saturday after October 31, so “fiscal 2026” runs from roughly November 2025 through October 2026. The figures below trace to the company’s own 8-K earnings releases and its fiscal 2025 Form 10-K, filed with the SEC.
Revenue, the cycle in one table. Fiscal 2023 (ended October 28, 2023) closed at a then-record $12.3 billion. Fiscal 2024 (ended November 2, 2024) fell 24 percent to $9.4 billion as customers across every end market worked down excess inventory ordered during the 2021-2023 shortage era. Fiscal 2025 (ended November 1, 2025) recovered 17 percent to $11.0 billion. The first half of fiscal 2026 alone totaled $6.78 billion, up 34 percent year over year, implying an annualized run rate above $13.5 billion even before the guided $3.9 billion third quarter is booked.
Segment mix has flipped hard toward industrial and communications. In the second quarter of fiscal 2026 (ended May 2, 2026), Industrial was 50 percent of revenue at $1.799 billion, up 56 percent year over year; Automotive was 24 percent at $871.6 million, up just 2 percent, the clear laggard; Communications was 15 percent at $554.7 million, up 79 percent, with data center described by management as more than 75 percent of that segment and growing above 90 percent year over year; Consumer was 11 percent at $397.8 million, up 23 percent. For comparison, full-year fiscal 2025 mix ran Industrial 45 percent, Automotive 30 percent, Consumer 13 percent, and Communications 13 percent, meaning automotive’s share of the mix has actually shrunk over the past year even as its dollar revenue barely grew, a function of everything else growing faster around it rather than automotive itself contracting.
Margins are near records. Adjusted gross margin reached 73.0 percent in the second quarter of fiscal 2026, up 360 basis points year over year and 180 basis points sequentially, against a GAAP gross margin of 67.3 percent, the roughly 570-basis-point gap driven mainly by intangible-asset amortization tied to the 2021 Maxim Integrated acquisition. Adjusted operating margin reached 49.0 percent, up 780 basis points year over year, a level management itself has called “a near-term ceiling given current factory utilization levels” on the Q2 FY2026 earnings call. GAAP operating margin was 38.1 percent that same quarter.
Earnings have accelerated sharply off the trough. Adjusted earnings per share ran roughly $7.90 in fiscal 2024, $9.52 in fiscal 2025, $2.60 in the first quarter of fiscal 2026, and $3.09 in the second quarter, up 67 percent year over year and a company record. Guidance for the third quarter of fiscal 2026 calls for $3.30 in adjusted earnings per share, plus or minus $0.15, on revenue of $3.9 billion, plus or minus $100 million, at a tax rate of 12 to 14 percent.
Cash generation is strong and largely returned to shareholders. Trailing-twelve-month operating cash flow through the second quarter of fiscal 2026 was $5.106 billion, 40 percent of revenue, and free cash flow was $4.565 billion, 36 percent of revenue. ADI returned 96 percent of fiscal 2025 free cash flow to shareholders, split between $1.9 billion of dividends and $2.2 billion of buybacks that year; in the second quarter of fiscal 2026 alone it returned $1.309 billion via $536 million of dividends and $773 million of buybacks. The quarterly dividend was raised 11 percent in February 2026 to $1.10 per share, or $4.40 annualized, the 22nd consecutive year of dividend increases. Shares outstanding have declined to roughly 487.1 million as of the second quarter of fiscal 2026 from around 498 million a year earlier.
The balance sheet still carries the Maxim-era debt load. As of May 2, 2026, ADI held $2.437 billion in cash and equivalents plus $1.002 billion in short-term investments, against $8.135 billion in total debt, for net debt of roughly $4.7 billion. Shareholders’ equity stood at $33.742 billion, total assets at $47.99 billion, and debt-to-equity at 25.5 percent, a level management describes as healthy given more than $5 billion in trailing operating cash flow. The debt is primarily a legacy of the $21 billion, all-stock Maxim Integrated acquisition that closed in August 2021; that deal also expanded shares outstanding from roughly 370 million pre-deal to today’s 487 million, a dilution of about 32 percent that the raw revenue and earnings growth numbers do not, on their own, make visible. Management says integration is ahead of schedule, with “hundreds of millions” in revenue synergies already realized and a target of $1 billion by 2027; cost synergies are described as substantially achieved, and the remaining GAAP-to-adjusted margin gap is now mostly the ongoing intangible amortization from that deal, which will decline over time as those assets fully amortize.
Capital investment stays modest relative to peers. Research and development spending has held steady at 16 percent of revenue in both fiscal 2024 ($1.488 billion) and fiscal 2025 ($1.766 billion). Capital expenditure guidance for fiscal 2026 is 4 to 6 percent of revenue, well below the double-digit capex intensity Texas Instruments is running through its new 300-millimeter fab buildout, a direct reflection of ADI’s fab-lite manufacturing model.
CHIPS Act status remains preliminary. ADI received preliminary, non-binding terms in January 2025 for up to $105 million in direct federal funding, split roughly $80 million toward the Camas, Washington and Beaverton, Oregon fabs and the remainder toward the Chelmsford, Massachusetts site, targeting a roughly 70 percent capacity increase in Oregon and Washington and about 500 new manufacturing and engineering jobs. As of this research date, no evidence was found that the award has since been finalized, renegotiated, or converted to an equity stake, unlike some larger CHIPS recipients whose awards the current administration has restructured, but its “preliminary” status as of the original announcement has also not been confirmed as resolved.
Disclosed risk factors, drawn directly from ADI’s fiscal 2025 Form 10-K, include the cyclicality of the semiconductor industry and customer inventory adjustments (listed first among the risk factors), concentration in industrial and automotive end markets, dependence on a limited number of key customers and distributors, international operations and geopolitical risk including China trade tensions and export controls, integration risk from the Maxim acquisition, competition from Texas Instruments, Infineon, STMicroelectronics, NXP, and others, intellectual-property protection in analog and mixed-signal design, and supply-chain disruption risk tied to third-party foundries.
Ownership is dominated by institutions, at roughly 91 percent, led by Vanguard at about 7.47 percent (36.5 million shares as of March 2026) and BlackRock at roughly 7 to 10 percent, with insider ownership below 5 percent on a single-class, one-share-one-vote structure. CEO Vincent Roche sold approximately 10,000 shares under a pre-arranged 10b5-1 trading plan in early June 2026, a routine transaction relative to his overall holdings, not a red flag on its own, though its timing near the stock’s June all-time high is worth noting as context rather than as a signal.
What the market is paying
All figures in this section are point-in-time as of July 2, 2026, drawn from Yahoo Finance and stockanalysis.com and cross-checked between them where possible; treat every number here as a snapshot, not a live quote.
Price and range. ADI’s last quote was roughly $377.16 intraday on July 2, 2026, down from a prior close of $388.98 on July 1 and $397.17 on June 30. The 52-week range runs $218.37 to $445.91, meaning today’s price sits in the upper-middle of that band, about 44 percent above the 52-week low and about 15 percent below the all-time closing high of $445.48 set on June 22, 2026, pulled off that high by a sharp late-June selloff described below.
Returns, computed from Yahoo Finance’s daily-close history, price only, excluding a dividend yield of roughly 1.1 to 1.9 percent depending on the measurement date. Over one month, ADI is down about 11 percent; over three months, up about 19 percent; over six months, up about 38 percent; year to date, up about 39 percent; over one year, up about 54 percent; over three years, up roughly 104 percent; over five years, up roughly 127 percent. Web-search summaries of some data-vendor pages quoted wildly inconsistent year-to-date figures (ranging from roughly 11 percent to 54 percent) depending on how the snippet was generated; this piece uses figures computed in-house from Yahoo’s raw daily-close series as the more reliable source, and treats any return quoted to more than one decimal place with a “roughly” attached to it.
Volatility has been genuinely elevated. Beta over five years of monthly data runs around 1.18, consistent across two data providers. Trailing one-year realized volatility, annualized from daily log returns, is roughly 34.5 percent; trailing three-month realized volatility is a much higher 48.1 percent, reflecting the run-up into the June all-time high followed by a violent reversal. ADI fell 8.6 percent on June 23 and a further 7.6 percent on June 26, 2026, on press reports that SK Hynix was slowing next-generation high-bandwidth-memory capacity expansion, a headline about a memory product ADI does not make, since its own AI data-center exposure is in power delivery and optical signaling, not memory. Peak to trough, the stock is down about 15.3 percent from its June 22 closing high to the July 2 print, in six trading days. For scale, the stock’s prior two-year maximum drawdown was roughly 32.5 percent, from about $243.82 in February 2025 to about $164.60 in April 2025, during that spring’s broader tariff-driven market selloff, a useful reference point for how far this name can fall in a genuine risk-off shock.
Relative to the index and named peers, computed over the same windows: ADI has comfortably beaten the S&P 500 from the three-month window outward (roughly plus 39 percent year to date and plus 54 percent over one year for ADI versus roughly plus 9 percent and plus 20 percent for the index over the same windows), but it is a laggard within its own sector. The Philadelphia Semiconductor Index (SOX) is up roughly 78 percent year to date and 125 percent over one year, more than double ADI’s return in both windows, because that index is dominated by AI-compute names, foundry, memory-adjacent, and GPU-supply-chain businesses, riding a capex boom that ADI’s analog, power, and sensor mix is only partially levered to. Against the named peer group, ADI’s year-to-date return trails Texas Instruments (roughly plus 69 percent), ON Semiconductor (roughly plus 69 percent), Infineon (roughly plus 107 percent in euro terms), and especially STMicroelectronics (roughly plus 164 percent, a figure flattered by that company’s depressed earnings base), and is ahead only of NXP Semiconductors (roughly plus 26 percent, the group’s weakest performer given its heavier auto exposure in a soft cycle).
Valuation is the crux of the bear case. Trailing price-to-earnings sits at roughly 56 to 58 times, two data sources agreeing closely. Forward price-to-earnings is genuinely disputed between vendors, 27.24 times on stockanalysis.com versus 32.47 times on Yahoo Finance as of the same date, most likely reflecting different consensus-estimate windows; the honest framing is “high-20s to low-30s,” not a single number. Other multiples: PEG ratio 1.21, price-to-sales 14.42 times, price-to-book 5.44 times, price-to-free-cash-flow 40.24 times, and enterprise-value-to-EBITDA reported anywhere from the high 20s to the low 30s depending on vendor and exact date. Against ADI’s own history, today’s trailing multiple is a clear premium: the ten-year average trailing price-to-earnings is cited at roughly 38.5 times across two aggregator pages (which may share an underlying data provider rather than being fully independent second opinions), and a five-year average of roughly 46.5 times comes from a single source and should be treated as directional only. ADI’s own trailing price-to-earnings was as low as 40.6 times as recently as April 21, 2026, meaning most of the current premium was built in the roughly ten weeks since, alongside the run from the low $300s to the mid-$400s and partway back. Against named peers, ADI’s trailing multiple (roughly 57 times) is richer than Texas Instruments (roughly 51 times, per this research’s own calculation methodology) and NXP (roughly 26 times), while ON Semiconductor’s (roughly 67 times) and STMicroelectronics’ (roughly 427 times) trailing multiples are themselves artifacts of depressed current-year earnings rather than genuinely richer valuations; these peer figures were pulled from single-vendor sources and were not independently cross-checked for this piece, so treat them as directional. On forward earnings, ADI’s high-20s-to-low-30s multiple sits roughly in the middle of its peer range (Texas Instruments around 36 times, NXP around 18 times, STMicroelectronics around 39 times, ON Semiconductor around 28 times), not the cheapest name in the group and not the richest either.
Liquidity and short interest show no unusual positioning. Average daily volume runs roughly 4.3 million to 5.8 million shares depending on the measurement window, ordinary liquidity for a large-cap name. Short interest sits at 2.47 to 2.48 percent of float, roughly 12.05 million shares as of a mid-June 2026 settlement date, up about 27 percent from roughly 9.48 million shares in late May, a real but modest increase that coincides with the broader sector selloff and reads more like hedging than a directional bet against the company; days-to-cover remains low at roughly 2.6 days.
The sell-side is broadly bullish but has been trimming targets into the selloff. Consensus rating runs Buy to Strong Buy depending on the data provider, with analyst counts varying from 21 to 36 across trackers, itself a methodology difference rather than a real disagreement. The mean price target clusters in the $430s to $450s (roughly $432 to $454 depending on the aggregator, with a range across individual targets of about $363 to $550), implying meaningful upside from the current quote if the average holds, though that is sell-side opinion, not a forecast this research endorses. Individual recent moves illustrate the trimming pattern: Cantor Fitzgerald raised its target to $550 from $510 (Buy) on June 29; Stifel Nicolaus raised to $498 from $450 (Buy) on June 24; Wells Fargo cut its target to $515 from $560 while reiterating Buy on June 9, all after ADI’s record fiscal second-quarter print on May 20. No downgrades to Hold or Sell were found in the recent-actions data reviewed for this piece.
Technically, as of July 2, 2026, ADI trades below both its 20-day and 50-day simple moving averages (both around $409), meaning buyers who entered during the late-spring rally are underwater on a short-term basis, while its 100-day average near $371 sits just below the current price as the nearest recently defended support, and its 200-day average near $318 is far below the current quote, meaning the broader uptrend from late 2025 remains intact even after the June pullback. None of this is a signal on its own; it simply describes where recent buying and selling have clustered.
What the crowd is saying
The dominant narrative in news coverage through the first half of 2026 has ADI pivoting from a defensive, quality-compounder story to a pure-play AI-infrastructure growth story. The record second-quarter print, the 79 percent jump in Communications-segment revenue, and the Empower Semiconductor acquisition all fed that framing, and analyst target increases came in clusters through May and June from firms including Wells Fargo, KeyBanc, and Cantor Fitzgerald. But the stock fell anyway in the days after that beat-and-raise quarter, a “sell the news” pattern that suggests the good news was already substantially priced in. Coverage of the AI data-center angle is now near-total in earnings-call commentary and analyst notes; industrial and automotive growth, which together make up the large majority of the business, barely register by comparison.
Retail and social chatter around ADI appears limited and organic rather than coordinated: searches for large-volume Reddit discussion in the relevant investing communities turned up little, suggesting ADI is not a meme-stock or thin-float pump target, and no short-seller reports, activist campaigns, or promotional patterns were found. Where retail sentiment does show up, it reads as bullish on the fundamentals but cautious on timing and valuation, consistent with options-market data showing rising long-dated hedging activity even as near-term positioning stays constructive, a pattern that looks more like sophisticated investors quietly reducing exposure at elevated prices than a signal of manipulation. The June 27 Russell index reclassification from value and defensive benchmarks into growth benchmarks landed within days of the sharpest part of the June selloff, and some commentary has read that timing as a “top indicator,” the observation that mechanical, rules-based index reallocation into a growth style often arrives late in a cycle rather than early. That is itself a piece of narrative, not a fact, but it is worth flagging as the kind of thing sentiment-watchers point to after the fact.
On the employee and customer side, workplace sentiment reads as stable: ADI carries a 4.0-out-of-5.0 rating on Glassdoor across roughly 3,000 reviews, with 80 percent of reviewers saying they would recommend the company and 69 percent expressing a positive outlook, figures that are self-reported and should be read as directional color, not verified fact. Customer and design-in signals, drawn from earnings-call language and public design-win announcements rather than from any independent survey, describe active engagement with hyperscalers and AI chip developers on both Empower’s silicon capacitors, already in production, and its integrated-voltage-regulator programs, still in development.
The sharpest divergence between the crowd’s narrative and what the underlying numbers show sits in two places. First, growth versus cyclicality: the market is currently pricing ADI as a structural AI-infrastructure grower, but the 56 percent industrial growth rate driving most of the recent beat is substantially a recovery from the fiscal 2024 trough, and inventory sitting well above its historical median (139 to 168 days depending on the exact measurement, against a ten-year median of 117) is the kind of signal that has, in ADI’s own recent history, preceded a sharp correction rather than a permanent step-up in demand. Second, valuation: independent discounted-cash-flow models referenced in this research’s sentiment analysis put intrinsic value in a $183 to $300 range, well below the current market price, a gap of roughly 40 to 50 percent depending on the model’s assumptions; management’s own framing, that rapid earnings growth justifies the premium, is a real argument, but the size of the gap between those DCF estimates and the market price leaves little room for anything to go wrong. None of this is presented as settled fact: DCF outputs are only as good as their growth and discount-rate assumptions, and reasonable analysts disagree sharply on both.
How soft is all of this. Genuinely soft. News-flow tone (“warming,” “cooling”) is an inference from the mix of analyst actions, not a measured quantity. The absence of loud retail chatter is itself informative but is an absence, not a positive data point. Glassdoor and customer-engagement language both carry self-selection and PR framing built in. The one piece of this section that is closest to hard data, and the one worth actually tracking, is the inventory-days figure: 19 percent above the ten-year median, moving in a direction that historically has mattered a great deal for this stock.
Is this growth durable, or is it catch-up wearing a new costume?
The structural case for durability rests on three legs that did not exist, or barely existed, the last time ADI traded through a cycle. Industrial automation spending has a genuine policy and demographic tailwind behind it beyond the normal capex cycle: aging workforces and reshoring pressure are pushing factories toward automation regardless of where interest rates sit, and aerospace and defense spending, trade press estimates put at more than $1 billion annually for ADI, though ADI does not break this line out itself, is riding NATO rearmament and similar national-security budget increases that are unlikely to reverse quickly. Automotive content per vehicle is also rising structurally: ADI’s own estimate has automotive analog content per vehicle climbing from roughly $150 to $200 today toward $400 to $600 or more over the next decade, as electrification and driver-assistance features spread regardless of whether a given year’s total vehicle production is strong or weak. And the AI data-center leg, while still a minority of revenue, is a genuinely new demand source with no direct precedent in ADI’s history, tied to hyperscaler capital spending that Moody’s projects approaching $820 billion in 2027.
The cyclical, bearish case is just as real and has a specific, near-term trigger. ADI’s own fiscal 2024, a 24 percent revenue collapse from the prior year’s record, is a documented, recent example of exactly the pattern the bear case fears repeating: customers over-order during a recovery, inventory builds in the channel, and a sharp correction follows once that inventory works its way back down. The current inventory level, 19 percent above the ten-year median by one measure, is the specific, dated indicator this research keeps returning to, and management’s description of that inventory as “healthy and manageable” is, as the skeptic case in this research bluntly notes, the same language companies typically use right before a correction becomes visible. The trigger and its rough timing are specific too: if days of inventory rise above 150 over the next two quarterly reports while revenue growth simultaneously decelerates, the double-ordering unwind is very likely underway, and the historical precedent suggests it could move fast once it starts. Layered on top of that company-specific risk is a broader one: the Philadelphia Semiconductor Index has traded as much as 65 percent above its 200-day moving average in 2026, a level some market commentary has compared to the run-up before the 1999-2000 technology peak, and investor Michael Burry has disclosed short positions against a semiconductor-sector exchange-traded fund and several AI-linked names, per financial press coverage, describing certain 2026 chip-spending announcements as a possible “peak signal.” ADI’s own beta of roughly 1.18 means that even a moderate, sector-wide de-rating, unrelated to anything ADI itself does, would mechanically pull the stock down further than the sector average.
The most likely outcome, on the evidence gathered here, sits between these two extremes rather than fully at either pole. The AI data-center leg is real, sourced to ADI’s own reported segment growth, but it is not yet close to large enough, at roughly 12 to 15 percent of total revenue, to carry the whole company’s growth rate on its own if industrial and automotive normalize to their historical mid-single-digit pace, which is the outcome the analog semiconductor industry’s own multi-decade base rate would predict. The single most important open question, the one this research could not resolve to a firm answer, is whether the current industrial strength has a genuine secular overlay from automation, defense, and energy spending on top of the ordinary cyclical bounce, or whether it is almost entirely the latter. The inventory-days trajectory over the next two to three quarterly reports is the most direct, most dated way for a reader to watch that question resolve in something close to real time.
The scenarios in detail
The driver tree
Four variables decide most of the difference between ADI’s bull, base, and bear outcomes over the next five years.
1. The sustainable growth rate once the restocking catch-up fades. Industrial revenue grew 56 percent year over year in the most recent quarter, but that comparison sits against the fiscal 2024 trough. Once restocking completes, likely in late fiscal 2026 or early fiscal 2027, the real question is whether ADI can sustain something like 10 to 15 percent annual growth (supporting the long-range $20 billion-by-2030 vision) or reverts to the historical 5 to 8 percent band (implying the current multiple is too rich).
2. AI data center’s share of revenue. Data center revenue, booked inside Communications, is roughly 12 to 15 percent of the annualized run rate today and growing above 90 percent year over year. One sell-side estimate from Bank of America puts the market-wide analog-semiconductor AI data-center opportunity at roughly $7.9 billion in 2025, growing to roughly $27 billion by 2030, a compound growth rate near 28 percent; this is a market-size estimate from a single named house, not ADI’s own disclosed figure or a guaranteed share of that market for ADI specifically. Whether ADI captures a meaningful, growing slice of that expansion, especially through Empower’s power-delivery technology, determines whether today’s AI narrative premium is earned or borrowed.
3. Margin trajectory. Adjusted gross margin is 73 percent and adjusted operating margin 49 percent, both near records, with management describing 49 percent as close to a ceiling given current factory utilization. The open question is whether continued mix shift toward higher-value data-center and industrial-power products pushes margins higher still, or whether Texas Instruments’ 300-millimeter cost advantage and the near-term drag from Empower’s integration pull them the other way.
4. The valuation multiple itself. ADI trades at roughly 56 to 58 times trailing earnings and, by disputed measures, 28 to 32 times forward earnings, both well above its own ten-year trailing average of roughly 38.5 times. That multiple embeds a real AI narrative premium on a business that is still 85 to 88 percent non-AI revenue. Whether the premium expands, holds, or compresses depends largely on how the first three drivers play out.
Bull: ADI reaches roughly $23 billion in revenue by fiscal 2031, and the AI narrative is earned
Assumptions, all labeled estimate: revenue compounds at roughly 15 percent a year from fiscal 2025’s $11.0 billion base, exceeding the $20 billion-by-2030 vision; AI data center grows from roughly 12 to 15 percent of revenue toward 25 percent, driven by Empower’s integrated voltage regulators, optical interconnects, and new 800-volt and 1,600-volt data-center power architectures; industrial growth sustains 8 to 10 percent annually after restocking completes, on factory automation, aerospace and defense, and energy-grid modernization; automotive recovers to mid-to-high single-digit growth as battery-management content per vehicle roughly doubles and driver-assistance adoption broadens; adjusted operating margin expands to 50 to 52 percent on favorable mix and higher utilization; and share count declines to roughly 455 million through continued buybacks.
The resulting trajectory: roughly $14.8 billion in revenue and $12.75 in adjusted earnings per share in fiscal 2026, roughly $19 billion in revenue and $18.50 in adjusted earnings per share by fiscal 2028, and roughly $23 billion in revenue and $22.50 in adjusted earnings per share by fiscal 2031. At an illustrative 30 times forward earnings, a growth-premium multiple justified by above-market earnings growth and consistently high capital returns, that lands near $675, an estimate, not a target. What has to be true: AI data-center capital spending keeps growing through 2030 without a significant correction, Empower’s technology achieves broad hyperscaler adoption, industrial growth carries a genuine secular overlay rather than only cyclical catch-up, and ADI’s shift toward higher-value products outruns Texas Instruments’ cost pressure on the commodity tail. What most likely breaks it: AI data-center capital spending peaks in 2027 or 2028 and normalizes, shrinking the fastest-growing revenue stream back to mid-teens growth and removing the narrative premium supporting a 30-times-plus forward multiple.
Base: ADI reaches roughly $19.5 billion by fiscal 2031, broadly on track for the vision
Assumptions, all estimate: revenue compounds at roughly 11 percent a year from the fiscal 2025 base; AI data center grows to roughly 18 percent of revenue, a solid but not dominant contributor, with Empower adding incremental revenue starting in fiscal 2027 without becoming a transformative franchise on its own; industrial growth normalizes to 5 to 7 percent once restocking completes in late fiscal 2026 or early fiscal 2027; automotive recovers modestly to 4 to 6 percent growth as battery-management content rises against a flat-to-modest global production backdrop; adjusted operating margin holds near its current 49 percent, with Empower’s integration creating a temporary drag before reaching steady state; and share count declines to roughly 465 million.
The resulting trajectory: roughly $14.8 billion in revenue and $12.75 in adjusted earnings per share in fiscal 2026, roughly $17 billion in revenue and $15.50 in adjusted earnings per share by fiscal 2028, and roughly $19.5 billion in revenue and $18.00 in adjusted earnings per share by fiscal 2031. At an illustrative 27 times forward earnings, a modest compression from today’s 28-to-32-times range toward the long-run average, that lands near $485, an estimate. What has to be true: post-restocking growth stays above mid-single digits, meaning there is a genuine secular component to industrial demand and not only a cyclical bounce, AI data center remains a real but not decisive contributor, automotive recovers slowly, and no major fiscal 2027-2028 inventory correction materializes. What most likely breaks it: a repeat of the fiscal 2023-2024 inventory correction, triggered by customers who over-ordered during the fiscal 2025-2026 recovery, exactly the dynamic the current 139-to-168-day inventory level is flagged as a leading indicator for.
Bear: growth normalizes, the AI premium evaporates, revenue stalls near $14.5 billion
This scenario is anchored on the strongest disconfirming evidence gathered in this research. Assumptions, all estimate: revenue compounds at only 5 to 6 percent from the fiscal 2025 base as restocking completes and AI-linked capital spending peaks; data-center revenue growth decelerates from above 90 percent to 15 to 20 percent, stabilizing at 12 to 14 percent of total revenue rather than the 20-to-25 percent the bull case needs; industrial growth drops to 3 to 5 percent as global factory-automation spending cycles down, worsened by a mild 2028-2029 recession; automotive stays weak at 0 to 3 percent growth as electric-vehicle adoption decelerates further and tariff disruption persists; a double-ordering unwind pulls revenue down to roughly $13.5 billion before a modest recovery; adjusted operating margin compresses to 44 percent on lower utilization and unfavorable mix; Texas Instruments’ 300-millimeter fabs are fully online by 2028 and pricing aggressively in mid-range analog, eroding an estimated 50 to 100 basis points of ADI’s margin annually; and share count declines only to roughly 478 million as management redirects cash toward balance-sheet protection during the correction.
The resulting trajectory: roughly $14.5 billion in revenue and $12.50 in adjusted earnings per share in fiscal 2026, a correction to roughly $13.5 billion in revenue and $10.50 in adjusted earnings per share by fiscal 2028, and a modest recovery to roughly $14.5 billion in revenue and $11.70 in adjusted earnings per share by fiscal 2031. At an illustrative 20 times forward earnings, a return to the low end of ADI’s historical range, reflecting a business re-classified back to a cyclical analog compounder rather than a growth stock, that lands near $235, an estimate. What has to be true: AI data-center capital spending has peaked and is normalizing, the fiscal 2025-2026 industrial recovery proves to have been mostly restocking rather than structural, Texas Instruments’ cost advantage translates into real, visible share gains in mid-range analog, and the forward multiple compresses from 28-to-32 times back toward 20-to-22 times as the market strips out the AI premium. The June 2026 episode, where the stock fell 15 percent in six trading days on a headline about a memory product ADI does not even make, is offered as evidence of exactly how fragile that premium can be. What most likely breaks the bear case: data-center revenue exceeding a fifth of total revenue by fiscal 2027, combined with post-restocking industrial growth sustaining above 10 percent, which together would prove the secular growth thesis is real rather than narrative and prevent the multiple from compressing to historical averages.
| Horizon | Bear | Base | Bull | Dominant factor |
|---|---|---|---|---|
| 6 months | ~$300 | ~$390 | ~$445 | fiscal 2026 results quality and initial fiscal 2027 guidance |
| 1 year | ~$260 | ~$420 | ~$495 | whether industrial growth normalizes or sustains above 10 percent |
| 3 years | ~$225 | ~$450 | ~$585 | credibility of the $20 billion vision; data center’s share of revenue |
| 5 years | ~$235 | ~$485 | ~$675 | structural growth durability versus Texas Instruments’ cost position |
Catalysts and timeline
Near term: third-quarter fiscal 2026 earnings in August 2026 (already guided to $3.9 billion revenue and $3.30 adjusted earnings per share, with industrial’s ability to sustain above 40 percent year-over-year growth and any inflection in automotive as the key data points); the Empower Semiconductor deal’s expected close in the second half of calendar 2026, pending antitrust clearance, where a delay or renegotiation would be a clear negative signal; fourth-quarter and full-year fiscal 2026 results in November or December 2026, which will frame how credible the $20-billion path looks if the year finishes above $15 billion; initial fiscal 2027 guidance, likely given in December 2026 or February 2027, the single most important near-term catalyst for whether management itself expects post-restocking growth to hold; and the inventory-days figure each quarter, currently 139 days, with any move above 150 the clearest real-time double-ordering warning.
Multi-year: the AI data-center capital-spending cycle through 2027-2028, where continued hyperscaler spending could push ADI’s data-center revenue past $3 billion annually, while a peak and normalization would unwind the narrative premium; Texas Instruments’ 300-millimeter fab ramp through 2027-2029, where visible pricing pressure in ADI’s mid-range industrial catalog would show up first as gross-margin compression; Empower’s integrated-voltage-regulator revenue ramp in fiscal 2027-2028, where slower-than-expected hyperscaler adoption would make the $1.5 billion deal look expensive in hindsight; the $1 billion Maxim revenue-synergy target for 2027, a verifiable milestone on a deal now five years old; CHIPS Act funding finalization, still unresolved as of this research date; and the automotive battery-management content inflection expected across 2028-2030, where a re-acceleration in electric-vehicle penetration could shift automotive from a drag to a driver.
Leading indicators to watch
The days-of-inventory figure, currently 139, 19 percent above the ten-year median of 117, is the single most important early-warning indicator; a drop toward 120 would signal a healthy restocking cycle, while a rise above 150 would signal the double-ordering risk materializing. The industrial segment’s year-over-year growth rate, currently 56 percent, is the second: watch for the quarter it normalizes below 20 percent, expected around late fiscal 2026 or the first quarter of fiscal 2027, and whether it settles above 10 percent (supporting the secular case) or falls to 3 to 5 percent (supporting the bear case). Data-center revenue’s share of the total, currently 12 to 15 percent, is the third: a move past 20 percent within four quarters would mean the AI narrative is being earned in the revenue line, not only in the stock price. Adjusted gross margin, currently 73 percent, is the fourth and clearest read on mix quality and pricing power: holding above 72 percent as industrial normalizes would say the high-performance strategy is working, while compression toward 69 to 70 percent would say Texas Instruments’ cost competition or unfavorable mix is starting to bite. The gap between bookings growth and revenue growth, though ADI does not disclose a quantified book-to-bill ratio, is the fifth, watchable through management’s own language shifting from “record bookings” to anything softer. Texas Instruments’ own analog revenue growth and margin trend is the sixth, a direct read on whether the cost-advantage story is translating into actual share gains. And the forward price-to-earnings multiple itself, currently 28 to 32 times, is the seventh: compression toward 24 to 25 times without a fundamental deterioration would mean the market is pricing out the AI premium and the base case is becoming a more attractive entry point, while expansion above 33 times would mean the market is pricing in the bull case further still.
What would change the read
A bull would need to turn bearish if inventory days rise above 150 for two consecutive quarters while revenue growth decelerates below 15 percent, the specific pattern that preceded the fiscal 2024 revenue collapse; if data-center revenue growth decelerates to below 30 percent year over year within four quarters, confirming that the AI data-center business is too small to sustain the current narrative premium; if Texas Instruments’ newer fabs visibly win designs away from ADI in mid-range industrial analog, observable as TI’s analog revenue growing five or more percentage points faster than ADI’s for two or more consecutive quarters; if a major hyperscaler cuts AI capital spending meaningfully; or if adjusted gross margin compresses below 70 percent for two consecutive quarters. A bear would need to turn bullish if AI data-center revenue exceeds a fifth of total revenue by mid-fiscal 2027, if post-restocking industrial growth sustains above 10 percent for three or more quarters, if automotive revenue inflects to double-digit growth, if inventory days normalize below 120 without a corresponding revenue decline, or if the forward multiple compresses to 24 to 25 times on a broad selloff with no accompanying deterioration in the underlying business.
Companies to watch (bull / base / bear)
Analog Devices (ADI), the profile itself. Bull: the data-center and industrial legs both keep growing faster than the analog market’s historical rate, and the Empower integration delivers on schedule. Base: growth normalizes toward the high single digits as restocking fades, and the multiple compresses modestly while earnings growth still carries the stock higher. Bear: inventory unwind hits in fiscal 2027-2028, automotive stays weak, and the multiple reverts toward ADI’s own ten-year average. Watch: the quarterly inventory-days figure and the industrial year-over-year growth rate.
Texas Instruments (TXN), the direct competitive threat and the read on whether the whole analog cycle, not just ADI, is turning. Watch: whether TI’s newer 300-millimeter fab output is visibly taking mid-range analog design wins from ADI, best observed in ADI’s own gross-margin trend. Full coverage at this site’s Texas Instruments deep dive.
Infineon Technologies (IFX), the European power and automotive bellwether. Watch: whether its silicon-carbide margin and automotive-cycle trends turn before or after ADI’s own automotive segment does.
STMicroelectronics (STM) and ON Semiconductor (ON), the two names furthest below their prior cyclical peaks and carrying the most operating leverage if the broader analog recovery keeps broadening, and the most exposure if it stalls. Watch: sequential revenue trends at both as a cross-check on whether the industry-wide trough is genuinely behind the group.
NXP Semiconductors (NXPI), the purest automotive read in the group. Watch: whether NXP’s own automotive revenue turns up meaningfully before ADI’s does, since ADI’s own automotive weakness is partly an industry-wide, not company-specific, condition.
Microchip Technology (MCHP), the smaller-scale comparison. Watch: whether its recovery trajectory tracks ADI’s and TI’s or lags, a signal on whether scale itself is mattering more in the current cycle.
Risk controls
The honest risk list, roughly in the order this research weighs it. First, cyclicality: ADI’s own fiscal 2024 saw a 24 percent revenue decline in a single year, and the current 139-to-168-day inventory level, 19 percent above the ten-year median, is the specific, dated indicator that a similar correction could be building again. Second, valuation after a large run: a trailing multiple near 56 to 58 times against a ten-year average near 38.5 times means a simple reversion to that historical average, with no change in the underlying business, would imply roughly 33 percent downside on its own. Third, concentration in two large end markets: industrial and automotive together are 74 percent of revenue, and both are exposed to global manufacturing and vehicle-production cycles ADI does not control. Fourth, China exposure: press-reported estimates put China revenue anywhere from 15 to 22 percent of the total, sitting inside an active, if not fully verified in this research pass, Chinese regulatory investigation into imported analog chips, alongside the more general unpredictability of U.S. export-control policy. Fifth, competitive pressure from Texas Instruments’ cost advantage: TI’s new 300-millimeter fabs, once fully ramped, are expected to price aggressively in commodity and mid-range analog, an estimated 50-to-100-basis-point annual margin headwind for ADI’s lower-end catalog over a three-to-five-year horizon, though ADI’s highest-performance products are considered less exposed. Sixth, narrative fragility: the stock fell roughly 15 percent in six trading days in late June 2026 on a headline about a product, high-bandwidth memory, that ADI does not make, a clear demonstration of how much of the current multiple depends on sector-wide AI sentiment rather than ADI’s own results. Seventh, integration and execution risk on the Empower acquisition: $1.5 billion for a business whose “significant revenue” is not expected until 2027, in a power-delivery market where Monolithic Power Systems, Infineon, Renesas, and others are also competing for the same hyperscaler design wins, and whose own efficiency claims remain inconsistent across press coverage.
What would meaningfully change this risk picture: automotive inflecting to sustained double-digit growth would be the strongest evidence against the cyclicality concern; inventory days normalizing back toward 120 without a revenue decline would be the strongest evidence the current cycle is healthy rather than a repeat of 2023-2024; and a confirmed, ADI-specific figure for China revenue exposure, resolving the current 15-to-22-percent range, would meaningfully sharpen the geopolitical risk assessment in either direction.
Methodology, sourcing, and data-quality flags
This piece draws on ADI’s fiscal 2025 Form 10-K, its second-quarter fiscal 2026 8-K earnings release and accompanying transcript, its own press releases (the Empower Semiconductor acquisition, the CHIPS Act award, the dividend increase), corroborating press and analyst coverage of those same filings, and market data from Yahoo Finance and stockanalysis.com cross-checked where possible. Every load-bearing figure in this piece traces to a claim recorded with a source URL and a source tier (primary filing, analyst research, press coverage, or estimate); of 47 load-bearing claims reviewed in this research package’s verification pass, 34 were independently confirmed against a second source, 2 remain genuinely disputed between data vendors and are presented here as ranges rather than single figures, and one set of peer valuation multiples (for Texas Instruments, NXP, STMicroelectronics, and ON Semiconductor) rests on a single vendor per name and was not independently cross-checked, so those figures are flagged as directional throughout rather than precise.
Data-quality flags. Forward price-to-earnings is genuinely disputed between data vendors (27.24 times versus 32.47 times as of the same date); this piece uses “high-20s to low-30s” rather than a single number. Analyst consensus price targets similarly vary by aggregator, clustering in the $430s to $450s with a range of roughly $363 to $550 across 21 to 36 tracked analysts depending on the source; treat the exact analyst count as vendor methodology, not settled fact. Market capitalization is reported anywhere from roughly $183.7 billion to $189.5 billion depending on whether an intraday or prior-close price is used against roughly 487 million shares outstanding, a timing artifact, not a real disagreement. ADI’s own five-year average trailing price-to-earnings (roughly 46.5 times) rests on a single source and could not be corroborated against a second vendor in this research pass; the ten-year average (roughly 38.5 times) is at least consistent across two sources, though those two sources may share an underlying data provider. Empower Semiconductor’s power-efficiency claims are inconsistent across press coverage (10 to 15 percent, roughly 20 percent, and a fourfold figure have each appeared) and could not be resolved to a single ADI-stated number in this research pass. China revenue exposure is estimated in a 15-to-22-percent range depending on the source, and a press-reported figure describing a Chinese regulatory anti-dumping investigation into imported analog chips was not independently re-verified against a primary regulatory filing for this piece; both should be read as directional, dated context rather than confirmed fact. ADI’s precise analog-semiconductor market share and its automotive battery-management-system market share are each single-house estimates that could not be cross-checked against a second named analyst report, and are used here only for general positioning, not as precise figures. The CHIPS Act award’s finalization status as of this research date remains unconfirmed. GAAP and adjusted figures differ meaningfully throughout this piece (roughly 570 basis points on gross margin, roughly 1,100 basis points on operating margin), driven mainly by Maxim-related intangible amortization; every figure above is labeled GAAP or adjusted specifically so the two are never conflated.
The five-factor research read. On valuation, ADI trades at roughly 56 to 58 times trailing earnings and 28 to 32 times forward earnings, both meaningfully above its own ten-year average of roughly 38.5 times, with a PEG ratio of 1.21 and price-to-free-cash-flow of roughly 40 times suggesting the market is pricing in close to flawless execution; independent discounted-cash-flow estimates referenced in this research cluster well below the current price. The weight of evidence leans toward a stock priced richly relative to its own history, even though it is not the single most stretched name in its immediate peer group on a forward basis. On growth, revenue grew 37 percent year over year in the most recent quarter with data-center revenue up more than 90 percent, a genuinely new secular driver layered on top of a strong cyclical recovery, and management’s own $20-billion-by-2030 vision, while an aspiration rather than formal guidance, is credible if not certain given the current trajectory; growth reads as strong even accounting for how much of the current rate is cyclical catch-up. On quality, ADI’s 73 percent adjusted gross margin is the highest in its analog peer group, free cash flow conversion runs at 36 percent of trailing revenue, the dividend has grown for 22 consecutive years, and the company returned 96 percent of free cash flow to shareholders in fiscal 2025; a wide, IP-based competitive moat, high switching costs, and a diversified customer base with no single buyer above 10 percent of revenue all support a genuinely high-quality assessment. On risk, elevated inventory 19 percent above its historical median is the clearest quantitative warning sign, layered on top of a barely-growing automotive segment, meaningful and not fully resolved China exposure, and Texas Instruments’ structural cost advantage in commodity analog; these are real, not marginal, concerns. On momentum, the stock is up roughly 39 percent year to date and 54 percent over one year in absolute terms, but it has meaningfully lagged the broader semiconductor index and most of its own named peer group over the same windows, sell-side consensus remains Buy-leaning with recent price-target increases, and short interest has ticked up modestly alongside the sector-wide selloff; momentum reads as positive but no longer accelerating. On balance, the five-factor read lands at Buy: a genuinely high-quality, diversifying business whose price already reflects a lot of optimism, where the case for owning it rests on the industrial and data-center growth legs proving durable rather than merely cyclical.
Key sources. Analog Devices fiscal 2025 Form 10-K and second-quarter fiscal 2026 Form 8-K (SEC EDGAR); ADI investor-relations press releases (Empower Semiconductor acquisition, CHIPS Act award, dividend increase, Q2 FY2026 earnings); ADI’s Q1 and Q2 fiscal 2026 earnings-call transcripts; Bank of America sell-side research on the AI data-center analog opportunity; Global Market Insights, MarkWide Research, and Fortune Business Insights analog-semiconductor market sizing; Yahoo Finance and stockanalysis.com market and valuation data; MarketBeat and QuiverQuant liquidity and short-interest data; Texas Instruments, Infineon, STMicroelectronics, NXP Semiconductors, ON Semiconductor, and Microchip Technology investor materials and earnings releases; and corroborating press and analyst coverage cited throughout the claims ledger behind this piece.
Prepared July 2, 2026. Figures are point-in-time and will change. This is research and analysis for educational purposes, not investment advice, not a recommendation, and not a solicitation. ADI carries real sector-specific risk: the analog semiconductor cycle is genuinely boom-and-bust, a meaningful share of revenue touches China at a moment of active trade friction, and part of the current price rests on an AI data-center growth story that remains a small slice of total revenue. Verify all figures independently and consult a licensed financial advisor before making any decision.