
Research date: July 1, 2026 | OSINT market research on Texas Instruments Incorporated (TXN, Nasdaq), the world’s largest analog chipmaker, the company that builds the power-management and signal-chain chips that sit inside nearly every car, factory, and phone on earth without ever appearing on a spec sheet a consumer reads.
Important disclaimer. This is OSINT-based research and educational analysis, not investment advice. I am not a financial advisor. Nothing here is a recommendation to buy or sell any security, and the scenarios below are illustrative, not price targets. TXN carries real sector-specific risk: the analog semiconductor cycle is genuinely cyclical, roughly half of 2025 revenue was tied to products shipped into China, and TI is mid-ramp on a multi-billion-dollar new fab buildout whose payoff depends on demand materializing roughly on schedule. Market caps, prices, valuation multiples, and market-share figures are point-in-time (July 1, 2026), press-reported where noted, and move fast. Do your own due diligence and consult a licensed advisor.
Where this stock could be in 6 months, 1 year, 3 years, and 5 years
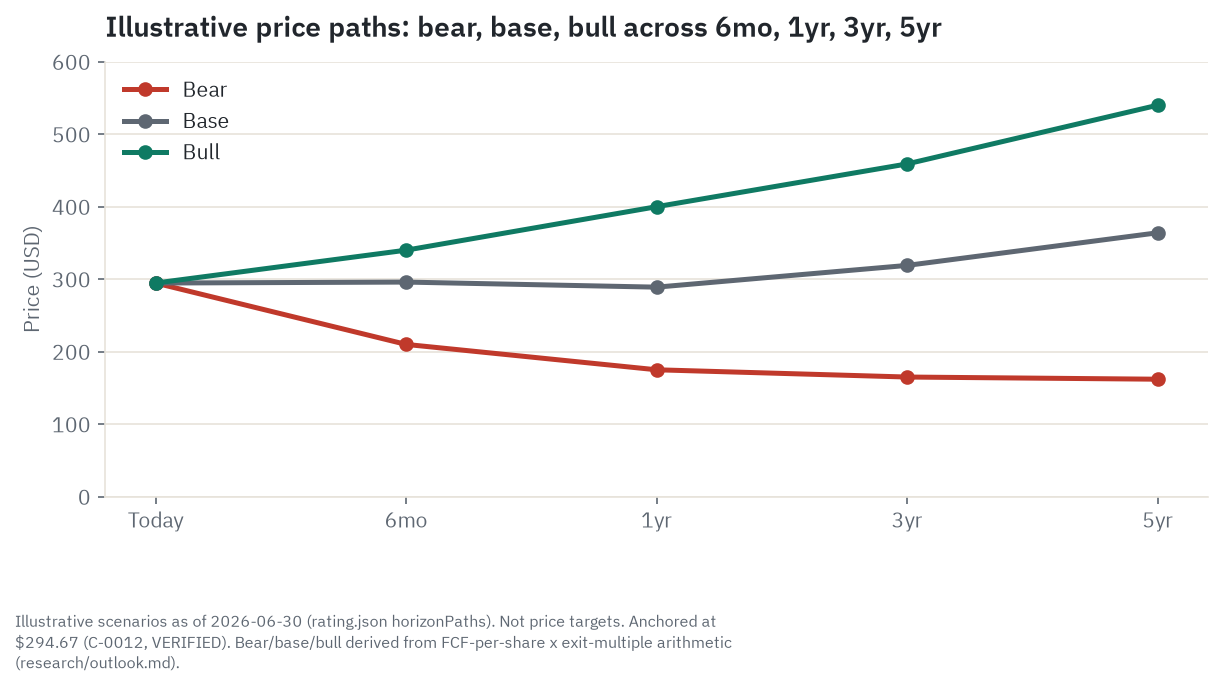
Every dollar figure below is derived the same way: an estimate of TI’s free cash flow per share at that horizon, the metric management itself has told investors to watch, multiplied by a stated price-to-FCF multiple. None of it is a price target, and the math is shown in full further down in “The scenarios in detail.”
6 months. The next real catalyst is TI’s Q2 2026 earnings on July 22, already guided to $5.0-5.4 billion in revenue and $1.77-2.05 in earnings per share, an above-seasonal step up management itself has flagged. If that print and the Q3 guidance that comes with it confirm the free-cash-flow pace toward management’s stated target of more than $8 per share for 2026, the read holds near today’s level, roughly $296 in the base case. A miss, especially in automotive, points toward $210; confirmation with upside surprise points toward $340. The single thing most likely to move this window is whether automotive finally shows a real sequential improvement instead of the flat, still-weak-in-China pattern TI reported in the first quarter.
1 year. By the middle of 2027, TI will have closed out full-year 2026 and reported at least one quarter of 2027. This is the window where the free-cash-flow story either proves durable or reveals itself as partly a one-time boost from CHIPS Act cash. A base case near $289 assumes 2027 free cash flow per share lands near the roughly $8.50 that outside estimates already point to. A bull case near $400 assumes TI reaches the $9 to $10 upper range management itself has floated, with automotive and industrial both compounding. A bear case near $175 assumes automotive stays soft, China headwinds compound, and the 2026 beat turns out to have leaned more on government cash than on durable operating improvement.
3 years. By 2029 the question shifts from “did the current cycle recover” to “did the structural bet pay off.” TI’s 300mm wafer fabs cost roughly 40 percent less per chip than the older 200mm lines they are replacing, but that advantage only shows up in the numbers once the new fabs in Sherman, Texas and Lehi, Utah are running at real utilization. A base case near $319 assumes that shows up gradually. A bull case near $459 assumes it shows up fully alongside a genuine automotive electrification wave. A bear case near $165 assumes another down-cycle arrives first, the same kind that cut TI’s revenue 11 percent and its operating profit 30 percent in 2023 and 2024, while Chinese domestic analog suppliers keep chipping away at TI’s mature-node business in the background.
5 years. Over a full five years the question is whether the moat itself holds. TI has told investors it wants more than 90 percent of its chip revenue from its own fabs by 2030, up from 80 percent in 2020, and 80 percent of its wafer output on 300mm technology, up from 40 percent in 2022. A base case near $364 assumes that mostly happens and the stock’s multiple settles well below today’s cyclical-recovery premium. A bull case near $540 assumes it happens fully, buybacks keep compounding, and China holds roughly steady rather than eroding further. A bear case near $162 assumes Chinese domestic substitution has, by then, captured real, durable share in exactly the mature-node categories where TI is strongest today.
Where the read lands today. On balance the read holds at Hold: this is arguably the best-run, most vertically integrated analog franchise anywhere, with a genuine cash-flow inflection ahead of it, but the stock already trades at a real premium to its own history for a recovery that automotive, a third of the business, has not yet fully joined. The thing most likely to flip this toward Buy is automotive visibly catching up to industrial’s recovery within the next two or three quarters; the thing most likely to flip it toward Sell is China’s slow-moving substitution turning fast.
Companion tool
Jump to the interactive dashboard to sort and filter TXN against its analog and power-semiconductor peer set, or download the Excel model to flex the scenario assumptions yourself.
TL;DR
Texas Instruments makes the analog and embedded-processing chips that manage power, sense the physical world, and move signals cleanly, the unglamorous parts that go into essentially everything electronic. It builds the large majority of those chips itself in its own factories rather than buying capacity from a foundry, and it has spent the last several years converting older 200mm production lines to 300mm ones that cost roughly 40 percent less per chip, funded by roughly 59 billion dollars of total capital allocated since 2016. That construction cycle is now rolling off: capital spending fell from 4.82 billion dollars in 2024 to 4.55 billion in 2025 and is guided down to just 2 to 3 billion in 2026, at the exact moment a cyclical recovery is pushing revenue up 19 percent year over year and gross margin back above 58 percent. Put those two things together and management’s own target is free cash flow per share of more than 8 dollars in 2026, up from roughly 3.23 dollars in 2025, funding a dividend that has now grown for 23 straight years. The catch is that the recovery so far is narrower than the headline growth rate suggests: industrial and a small AI-adjacent data-center slice are carrying it, while automotive, a full third of revenue, is barely growing, and roughly half of 2025 revenue was tied to products that shipped into China, a market where US export policy and Chinese industrial policy are both pulling in directions TI does not control. The stock has already re-rated sharply, up roughly 68 to 80 percent over the trailing year, to a trailing earnings multiple near 49 times against its own 12-month average of about 36 times. The read: a genuinely excellent, structurally advantaged business, priced for a recovery that has already substantially arrived rather than one still coming.
Explore it yourself: the interactive dashboard
Open the dashboard in a full screen
What Texas Instruments actually does
Texas Instruments does not make the chips that appear on a phone’s spec sheet or a laptop’s marketing page. It makes the chips that everything else depends on to work at all: the parts that convert a wall socket’s alternating current into the precise, steady voltage a circuit board actually needs, the parts that sense a temperature or a current or a position in the physical world and turn it into a signal a computer can read, and the parts that move that signal from one point to another without corrupting it. TI groups this work into two reported segments. Analog, roughly 79 percent of 2025 revenue, covers power management and signal-chain chips. Embedded Processing, roughly 15 percent, covers microcontrollers and processors, the small computers embedded inside a car’s airbag controller or an industrial sensor. The remainder, under a billion dollars, is calculators, custom chips, and royalties.
The company sells more than 80,000 distinct products to more than 100,000 customers, and roughly half its revenue comes from customers outside its top 50, a genuinely long-tail business with no single dominant buyer. More than 80 percent of 2025 revenue was sold direct, through TI’s own sales force and TI.com, an unusually high figure for the industry that TI has built deliberately over years to keep closer contact with the engineers who design its parts into a product in the first place.
One analogy that holds. Think of TI less as a chipmaker and more as the electrician’s supply house for every factory, car, and appliance on the planet. Nobody notices the wire, the breaker, or the voltage regulator when it works. They notice instantly when it fails. That is TI’s whole business: parts that are invisible when they work, that get designed into a product once, and then keep shipping for 10 to 20 years without anyone thinking about them again.
The manufacturing model is the moat. Unlike a fabless chip designer that buys wafer capacity from TSMC or another foundry, TI builds the large majority of its own chips in its own factories, a model called integrated device manufacturing. TI states, in its own 10-K, that an unpackaged chip built on a modern 300mm wafer costs roughly 40 percent less than the same chip built on an older 200mm wafer, the single number behind TI’s entire manufacturing strategy. TI is pushing that advantage further: it targets more than 90 percent of its chip revenue coming from its own fabs by 2030, up from 80 percent in 2020, and 80 percent of its wafer output running on 300mm technology by 2030, up from 40 percent in 2022. That shift has consumed roughly 59 billion dollars of total capital allocated over 2016 to 2025, about 24 billion of it capital expenditure, funding new 300mm fabs in Sherman, Texas and Lehi, Utah alongside the existing Richardson, Texas and Dallas facilities.
TI had about 33,000 employees worldwide at the end of 2025, roughly 90 percent of them in research and development, sales, or manufacturing, with a 10.1 percent turnover rate that year.
How the money flows
flowchart TD
    DEMAND["End demand\nIndustrial 33% + Automotive 33% + Personal Electronics 21% + Data Center 9% + Comms 3%"]
    DESIGN["Chip design and IP\nTI: Analog ~79% of revenue, Embedded Processing ~15%"]
    FAB["TI internal wafer fabs\nSherman TX (SM1/SM2), Lehi UT, Richardson TX, Dallas DMOS6"]
    EQUIP["Fab equipment and materials\nASML, Applied Materials, Lam Research, KLA, Shin-Etsu/SUMCO wafers"]
    GOV["US government capital partner\nUp to $1.6B CHIPS Act direct funding + est. $6-8B Investment Tax Credit"]
    ASSY["Assembly and test\nTI internal: Chengdu China, Clark/Baguio Philippines"]
    DIST["Distribution\nTI direct (>80% of 2025 revenue) plus distributors"]
    RETURNS["Shareholder returns\n23 straight years of dividend increases, $5.68/share annualized"]
    CHINA["China exposure\n~50% of 2025 revenue shipped into China; tariffs, export controls, domestic rivals"]

    DEMAND --> DESIGN
    DESIGN --> FAB
    EQUIP --> FAB
    GOV -.-> FAB
    FAB --> ASSY
    ASSY --> DIST
    DIST --> RETURNS
    CHINA -.-> DIST
Read the chain from the top down. Demand starts in the physical world: a factory that needs a chip to manage a motor, a car that needs one to manage a battery, a thermostat, a phone. TI designs the chip and, unlike most of the industry, builds it too, in its own 300mm and 200mm fabs, using equipment bought from the same upstream toolmakers that supply the whole chip industry: lithography from ASML, deposition and etch from Applied Materials and Lam Research, metrology from KLA, and bare silicon wafers from suppliers like Shin-Etsu and SUMCO. The federal government sits directly in that fab-building leg of the chain as a capital partner: TI holds a CHIPS Act award of up to 1.6 billion dollars in direct funding plus an estimated 6 to 8 billion from the Treasury’s Investment Tax Credit, against a stated total commitment of more than 18 billion dollars in Texas and Utah fabs through the end of the decade.
Once a wafer is fabricated, it moves to assembly and test, mostly run in-house at TI’s own sites in Chengdu, China and Clark and Baguio in the Philippines, before shipping out through TI’s heavily direct sales channel to more than 100,000 customers. The final link in the chain is capital return: because a TI part, once designed into a product, often keeps shipping unchanged for a decade or more, incremental revenue drops through at high margin once a fab is built and paid for, which is exactly why free cash flow, not GAAP earnings, is what TI’s own management wants investors watching, and why the dividend has grown for 23 consecutive years.
The dotted line matters as much as the solid ones. Roughly half of 2025 revenue was tied to products that ultimately shipped into China, once global distributor and OEM routing is counted, a fact that sits outside TI’s control and inside a US-China trade and export-control relationship that has only tightened over the past several years.
The company and its peers
Texas Instruments (TXN) - the toll-taker
TI is the largest pure-play analog chipmaker by revenue and the most vertically integrated of its peer group, targeting more than 90 percent of chip revenue from its own fabs by 2030. Q1 2026: revenue 4.825 billion dollars, up 19 percent year over year, gross margin 57.98 percent, up 210 basis points sequentially, operating margin 37.46 percent, net income up 31 percent, diluted earnings per share of 1.68 dollars against a 1.37 dollar consensus. Industrial grew more than 30 percent year over year and data center grew roughly 90 percent, while automotive grew only mid-single digits. Q2 2026 guidance: revenue of 5.0 to 5.4 billion dollars, earnings per share of 1.77 to 2.05 dollars. Bull: the 300mm cost advantage plus a rolling-off capex cycle drives free cash flow per share from roughly 3.23 dollars in 2025 toward management’s stated target above 8 dollars in 2026, funding 23 straight years of dividend growth. Bear: a trailing price-to-earnings ratio near 49 times prices in a great deal of cyclical recovery that automotive has not yet joined, and roughly half of revenue is tied to products shipped into a China market facing tightening export controls and a state-backed push to build domestic rivals.
Analog Devices (ADI) - the closest peer
ADI is the number two pure-play analog chipmaker by revenue, running a more foundry-hybrid manufacturing model than TI’s heavier internal-fab commitment, with a broader industrial mix, roughly half its revenue, than TI’s. Q2 fiscal 2026 (ended May 2, 2026): record revenue of 3.62 billion dollars, adjusted gross margin 73 percent, operating margin 49 percent. Industrial grew 56 percent year over year and 20 percent sequentially; automotive grew just 2 percent year over year. Bull: the broadest industrial exposure in the peer group, spanning aerospace, defense, and test and measurement, is compounding fastest in the current cycle, with a new data-center power leg emerging. Bear: automotive is barely growing even as the rest of ADI’s business surges, and the stock has re-rated alongside the group on cyclical optimism that automotive itself has not yet confirmed.
Infineon Technologies (IFX.DE / IFNNY) - Europe’s power and auto leader
Infineon is the largest European semiconductor company and a leader in power semiconductors and automotive chips, including silicon carbide, with automotive its single largest segment at roughly 48 percent of Q2 fiscal 2026 revenue. Q2 fiscal 2026: revenue of 3.81 billion euros, up 6 percent year over year, but segment margin fell to 17.1 percent from 17.9 percent the prior quarter, and automotive margin specifically compressed to 18.1 percent from 22.1 percent on price competition in high-voltage EV powertrain silicon. Bull: the largest, most diversified automotive and power semiconductor franchise in Europe, with AI-adjacent power demand and an improving industrial cycle lifting the non-auto businesses. Bear: automotive high-voltage powertrain margins are compressing sharply right now on Chinese and domestic price competition, live evidence of exactly the automotive softness TI’s own bull case needs to end.
STMicroelectronics (STM) - the recovering diversified name
STMicro is a diversified microcontroller, automotive, and analog-power supplier still working through a steep 2024-2025 downturn, with full-year 2025 revenue of 11.80 billion dollars down from 13.27 billion in 2024. Q1 2026: revenue 3.095 billion dollars, up 23 percent year over year but down 7 percent sequentially, gross margin 33.8 percent, meaningfully below TI’s and ADI’s analog-heavy margins. Automotive fell 10 percent sequentially, industrial fell 1 percent, personal electronics fell 14 percent. Bull: management points to 2026 automotive growth from ADAS and sensors, aided by an NXP MEMS acquisition, plus silicon-carbide and general-purpose microcontroller growth. Bear: structurally lower gross margins than the pure-analog peers reflect a harder-to-differentiate microcontroller and discrete mix, and the company is still digging out of a sharper downturn than TI ever saw.
NXP Semiconductors (NXPI) - the automotive-first, foundry-hybrid name
NXP is among the largest automotive semiconductor suppliers globally, with a more foundry-dependent manufacturing model than TI, and it recently divested its MEMS sensor business to sharpen focus. Q1 2026: revenue 3.18 billion dollars, up 12 percent year over year, automotive revenue 1.782 billion dollars, up 6 percent as reported or 10 percent adjusted for the divestiture. Q2 2026 guidance: revenue of 3.35 to 3.55 billion dollars. Bull: automotive demand is reaccelerating on an adjusted basis, and guided margins are among the highest in the peer group. Bear: the reported 6 percent automotive growth is softer than the adjusted figure implies, and NXP’s greater foundry dependence leaves it less insulated from wafer-cost inflation than TI’s internal-fab model.
ON Semiconductor (ON) - the smallest, most levered-to-recovery name
ON has repositioned from a broad commodity chipmaker toward a specialized silicon-carbide and power powerhouse, with full-year 2025 revenue of 5.99 billion dollars down from 7.08 billion in 2024 as it worked through an inventory correction. It carries a multi-billion-dollar pipeline of long-term silicon-carbide supply agreements extending through the late 2020s. Bull: that backlog gives revenue visibility into the late 2020s if EV adoption continues, and being the smallest name in the group gives it the most operating leverage to a cyclical recovery. Bear: revenue has fallen furthest of the group from its 2024 peak, and silicon-carbide demand is directly tied to EV production schedules that have repeatedly disappointed versus original industry forecasts.
What the filings say
TI’s fiscal year matches the calendar year. Figures below trace to the Q1 2026 8-K and 10-Q (period ended March 31, 2026) and the FY2025 10-K, cross-referenced against the claims ledger behind this piece.
Revenue and segments. Full-year 2025 revenue was 17.68 billion dollars, up 13 percent from 15.64 billion in 2024, which itself had fallen 11 percent from 17.52 billion in 2023, a clear illustration of how sharply the analog cycle swings even for the industry’s largest player. Analog was 14.01 billion of that 2025 total, 79 percent of revenue; Embedded Processing was 2.70 billion, 15 percent. In the first quarter of 2026, Analog revenue was 3,924 million dollars, up 22 percent year over year, with 1.64 billion dollars of operating profit; Embedded Processing was 723 million dollars, up 12 percent, with operating profit up 205 percent off a much lower base as the segment recovers.
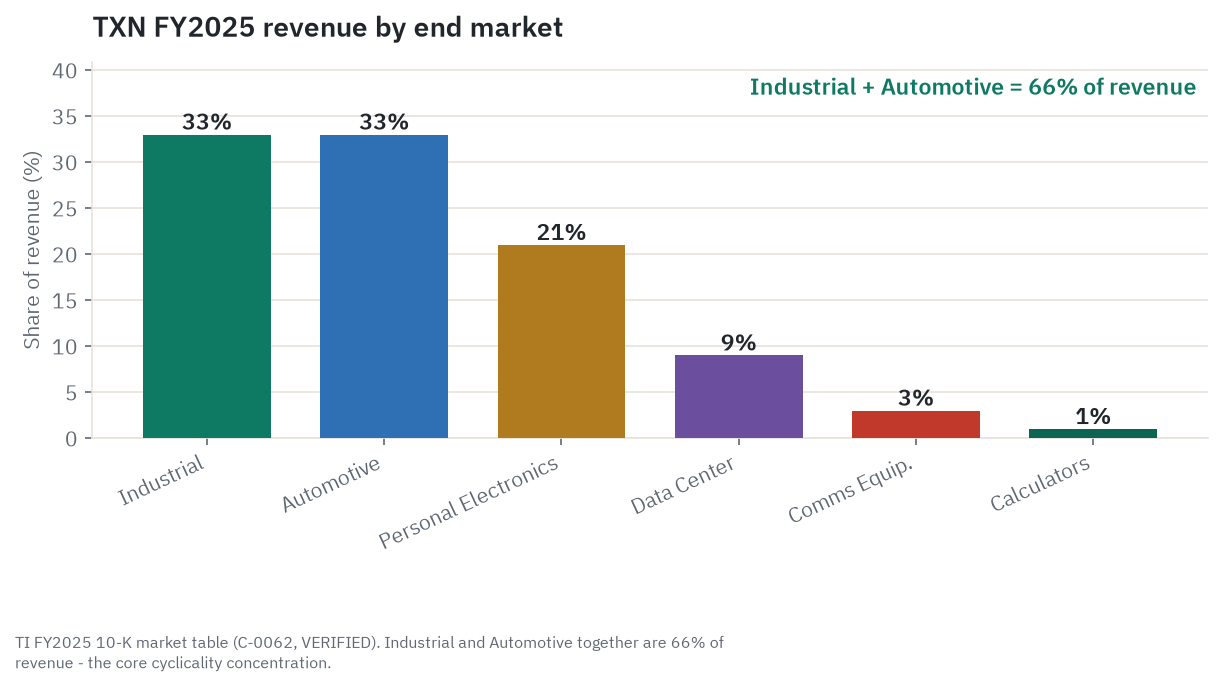
By end market, TI’s FY2025 revenue split was Industrial 33 percent, Automotive 33 percent, Personal Electronics 21 percent, Data Center 9 percent, Communications Equipment 3 percent, and Calculators roughly 1 percent. Industrial plus Automotive together make up 66 percent of revenue, the real concentration risk in TI’s business, not customer concentration (no single customer is disclosed as dominant) but end-market concentration in two large, historically correlated, cyclical markets.
Profitability. Q1 2026 gross margin was 57.98 percent, up 210 basis points sequentially, the clearest sign of where TI sits in its margin-recovery cycle after gross margin bottomed well below 60 percent during the 2023-2024 downturn. Operating margin was 37.46 percent, with operating profit up 37 percent year over year on 19 percent revenue growth, meaning operating leverage is running well ahead of the top line as fixed manufacturing costs get absorbed by higher volume. Net income was 1.545 billion dollars, up 31 percent, and diluted earnings per share of 1.68 dollars beat the 1.37 dollar consensus by 31 cents.
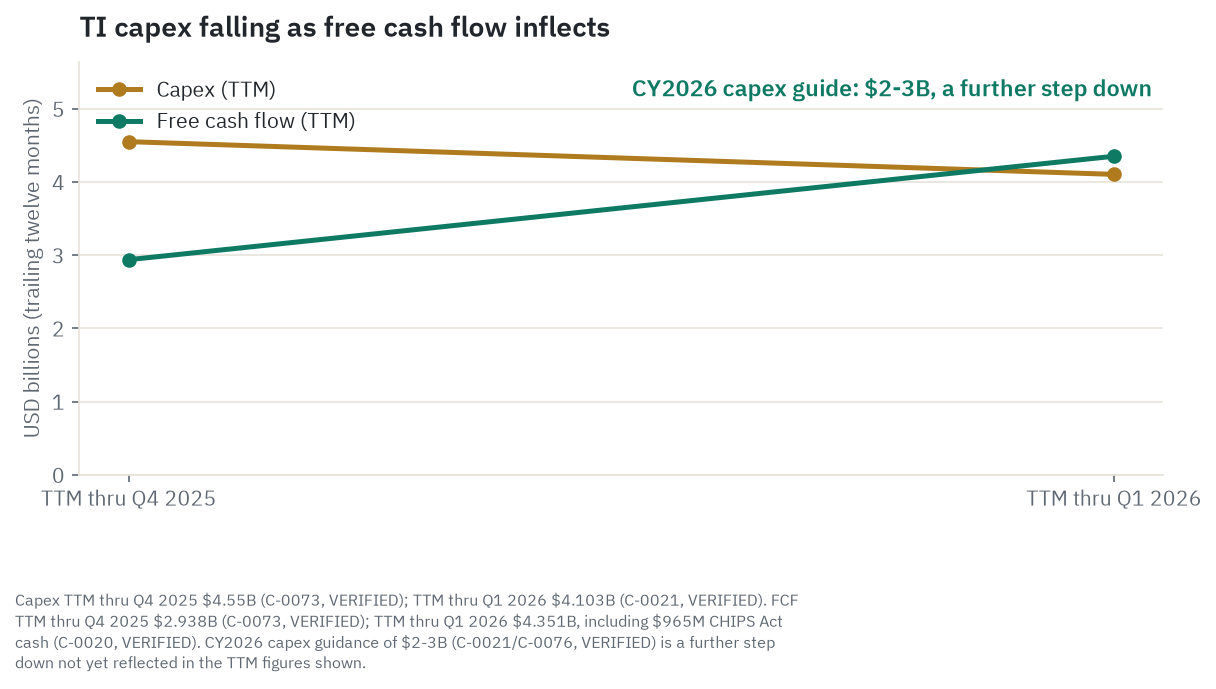
Cash flow and capex, the heart of the bull case. Trailing-twelve-month free cash flow reached 4.351 billion dollars as of Q1 2026, up 154 percent year over year, and it included 965 million dollars of CHIPS Act cash incentives, with 555 million of that received in the first quarter of 2026 alone, a real but partly one-time-flavored contributor that should not be assumed to repeat every year at the same scale. Trailing capex was 4.103 billion dollars as of Q1 2026, down from 4.55 billion for the twelve months ended Q4 2025, itself down from 4.82 billion in 2024, and TI’s own 10-K guides capital expenditure down further to just 2 to 3 billion dollars for all of calendar 2026, describing the company as nearing the end of a six-year elevated capex cycle. Management’s stated target: free cash flow per share above 8 dollars in 2026, up from roughly 3.23 dollars in 2025. TI’s 10-K is careful to note that capex beyond 2026 depends on revenue and growth actually materializing, not a locked-in schedule.
Dividends and buybacks. TI raised its quarterly dividend 4 percent to 1.42 dollars per share, 5.68 dollars annualized, in September 2025, its 22nd or 23rd consecutive year of increases depending on how the streak is counted. The payout ratio runs around 94 percent of trailing earnings, high but consistent with TI’s long-stated preference to return nearly all free cash flow to shareholders. Trailing-twelve-month dividends paid were 5.052 billion dollars against 982 million dollars of share repurchases, a lopsided mix that reflects TI’s preference for the dividend as the primary return vehicle while capex is elevated, with buybacks expected to scale up as free cash flow per share recovers.
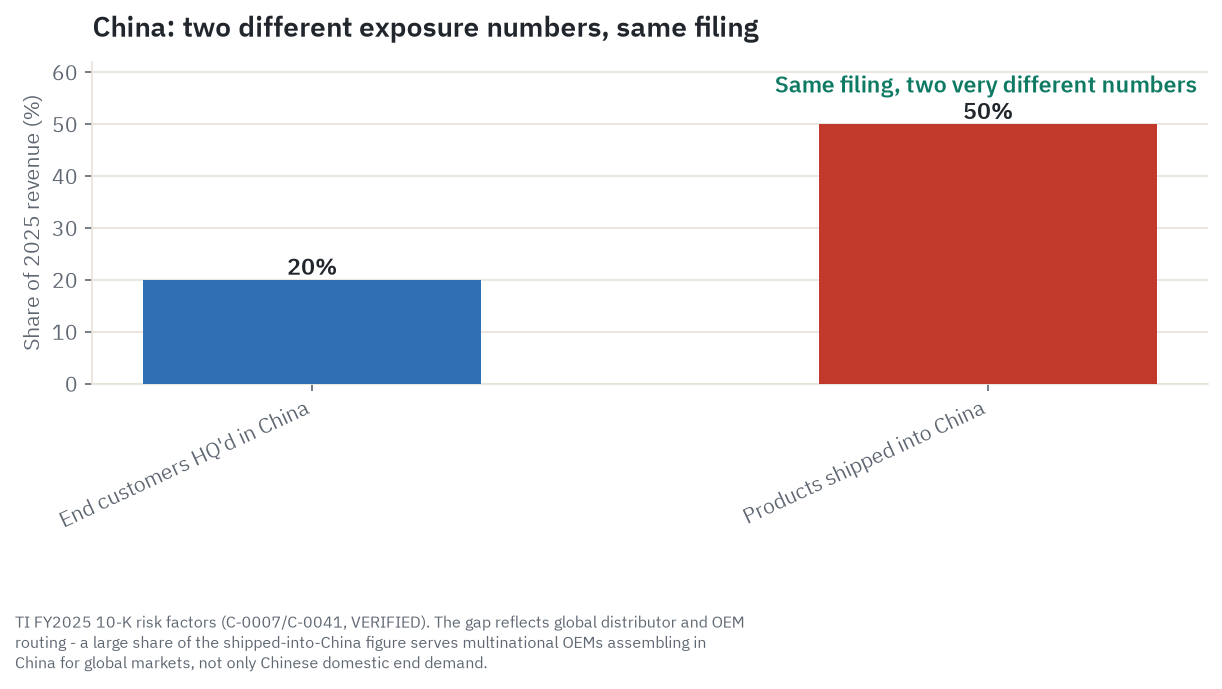
China and export-control disclosure. TI’s own risk factors report that revenue from end customers headquartered in China was about 20 percent of 2025 revenue, while revenue from products shipped into China, once distribution through global OEMs and distributors is counted, was roughly 50 percent, a materially larger and less controllable figure. About 60 percent of total TI revenue comes from customers headquartered outside the United States. TI’s disclosure explicitly flags China’s government as actively promoting and reshaping its domestic semiconductor industry through policy and investment, a competitive threat TI names directly in its own filing, alongside US export restrictions, tariffs as high as 25 percent, and licensing delays that already constrain which China customers and products TI can serve.
What the market is paying
TXN last traded around 294.67 dollars on June 30, 2026, up 3.23 percent that session and near an all-time high, against roughly 910 million shares outstanding. The stock is up somewhere between 68 and 80 percent over the trailing twelve months depending on the exact measurement window different sources use, a very large re-rating that reflects both the earnings recovery, first-quarter earnings per share up 31 percent year over year, and genuine multiple expansion on top of it.
On valuation, TI’s trailing price-to-earnings ratio runs around 49 times, well above its own trailing 12-month average of roughly 36 times. Forward price-to-earnings sits closer to 35 times. The spread between those two numbers, 33 to 49 times depending on which trailing window a given source uses, is itself a reminder that “the P/E” is not one clean number for a stock recovering this fast off a cyclical trough. On a free-cash-flow basis, against management’s targeted 8-dollars-plus of 2026 free cash flow per share, TXN trades around 37 times that targeted figure, a premium multiple that assumes the capex step-down lands roughly on schedule.
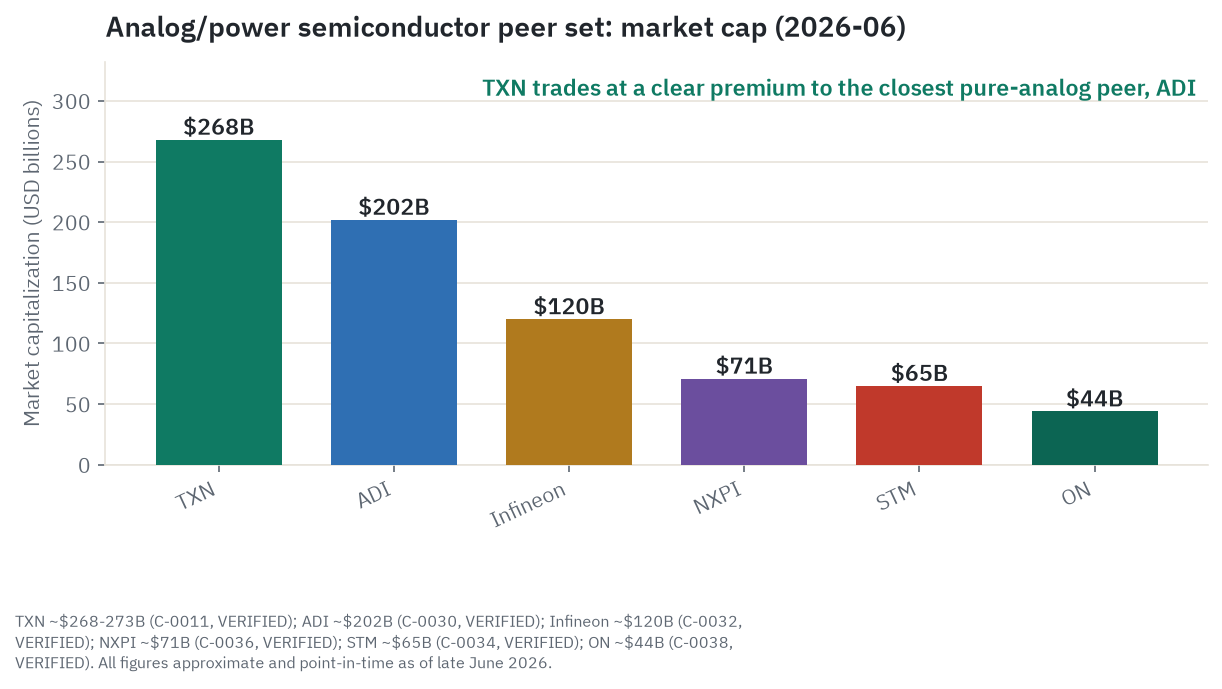
TI trades at a clear premium market cap to its closest pure-analog peer, ADI, despite roughly comparable quarterly revenue scale, a premium the market is awarding for TI’s higher gross margin, its manufacturing vertical-integration story, and its multi-decade dividend record. Infineon, NXP, STMicro, and ON all sit at meaningfully lower market caps, consistent with their heavier automotive exposure, currently the softest end market across the whole group, and in STM’s and ON’s cases, a steeper post-2024 revenue decline still being worked through.
Twenty-three analysts cover TXN with a consensus rating of Buy as of mid-2026. The average price target sits around 284 dollars, essentially in line with, or slightly below, where TXN was already trading by late June, a sign the price has run a little ahead of the average target rather than the reverse. Recent individual revisions have been sharply more bullish than that average, though: Bank of America raised its target to 370 dollars, Seaport Research upgraded TXN to Buy with a 400 dollar target, and UBS moved from 295 to 350 dollars, a wide and widening spread of professional opinion on how much of the free-cash-flow recovery story is still underpriced. TI reports Q2 2026 results on July 22, 2026, already guided to 5.0 to 5.4 billion dollars in revenue and 1.77 to 2.05 dollars in earnings per share, roughly 8 percent sequential growth at the midpoint that management itself calls slightly above seasonal.
What the crowd is saying
Sentiment signals here are softer than filed financials and should be read as directional color, not fact. A third-party Reddit-mentions tracker scores TXN sentiment at roughly 70 out of 100, neutral-to-positive, with mentions trending up versus the 30-day average as of early June 2026, though the vendor does not disclose its scoring methodology and this figure should not be treated as precise. TXN does not show up as a frequent meme-stock name; it reads more like a large, dividend-and-industrial name that generates institutional and long-term-holder commentary rather than retail speculative chatter, consistent with institutional ownership estimated somewhere between 85 and 97 percent depending on the source. Mainstream financial media coverage has turned more bullish in tone through the first half of 2026, tracking the stock’s price momentum and the free-cash-flow-recovery narrative.
Institutional ownership figures genuinely disagree by source, one tracker puts it near 97 percent, another breaks it into roughly 85 percent institutional, under 1 percent insider, and the rest retail, likely reflecting different treatment of index funds and reporting lags, though both agree TXN is overwhelmingly institutionally owned with limited retail float. Vanguard is the single largest disclosed shareholder at roughly 10.6 percent of shares outstanding. Insider activity shows roughly 25.6 million dollars of stock sales in 2026 year to date, with no recorded insider purchases in the most recent quarter, common at a large-cap company with routine executive compensation vesting and not, on its own, a negative signal, though the total absence of insider buying is worth noting rather than dismissing. No credible evidence of activist involvement, proxy fights, governance controversy, litigation, or accounting red flags surfaced in this research, though that is a “did not find,” not a “confirmed clean.”
Here is where the narrative and the fundamentals genuinely diverge: sell-side sentiment and financial-media tone have both turned quite bullish on the free-cash-flow inflection story, and the stock’s own price action, up 68 to 80 percent over a year, reflects that enthusiasm. But TI’s own reported numbers show a narrower recovery than the bullish narrative implies, industrial and a small AI-adjacent slice carrying growth while automotive lags, which is exactly the kind of gap between story and substance that the bear case in this piece leans on.
The economics behind the cycle
Analog and embedded-processing chips are the least AI-hype-exposed, most economically sensitive corner of the semiconductor industry. They go into factories, cars, and appliances rather than AI accelerators, so demand tracks broad industrial production and capital spending, layered with the industry’s own inventory-restocking and destocking swings. Industry-wide analog revenue grew roughly 7.5 percent in 2025 after a materially weaker 2024, with roughly 4 percent sequential recovery in the first half of 2025 as channel inventory normalized. TI’s own three rounds of price increases through 2025, in June, August, and September, are a useful tell: a chipmaker does not raise prices into a market still glutted with distributor stock, and analysts read the increases as a signal that the multi-year destocking cycle following the 2021-2022 shortage had concluded. Industry forecasters put the total global semiconductor market at roughly 975.5 billion dollars for calendar 2026, with memory and logic, the AI-data-center-driven categories that names like Nvidia sit at the center of, projected to grow more than 30 percent year over year while analog continues a slower, calmer recovery. That divergence matters for reading TI’s own results: the 90 percent year-over-year growth in TI’s data-center revenue is real, and it rides the same AI-infrastructure buildout, but it sits inside a small slice of TI’s total business, while the much larger Analog segment’s growth tracks the broader, calmer analog cycle rather than the AI boom.
Automotive and data-center semiconductor demand overall is projected to grow roughly 17 percent in 2026 on vehicle electrification and data-center buildouts, but the power-transistor and diode category most tied to automotive applications is expected to decline slightly, reflecting continued softness specifically in that end market. That pattern shows up consistently across TI, ADI, Infineon, STMicro, NXP, and ON alike: industrial is recovering faster and more broadly than automotive everywhere in this peer group. Vehicle electrification remains the long-run structural growth driver for the whole group, but the current cycle has lagged in automotive specifically, and silicon-carbide-heavy names like Infineon and ON are seeing acute margin pressure in high-voltage EV powertrain silicon from price competition right now.
On unit economics, the 300mm cost advantage is TI’s single biggest structural, as opposed to cyclical, lever: an unpackaged chip built on 300mm wafers costs roughly 40 percent less than the same chip on 200mm wafers, with roughly 2.3 times more chips per wafer and assembly and test costs cut roughly 20 percent too. That is why TI has committed such a large share of its 2016-2025 capital allocation, roughly 59 billion dollars total, about 24 billion of it capex, to building and converting fab capacity toward 300mm. The catch: that cost advantage only shows up in reported gross margin once the new fabs are built, qualified, and running at reasonable utilization, exactly the capex-to-utilization lag that made 2023-2025 gross margins temporarily worse, fabs under construction and ramping add depreciation expense without yet adding proportional output, before the recovery now underway.
The federal government functions as a direct capital subsidy for this buildout. TI’s CHIPS Act award, up to 1.6 billion dollars in direct funding plus an estimated 6 to 8 billion from the Treasury’s Investment Tax Credit, is one of the larger CHIPS packages awarded to a mature-node analog manufacturer specifically, distinct from the leading-edge logic and memory awards that dominated early CHIPS headlines to Intel, Samsung, TSMC, and Micron. That reflects a policy recognition that mature-node analog and embedded chips, the parts that go into cars, defense systems, and industrial infrastructure, are a national-security and supply-resilience priority in their own right, not just leading-edge logic.
China sits on the other side of the ledger as both TI’s largest single revenue exposure and the sharpest-edged risk in this research. US export controls, tariffs up to 25 percent, and licensing delays already constrain which China customers and products TI can serve, forcing redesigns or market exits in some segments, while China’s government is actively promoting and subsidizing domestic semiconductor champions, explicitly targeting the mature-node analog and legacy-node space where TI is strongest. Chinese domestic analog players, including SG Micro and 3Peak, are reported to be growing specifically in the trailing-edge, mature-node categories that overlap most with TI’s core catalog, a slower-moving, structural version of the substitution dynamic that has already played out faster in Chinese memory and legacy logic. Unlike a single tariff shock, this is a multi-year policy trajectory that could compress TI’s addressable China market gradually rather than suddenly, and it is the largest structural risk in this entire research package, larger in dollar terms than the cyclical automotive softness discussed above.
Durability: what has to be true
The structural case for TI rests on three legs holding at once. The 300mm cost advantage is real and quantified by TI itself, roughly 40 percent lower unpackaged die cost, but it is a benefit that only shows up at reasonable fab utilization, meaning the same new fabs that will eventually widen margins are a drag until volume catches up. The capital-return machine, 23 years of dividend growth and a stated goal of returning nearly all free cash flow to shareholders, is durable as long as free cash flow itself keeps growing, which depends on both the cycle recovering and the capex step-down holding, two things that are not independent of each other. And the distribution and catalog moat, more than 80,000 products sold mostly direct to more than 100,000 customers, each part often locked into a customer’s product for a decade or more, is a genuine structural advantage that is very hard for a smaller competitor to replicate wholesale.
The real cyclical case against all of that is straightforward: TI has shown, as recently as 2023-2024, that its revenue can fall 11 percent and its operating profit can fall 30 percent in a single down-cycle, even as the industry’s largest and most diversified player. Nothing about the current recovery guarantees that does not happen again, and automotive, a full third of TI’s revenue, has not yet shown the kind of broad-based improvement that would argue the cycle has definitively turned in TI’s two largest end markets simultaneously.
The most likely outcome sits between the two extremes. TI probably does deliver real free-cash-flow growth over the next few years, just not necessarily the full 8-dollars-plus the market is currently paying up for, especially once the CHIPS Act cash that inflated the trailing-twelve-month figure normalizes down. The stock’s premium multiple then has room to compress even without China getting materially worse, simply because the market re-prices a “confirmed recovery” back toward a “recovery in progress.” If China’s mature-node substitution accelerates on top of that, the de-rating compounds rather than starting from scratch.
The scenarios in detail
Every dollar figure below is TI’s free cash flow per share at that horizon, an estimate anchored on management’s own stated targets, multiplied by a stated price-to-free-cash-flow exit multiple. None of it is a price target. As a check on the method: management’s own 2026 target of more than 8 dollars per share of free cash flow, against the verified current price of 294.67 dollars, implies roughly a 37 times multiple, matching the independently reported figure for TXN’s targeted-2026-free-cash-flow multiple above. That consistency is the audit trail for every number that follows.
The driver tree
Four variables decide where TXN lands over the next five years. First, the breadth of the auto and industrial cycle: industrial and automotive together are 66 percent of revenue, industrial is already recovering sharply while automotive is not, and whether automotive joins is the single biggest near-to-medium-term swing factor. Second, capex-to-free-cash-flow conversion and CHIPS Act durability: the stated 2026 free cash flow target depends on capex actually stepping down to 2 to 3 billion dollars and on CHIPS Act cash continuing to flow, a mix of durable structural improvement and a less durable government cash inflow that should not be extrapolated flat. Third, China policy and domestic substitution: roughly half of 2025 revenue was tied to products shipped into China, against tariffs, licensing delays, and explicit state support for domestic rivals, a slow-moving structural risk rather than a single event. Fourth, the multiple the market is willing to pay: TXN’s trailing multiple is well above its own history and the stock trades slightly above the average analyst target already, so every scenario below assumes some normalization from today’s elevated level, except the bull case, which assumes the market instead re-rates further on confirmed delivery.
Bull
Automotive and industrial both sustain double-digit growth through 2027-2028 as electrification content per vehicle keeps rising structurally, not just cyclically. The 300mm cost advantage reaches its stated 2030 targets on schedule. China stabilizes near its current share rather than eroding further, helped by TI’s catalog breadth and long product lifecycles making wholesale substitution slow even where China is investing hardest. Capex stays disciplined near 3 to 4 billion dollars annually, letting free cash flow per share compound past the 10-dollar upper bound TI has already flagged toward roughly 18 dollars by 2031 [estimate]. Revenue grows to the low-to-mid 20-billions range by 2031 [estimate], with gross margin structurally above its prior cycle peaks as 300mm mix keeps rising. Illustrative valuation: 18 dollars of free cash flow per share times a 30 times exit multiple equals roughly 540 dollars [estimate, not a price target]. What has to be true: automotive actually re-accelerates and China does not get materially worse. What breaks it: a renewed export-control escalation specifically targeting mature-node analog, the exact category where TI is strongest and most exposed.
Base
The current cycle recovery continues at a moderating pace, industrial stays strong while automotive gradually improves rather than snapping back, the 300mm capex step-down proceeds roughly as guided with capex settling near 3 to 4 billion dollars annually beyond 2026, and China holds roughly flat as growth elsewhere offsets slow structural erosion. Revenue grows to roughly 20 to 22 billion dollars by 2031 [estimate] on mid-single-digit annualized growth, free cash flow per share reaching roughly 14 dollars [estimate]. Illustrative valuation: 14 dollars times a 26 times exit multiple equals roughly 364 dollars [estimate]. What has to be true: no repeat of a severe down-cycle like 2023-2024, and China erosion stays gradual. What breaks it: either a fresh cyclical downturn or a materially worse China trajectory than assumed.
Bear
Anchored on the strongest disconfirming evidence: the current recovery proves narrower than priced in, automotive stays soft for several more quarters, and the AI-adjacent data-center growth, currently only about 9 percent of revenue, does not scale enough to matter at the total-company level. A fresh industrial down-cycle arrives before 2029, echoing the 2023-2024 pattern in which revenue fell 11 percent and operating profit fell 30 percent. The CHIPS Act cash that inflated the 2026 free-cash-flow headline does not repeat, exposing a smaller underlying improvement than the market currently prices. China’s domestic analog substitution moves from slow to structurally meaningful, compressing both TI’s China volume and its pricing power in the mature-node categories where China is investing hardest. Revenue stalls in the high-teens-billions range through 2029-2031 [estimate] rather than compounding, free cash flow per share stuck near 8 to 9 dollars [estimate]. Illustrative valuation: 9 dollars times an 18 times exit multiple, a cyclical-trough level de-rated further for the structural China concern, equals roughly 162 dollars [estimate]. What has to be true for this to be avoided: automotive joins the recovery and China erosion stays gradual, not sudden.
Catalysts and timeline
Near term: Q2 2026 earnings on July 22 (already guided), the Q3 2026 guidance issued alongside it, continued CHIPS Act cash tied to Sherman, Texas production milestones, and any further list-price actions following the three rounds already taken through mid-2026. Multi-year: the capex glide path to 2 to 3 billion dollars fully taking hold through 2026-2027, Lehi, Utah’s LFAB2 reaching production, progress toward the 2030 targets of more than 90 percent internal-fab chip revenue and 80 percent 300mm wafer-output share, and any material shift in US-China export-control policy specific to mature-node analog and legacy chips.
Leading indicators to watch
The automotive end-market growth rate in TI’s own quarterly commentary, the single best real-time tell on whether the recovery is broadening. The gap between trailing free cash flow and CHIPS Act cash received in the same period, a check on whether the free-cash-flow story is organic or partly government-cash-driven. Capex actuals each quarter against the 2 to 3 billion dollar CY2026 guide. China revenue mix trends and any news of SG Micro, 3Peak, or other domestic suppliers winning design sockets historically held by TI. And the spread between TXN’s trading price and the roughly 284 dollar average analyst target, and whether the target moves up to meet the price or the price corrects back toward the target.
Companies to watch (bull / base / bear)
Texas Instruments (TXN) - the toll-taker itself. Bull: automotive joins industrial’s recovery within a couple of quarters and the capex-driven free-cash-flow inflection is confirmed as durable rather than partly CHIPS-cash-driven. Base: the recovery continues at a moderating pace and the stock’s multiple normalizes slightly from today’s elevated level. Bear: a fresh down-cycle intervenes before the structural 300mm payoff shows up, and China’s slow substitution turns into a faster one. Watch: automotive growth rate, the CHIPS-cash share of reported free cash flow, and the price-to-target spread.
Analog Devices (ADI) - the closest peer, a read on whether industrial-led recovery is an industry pattern or TI-specific. Watch: whether ADI’s own automotive segment, currently barely growing, turns before or after TI’s does.
Infineon Technologies (IFX.DE) - the automotive and power bellwether, currently showing live margin compression in exactly the end market TI needs to recover. Watch: whether Infineon’s high-voltage EV powertrain margin stabilizes, an early signal for the whole group’s automotive cycle.
STMicroelectronics (STM) and ON Semiconductor (ON) - the two names furthest from their prior cycle peaks, offering the most operating leverage if the recovery broadens, and the most exposure if it does not. Watch: sequential revenue trends in both, the cleanest read on whether the trough is genuinely behind the group.
NXP Semiconductors (NXPI) - an automotive-first name whose adjusted-versus-reported growth gap is worth tracking as a caution on how peer comparisons can be shaped by divestiture accounting.
Risk controls
The honest risk list, in the order this research weighs it. First, cyclicality concentrated in two correlated end markets: industrial and automotive together are 66 percent of revenue, and TI has shown as recently as 2023-2024 that a downturn can cut its revenue by double digits and its operating profit by nearly a third. Second, China exposure that is large and only partially controllable: roughly half of 2025 revenue tied to products shipped into China, sitting inside a US-China trade and export-control relationship, plus explicit Chinese government support for domestic mature-node analog rivals. Third, valuation after a large run: a trailing multiple near 49 times against a 36-times own-history average, and a stock price already slightly ahead of the average analyst target. Fourth, execution risk on the fab ramp itself: three new 300mm fabs need to reach useful utilization on a schedule that lines up with the capex reduction and the demand recovery simultaneously, and TI’s own filing notes that capex beyond 2026 depends on revenue and growth actually showing up, not a locked-in number. Fifth, a non-recurring component inside the headline free-cash-flow growth rate: CHIPS Act cash inflated the most recent trailing-twelve-month figure meaningfully, and that inflow should not be assumed to repeat every year at the same scale.
What would change the read: automotive joining the industrial recovery with sustained double-digit growth would be the strongest evidence against the bear case. A confirmed, quantified acceleration in Chinese domestic analog substitution showing up in TI’s own disclosed China revenue trend would be the strongest evidence against the bull case, and precisely because this is a slow-moving risk, nobody will ring a bell when it starts.
Methodology, sourcing, and data-quality flags
This piece draws on TI’s FY2025 10-K, its Q1 2026 8-K and 10-Q, its own press releases and investor materials, corroborating press coverage of those same filings, and analyst-tier industry data (WSTS, and peer companies’ own reported results) for market-cycle context. Every load-bearing figure in this piece traces to a claim recorded with a source URL and a tier (primary filing, analyst research, press coverage citing a filing, or estimate), and every load-bearing claim in this research package was independently cross-checked and verified before use; none was unverified at publication.
Data-quality flags. Market cap and share-price figures vary by several percent across data providers and move daily; every dollar figure in this piece is a point-in-time snapshot as of the research date, not a live quote. P/E ratios cited in the research range from about 33 times to 49 times depending on whether the source uses trailing GAAP earnings, an annualized quarterly run rate, or a forward estimate, a genuine definitional spread, not an error. The roughly 50-percent-of-revenue “shipped into China” figure blends direct customer headquarters location with indirect shipment destination; a large share of that revenue serves multinational OEMs assembling in China for global markets, not exclusively Chinese domestic end demand, and should not be read as half of revenue being at immediate export-control risk. Institutional-ownership percentages disagree sharply by source, 85 percent versus 97 percent, and both figures are reported rather than one picked arbitrarily. The more-than-8-dollar-per-share 2026 free-cash-flow target and any 2027 capex commentary are forward guidance and analyst extrapolation, not reported actuals, and are labeled as such throughout. Two different trailing-twelve-month free-cash-flow figures appear in this research because they cover different twelve-month windows, 4.351 billion dollars through the quarter ended March 2026 and 2.938 billion dollars through the quarter ended December 2025; both are correct for their own as-of date. The analog IC market-share ranking is genuinely disputed across methodologies: TI is the clear largest pure-play analog supplier, in a high-teens to roughly 20 percent estimated range, but this piece does not state a precise percentage or a precise number-two-versus-number-three ranking as settled fact, since one calculation method shows Analog Devices a clear second while another shows Infineon roughly tied with TI for the lead.
The five-factor research read. On valuation, TXN trades at roughly 49 times trailing earnings against its own 12-month average of about 36 times, and at roughly 37 times management’s targeted 2026 free cash flow per share, while sitting slightly above the roughly 284-dollar average analyst target even as several individual houses see meaningfully more room. The weight of evidence leans toward a stock priced for a recovery that has already substantially arrived. On growth, first-quarter 2026 revenue grew 19 percent year over year with gross margin expanding 210 basis points sequentially, a clear cyclical recovery, but the growth is concentrated in industrial and a small data-center slice while automotive, a third of revenue, barely moved, and TI’s own growth rate outpaces the broader analog industry’s roughly 7.5 percent 2025 growth partly because of pricing actions as well as volume. On quality, operating margin of 37.46 percent expanding faster than revenue, a structural 40-percent manufacturing cost advantage, and a 23-year dividend growth streak point to a genuinely high-quality franchise, tempered by a payout ratio near 94 percent that leaves little buffer and by a free-cash-flow figure partly inflated by non-recurring CHIPS Act cash. On risk, roughly half of revenue tied to products shipped into China, a policy environment of tariffs and licensing delays layered on explicit Chinese state support for domestic rivals, and revenue concentrated in two correlated cyclical end markets together argue for real, structural risk, not marginal noise. On momentum, the stock is up 68 to 80 percent over the trailing year near an all-time high, with a Buy consensus from 23 analysts and recent bullish target revisions, tempered by the price already sitting above the consensus average target and by an absence of recent insider buying. On balance, the five-factor read lands at Hold: a genuinely excellent business, priced for more of the recovery than the evidence has yet confirmed.
Key sources. Texas Instruments FY2025 Form 10-K and Q1 2026 Form 10-Q/8-K (SEC EDGAR); TI investor relations press releases (CHIPS Act award, dividend increase, Q2 2026 earnings-call notice); WSTS global semiconductor market forecast; Analog Devices, Infineon, STMicroelectronics, NXP Semiconductors, and ON Semiconductor investor materials and earnings releases; corroborating press and analyst coverage cited throughout the claims ledger behind this piece.
Prepared July 1, 2026. Figures are point-in-time and will change. This is research and analysis for educational purposes, not investment advice, not a recommendation, and not a solicitation. TXN carries real cyclicality, China-exposure, and capex-execution risk alongside its structural strengths. Verify all figures independently and consult a licensed financial advisor before making any decision.