
Research date: June 22, 2026 | OSINT market research on ASML Holding N.V., dual-listed as the Nasdaq ADR “ASML” (USD) and the Euronext Amsterdam ordinary “ASML.AS” (EUR). Figures are point-in-time.
Important disclaimer. This is OSINT-based research published for educational and informational purposes only. It is not investment advice, not a recommendation to buy or sell any security, and not a solicitation. The scenarios below are illustrative, not price targets. Semiconductor-equipment is a deeply cyclical and politically exposed business, and a single stock at a full multiple can fall hard and fast. Market caps, prices, valuation multiples, and market-share figures are point-in-time (June 22, 2026), press-reported where noted, and move fast. ASML reports in euros; its ADR and the price targets here are in US dollars, and the two are labeled throughout. Do your own due diligence and consult a licensed advisor.
Where this stock could be in 6 months, 1 year, 3 years, and 5 years
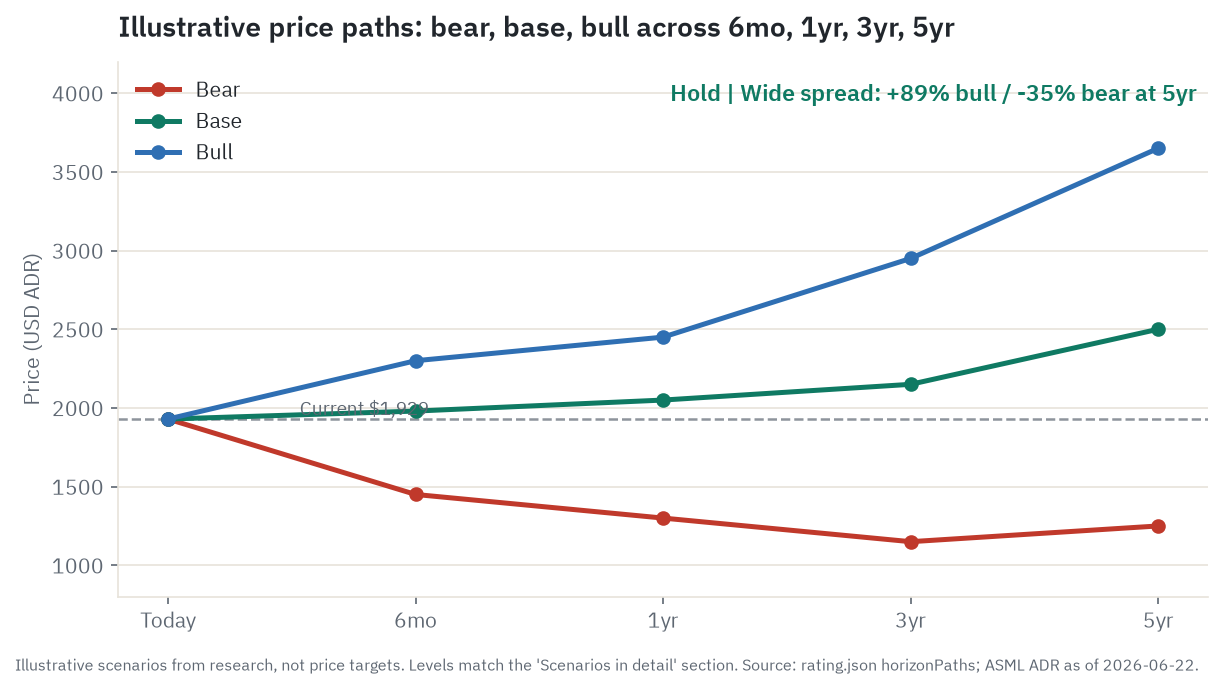
A quick orientation before the four windows. ASML reports its revenue in euros. The price you trade and the targets you see quoted are on the Nasdaq ADR in US dollars. On June 22, 2026 the ADR closed at $1,929.25, near its 52-week high of $1,959, and the dollar levels below are illustrative arithmetic on that ADR, never price targets.
Six months. This window is the calendar and the cycle, not the structural story. The two prints that matter are the Q2 results around mid-July and the Q3 print in the autumn, plus the trajectory of management’s 2026 revenue guidance of EUR 36 to 40 billion and any headline out of Washington on China. The base case is roughly flat to modestly higher, around $1,980, as a fully-priced, high-quality franchise holds near its high while the order book fills out 2027. The bull case, near $2,300, is a clean beat plus reassuring forward commentary that pushes the stock through its $1,959 high. The bear case, near $1,450, is a soft forward read, now harder to anchor because ASML stopped reporting quarterly bookings from 2026, or a China headline that cracks the stretched, above-target setup and sends it back toward the 50-day moving average. The single thing most likely to flip this window is the forward tone on 2027 and 2028 demand.
One year. Still cycle-dominated, but the market’s attention has moved to 2028, the first year the current backlog does not cover. The base case, near $2,050, is 2026 delivering on plan, China declining as guided, the order book carrying the stock, and modest appreciation off a still-full multiple. The bull case, near $2,450, is 2027 bookings refilling convincingly while AI capex keeps compounding, so the monopoly premium re-expands. The bear case, near $1,300, roughly a third lower, is an air-pocket starting to show in soft 2027 and 2028 commentary while a stock at around 49 times forward earnings, with no premium left to give, de-rates toward its own historical median on a 2028 estimate that is being cut. The flip variable is the first hard read on whether 2028 demand refills or air-pockets.
Three years. Now the structural driver tree starts to dominate over the calendar. This is the window where the cyclical air-pocket either arrives or does not, and where High-NA EUV (the next, more powerful generation of the machine) either ramps or stays stuck at low volume. The base case, near $2,150, has the cycle digesting a wobble while EUV unit volume grinds higher, the service business compounds, and earnings rise but the multiple stays normalized. The bull case, near $2,950, has no air-pocket, High-NA scaling, and the 2030 model on track for its high end. The bear case, near $1,150, roughly 40 percent lower, has a real 2028 capex retrenchment hitting ASML on a lag, China service banned, and the stock working back toward where the moat alone is valued. The flip is realized 2028 demand and whether High-NA volume materializes.
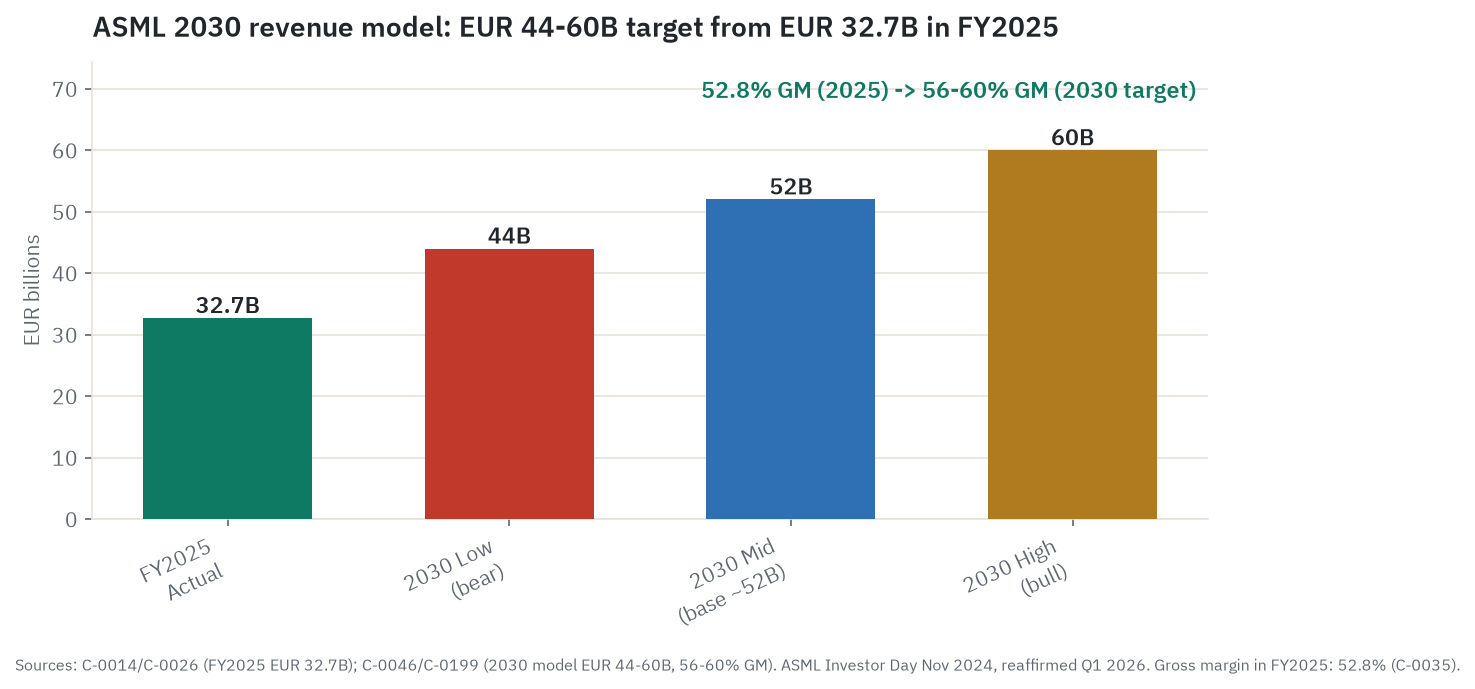
Five years. This is the pure durability question and ASML’s own 2030 model. The monopoly survives in every scenario; the argument is about the multiple and the China service annuity. The base case, near $2,500, has the company hitting the middle of its EUR 44 to 60 billion 2030 revenue model, margins expanding on mix, earnings per share roughly doubling off 2025, at a de-rated but still-rich multiple. The bull case, near $3,650, is the EUR 60 billion high end with High-NA ramped and the premium back, a genuine second leg. The bear case, near $1,250, is the EUR 44 billion low end with China structurally gone and the premium permanently compressed, a durable franchise valued like a normal industrial monopoly rather than 49 times earnings. The flip is delivery against that 2030 model and whether the AI capex cycle proved structural or was a one-time pull.
Where the read lands today. On balance the read lands at Hold. ASML is the single irreplaceable chokepoint of leading-edge chipmaking, a 100 percent EUV monopoly with a counter-cyclical service annuity, 53 percent gross margins, and a backlog that covers all of 2026 and most of 2027, and yet it trades at roughly 49 times forward earnings near an all-time high and about 8 percent above the average analyst price target. The moat is exceptional. The price already pays for it. What is not yet priced is the next move in two things, 2028 AI demand and the China service annuity under a proposed US bill, and that is the real swing.
Companion tool
Jump to the interactive dashboard to sort and filter every company in the piece, or download the Excel model to flex the scenarios yourself.
TL;DR
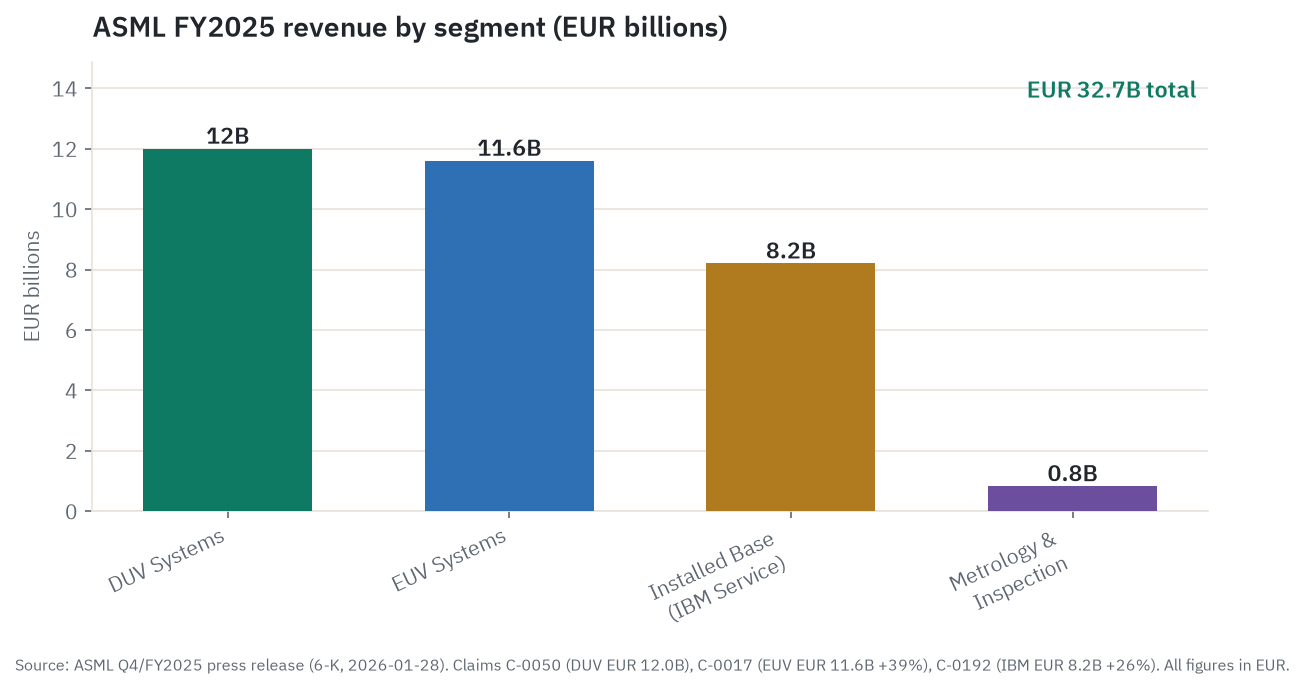
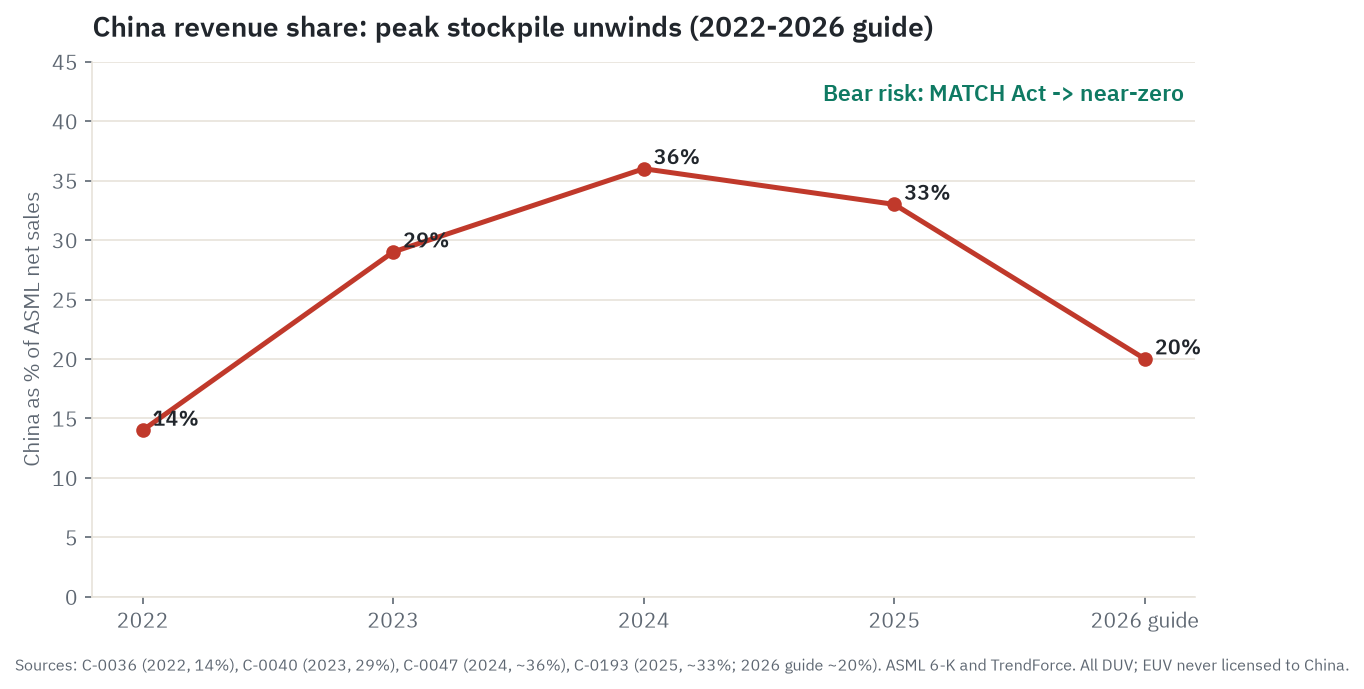
ASML is the only company on Earth that makes EUV lithography machines, the tools that print the finest features on every advanced logic chip and every leading-edge memory die, which makes it the tollgate the entire AI compute build-out must pass through. In FY2025 it collected EUR 32.7 billion in revenue, up about 16 percent, split across EUV systems (EUR 11.6 billion), the older DUV systems (EUR 12.0 billion), and a fast-growing, high-margin service-and-upgrade business on its installed base (EUR 8.2 billion, up 26 percent). Each new chip generation needs more EUV passes per wafer, so AI demand pulls through more machines and more service over time, and the company’s own 2030 model targets EUR 44 to 60 billion of revenue at 56 to 60 percent gross margin. Against all of that sits a full price (about 49 times forward earnings, near a record high, above the consensus target), a China business cut from about a third of revenue in 2025 toward a guided 20 percent in 2026, a proposed US law that could threaten even the service revenue on China’s installed machines, and the deep cyclicality of fab equipment spending. The single biggest risk in one phrase: an ordinary 2028 capex air-pocket that the moat survives but the multiple does not.
Explore it yourself: the interactive dashboard
Open the dashboard in a full screen
The one machine the AI era cannot be built without
Think of making a chip as printing the world’s finest stencil with light. You shine light through a patterned mask onto a silicon wafer coated in light-sensitive chemicals, and wherever the light lands you can etch a feature. The catch is physics: you cannot print a feature much smaller than the wavelength of the light you print with. For decades the industry used deep ultraviolet light, DUV, at 193 nanometers, and squeezed ever-smaller features out of it with clever tricks. By the time chips reached the leading edge, those tricks ran out. To print the tiniest features on a modern processor you need light at 13.5 nanometers, extreme ultraviolet, or EUV. A much shorter wavelength prints a much finer stencil.
Generating usable EUV light is one of the hardest manufacturing problems ever solved at scale. The machine fires a laser at tiny droplets of molten tin, 50,000 droplets a second, vaporizing each at hundreds of thousands of degrees to make a plasma that glows at 13.5 nanometers, then bounces that light off mirrors so smooth that, scaled up to the size of a country, the largest bump would be a fraction of a millimeter. An EUV scanner weighs around 180 metric tons, costs upward of EUR 200 million, and takes multiple cargo planes to ship.
Exactly one company in the world makes this machine: ASML, based in Veldhoven in the Netherlands. Not the leader, not the largest, the only one. Every leading-edge chip, every NVIDIA AI accelerator, every advanced memory die that goes into the AI data centers being built right now, is patterned on a tool that came out of one company’s factory. That is the whole investment case in a sentence, and also the source of every risk in it.
How the money flows
flowchart TD
    HYPER["Hyperscalers\nMSFT+AMZN+GOOGL+META\n~USD 725B 2026 AI capex"]
    CHIP["AI Chip Designers\nNVIDIA Blackwell / Google TPU / AMD\nFabless; funnels to TSMC"]
    HBM["HBM Memory Demand\nSK Hynix / Micron / Samsung\n2026 supply fully sold out"]
    TSMC["TSMC - Leading-Edge Funnel\n~90% advanced logic; USD 52-56B 2026 capex\nN2/N3 each add ~5 more EUV layers vs prior node"]
    SMEM["Samsung + SK Hynix Memory Fabs\nHBM3E/4 ramp; 1b/1c DRAM\n45% of ASML Q1 2026 system sales"]
    INTEL["Intel Foundry + Micron\n14A node; HBM4\nEarly High-NA EUV adopters"]
    ASML_EUV["ASML - EUV Systems\n100% market share; EUR 11.6B FY2025\nLow-NA EUR 220M ASP / High-NA EUR 380M ASP"]
    ASML_DUV["ASML - DUV Systems\n>90% market share; EUR 12.0B FY2025\nChina declining 36% to ~20% of rev"]
    IBM["ASML Installed Base Mgmt\nService + upgrades; EUR 8.2B FY2025 +26%\n314 EUV tools in field; ~52-53% GM"]
    ZEISS["Carl Zeiss SMT - EUV Optics\nSole-source since 1995; ASML ~25% owner\nOptics output = hard ceiling on EUV production"]
    CYMER["Cymer - EUV Light Source\nASML-owned since 2013 EUR 1.95B\n13.5nm LPP plasma; no alternative"]
    TRUMPF["Trumpf - CO2 Pulse Lasers\nSole global supplier; 2 per EUV tool\nNo second-source; Trumpf = ASML output limit"]
    SUP["~5,000 Component Suppliers\nPrecision mechanics, stages, vacuum, software\nNo single node as critical as Zeiss/Trumpf"]

    HYPER -->|AI infra spend drives chip orders| CHIP
    HYPER -->|HBM procurement contracts| HBM
    CHIP -->|Wafer starts at advanced nodes| TSMC
    HBM -->|DRAM/HBM capacity ramp| SMEM
    TSMC -->|EUV tool orders 18-24mo lead time| ASML_EUV
    TSMC -->|DUV orders for mature steps| ASML_DUV
    SMEM -->|EUV + High-NA tool orders| ASML_EUV
    INTEL -->|High-NA EUV + DUV orders| ASML_EUV
    ASML_EUV -->|Tools in field generate service| IBM
    ASML_DUV -->|Installed base generates service| IBM
    ZEISS -->|Sole-source EUV mirrors and optics| ASML_EUV
    CYMER -->|EUV light source integrated| ASML_EUV
    TRUMPF -->|CO2 lasers power Cymer plasma| CYMER
    SUP -->|Components to ASML assembly| ASML_EUV
    SUP -->|Components to ASML assembly| ASML_DUV
Read it top to bottom. The money starts at the hyperscalers. Microsoft, Amazon, Alphabet, and Meta are together guiding something like USD 700 to 725 billion of capital spending in 2026, up roughly 77 percent year on year (press-reported, individual guides vary), almost all of it pointed at AI infrastructure. That spending creates orders for AI accelerators from NVIDIA, Google, and AMD, and for the high-bandwidth memory those accelerators need from SK Hynix, Micron, and Samsung. Those chip designers are fabless, meaning they design the chip but own no factory and outsource the actual manufacturing to foundries like TSMC. To make those chips, the designers turn to the foundries and memory fabs: TSMC above all, which manufactures roughly 90 percent of leading-edge logic and guided its own 2026 capex at USD 52 to 56 billion, plus Samsung, Intel, SK Hynix, and Micron.
To build at the leading edge, those chipmakers must buy EUV scanners, and there is only one place to buy them. So the entire flow funnels through Veldhoven. ASML is the toll booth between fab capex and finished advanced chips. In FY2025 it collected that toll three ways: EUV system sales (EUR 11.6 billion), DUV system sales (EUR 12.0 billion), and Installed Base Management, the service-and-upgrade annuity on every tool already in the field (EUR 8.2 billion). For more on where this AI spend originates and how it cascades through the chain, see the AI supply-chain investment map and the memory supply chain.
Two features of the shape are the whole point. First, the toll compounds. Each new chip generation needs more EUV exposures per wafer, so even if total wafer volume stayed flat, the number of machines required per unit of capacity keeps rising. Second, ASML itself sits on top of an even narrower chokepoint. It does not make everything inside the machine; it assembles roughly 5,000 suppliers’ parts. But three of those suppliers are irreplaceable: Carl Zeiss SMT, which has been the sole source of ASML’s ultra-precision optics since 1995 (ASML owns 24.9 percent of the Zeiss SMT subsidiary to lock the relationship in); Cymer, the EUV light source, which ASML bought outright in 2013 for EUR 1.95 billion; and Trumpf, the sole global supplier of the CO2 pulse lasers that drive Cymer’s plasma. ASML cannot ship a single extra EUV machine faster than Zeiss can grind the mirrors. The binding constraint on the whole industry’s access to leading-edge chips is, in the end, the optical-grinding capacity of one German factory.
The product field guide: EUV, DUV, metrology, and service
ASML sells four things. Knowing what each is, what it costs, and who buys it is most of understanding the company.
EUV (extreme ultraviolet) systems. The moat tool, described above. ASML has 100 percent market share because nobody else can make one. The current generation, called Low-NA EUV (NA stands for numerical aperture, a measure of how much light the optics gather and therefore how fine a feature the tool can resolve), shipped at a blended average selling price of about EUR 227 million in 2025, with the company guiding EUR 220 million for modeling going forward. ASML shipped 48 EUV systems in 2025, and EUV revenue grew 39 percent. Buyers are the leading-edge logic and advanced-memory makers: TSMC, Samsung, Intel, SK Hynix, and Micron.
High-NA EUV. The next generation, with a wider aperture (NA of 0.55 versus 0.33) that resolves an 8-nanometer feature in a single exposure where Low-NA needs 13. It is roughly double the price: the EXE:5000 and EXE:5200B units run about USD 370 to 400 million each, and Samsung paid USD 773 million for two, which pins the per-unit number at around USD 386 million. Fewer than 12 of these exist worldwide as of mid-2026. Intel has been the most committed adopter (targeting its 14A node), with Samsung and SK Hynix close behind, and the research institute imec running one in a pilot line. The important wrinkle, which the bear case leans on heavily, is that TSMC has decided to skip High-NA through roughly 2029, extending Low-NA with multi-patterning instead (exposing one layer in several passes to draw features finer than a single shot allows, the costly workaround EUV was meant to replace) because High-NA costs about double and TSMC has, in its own words, been “exceptionally effective” at stretching the older tool. So the most expensive, highest-margin machine in the lineup is for now riding on lower-volume customers.
DUV (deep ultraviolet) systems. The older 193-nanometer generation, the cash workhorse for 7-nanometer and above logic and for mature nodes. ASML holds more than 90 percent of immersion DUV by revenue, with Canon and Nikon splitting the remainder, mostly in dry and mature-node tools. ASML shipped 279 DUV systems in 2025 for about EUR 12.0 billion, down 6 percent. DUV is the China-exposed segment: China can buy DUV, has never been allowed to buy EUV, and the swing in Chinese DUV orders is the single biggest source of revenue volatility in the company.
Metrology and inspection. Tools that measure and check each layer as it is patterned, sold under the YieldStar and HMI e-beam lines. This is a smaller line (about EUR 825 million in 2025) and the one segment where ASML competes against a strong incumbent, KLA, rather than dominating.
Installed Base Management (the service annuity). The quiet engine. Every machine ASML has ever sold, EUV and DUV alike, needs service, spare parts, and periodic field upgrades for a 20-to-30-year operating life. ASML provides all of it; there is no third-party service market for these tools. This segment generated EUR 8.193 billion in FY2025, up 26 percent, at gross margins in the low-50s percent that match or beat the company average. It is the steadiest line in the business: through the 2023 downturn, when system sales swung hard, service barely moved. As of June 2026 ASML tracks 314 EUV systems operational worldwide via remote telemetry, plus a DUV fleet in the thousands, and that base compounds with every new shipment. One detail shows how the model works: when ASML upgrades a customer’s existing EUV tool to a higher throughput, that revenue (analyst-estimated at EUR 15 to 20 million per tool) is booked under service, not as a new machine. The first sale is the start of the revenue relationship, not the end.
The EUV monopoly: how wide is the moat
A 100 percent market share invites the obvious question: how is that durable, and how would it break? The honest answer is that the moat is unusually deep and that no credible threat exists inside a ten-year horizon, but the reasons are worth spelling out because they are also the reasons the franchise commands a premium.
The monopoly is structural, not accidental. EUV required solving five or six independently hard engineering problems over more than 25 years, and ASML spent on the order of EUR 10 billion of cumulative EUV R&D to do it (a figure that is approximate and single-sourced; ecosystem estimates including customer contributions run higher). Crucially, the chipmakers themselves concluded they could not replicate it: in 2012, Intel, TSMC, and Samsung each took equity stakes in ASML precisely because investing was the only way to influence the roadmap. When customers buy your stock rather than try to compete with you, the moat is real.
Underneath ASML’s monopoly sit three more monopolies, each a chokepoint within the chokepoint. Zeiss SMT is the sole source of the optics and cannot make High-NA anamorphic mirrors for anyone else, because the processes are co-developed with ASML’s scanner design. Cymer, ASML-owned, is the only viable EUV light source. Trumpf is the only maker of the drive lasers, two per machine, with no second source; the three companies describe their relationship as a “virtually merged company” with open books. Each of those nodes would itself take a decade-plus to replicate. ASML’s patent portfolio runs to roughly 5,000 active filings with unusually high citation density, the signature of core technology rather than peripheral filings.
The competitive threats people raise do not clear the bar. Canon’s nanoimprint lithography (NIL), which stamps a pattern rather than projecting light, is genuinely cheaper per tool but is stuck on throughput (around 25 wafers an hour against EUV’s 185-plus), on mask durability (real-world life around 50 wafers, not the hoped-for hundreds), and on overlay accuracy (how precisely each new layer lines up on top of the layers already printed) that is several times too loose for leading-edge logic. It may serve niches; it has no disclosed high-volume leading-edge logic customer. China’s domestic EUV effort produced a prototype in early 2025 that generates EUV light but has not made a functional chip, and it runs straight into the Zeiss optics problem with no domestic answer; independent analysts put a production-grade Chinese tool at 2030 at the earliest. Customer self-supply is not feasible for the same reasons the incumbents bought equity instead of building.
Where could the moat actually erode? Not in EUV share, which is secure. The real soft spot is adoption mix and timing on High-NA. With TSMC, the largest single customer and an estimated majority of EUV revenue, skipping High-NA through about 2029, the highest-value product depends on Samsung, Intel, and SK Hynix carrying the early volume. That does not threaten the monopoly. It threatens the pace of the average-selling-price uplift the bull case wants, and it pushes the richest part of the 2030 model out in time.
Who wins where
The competitive map is segment-specific, which is the part casual readers miss. ASML is not uniformly dominant; it is a monopoly in one segment, near-monopoly in another, and a strong-but-challenged player in a third.
In EUV, there is no competitor. That is the entire point of the company.
In DUV immersion, the top-end tools for advanced nodes, ASML holds more than 90 percent by revenue. Canon and Nikon still ship dry and older immersion scanners for mature nodes, where they compete on price, but they have ceded the advanced edge entirely and have no EUV path.
In metrology and process control, ASML is the challenger. KLA dominates wafer and reticle inspection with roughly half the global process-control market and a near-monopoly in reticle inspection. ASML’s YieldStar and HMI tools overlap with KLA’s, but here ASML is taking on an entrenched leader rather than defending its own.
The lesson is that the premium people pay for ASML is a premium for one segment, EUV, and the durability of that one chokepoint. Everything else is a good business in a competitive market.
Company by company: who’s who
ASML is the subject; the rest of this list is the supporting cast that explains the demand, the comparison, and the supply ceiling. All market caps are point-in-time as of June 22, 2026, in US dollars, and move daily. Several of the peer caps below are single-vendor figures and should be treated as approximate.
The subject
ASML Holding N.V. (ASML / ASML.AS), market cap about $738 billion. Sole maker of EUV scanners (100 percent share), more than 90 percent of immersion DUV, plus the captive installed-base service business. Q1 2026 delivered EUR 8.8 billion revenue at 53.0 percent gross margin and EUR 2.8 billion net income, and management raised FY2026 guidance to EUR 36 to 40 billion. Bull: an irreplaceable monopoly at the only node that matters, where every AI fab expansion is a direct order, with a decade of High-NA average-selling-price uplift ahead. Bear: China cut from about a third of revenue to a guided 20 percent, bookings disclosure removed, a roughly 49 times forward multiple that already prices a flawless 2030, and an export-control escalation that could hit even the service annuity.
Customers (the demand signal)
Taiwan Semiconductor (TSM / 2330.TW), about $2.06 trillion. The world’s largest foundry, roughly 90 percent of leading-edge logic, and the single biggest consumer of ASML EUV tool-hours (an estimated majority of EUV revenue). Q1 2026 revenue was USD 35.9 billion, up 40.6 percent, at 66.2 percent gross margin, and it raised its AI-accelerator revenue growth outlook. Bull: multi-year AI wafer demand with no credible alternative foundry at the leading edge, plus global capex expansion that creates new ASML orders. Bear: Taiwan geopolitical risk is existential, Apple is roughly a quarter of revenue, and any AI-capex pause flows straight through TSMC to ASML; TSMC’s own High-NA deferral is a negative read for ASML’s premium product. See the NVIDIA deep dive for the accelerator demand that drives TSMC’s capex.
Samsung Electronics (005930.KS), about $1.51 trillion. The largest memory maker and the second foundry, using EUV for HBM and advanced DRAM and for 3-nanometer and 2-nanometer logic, and an early High-NA adopter. Bull: HBM demand from AI accelerators drives multi-year DRAM capex, each unit of which needs EUV layers. Bear: it has ceded HBM share to SK Hynix at NVIDIA and is losing foundry share to TSMC, so the bull case is a hoped-for reversal rather than a current trend.
Intel (INTC), about $673 billion. Designs CPUs and AI accelerators and is rebuilding Intel Foundry as a contract foundry, and it has received more High-NA tools than any other customer (deploying them for its 14A node). Q1 2026 beat with USD 13.6 billion revenue, up 7 percent, and a turnaround that is gaining credibility. Bull: if Intel Foundry reaches even 5 percent external share, its High-NA demand alone underpins years of ASML system sales. Bear: foundry is still loss-making, 18A and 14A execution is unproven, and that 5-percent-share scenario is conditional, not a base case.
Micron and SK Hynix (memory). The HBM makers driving the memory side of ASML’s order book; SK Hynix’s available HBM capacity is described as effectively zero, and hyperscalers have reportedly offered to fund its EUV purchases directly to secure supply. See the Micron deep dive for the memory-maker view. Micron raised FY2026 capex to about USD 20 billion to accelerate HBM and advanced DRAM.
WFE peers (the comparables)
WFE stands for wafer-fab equipment, the broad category of tools that build chips. These three are the natural valuation comparisons, and none makes lithography.
Applied Materials (AMAT), about $500 billion. The largest WFE company by revenue, with deposition, etch, and process-control tools. Q2 FY2026 set a revenue record of USD 7.91 billion. Bull: a broad toll on every process step that multiplies as transistor architectures change. Bear: higher China exposure than ASML and no monopoly product; it faces competitors on every line.
Lam Research (LRCX), about $486 billion. The number-two WFE company, specialized in etch and deposition with a memory-heavy mix and its own high-margin service annuity. Q3 FY2026 hit a revenue record of USD 5.84 billion. Bull: memory-capex recovery plus etch-intensive HBM demand is the strongest tailwind in the group. Bear: the memory tilt means sharper cyclical swings, and a roughly 54 times forward multiple prices flawless execution.
KLA Corporation (KLAC), about $490 billion. The dominant process-control supplier, with roughly half the global market and a near-monopoly in reticle inspection. (Note: a widely-circulated stale figure put KLA’s cap near $339 billion; the current figure is about $490 billion.) Q3 FY2026 revenue was USD 3.42 billion. Bull: process-control spend grows faster than overall WFE in leading-edge transitions, and reticle inspection is a durable moat. Bear: it carries the highest forward multiple in the group, about 57 times, and competes with ASML’s own metrology line.
DUV competitors and suppliers (context)
Canon (CAJ) and Nikon (NINOY) are the DUV fringe and the perennial “disruptor” candidates. Canon’s NIL is best treated as optionality, not a threat: it has no leading-edge logic customer and is investing in a new Japanese plant for a market estimated at only about USD 130 million in 2026. Nikon’s advanced-DUV sales have collapsed and it has no EUV path; it is context, not a tradeable comparable, and its OTC listing is too thin to trade at size. Carl Zeiss SMT and Trumpf, the irreplaceable suppliers, are private (Zeiss SMT is part of the Zeiss group; ASML owns 24.9 percent of the SMT subsidiary), so there is no way to own the supply chokepoints directly.
What the filings say
ASML is a foreign private issuer, so it files a 20-F annual report and 6-K quarterly results rather than the 10-K and 10-Q a US company would file. It reports under US GAAP, in euros. The figures below are from the FY2025 20-F and the quarterly press releases unless noted, and all amounts are in euros.
Revenue and trajectory. Net sales rose from EUR 27.6 billion in 2023 to EUR 28.3 billion in 2024 (a pause year as Chinese DUV demand digested) to EUR 32.7 billion in 2025, a 15.6 percent jump. The 2025 step-up was driven by EUV revenue rising 39 percent on 48 systems shipped and by service growing 26 percent. The end-market split was logic at EUR 16.1 billion (about 49 percent), memory at EUR 8.4 billion (26 percent), and service at EUR 8.2 billion (25 percent).
Margins. Gross margin was 52.8 percent in FY2025, up 150 basis points from 51.3 percent, expanding as the mix shifts toward EUV and the high-margin service business. (A third-party aggregator shows 51.83 percent, likely a cost-classification difference; the company’s own 6-K figure of 52.8 percent is the primary source, and gross profit of EUR 17.258 billion over net sales of EUR 32.667 billion confirms it.) Operating margin was 36.9 percent, on EUR 12.054 billion of operating income.
Earnings and cash. Net income was EUR 9.609 billion, with basic earnings per share of EUR 24.73. Operating cash flow was EUR 13.827 billion and free cash flow was EUR 12.253 billion (these specific cash-flow figures come from an aggregator’s rendering of the 20-F rather than the filed line directly; the magnitude is corroborated). The balance sheet is fortress-grade: EUR 13.3 billion of total cash against EUR 4.4 billion of debt, for a net cash position of about EUR 8.9 billion at year-end 2025, with no near-term debt-maturity wall flagged. Cash fell to EUR 8.4 billion by the end of Q1 2026 after heavy buybacks.
Capital returns. The declared FY2025 dividend was EUR 7.50 per share, up 17 percent. Buybacks jumped to EUR 5.95 billion in 2025 from EUR 0.5 billion in 2024, the prior EUR 12 billion program was completed, and a new EUR 12 billion program was authorized for 2026 to 2028. Total FY2025 shareholder returns came to EUR 8.5 billion, and the diluted share count is declining (about 389 million, down from 394 million) as repurchases more than offset stock-based compensation.
The order book. This is the swing line. Q4 2025 produced record net bookings of EUR 13.2 billion (EUR 7.4 billion of it EUV), and the year-end backlog stood at EUR 38.8 billion, more than 100 percent of the 2026 revenue guidance. The catch, covered below, is that ASML stopped disclosing quarterly bookings from 2026, so this is the last clean reading of the metric that once moved the stock most.
Guidance and the 2030 model. Management first guided FY2026 to EUR 34 to 39 billion in January, then raised it to EUR 36 to 40 billion in April after a Q1 beat, citing strong AI-driven demand, with gross margin guided at 51 to 53 percent and China at about 20 percent of revenue. The longer-term 2030 model, set at the 2024 Investor Day and reaffirmed since, targets EUR 44 to 60 billion of revenue at 56 to 60 percent gross margin. That is a company model and a scenario range, not a guarantee; the wide band reflects China uncertainty at the low end against a full AI demand case at the high end.
The risk factors that matter (from ASML’s own filing). First, export controls on China, the most material. Dutch, EU, and US controls have tightened progressively; the EU folded Dutch national controls into its control list in November 2025, and a US affiliates rule from October 2025 is suspended for a year but is a contingent risk. EUV has never been licensed to China, so China revenue is entirely DUV plus service on the installed DUV base. Second, customer concentration: the single largest customer was 23.9 percent of FY2025 net sales and the top two were 38.0 percent. Third, single-source supply: Zeiss SMT is the sole optics supplier and ASML’s output ceiling is set by Zeiss’s capacity, which is why ASML holds its stake. And the industry is structurally cyclical, as the 2023 to 2024 episode demonstrated.
Insider and institutional signal. Institutions held roughly 18 percent of the float across about 2,269 filers as of March 2026. On the insider side, ASML is Dutch and reports to the AFM rather than via Form 4; the notable purchases were three executives buying near the post-October-2024 low at around USD 740, well below current levels, which reads as management seeing value then. Some small executive trims since are a neutral-to-mildly-cautious signal.
What the market is paying
Everything in this section is point-in-time as of the close on June 22, 2026, and these multiples move daily. The ADR closed at $1,929.25, within about 1.5 percent of its 52-week high of $1,959.04 and up roughly 182 percent from its 52-week low of $683.48, set in October 2024 after Q3 results were accidentally released early and revealed a bookings miss. The Amsterdam ordinary closed at EUR 1,655.80; at the day’s EUR/USD of about 1.145 that implies roughly EUR 1,685 for the ADR, a spread of under 2 percent that is normal intraday-timing noise, not an anomaly.
Performance and relative strength. The ADR is up about 34 percent year to date and about 116 percent over one year (the YTD figure is vendor-dependent and best read as mid-30s percent). That one-year number flatters because of the recovery off the October 2024 low. Against its equipment peers, ASML has actually lagged in 2026: Lam Research is up roughly 139 percent and Applied Materials about 128 percent year to date, while KLA is up about 59 percent. Against the broad Nasdaq-100, up about 17 percent, ASML is a clear outperformer; against its own peer group, it is the laggard, partly because of euro-denominated earnings against a strong dollar and partly because the China narrative weighs on it more than on the others.
Volatility. This is a high-beta name, with a 5-year beta around 1.4 to 1.47, meaning it tends to amplify market moves by 40 to 50 percent. The October 2024 single-session collapse, when one bookings print sent the stock down about 16 percent in a day, is the cautionary tale: this stock can gap on a single number. The RSI around 66 is elevated but not classically overbought, though the stock trades about 21 percent above its 50-day moving average, a stretched condition.
The multiples, in context. Trailing P/E is about 63 times against a 5-year median near 37.6 times, but the trailing figure is distorted by the 2022-2023 earnings trough and is not the cleanest read. Forward P/E is disputed by vendor: most data sources cluster around 48 to 52 times (call it roughly 49 times), with one outlier near 37 times that appears to use a different earnings estimate. EV/EBITDA is similarly definition-sensitive, anywhere from about 28 to 49 times depending on whether you use GAAP or adjusted EBITDA and how you treat the net cash. The cleanest “expensive on its own history” signal is price to free cash flow at about 60 times, roughly 47 percent above its own 10-year median near 41 times.
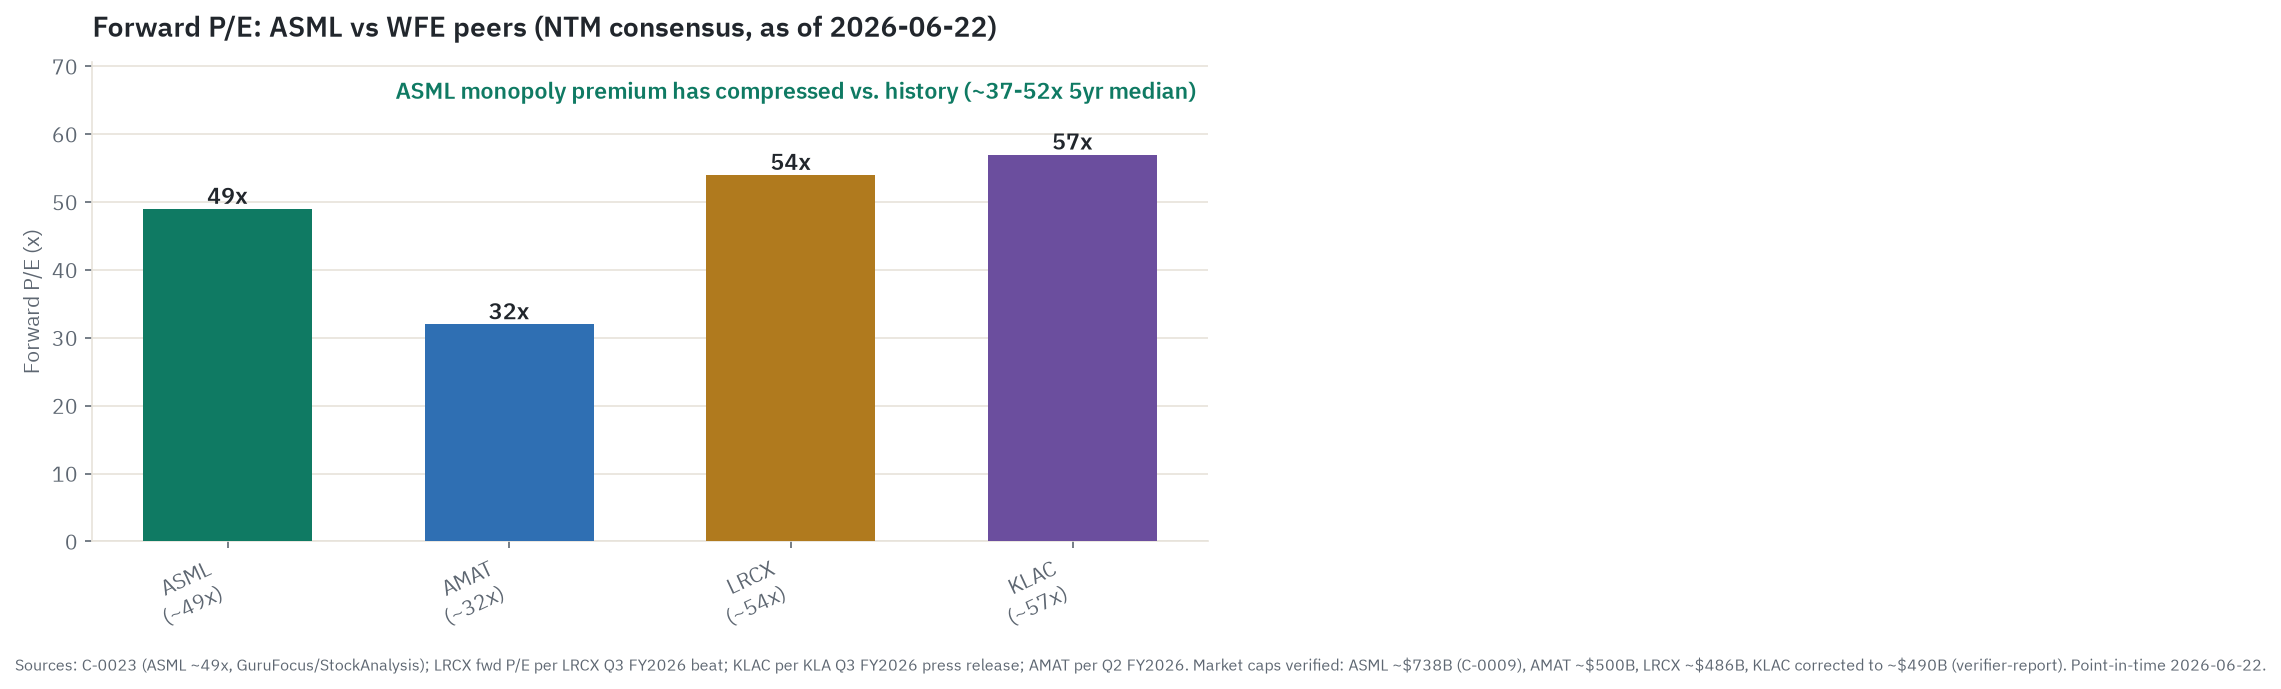
The compressed premium. Here is the tell. Historically ASML carried a 20-to-30-percent forward-P/E premium to AMAT, LRCX, and KLAC because of the EUV monopoly. That premium has compressed to roughly zero. On forward earnings ASML at about 49 times is now cheaper than Lam (about 54) and KLA (about 57) and only modestly above Applied (about 43 on one read, lower on others). The market has, quietly, stopped paying up for the moat. Two readings compete: either the China DUV cliff creates earnings uncertainty the others do not face, or the market is pricing ASML on 2027 and 2028 earnings, where China and the bookings recovery matter most, precisely because 2026 is already locked in by backlog.
Liquidity and short interest. ASML is highly liquid despite the four-figure price, trading roughly USD 3.8 billion a day. Short interest is trivially low, around 0.27 percent of shares, with a sub-1-day cover and a 0.25 percent borrow rate, which says the China risk is a known, priced story rather than a hidden controversy with an organized bear trade.
Sell-side consensus (opinion, not fact). Analyst ratings and targets are opinions and lag price. The consensus is a Moderate-to-Strong Buy from roughly 32 to 35 analysts, but the price-target math is the interesting part: the mean target sits at or slightly below the current price (MarketBeat about USD 1,773, TipRanks about USD 1,912, an S&P set about USD 1,707), with a high near USD 2,345 and a low near USD 1,150. At $1,929 the stock has run through the average target. That does not mean it is wrong; targets chase a trending stock. But the sell-side has not collectively endorsed this level.
What the crowd is saying
Treat this as signal, not fact; the underlying data is soft and carries wide error bars.
The dominant narrative in mid-2026 is a two-act tension. The bull act, “irreplaceable AI picks-and-shovels, record backlog, raised guidance,” is the louder and better-supported one, helped by a Q1 beat and a rare double-upgrade in March that produced a brief retail moment. The bear act has been intensifying. The proposed MATCH Act (more on it below) put the China service annuity in the headlines; ASML’s decision to stop reporting quarterly bookings was framed by some outlets as making the shares harder to value; and on June 19, 2026, US officials raised an allegation that EUV-related components may have reached China, which ASML categorically denied (noting it tracks all 314 EUV systems and that none is in China). The allegation was unsubstantiated as of the research date, the stock recovered after the denial, and it should not be treated as established fact in any analysis. The net tone is warming on the structural AI story and cooling in real time on China.
ASML is an institutionally-dominated stock with structurally low retail chatter, which is the most reliable read here. It is Amsterdam-listed, euro-reporting, technically complex, and priced in the four figures, so it lacks the meme-stock characteristics. Proxy data (soft, third-party) shows low and event-driven mention volume, a Reddit lean that is more bearish than news or X and focused on the China-cliff and bookings-opacity concerns, and search attention well below the AI-chip names. There is no sign of coordinated promotion; with a float of about 385 million shares and a four-figure price, the dynamics that drive pump-and-dump do not apply at this scale.
Three divergences between the crowd’s story and the filings are worth flagging. First, the EUR 38.8 billion backlog is real and auditable, but so is the China compression, and the crowd emphasizes the backlog as “visibility” while the filings show the China decline is ahead, not behind; the two have not been fully reconciled in the price. Second, the consensus target sits below the price while the rating stays bullish, a textbook case of the story being louder than the implied-return arithmetic. Third, the bookings-opacity decision is bearish signal dressed as housekeeping: bookings were the earliest demand signal outsiders had, and removing them shifts the information advantage to management and to the long-dated backlog figure management controls, precisely when China demand is falling and the service annuity is under legislative threat.
Durability versus the cycle
The synthesis question is whether ASML is a structural compounder or a cyclical at a structural-compounder price. The honest answer is both, and which one you are buying depends on the entry multiple and the next two years.
The structural case is strong. AI capital spending is large and contracted, not speculative: hyperscalers are guiding USD 700-billion-plus for 2026, SK Hynix HBM is effectively sold out with customers funding EUV purchases directly, and node migration mechanically multiplies EUV layers per wafer, from roughly 10 at 5-nanometer to more than 20 at 3-nanometer to about 25 at 2-nanometer (these layer counts are press and analyst estimates, approximate). The service annuity is a genuine counter-cyclical floor that barely moved through the last downturn. And the monopoly survives every scenario. On the structural facts, this is one of the best businesses in the market.
The cyclical case is just as real, and it has a date on it. Wafer-fab equipment spending is deeply cyclical, and ASML sits 18 to 24 months down-chain from the fab decision, so it is the last link to feel a slowdown and gets hit on a lag. The backlog that bulls call a fortress is also a clock: analysts expect the order book to be fully booked for 2027 by around the Q2 2026 report, which mechanically moves the market’s attention to 2028, the first year backlog does not cover. And the second derivative of demand is turning the wrong way right into that window. Hyperscaler capex growth is forecast to decelerate from roughly 51 percent in 2026 to about 13 percent in 2027 to about 5 percent in 2028 (Allianz Trade and consensus, forecasts not facts), and aggregate big-five free cash flow is turning negative for the first time in decades as the build-out is funded partly on credit. Absolute spend can keep rising while the growth rate collapsing is enough to crack WFE bookings. If AI revenue does not monetize the spend, a 2027-2028 capex cut is not a tail risk, it is a base case, and it routes straight to ASML’s order book.
The most likely outcome is a split: 2026 prints fine, the structural story stays intact, and the argument gets settled in 2028 over whether the cycle air-pockets and what the multiple does when it cannot lean on a bookings number anymore.
The scenarios in detail
Four variables decide where ASML is in five years. Everything below is just different settings of these four dials, and every forward dollar figure is an illustrative estimate anchored on the assumptions, never a price target.
- EUV/system volume and the AI-capex cycle (the swing). Keys off hyperscaler capex, TSMC capex, and memory capex, and critically off the growth rate of that spend, which is forecast to decelerate sharply by 2028. Backlog covers 2026 and most of 2027; the market re-prices on 2028, the first uncovered year.
- Margin and mix (the quality dial). Gross margin of 52.8 percent today, targeted at 56 to 60 percent by 2030, expanding on the shift toward EUV, High-NA, and service. This expansion is durable because it falls out of the installed-base flywheel rather than requiring heroics.
- China and the proposed MATCH Act (the binary risk). China fell from about 36 percent of total net sales in 2024 to about 33 percent in 2025 to a guided 20 percent in 2026 (Q1 system sales were already 19 percent). The MATCH Act, introduced in April 2026 and passed by the House Foreign Affairs Committee that month but not enacted into law, would ban not just new China shipments but the servicing of the installed Chinese DUV base, hitting the high-margin annuity. Bank of America’s worst-case scenario for a full ban is a 14-to-15 percent revenue hit and a 16-to-17 percent EBIT hit (an attributed analyst scenario, conditional on the bill passing as written, not a fact). The at-risk China service revenue, estimated at roughly EUR 1 to 2 billion, is a back-of-envelope figure because ASML does not break out China service revenue. This dial is binary and largely un-forecastable from the outside.
- The multiple (the valuation dial). About 49 times forward, 63 times trailing against a 37.6 median, P/FCF about 60 times against a 41 median, the monopoly premium gone, near the 52-week high, and about 8 percent through the consensus mean target. On this dial the moat is exceptional but the price already pays for it.
Bull: the AI super-cycle holds and the toll keeps rising
Revenue grows 10 to 14 percent a year toward the EUR 60 billion high end of the 2030 model, gross margin reaches 58 to 60 percent, EUV share stays at 100 percent with High-NA scaling at Samsung, Intel, and SK Hynix and eventually re-engaging TSMC, and the monopoly premium re-expands toward about 32 times as 2027-2028 earnings deliver and the China overhang proves over-discounted, with MATCH dying in Congress or China fully replaced by non-China AI demand. Net income roughly doubles toward EUR 20 billion-plus, earnings per share toward EUR 54 (about USD 62). At about 32 times that is roughly $3,650 on the 5-year path and about $2,450 at one year. What has to be true: AI capex keeps rising in absolute terms even as growth normalizes, 2028 bookings refill before the 2027 backlog is consumed, and High-NA volume scales. What most likely breaks it: the 2028 air-pocket.
Base: the cycle digests, the moat compounds, the multiple normalizes
Revenue grows 8 to 10 percent a year toward the EUR 50 to 52 billion midpoint, gross margin reaches 56 to 58 percent, Low-NA volume (80-plus units a year by 2027) carries the load while High-NA stays modest on the TSMC deferral, and the multiple de-rates from about 49 times toward about 28 times as the premium stays compressed but earnings growth justifies a still-rich multiple, with China settling near the guided 20 percent and gliding lower without a full service ban. Revenue runs from about EUR 33 billion to about EUR 50 billion by 2030, net income from EUR 9.6 billion toward EUR 17 to 18 billion, earnings per share toward EUR 44 to 46 (about USD 50 to 53). At about 28 times that is roughly $2,500 on the 5-year path and about $2,050 at one year. A 2027-2028 wobble is absorbed rather than avoided. What most likely breaks it: the multiple, because at this starting point even a modest growth disappointment re-rates the stock down faster than earnings grow.
Bear: the multiple is the trade
Revenue grows around 5 percent or stalls toward the EUR 44 billion low end as the 2028 air-pocket arrives and China goes structurally toward zero. Margin holds in the low-to-mid 50s (service cushions it) but EBIT is cut 16 to 17 percent if the MATCH service ban passes (Bank of America scenario, estimate). EUV share stays at 100 percent, the moat survives, but High-NA is deferred by TSMC’s skip to about 2029. The multiple compresses toward the 37 times trailing median and below as the premium goes permanently and a 2028 estimate is cut. Revenue stalls near EUR 40 to 44 billion, net income flat-to-down, and the stock can lose 30 to 40 percent from here even while EUV stays irreplaceable. On a cut 2028 estimate at about 22 to 24 times, that is roughly $1,150 to $1,250 on the 3-to-5-year path and about $1,300 at one year. The point, put plainly, is that you can be completely right about EUV being the chokepoint and still lose, because the price already pays for the chokepoint and the next move in the two un-priced things, 2028 demand and the China annuity, is down. What would break the bear: AI demand monetizes, absolute capex keeps rising through 2028, and MATCH dies, in which case the moat re-rates and the bear is early and wrong.
Catalyst timeline and leading indicators
Near term: the Q2 2026 results around mid-July, where the order book likely shows 2027 fully booked and attention shifts to 2028 (the forward tone is the catalyst, not the headline number, since bookings are no longer disclosed); any MATCH Act floor-vote movement; and the quarterly China revenue mix against the 20 percent guide. Multi-year: 2027 is when the backlog cushion runs out, 2028 is the forecast capex-growth trough and the air-pocket window, High-NA adoption inflects (TSMC skipping through about 2029), and 2030 is the scored waypoint against the EUR 44-to-60-billion model. The leading indicators a reader can actually watch: TSMC’s capex guidance (especially the 2027 number and its High-NA stance), hyperscaler capex growth rate rather than the absolute level, the China revenue percentage each quarter, High-NA shipment cadence, and the forward multiple against its own 37 times median and against Lam and KLA. Because ASML stopped disclosing bookings, watch the substitutes: annual guidance revisions, management’s forward tone, and customer capex as a proxy. The absence of the number is itself part of the risk.
Companies to watch (bull / base / bear)
ASML (ASML). The chokepoint itself. Bull: the EUV monopoly plus a decade of High-NA average-selling-price uplift. Base: the cycle digests a wobble, the moat compounds, the multiple normalizes to about 28 times. Bear: the High-NA uplift is deferred, the monopoly premium is already gone, the 2027 backlog runs out into a 2028 capex-growth cliff, and the China service annuity faces a proposed ban. Watch: the Q2 forward tone, the China mix, and MATCH movement.
TSMC (TSM). The demand bellwether and the High-NA tell. Bull: no credible alternative foundry at the leading edge. Bear: existential Taiwan risk, Apple concentration, and a High-NA deferral that reads negatively for ASML’s premium product. Watch: the 2027 capex guide and any change in the High-NA stance.
Intel (INTC). The High-NA volume swing. Bull: a foundry turnaround that pulls through High-NA orders. Bear: foundry still loss-making and execution unproven; do not treat the 5-percent-share case as a base case. Watch: 18A and 14A milestones and foundry losses.
AMAT, LRCX, KLAC. The WFE-cycle read. Bull: broad toll, service annuity, and process-control moat respectively. Bear: all three carry the same 2027-2028 air-pocket risk as ASML, at 43-to-57-times multiples, without ASML’s monopoly. Watch: the same hyperscaler-capex growth rate that governs ASML.
A memory name (Micron / SK Hynix). The capex-cycle signal. Bull: HBM sold out, capex rising. Bear: memory is the most cyclical link and turns first. Watch: HBM pricing and memory-maker capex revisions.
Risk controls
The honest risk paragraph. This is a deeply cyclical business at a full multiple, and the two combine badly: at about 49 times forward, near a record high, above the consensus target, with the monopoly premium already compressed to zero, there is little valuation cushion if the cycle wobbles. Customer and geographic concentration is extreme and not diversifiable in the near term: one customer is roughly a quarter of revenue, the top two are 38 percent, and the demand base is Taiwan-centric, so a Taiwan event or a TSMC stumble propagates directly to bookings with nothing to absorb it. The supply side is concentrated too, with Zeiss optics output as the single hard ceiling on EUV units. China is a real overhang, with revenue already cut toward 20 percent and a proposed US law that could threaten even the installed-base service revenue, and the company has removed the bookings metric that used to give early warning. There is currency exposure: euro-reported earnings against a US-dollar ADR. And one legally sensitive allegation sits in the background, an alleged EUV-component diversion to China, which ASML denies and which is not established as fact; it should not be treated as a basis for any view. What would change the read: the multiple de-rating toward its 37 times median without an earnings cut would improve it, while a MATCH-Act passage with the service ban plus a confirmed 2028 air-pocket would worsen it.
Methodology, sourcing, and data-quality flags
This piece draws on parallel research streams: the value chain and money flow, the SEC filings (the 20-F and 6-K), market action and valuation, sentiment and OSINT, the macro and micro economics, and a forward bull/base/bear outlook, with an independent verification pass and an adversarial skeptic pass. The source hierarchy runs from primary (ASML’s own filings, press releases, and Investor Day model) to analyst houses (Bank of America, JPMorgan, TrendForce, Allianz Trade) to reputable trade press to explicit estimates. Of 235 load-bearing claims, 154 were verified against at least two sources, 8 are disputed and shown as ranges, and 73 could not be lifted past a single source and are hedged or attributed rather than stated as fact.
The five-factor read, in plain prose.
Valuation: full to stretched. Forward P/E around 49 times (disputed across vendors at 37 to 52 times), trailing 63 times against a roughly 37.6 times own-history median, price to free cash flow about 60 times against a 41 times median, and the stock about 8 percent above the consensus mean target near the top of its 52-week range. It is cheaper than Lam and KLA on forward earnings, but the historic monopoly premium is gone; the market has stopped paying up for the moat. Dear on its own history.
Growth: strong and structurally underwritten. FY2025 revenue up 15.6 percent, EUV up 39 percent, service up 26 percent, record Q4 bookings of EUR 13.2 billion, a backlog of EUR 38.8 billion that more than covers the 2026 guide, the EUR 44-to-60-billion 2030 model, and the AI layer-count tailwind, tempered by the forecast 2027-2028 growth deceleration and the loss of the bookings disclosure.
Quality: exceptional. A 100 percent EUV monopoly and more than 90 percent of immersion DUV, three single-source chokepoints inside the chokepoint, 52.8 percent gross and 36.9 percent operating margins, EUR 12.3 billion of free cash flow, about EUR 8.9 billion of net cash, and a compounding counter-cyclical service annuity. Arguably the best business in the coverage universe.
Risk: real and concentrated. China cut to a guided 20 percent with a proposed service-ban bill (Bank of America’s worst case is a 14-to-15 percent revenue hit, an attributed scenario), extreme customer concentration (top customer 23.9 percent, top two 38 percent, Taiwan-centric), the 2028 air-pocket landing on a down-chain lag, the discontinued bookings disclosure, and a high beta with a 35 percent single-event drawdown on record. One denied, legally sensitive allegation sits unestablished in the background.
Momentum and sentiment: mixed, low weight. A strong price trend (up about 116 percent over a year, above all moving averages, RSI around 66) offset by the 98th percentile of the 52-week range, about 21 percent above the 50-day average, and a consensus target that sits below the price. Net roughly neutral.
Overall lean. On balance the read lands at Hold: an exceptional franchise at a full price with genuine China and cyclical risk, where the quality and growth sit squarely against a stretched multiple and a binary regulatory overhang. It would move up toward Buy if the multiple de-rates toward its 37 times median without an earnings cut, or if the China and MATCH risk resolves benign. It would move down toward Sell if the MATCH service ban passes and a 2028 air-pocket confirms. This is a transparent, rules-based research signal, not personalized advice.
Data-quality flags:
- Several market-action values in the raw ledger had a leading “$1” stripped by a storage artifact; the full figures are used here (the ADR close is $1,929.25, not the truncated string).
- KLA’s market cap was materially stale in one source (about $339 billion); the corrected figure of about $490 billion is used.
- Two 2026 guidance numbers exist and are date-matched: EUR 34 to 39 billion (January) and the raised EUR 36 to 40 billion (April, current).
- China’s revenue share is methodology-sensitive (geographic basis about 36 percent versus system-sales basis about 41 percent for 2024); the geographic basis is used and stated.
- Market-share figures bounce by house and metric (EUV 100 percent; DUV “more than 90 percent” versus other denominators); ranges are used.
- Valuation multiples are definition-sensitive (forward P/E 37 times at one vendor versus about 49 times at others; EV/EBITDA 28 to 49 times depending on EBITDA basis); the basis is stated.
- Forecasts are not facts: the 2030 EUR 44-to-60-billion model, the SEMI and WFE figures, TSMC and hyperscaler capex, and all MATCH Act impact scenarios are forecasts or scenarios, each attributed.
- The MATCH Act is a committee-passed proposal, not enacted law, and the service-ban revenue-impact figures are attributed Bank of America scenarios; the alleged EUV-component diversion to China is a denied allegation, not an established fact, and is flagged unverified.
- Free cash flow and net cash were taken from an aggregator’s rendering of the 20-F; the magnitude is corroborated but the precise line should be cited from the filing.
- Prices, caps, multiples, returns, beta, and short interest are point-in-time (June 22, 2026) and move daily.
- Sentiment figures (Reddit, X, Google Trends, Glassdoor) are soft, attributed signals with wide error bars, never business facts.
Key sources: ASML FY2025 20-F and Q4 2025 / Q1 2026 6-K press releases and investor presentations; ASML 2024 Investor Day 2030 model; StockAnalysis, GuruFocus, MarketBeat, TipRanks, and FinanceCharts for point-in-time market data; TrendForce, Bank of America, JPMorgan, Quilter Cheviot, and Allianz Trade for analyst scenarios; CNBC, Bloomberg, Tom’s Hardware, Digitimes, The Register, and Reuters for trade press; companiesmarketcap and StockAnalysis for peer market caps.
This article is OSINT research for educational purposes only and is not investment advice. Figures are point-in-time as of June 22, 2026 and will change. Semiconductor-equipment is a deeply cyclical and politically exposed business. Verify all figures independently and consult a licensed financial advisor before making any decision.