
Research date: July 1, 2026 | OSINT market research on KLA Corporation (KLAC, Nasdaq), the company that inspects and measures nearly every advanced wafer and photomask made on earth without ever depositing a film, etching a circuit, or printing a pattern itself. KLA sits at the quality-control chokepoint of the wafer fab equipment (WFE) industry: a near-monopoly in process control layered on top of the same AI-driven chipmaking capex cycle that funds Applied Materials, Lam Research, and ASML. This research was completed the day after a broad, sector-wide semiconductor sell-off and roughly three weeks after KLA’s 10-for-1 forward stock split took effect. KLA’s fiscal year ends June 30; FY2025 refers to the year ended June 30, 2025.
Important disclaimer. This article is OSINT research produced for educational and informational purposes only. It is not investment advice, not a solicitation to buy or sell any security, and not a personalized financial recommendation. All figures are point-in-time as of the research date stated and move fast, verify before acting. Past performance is not indicative of future results. Do your own due diligence and consult a qualified financial adviser before making any investment decision.
KLAC-specific risks: WFE cycle risk (the Semiconductor Process Control segment, roughly 90 percent of revenue, amplifies the semiconductor capital-spending cycle and has fallen sharply in prior downturns); China export-control risk (China was 43 percent of revenue in FY2024, fell to 24.3 percent of revenue in the most recent quarter, and the suspended BIS Affiliates Rule reactivates automatically on November 9, 2026 absent further action); customer concentration (a single customer, very likely TSMC based on 10-K disclosure patterns though not named in the filings, has been 17-23 percent of revenue across recent periods, and a second customer, likely a Korean memory maker, added roughly another 11 percent in the most recent quarter); valuation risk (at roughly 56 times forward earnings, the highest multiple in KLA’s mega-cap WFE peer group, the stock leaves little room for a cycle disappointment); the 10-for-1 stock split effective June 12, 2026 means every KLA EPS, dividend, and per-share figure dated before that day must be divided by ten to compare against the current price; and the uncertainty inherent in all forward scenario prices below, which are illustrative estimates derived from stated assumptions and are not price targets.
Where this stock could be in 6 months, 1 year, 3 years, and 5 years
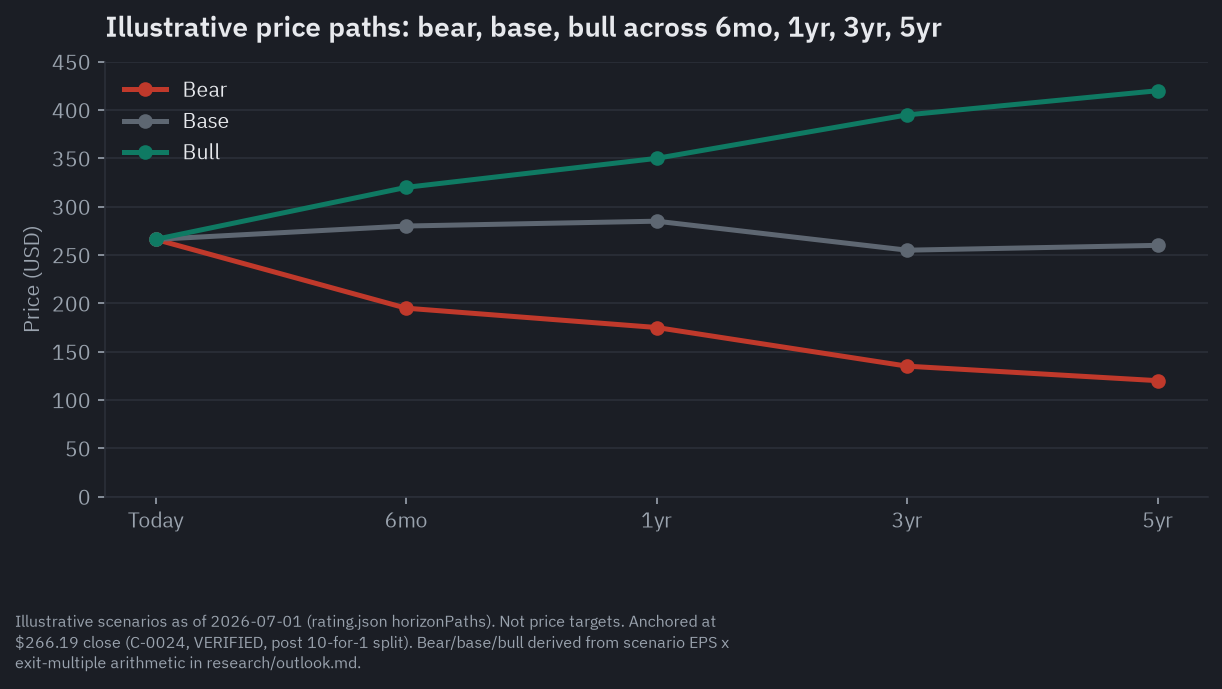
KLA closed at $266.19 on July 1, 2026, down 11.77 percent that single session, one day after setting a fresh all-time high of $307.37. The drop was not about KLA. It landed inside a broad, sector-wide semiconductor sell-off tied to a hawkish repricing of Fed rate expectations, and it hit Applied Materials and Lam Research the same day for the same macro reason. Even after the pullback, KLAC was still up roughly 107 percent for calendar 2026. All dollar ranges below are illustrative estimates derived from stated scenario assumptions, not price targets, and every figure traces to a claim in this research.
6 months (to January 2027). This window is decided by two dates on the calendar rather than by anything abstract: KLA’s Q4 FY2026 earnings report, expected in August 2026 and guided to $3.575 billion in revenue, and November 9, 2026, when the suspended Bureau of Industry and Security “Affiliates Rule” on China exports reactivates automatically unless Washington extends or replaces it. In the base case, Q4 meets guidance and the rule gets extended or resolved, and the stock recovers modestly from the July 1 selloff toward $280 [estimate]. The bear case, near $195 [estimate], needs both a hard Affiliates Rule reactivation and a second round of hawkish rate repricing stacked on top of the one that already happened on July 1, a roughly 27 percent drawdown from today that is well within the range the July 1 single-day move already demonstrated is possible. The bull case, near $320 [estimate], needs a Q4 beat and a clean, permanent resolution of the China rule, retesting the late-June highs. The single event most likely to flip this horizon either way: the November 9 BIS decision is a binary event that moves the stock on its own timetable, independent of how good the earnings are.
1 year (to July 2027). The dominant variable shifts from a policy date to hard cycle data. By mid-2027, KLA will have reported most of fiscal 2027, and the market will know whether the roughly 20 percent growth guided for the Semiconductor Process Control segment in calendar 2026 is holding into the next year, or fading toward the broader WFE market’s high-single-digit pace. In the base case, near $285 [estimate], FY2027 delivers roughly 15 percent revenue growth, the cycle holds together, and the forward multiple fades modestly from 56 times to roughly 50 times as the “unprecedented demand visibility” management described on its last call either proves durable or starts to look like typical late-cycle optimism. The bear case, near $175 [estimate], has WFE deceleration becoming visible in the data and a further China restriction landing on top of it, compressing the multiple below 40 times. The bull case, near $350 [estimate], has the AI-capex super-cycle simply extending with no 2027 slowdown in sight. What flips the read here is the quarter-by-quarter trajectory of hyperscaler capital-spending guidance through the back half of 2026 and into early 2027 earnings season.
3 years (to July 2029). This is the horizon where the central question in the whole thesis, whether KLA’s growth is structurally different from the broader WFE cycle or just a more leveraged version of the same cycle, gets an actual answer. Every prior WFE up-cycle has ended in a digestion phase, and the base case assumes 2027-2028 is when this one does too. In the base case, near $255 [estimate], KLA works through a WFE downturn, comes out the other side with management’s 2030 targets intact but running roughly a year behind schedule, and the forward multiple has settled into the mid-30s as growth slows toward the low teens. The bear case, near $135 [estimate], assumes a severe downcycle stacked with further China losses, echoing the depth of the 2022-2023 WFE trough. The bull case, near $395 [estimate], assumes no meaningful downcycle materializes at all and four straight years of data have validated the structural story, holding a premium multiple in the mid-40s. The tell here is whether KLA’s process-control growth rate keeps outrunning headline WFE growth by roughly double, the spread it has run at for the last several quarters, through an actual slowdown rather than just through an upswing.
5 years (to July 2031). By this point, management’s 2030 targets, revenue of $26 billion plus or minus $2.5 billion, non-GAAP EPS of $84 on a pre-split basis (equivalent to $8.40 post-split), and an operating margin of 45-47 percent, will have been hit, missed, or beaten. In the base case, near $260 [estimate], the targets are roughly met, perhaps a year late, and the forward multiple has normalized from today’s 56 times down to about 28 times. That is the single most important number in this whole outlook: at a 28 times exit multiple, roughly 15 percent [estimate] annual earnings growth over five years is almost exactly offset by roughly 50 percent [estimate] of multiple compression, which is why the base case produces a stock that is, five years out, close to where it started. The stock only compounds meaningfully if the bull case plays out and the quality premium holds near $420 [estimate]; it falls hard if the bear case plays out and the “structural compounder” story is abandoned, near $120 [estimate]. This is the “priced for perfection” mechanics working themselves out in arithmetic, not opinion.
Where the read lands today. On balance, the evidence leans Buy: an exceptional, near-monopoly business whose growth is verified and whose moat is unusually hard to erode, held back one full notch from Strong Buy by a valuation that already prices in a great deal of that quality. The single thing most likely to flip the read is whether KLA’s process-control growth keeps outrunning the broader WFE cycle once that cycle actually turns down, something that has never been tested at KLA’s current scale.
Companion tool
Jump to the interactive dashboard to sort and filter KLA against its process-control and WFE peer set, or download the Excel model to flex the scenarios yourself.
TL;DR
KLA does not build the machines that make a transistor. It builds the machines that check whether the transistor was built correctly, and it does that job for roughly 58 percent of the global process-control market by its own investor-day accounting, a share seven to seven and a half times larger than its nearest broad competitor. That near-monopoly shows up directly in the numbers: a 61 percent gross margin, ten to twelve points above Applied Materials and Lam Research, held in a narrow band for five straight quarters through both accelerating and decelerating growth. The bull case rests on a genuinely structural argument layered on top of the ordinary WFE capital-spending cycle: as transistors shrink and memory stacks grow taller, the number of inspection and metrology steps required per wafer keeps rising independent of how many wafers get started, and China’s attempt to build a domestic alternative remains stuck below 10 percent penetration in metrology versus more than 35 percent in deposition and etch, because KLA’s real moat is decades of proprietary defect-classification data, not just a piece of hardware that can be copied. The bear case is not that the business is bad. It is that the market has already paid for nearly all of that quality: KLAC trades at the highest multiple of any mega-cap WFE name, above even ASML’s outright lithography monopoly, and a stock that can drop 12 percent in a single session on a rates story with zero company-specific news, as it just did on July 1, is a stock where the multiple, not the operating business, is doing most of the work of the price. Layer on a hard, dated risk (the BIS Affiliates Rule reactivates automatically on November 9, 2026 absent further action) and a customer base concentrated enough that a single TSMC capex pause would move the numbers more than at any less-concentrated peer, and the honest read is a strong business at a price that requires the good scenario to keep happening.
Explore it yourself: the interactive dashboard
The proofreader who scraps the book before it’s finished
Picture a 300mm silicon wafer as a manuscript nearly a thousand pages long, printed one microscopic page at a time over roughly four months, where every page depends on every page before it being exactly right. A misprint on page 12 costs almost nothing if it is caught on page 13. It ruins the entire manuscript, and every dollar spent printing pages 14 through 1,000, if it is not caught until the very end. That is the economic logic customers are buying when they buy a KLA tool. A single leading-edge wafer can carry more than $50,000 of cumulative process cost by the time it reaches the end of the line; catching a systematic defect a handful of steps in, instead of fifty steps in, is the difference between a minor scrap cost and a catastrophic one. KLA does not build the presses that print the pages. It builds the machines that read every page as it comes off the press and tells the fab, in real time, whether to keep printing or stop.
That distinction is the whole business. Process control, the collective name for wafer inspection, reticle and photomask inspection, and the metrology tools that measure critical dimensions, is a small slice of the total WFE dollar, something on the order of 10 to 13 percent, next to the much larger lithography, deposition, and etch categories. But it is the step every other step depends on: without inspection and metrology data feeding back into the process, a fab cannot run its yield-improvement loops, cannot qualify a new node, and cannot catch a systematic defect before it propagates through thousands of wafers. KLA’s Semiconductor Process Control segment alone generated $10.947 billion of the company’s $12.156 billion in fiscal 2025 revenue, roughly 90 percent of the total, with the remainder split between a specialty-process business serving power and analog chipmakers and a printed-circuit-board inspection business inherited from the 2019 Orbotech acquisition.
How the money flows
flowchart TD
    DEMAND["AI/data-center, HBM, smartphone, PC, auto end demand"]
    CHIP["Chipmakers collect revenue<br/>TSMC, Samsung, Intel, SK Hynix, Micron"]
    CAPEX["Fab capex / WFE budgets<br/>TSMC is KLA's only 10%+ customer, FY2025"]
    WFE["WFE market<br/>Process control ~10-13% of WFE dollar"]
    PC["Process control (KLA's market)<br/>KLA ~50-58% share overall"]
    OPT["Optical wafer inspection<br/>KLA >85% share"]
    MASK["Reticle / photomask inspection<br/>KLA 80%+ share"]
    ACTINIC["Actinic EUV mask inspection<br/>Lasertec (Japan) sole supplier"]
    SYS["KLA systems revenue<br/>Milpitas CA / Ann Arbor MI / Israel (Orbotech)"]
    SUPP["Optics, lasers, precision stages<br/>single/limited-source suppliers"]
    SERVICE["KLA service/software annuity<br/>~22-23% of revenue, 50k+ installed base"]
    PACK["Advanced packaging / HBM process control<br/>~$1B 2026E target, >50% YoY"]
    RETURNS["KLA shareholder returns<br/>Dividends + buybacks from FCF"]
    CHINA["China revenue / BIS export controls<br/>24.3% of Q3 FY2026 revenue, down from ~43% FY2024"]

    DEMAND --> CHIP
    CHIP --> CAPEX
    CAPEX --> WFE
    WFE --> PC
    PC --> OPT
    PC --> MASK
    MASK -.-> ACTINIC
    SUPP --> SYS
    OPT --> SYS
    MASK --> SYS
    SYS --> SERVICE
    SYS --> PACK
    SERVICE --> RETURNS
    PACK --> RETURNS
    CHINA -.-> SYS
The money starts with the same end demand that funds every chipmaking tool vendor: AI data-center accelerators and high-bandwidth memory, smartphones, PCs, autos, and industrial electronics that pull orders through TSMC, Samsung, Intel, SK Hynix, Micron, and the rest of the world’s fabs. Those chipmakers convert a slice of that revenue into fab capital expenditure, and a slice of that capex, the wafer fab equipment budget, buys the tools that build and check the chip. KLA does not sell the tools that build the transistor; that is ASML’s lithography and Applied Materials’ and Lam Research’s deposition and etch. KLA sells the tools that check the work.
Once a KLA tool ships and is qualified inside a fab, it stops being a one-time sale and becomes an annuity. KLA’s installed base runs over 50,000 systems, and roughly 22 to 23 percent of total revenue now comes from services, calibration, spare parts, software, and upgrades sold against that base, described by the company as largely recurring and subscription-like, with more than 80 percent of service revenue under multi-year contracts. The newest growth line layered on top of the traditional foundry, logic, and memory order book is advanced packaging: KLA’s process-control revenue tied to advanced-packaging steps like through-silicon-via inspection and hybrid-bonding metrology is on track to roughly double from $635 million in calendar 2025 to approximately $1 billion in 2026, riding the same HBM stacking boom that is reshaping memory-maker capex everywhere to feed AI accelerators from customers like Nvidia. Underneath all of it sits a further layer of suppliers, precision optics, lasers and light sources, and precision motion stages, several of which KLA discloses as available only from single or limited-source vendors, the one place in this chain where KLA is a customer rather than a toll-taker.
The process-control field guide
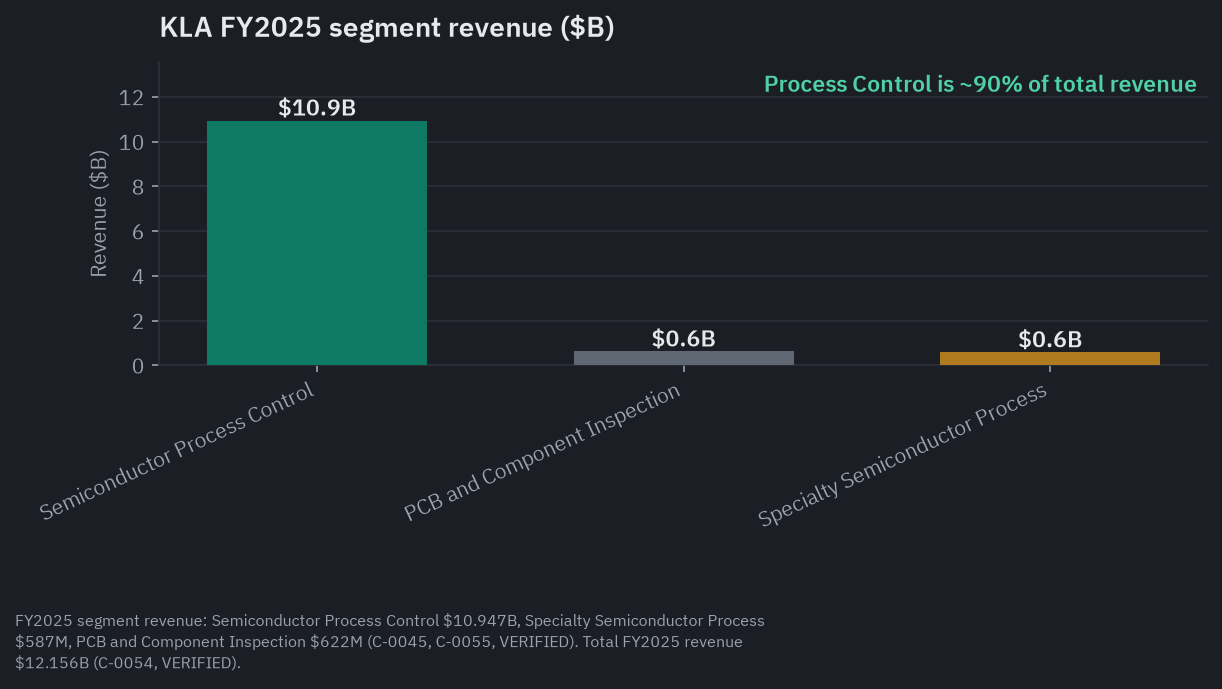
Semiconductor Process Control is KLA in one sentence: wafer inspection, e-beam and optical metrology, reticle and photomask inspection, and the defect-review software that turns raw images into an actionable yield signal. It generated $10.947 billion of FY2025 revenue, roughly 90 percent of the total, and it is where essentially all of the company’s economic value sits.
Wafer Inspection is the largest single product line inside that segment, $6.199 billion in FY2025, 51 percent of total company revenue, growing 16 percent year over year in the most recent quarter. This is where KLA’s dominance is most complete: independent trackers put its share of optical patterned-wafer inspection above 85 percent.
Patterning, roughly 18 percent of revenue, covers the overlay and critical-dimension metrology tools that make sure each new layer lines up with the one below it to sub-nanometer tolerances, a job that gets harder every time a node shrinks.
Reticle and photomask inspection checks the master templates used to pattern every wafer, a business where KLA holds more than 80 percent share, with one carve-out: Lasertec of Japan is the sole commercial supplier of actinic-wavelength EUV mask inspection, the one corner of the mask business where KLA does not compete at the same wavelength it uses everywhere else.
Specialty Semiconductor Process, $587 million in FY2025, sells ion-implant-adjacent deposition and etch tools to power, analog, and compound-semiconductor customers, a more fragmented, more price-competitive market than the core franchise.
PCB and Component Inspection, $622 million in FY2025, came into KLA through the 2019 Orbotech acquisition and serves printed-circuit-board and flat-panel-display makers. It is the weakest link in the portfolio: it absorbed a $239.1 million goodwill and intangible impairment in FY2025, and KLA formally exited the adjacent Display-panel equipment business in March 2024, continuing only to service what is already installed.
Services, roughly 22 to 23 percent of total revenue and embedded across all three reporting segments rather than broken out on its own, is the growing annuity layer. Management’s 2030 target roughly doubles this line to nearly $6 billion, a 13 to 15 percent annual growth rate, with more than 80 percent under multi-year contracts.
Who wins where
KLA’s process-control near-monopoly sits inside a competitive map with four distinct tiers. At the top is KLA itself, holding roughly 58 percent share of the overall process-control market by its own investor-day framing (a figure attributed to unnamed third-party data rather than a named analyst house, worth reading with that caveat, though independent trackers corroborate a broadly similar high-50s to low-60s percent range). The nearest broad competitor, Applied Materials’ metrology unit, holds an estimated 8 to 10 percent and has reportedly been losing share even as KLA gains.
Below that sits a tier of focused specialists that compete hard in specific niches without threatening KLA’s overall position: Onto Innovation in optical critical-dimension metrology and materials-composition analysis, and Camtek in advanced-packaging 3D inspection, both fast-growing but a fraction of KLA’s scale, roughly one-twelfth and one-twenty-fourth of KLA’s FY2025 revenue respectively.
A third tier is the one genuine chokepoint KLA does not own: Lasertec of Japan, the exclusive commercial supplier of actinic-wavelength EUV mask inspection systems. It is a small, specialized adjacent market, but as EUV and High-NA EUV masks become more central to leading-edge logic, it is the one corner of the mask and inspection stack where KLA is a challenger rather than the incumbent.
The fourth tier is the emerging one to watch rather than react to today: Chinese domestic metrology vendors, Skyverse Technology and CXMT’s Fei Ce optical-inspection unit among them, building toward a China market that the government has explicitly mandated be more self-sufficient. They remain small and concentrated at mature nodes, and metrology is the least-localized major WFE category in China, below 10 percent domestic share versus more than 35 percent in etch and deposition, because the mechanism protecting KLA’s share is a data problem as much as a hardware problem.
Company by company: who’s who
KLA Corporation (KLAC, Nasdaq) is the process-control leader profiled throughout this piece. Roughly 90 percent of its $12.156 billion in FY2025 revenue comes from Semiconductor Process Control, the segment that inspects wafers, reticles, and photomasks for defects and measures critical dimensions at sub-nanometer tolerances. Its most recent quarter (Q3 FY2026, ended March 31, 2026) delivered $3.415 billion in revenue, up 11 percent year over year, with China falling to 24.3 percent of the quarterly total even as Korea, driven by HBM and DRAM capacity investment, grew 80 percent. Bull: every advanced node needs more inspection steps as stochastic EUV defects and 3D structures multiply failure modes, so KLA’s revenue tends to grow faster than headline WFE, a structural, non-discretionary toll on the industry’s most expensive nodes. Bear: at roughly 56 times forward earnings and with a still-meaningful share of revenue tied to a China market where export-control risk is live and dated, KLAC prices in a great deal of good news; a WFE digestion cycle, memory- or China-driven, hits a company this profitable disproportionately hard on the multiple.
Applied Materials, Inc. (AMAT, Nasdaq) is the broadest wafer fab equipment vendor outside lithography, roughly $516.8 billion in market capitalization as of July 1, 2026, selling deposition, etch, chemical-mechanical planarization, and ion-implant tools plus a large recurring services annuity (Applied Global Services). It reported record Q2 FY2026 revenue of $7.91 billion, up 11 percent year over year, with non-GAAP gross margin crossing 50 percent for the first time in company history. Bull: three simultaneous technology transitions, gate-all-around transistors, backside power delivery, and HBM-driven advanced packaging, lift dollar content per wafer regardless of unit WFE growth, and the AGS annuity cushions any downturn. Bear: China revenue has fallen from roughly 37 percent of revenue in FY2024 toward the mid-20s percent as export controls tighten, and at roughly 44 times forward earnings the multiple already prices in a long upcycle. Applied Materials competes with KLA only in a narrow metrology overlap, so the two names are closer to complements than rivals across most of the value chain.
Lam Research Corporation (LRCX, Nasdaq), roughly $489.3 billion in market cap, is the dominant player in high-aspect-ratio etch for NAND and deep contacts, with FY2025 (fiscal year ended June 2025) revenue of $18.44 billion, up 23.7 percent year over year. Bull: NAND layer-count growth and HBM through-silicon-via etch intensity are structural, not cyclical, tailwinds that are hard to displace with a competing tool architecture. Bear: Lam is more NAND-concentrated than Applied Materials or KLA, so NAND inventory-digestion periods hit its order book harder than its more diversified peers.
ASML Holding N.V. (ASML, Nasdaq ADR / Euronext Amsterdam), at roughly $719.5 billion the largest market cap in this peer group, is the sole global manufacturer of EUV lithography scanners, a genuine, outright monopoly rather than a near-monopoly. Q1 2026 revenue was 8.8 billion euros with a 53.0 percent gross margin. Bull: no advanced logic or memory chip below roughly the 7-nanometer-class node can be made without an ASML EUV scanner, and High-NA EUV systems extend the pricing roadmap into the next decade. Bear: China DUV sales have been declining as export controls tighten, and ASML’s bookings disclosure has gotten less granular over time, reducing investor visibility into the order pipeline. ASML is the one name in this group whose multiple, 47.48 times forward earnings, is genuinely lower than KLA’s despite holding a cleaner monopoly, a valuation contrast worth sitting with.
Onto Innovation Inc. (ONTO, NYSE), roughly $17.5 billion in market cap, the smallest US-listed name in this set, is a focused specialty-metrology and advanced-packaging inspection vendor. Q1 2026 revenue was a record $292 million, but GAAP net income fell to $33.8 million from $64.1 million a year earlier despite the revenue record, an unexplained margin pressure worth watching. Bull: advanced-packaging and HBM-adjacent metrology demand is growing faster than the broader WFE market, and Onto is a leading specialist in that niche. Bear: GAAP earnings falling on record revenue is a margin warning sign, and a trailing P/E above 160 times reflects depressed GAAP earnings that make the stock hard to value on trailing numbers alone.
Camtek Ltd. (CAMT, Nasdaq), roughly $7.2 to $8.6 billion in market cap (the figure moved fast this year; shares are up roughly two-thirds year-to-date in 2026), is a small, Israel-based specialist in automated optical and AI-based inspection for advanced packaging and HBM assembly. It secured more than $105 million in AI-related multi-system orders in its most recent quarter, including a $50 million-plus order for HBM inspection systems delivering in 2027. Bull: a direct beneficiary of HBM and advanced-packaging capacity growth, with record bookings pointing to accelerating second-half 2026 revenue. Bear: small-cap, thin-float dynamics show up in the numbers, short interest near 10 percent of shares outstanding is the highest in this group, and the stock trades at more than 150 times trailing earnings.
Tokyo Electron Limited (TOELY / 8035.T), roughly $225 to $235 billion in market cap depending on the yen exchange rate used, is the largest Japan-based WFE vendor, dominant in coater-developer systems that pair directly with ASML’s lithography scanners, plus deposition, etch, and cleaning tools. FY2025 (fiscal year ended March 2025) net sales grew 32.8 percent year over year. Bull: full exposure to the same AI-driven leading-edge logic and memory capex cycle as its US peers, with a coater-developer franchise that has no close substitute. Bear: only accessible to US retail investors through a thin, unsponsored OTC ADR, adding a liquidity and access friction the other names in this group do not carry.
What the filings say
Income statement: a record year, and a quarter that is still accelerating faster than the market
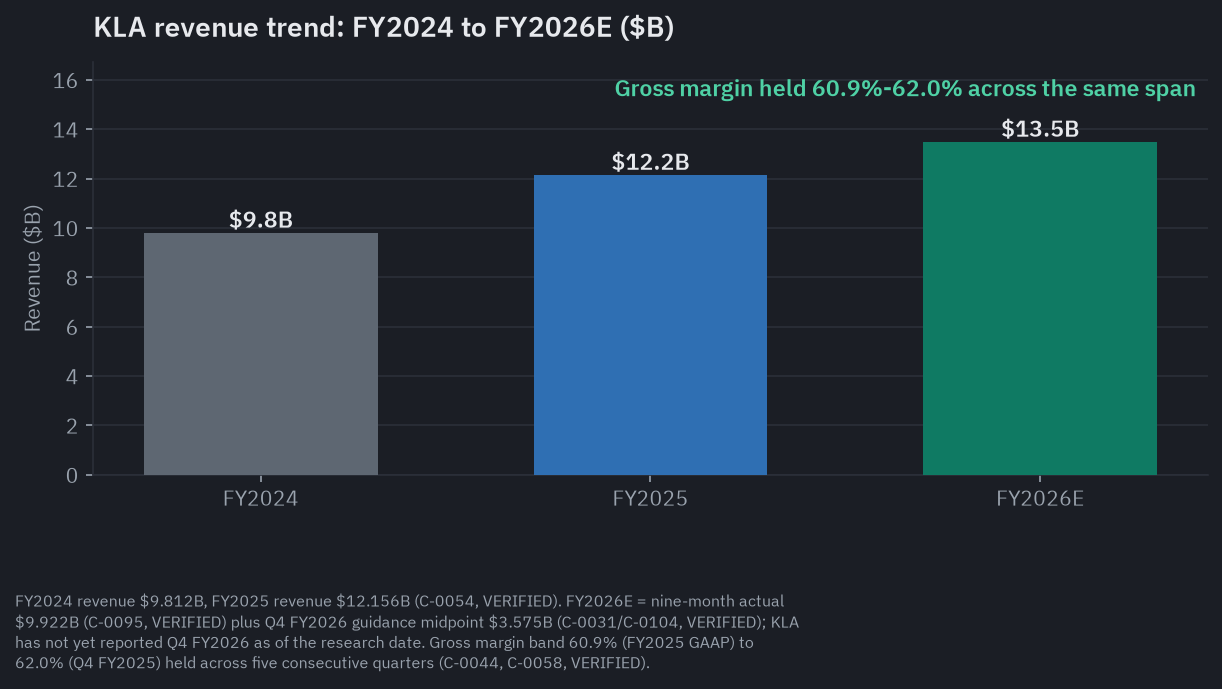
Full fiscal year 2025 (ended June 30, 2025) total revenue was $12.156 billion, up 24 percent from $9.812 billion in FY2024, a record. GAAP gross margin was 60.9 percent, GAAP net income was $4.062 billion, and GAAP diluted EPS was $30.37 on a pre-split basis (roughly $3.04 per share on today’s post-split count). Non-GAAP diluted EPS was $33.28 pre-split. R&D spending was $1.360 billion, roughly 11 percent of revenue, up from $1.279 billion in FY2024.
The most recent quarter, Q3 FY2026 (ended March 31, 2026), delivered $3.415 billion in revenue, up 11 percent year over year, with GAAP gross margin holding at roughly 61.1 percent, essentially unchanged from FY2025’s 60.9 percent. GAAP net income was $1.201 billion, GAAP diluted EPS was $9.12 pre-split (about $0.91 post-split), and non-GAAP diluted EPS was $9.40 pre-split. Nine-month FY2026 revenue reached $9.922 billion versus $8.981 billion in the prior-year period, up 10 percent, with nine-month R&D spending of $1.133 billion.
Q4 FY2026 guidance, issued alongside the April 29, 2026 earnings call, calls for revenue of $3.575 billion plus or minus $200 million, GAAP diluted EPS of $9.66 plus or minus $1.00 pre-split, non-GAAP diluted EPS of $9.87 plus or minus $1.00 pre-split, and GAAP gross margin of roughly 60.72 percent plus or minus one point. Management’s full calendar-2026 outlook, given on the same call, is for high-teens percentage revenue growth companywide, with the Semiconductor Process Control systems business specifically growing more than 20 percent, well ahead of the roughly 9 percent growth SEMI forecasts for the broader WFE market in the same year. As of this research date, KLA had not yet reported actual Q4 FY2026 results.
The gross-margin story is worth sitting with because of what it is not. A margin that holds in a narrow 61 to 62 percent band across five consecutive quarters spanning both accelerating (FY2025’s plus-24-percent revenue growth) and moderating (Q3 FY2026’s plus-11-percent) periods does not look like a business riding a temporary demand spike into a margin peak. It looks like a structural margin floor, held even while management flags DRAM chip-cost inflation, used in KLA’s own inspection-tool electronics, as a transitory drag through calendar 2026, quantified in secondary reporting at roughly 100 basis points. Absorbing a real input-cost headwind without giving up margin is itself evidence of pricing power; a price-taker in a competitive market would see that cost inflation flow straight through to the bottom line.
Segments and geography: where the growth and the risk both concentrate
Within Semiconductor Process Control, foundry and logic applications represent roughly 60 percent of system revenue and memory roughly 40 percent, with SK Hynix and Micron cited as the leading memory customers (a sub-segment split sourced to press reporting rather than the primary filings, worth treating as directional). Within the most recent quarter, the geographic story diverged sharply by end market: Korea revenue, tracking HBM and DRAM capacity investment, grew 80 percent year over year to $681.1 million, 19.9 percent of the quarter’s total, while Taiwan revenue fell 12 percent year over year, a partial rotation away from foundry and logic capex timing and toward memory in the same three months.
Customer concentration is real and disclosed. For fiscal 2025, one customer (strongly implied by context, though not named in the filings, to be TSMC) accounted for roughly 19 percent of full-year revenue. In the nine months ended March 31, 2026, that customer was roughly 17 percent of the year-to-date total, and in the March quarter alone two customers each accounted for approximately 19 percent and 11 percent of total revenue, versus one customer at 23 percent in the year-ago quarter, a modest broadening within the quarter but still a business where two buyers can represent close to a third of the numbers in a given period. Remaining performance obligations, a backlog proxy, were $7.86 billion as of June 30, 2025, down from $9.83 billion a year earlier, a 20 percent decline even as revenue grew 24 percent over the same stretch. Management’s explanation is that supply-chain lead times have normalized, letting customers order closer to need rather than stockpiling backlog years ahead, which is plausible given revenue accelerated at the same time. It is also exactly the framing every company gives a shrinking backlog before a downturn becomes visible in headline revenue, and the filings do not disaggregate which explanation dominates.
China has gone from KLA’s largest single country market to a shrinking but still material one: 43 percent of revenue in FY2024, 33 percent in FY2025, and 24.3 percent in the most recent single quarter (31.2 percent on a nine-month FY2026-to-date basis, a reminder that the exact figure depends heavily on which measurement window is used). Even as its share of the mix falls, China revenue was still up 5 percent year over year in dollar terms in the most recent quarter, evidence that legacy-node demand there keeps growing in absolute terms even as it shrinks as a share of a faster-growing whole. Two overlapping BIS actions define the near-term risk: the Affiliates Rule, which extends export controls to any entity 50 percent or more owned by an already Entity-Listed Chinese company, was suspended for one year effective November 10, 2025 as part of a broader US-China trade truce and reactivates automatically on November 9, 2026 absent further action; and a separate April 2026 Commerce Department order requiring KLA, Applied Materials, and Lam Research to halt certain shipments to Hua Hong Semiconductor’s 28 and 22-nanometer fabs, a restriction on its own schedule that does not lapse with the Affiliates Rule.
Balance sheet, cash flow, and capital returns
At FY2025 year-end, KLA carried cash and equivalents of $2.079 billion, marketable securities of $2.416 billion, and total debt of $5.884 billion, meaningfully more leverage than a typical high-margin software business but comfortably serviced by its free cash flow. Full FY2025 operating cash flow was $4.082 billion against capital expenditure of just $335 million, roughly 3 percent of revenue, an asset-light footprint relative to peers who own large demo and qualification facilities. Free cash flow was $3.747 billion, with $2.150 billion returned via buybacks and $905 million via dividends. In Q3 FY2026, operating cash flow was $707.5 million and free cash flow was $622.3 million, with trailing-twelve-month figures of $4.40 billion operating cash flow and $4.01 billion free cash flow.
KLA’s capital-allocation framework, restated at the March 12, 2026 Investor Day, prioritizes R&D first, then selective capacity investment, then targeted acquisitions, then returning more than 90 percent of free cash flow to shareholders, a target raised from roughly 85 percent at that same event. The board approved a fresh $7.0 billion buyback authorization at the same Investor Day, bringing total remaining capacity to roughly $10.3 billion, and raised the quarterly dividend 21 percent to $2.30 per share on a pre-split basis ($0.23 per share post-split), the 17th consecutive annual increase and roughly a 16 percent dividend growth rate since 2006.
The 10-for-1 split and the 2030 targets
The board approved a 10-for-1 forward stock split on May 7, 2026. Shareholders of record as of June 4, 2026 received nine additional shares for each share held; the stock began trading split-adjusted on June 12, 2026. Management framed the move as improving accessibility for individual investors after a run of outsized price appreciation that had pushed the pre-split stock into the $2,000-plus range, explicitly noting the split changes neither aggregate market capitalization nor any shareholder’s proportional ownership.
At the same March 12, 2026 Investor Day, KLA set 2030 financial targets: revenue of $26 billion plus or minus $2.5 billion, operating margin of 45 to 47 percent, and non-GAAP diluted EPS of $84 plus or minus $8 on a pre-split basis (equivalent to $8.40 post-split), implying roughly a 13 to 17 percent revenue growth rate sustained through 2030. The model underpinning that target assumes semiconductor-industry revenue growing at an 11 percent annual rate from 2025 to 2030, WFE spending growing a point faster to reach roughly $215 billion by 2030, and process control’s own share of WFE spending rising from approximately 7.4 percent in 2025 to approximately 9 percent by 2030 as defect budgets tighten at advanced nodes and in advanced packaging. These are company-set targets, not GAAP-audited figures or independently verified forecasts, and a 13 to 17 percent revenue growth rate sustained for five straight years has essentially no precedent at any WFE-peer company across a full cycle, including KLA’s own history.
Ownership and risk factors
Institutional ownership is very high, roughly 89.9 to 90 percent of shares outstanding, with insiders holding roughly 5.9 percent. BlackRock is the single largest institutional holder at roughly 8.5 percent; company co-founder Kenneth Levy is the largest individual holder at roughly 4.0 percent on a pre-split basis. No unusual insider selling patterns beyond what is discussed in the sentiment section below or activist-stake filings were identified. KLA’s 10-K names its principal competitors as Applied Materials, ASML Holding, Hitachi High-Tech, Onto Innovation, and Lasertec, and its risk-factor language emphasizes, in the order the quantitative disclosures suggest they matter, US export-control and China-market risk; customer concentration; the cyclicality of semiconductor capital spending; supply-chain and single-source component risk for the precision optics, lasers, and motion-control subsystems inside KLA’s own tools; and intellectual-property and litigation risk typical of a company selling into a small number of very large, sophisticated customers.
What the market is paying
The July 1 sell-off, in context
KLAC closed at $266.19 on July 1, 2026, down 11.77 percent that single session, on a split-adjusted basis. That move needs the surrounding week for context: it happened one day after the stock set a new all-time high of $307.37, and it was part of a broad, sector-wide profit-taking sell-off across semiconductor-equipment and chip names generally. The VanEck Semiconductor ETF had gained roughly 82 percent in the first half of 2026 alone, and the move down on July 1 coincided with a hawkish repricing of Fed policy expectations tied to speculation about a prospective new Fed chair, a repricing that hit high-multiple, AI-capex-linked names across the board, not KLA specifically. Applied Materials and Lam Research sold off in the same session for the same reason. Even after the drop, KLAC was still up roughly 107 percent for calendar 2026. The 52-week range on a split-adjusted basis runs from $83.22 to $307.37, meaning the current price sits well above the midpoint of that range despite the one-day drop, a reminder of how much of the range’s width was built in the second half of the trailing year rather than spread evenly across it.
Anyone comparing KLAC price history across the split date needs to divide any pre-June-12-2026 quote by ten; several data aggregators pulled during this research still showed clearly stale, split-unadjusted figures, including one “current price” near $808 and a 52-week low near $680, both pre-split artifacts excluded from every figure used here.
Valuation against the peer group
| Company | Ticker | Mkt cap (approx, 2026-07-01) | Trailing P/E | Forward P/E | P/S | EV/EBITDA | Short int. |
|---|---|---|---|---|---|---|---|
| KLA Corporation | KLAC | ~$347.7B | 75.35 | 55.87 | 26.55 | 59.64 | 3.12% |
| Applied Materials | AMAT | ~$516.8B | 61.22 | 44.06 | 17.81 | 55.61 | 2.77% |
| Lam Research | LRCX | ~$489.3B | 73.90 | 51.95 | 22.57 | 62.22 | 2.39% |
| ASML Holding | ASML | ~$719.5B | 62.38 | 47.48 | 18.54 | 48.71 | 0.43% |
| Onto Innovation | ONTO | ~$17.5B | 163.43* | 43.61 | 16.96 | 63.03 | 5.17% |
| Camtek | CAMT | ~$7.2-8.6B | 156.63* | 39.75 | 14.34 | 49.07 | 9.98% |
*Onto’s and Camtek’s trailing P/E ratios are inflated by soft or declining GAAP net income relative to a rapidly appreciating share price; the forward P/E is the more useful comparison for both.
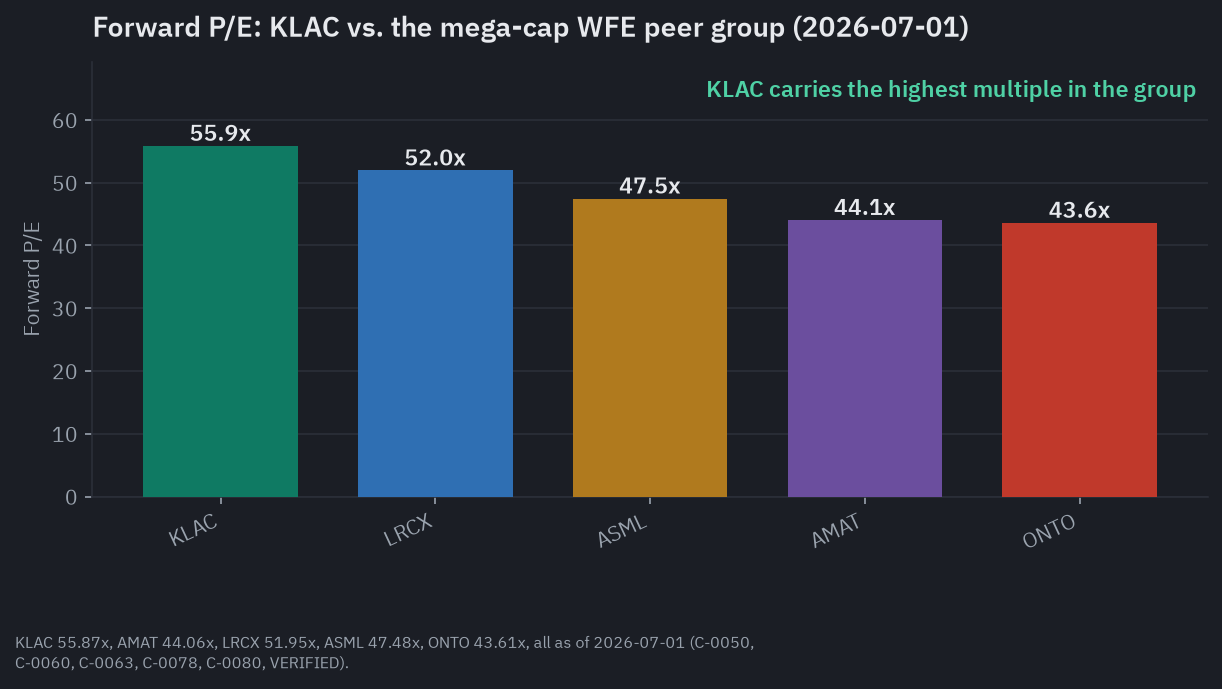
KLA trades at the highest trailing P/E and EV/EBITDA of the three US mega-cap WFE names, and its forward multiple roughly matches ASML’s despite ASML holding an outright lithography monopoly with essentially no near-term competitive threat, versus KLA’s process-control business, which faces at least nominal competition from Applied Materials’ metrology unit, Onto Innovation, Camtek, and Hitachi High-Tech even though KLA’s own share estimate dwarfs any single one of them. The premium is a bet that process-control revenue keeps growing faster than headline WFE, KLA’s own 2030 model assumes process control rises from 7.4 percent to 9 percent of total WFE spend, and that the roughly 90 percent recurring or subscription-like revenue mix once services and long-cycle contracts are combined makes KLA’s earnings stream more resilient through a downturn than a pure capital-equipment seller’s. It is a real bull case. At 56 times forward earnings it is also a fully priced one. KLA’s price-to-sales ratio of 26.55 is roughly 30 to 45 percent above Applied Materials’ and Lam Research’s and roughly 40 percent above ASML’s, the single cleanest number for “the market is paying up for KLA’s superior gross margin and recurring-revenue mix relative to every other name in this group.”
Short interest across the group is low in absolute terms, nothing above 10 percent of float, but there is a clear pattern: the two smallest-cap, most niche names, Onto at 5.17 percent and Camtek at 9.98 percent, carry meaningfully higher short interest than the four mega-caps, all under 3.2 percent, consistent with smaller-cap process-control names being treated as higher-beta, harder-to-value bets on a narrower slice of the cycle.
Sell-side consensus and the WFE backdrop
KLA carries a consensus Buy rating from sell-side analysts: roughly 29 analysts cover the stock, with a tally showing approximately 30 percent Strong Buy, 45 percent Buy, and 25 percent Hold, and zero Sell ratings. Consensus price targets are genuinely hard to pin down cleanly in the days immediately following a 10-for-1 split; different data trackers showed targets ranging from the low $200s to figures north of $1,500 per share in the days around this research, a strong signal that at least some trackers had not yet fully split-adjusted every individual analyst target. The consensus rating is a more reliable read right now than any single consensus price-target number. Individual analyst moves in late June, after the split and the earnings beat, are cleaner data points: BofA raised its target to $317 from $210, Cantor Fitzgerald to $325 from $250, Wells Fargo to $305 from $210, and Citi to $290 from $206.40, all maintaining Buy or Overweight ratings. Susquehanna was the lone holdout, moving to a Neutral rating with a $275 target even while raising its own dollar figure, a signal that at least one house views the stock as fairly valued rather than still cheap even after the re-rating.
The sector backdrop supports the growth case, if not the multiple. SEMI’s year-end 2025 forecast put global WFE billings at $135.1 billion in 2025, up 15 percent from $117.1 billion in 2024, and forecasts total semiconductor equipment sales reaching roughly $145 billion in 2026 and a record $156 billion in 2027. On its own April 29, 2026 earnings call, KLA management raised its calendar-2026 WFE market outlook to “above $140 billion,” up from a prior $135-140 billion range, and said 2027 WFE growth is expected to exceed 2026 growth given what management described as unprecedented demand visibility, a genuinely bullish, company-specific data point worth weighing against the fact that the stock dropped on macro and rate repricing, not on any change in KLA’s own demand commentary, which was getting more optimistic, not less, at its last earnings call.
What the crowd is saying
The dominant news arc through this research window runs in five acts. First, KLA closed fiscal 2025 with a record year even as China revenue fell sharply on tightening export controls, a cautious note inside an otherwise strong report. Second, the March 12, 2026 Investor Day functioned as the narrative turning point for the entire period: KLA more than doubled its prior 2026 EPS target in setting new 2030 targets, disclosed a process-control share of roughly 58 percent, and announced a new buyback authorization and a dividend increase, after which coverage consistently framed KLA as “the toll booth of the AI chip build-out.” Third, the April 29, 2026 earnings beat and raised WFE outlook, paired with CEO Rick Wallace’s widely repeated line, “I’ve not seen this level of customer urgency in my entire career,” reinforced the bull narrative. Fourth, the 10-for-1 split, announced May 7 and effective June 12, generated its own short-term attention independent of fundamentals, with at least one widely circulated piece framing the pre-split rally partly as a “short squeeze,” a characterization that sits in tension with the actual short-interest data: 3.12 percent of float is a low, unremarkable level for a large-cap semiconductor name, not the elevated level typically associated with a genuine squeeze setup, and that framing should be treated with real skepticism. Fifth, the July 1 reversal, a sharp but so far single-day cooling event tied to broad sector and rate dynamics rather than anything specific to KLA.
The retail-accessibility argument behind the split is a real structural fact, not just a sentiment story: a stock that traded in the $2,000 to $3,000-plus range pre-split mechanically excludes many retail brokerage account sizes and fractional-share-unfriendly platforms from meaningful position sizes, and post-split, at roughly $266 to $282 a share, KLAC is priced comparably to many widely held retail names. It is reasonable to expect retail trading attention to have structurally increased following the June 12 effective date, though no verified retail-specific trading-volume figure was located to quantify the magnitude in this research pass.
KLA insiders sold approximately $19.7 million of stock over the trailing three months with zero recorded insider buying, led by CEO Richard Wallace’s roughly $9.99 million sale on June 11, 2026, in the window immediately following the split’s record date. That sale was executed under a Rule 10b5-1 trading plan adopted November 19, 2025, roughly seven months before the trade date, a pre-scheduled plan rather than a discretionary decision made near the split, and that context should travel with the figure every time it appears. A uniformly one-directional pattern with zero offsetting buys is still worth naming plainly even when the most likely explanation is benign scheduling rather than opportunistic timing.
KLA carries a 4.0-out-of-5 employee rating on Glassdoor across 1,981 reviews, with 78 percent of reviewers saying they would recommend working there, a self-selected but reasonably sized sample that gives more weight to the consistency of that rating over time than a thinly reviewed company would carry. No coordinated-manipulation evidence, unusual hiring-freeze or layoff news, or activist-stake activity was identified in this research window; the operational signal, raised long-term targets, a new buyback authorization, and a dividend increase, is consistent with management confidence in a sustained cycle rather than defensive positioning.
The clearest place where the crowd runs ahead of the filings is treating KLA’s 2030 target model as closer to a forecast than a management aspiration, and treating “China de-risked at roughly 25 percent of revenue” as a settled fact rather than a run rate that assumes the Affiliates Rule suspension holds. The clearest place where the crowd lags the filings is the declining remaining-performance-obligations figure, which receives essentially no attention in retail-facing or sell-side commentary despite being a plausible early indicator worth tracking, and the customer-concentration risk, which is rarely discussed as a standalone factor in the bullish “picks and shovels” framing even though it makes KLA’s revenue more concentrated in its largest customers than Applied Materials’ more diversified base.
Cyclical engine, structural tailwind: KLA’s durability
KLA’s demand has two layers that move on different clocks, and conflating them is the single easiest way to get this thesis wrong. The volume layer, how many wafers get started and how fast fabs build capacity, is purely cyclical and follows the same WFE cycle that funds Applied Materials and Lam Research. The intensity layer, how much process-control spend gets attached to each wafer or each dollar of WFE, is a separate and genuinely more structural driver. KLA’s own long-term model assumes process control’s share of total WFE spend rises from roughly 7.4 percent in 2025 to roughly 9 percent by 2030, for a specific physical reason: as transistor and interconnect geometries shrink, as memory architectures like HBM add dozens of extra manufacturing steps versus standard DRAM, and as advanced packaging moves front-end-like defect requirements into what used to be a low-precision back-end process, defect budgets tighten and inspection steps per wafer multiply. That is corroborated in real time: KLA’s Semiconductor Process Control segment is guided to grow more than 20 percent in calendar 2026, against a roughly 9 percent broader-WFE growth rate SEMI projects for the same year, more than double the market’s pace.
The moat protecting that intensity tailwind is also unusually resistant to the substitution pattern already visible elsewhere in WFE. China’s domestic-equipment localization has already reached roughly 35 percent or more in etch and deposition categories, but remains below 10 percent in metrology, precisely because KLA’s advantage is decades of accumulated, fab-specific defect-classification data embedded in software and recipes, industry commentary describes it as roughly 30 years of accumulated production data from the world’s top fabs, not just a machine that a competitor could reverse-engineer given enough capital. That is a much harder asset to replicate than a deposition or etch chamber design, and it is the clearest reason China’s own government-mandated push toward domestic equipment has moved so much faster in hardware-defined categories than in this one.
None of that repeals ordinary cyclicality. The most credible trigger for the next downturn is the same one threatening the entire AI-capex-linked WFE complex: the four largest US hyperscalers are guided to roughly $725 billion of combined 2026 capital expenditure, up about 77 percent from roughly $410 billion in 2025, a pace that is not sustainable indefinitely for any spending category tied to corporate free cash flow, and Sequoia Capital has estimated a roughly $600 billion annual gap between what is being spent on AI infrastructure and what AI-attributable revenue currently justifies. If hyperscaler capex growth decelerates sharply in 2027, even to flat rather than negative, the order pipeline that feeds KLA’s process-control segment would slow with a roughly 12-to-18-month lag, and because KLA’s growth has been running at roughly double the broader WFE rate, there is no historical precedent for the intensity tailwind fully insulating that growth rate from a real deceleration; the more defensible reading is that the spread compresses hard in a downturn even if it does not go negative. Add the declining backlog discussed above, the dated China risk sitting inside this article’s own outlook window, and a customer base concentrated enough that TSMC alone can move the quarterly numbers by a magnitude no single relationship at Applied Materials or Lam Research can match, and the honest synthesis is a business with a genuinely structural tailwind riding on top of an ordinary, untested-at-this-scale cycle, not a business that has somehow escaped the cycle altogether. The single best real-time gauge of which story is winning is whether that roughly 2x growth spread over headline WFE holds through an actual slowdown, something that has not yet happened at KLA’s current revenue scale.
The scenarios in detail
The driver tree
Four variables decide KLA’s five-year outcome. Everything in the scenarios below is a different setting on these same four dials.
WFE cycle volume. Total wafer fab equipment spending, currently around $135 billion in 2025 and guided above $140 billion for 2026, is the cyclical volume layer of KLA’s demand. SEMI forecasts $145 billion in 2026 and $156 billion in 2027 for total semiconductor equipment sales, and KLA’s own management expects 2027 WFE growth to exceed 2026’s. Whether that cycle extends through 2028 or turns into a digestion pause is the single largest near-term variable.
Process-control intensity. The structural layer, distinct from volume: KLA’s own model assumes process control’s share of total WFE rises from roughly 7.4 percent in 2025 to roughly 9 percent by 2030. Whether the roughly 2x growth spread over headline WFE holds through a full cycle, something never tested at KLA’s current scale, is the most important structural question in the whole thesis.
China revenue trajectory. China fell from 43 percent of revenue in FY2024 to 33 percent in FY2025 to 24.3 percent in the most recent quarter. The BIS Affiliates Rule reactivates automatically on November 9, 2026 absent further action, and the April 2026 Hua Hong shipment halt shows the restriction pattern migrating to more mature nodes. Total export-control drag is estimated at roughly $300 to $350 million for calendar 2026 by Jefferies. China domestic metrology localization remains below 10 percent, far behind the 35-percent-plus in etch and deposition, giving KLA a longer runway before substitution bites, but the runway is finite.
Valuation multiple. KLAC trades at 75.35 times trailing and 55.87 times forward earnings, the highest in its mega-cap WFE peer group, above Applied Materials at 44 times forward, Lam Research at 52 times, and even ASML at 47.5 times. At this multiple, business execution alone does not guarantee stock appreciation; the premium must be sustained or earnings must grow fast enough to offset compression. The July 1, 2026 -11.77 percent single-day drop demonstrated how quickly a rate or macro repricing can compress a high multiple, independent of any change in the operating business.
Horizon price paths
| Horizon | Bear ($) | Base ($) | Bull ($) | Dominant factor |
|---|---|---|---|---|
| Today | 266.19 | 266.19 | 266.19 | reference price, July 1, 2026 close |
| 6 months | 195 | 280 | 320 | BIS Affiliates Rule date (Nov 9) + Q4 FY2026 earnings |
| 1 year | 175 | 285 | 350 | WFE cycle data for 2027 + FY2027 guidance |
| 3 years | 135 | 255 | 395 | structural intensity vs. cyclical reversion |
| 5 years | 120 | 260 | 420 | durability of moat + multiple normalization |
All levels are estimates anchored on the scenario assumptions below, and none is a price target.
Bull case (illustrative, estimate)
WFE spending grows to $215 billion-plus by 2030, matching management’s own assumption, with the AI capex buildout proving durable and no significant digestion pause, or only a shallow one-quarter dip. Process-control intensity rises to 9.5 percent of WFE, above management’s own 9 percent target, as High-NA EUV, backside power delivery, and HBM stacking multiply inspection steps, and KLA’s share holds or expands above 58 percent. The BIS Affiliates Rule gets extended or permanently replaced, China revenue stabilizes at 20 to 25 percent of a much larger revenue base, and domestic substitution stays below 15 percent in metrology through 2031. The forward multiple compresses from 56 times to roughly 38 times, still a premium for the highest-quality name in WFE but faded from today’s extreme as growth decelerates toward the low teens.
That combination produces a revenue growth rate of roughly 16 percent a year from FY2025 through FY2031 [estimate], taking revenue from $12.16 billion to roughly $29 billion, operating margin near 47 percent, and non-GAAP EPS around $11.05 post-split [estimate]. At roughly 38 times that EPS, the illustrative valuation lands near $420 a share [estimate], the level shown in the five-year bull path above. What has to be true: hyperscaler AI capex keeps compounding at 30 percent-plus through at least 2028, process-control intensity keeps rising for physics-driven reasons independent of volume, and China risk gets managed without escalating into service or spare-parts restrictions on the installed base. What is most likely to break it: a 2027-2028 WFE digestion pause that compresses both KLA’s earnings growth and its process-control-versus-WFE spread at the same time, demonstrating the intensity tailwind was a cyclical amplifier rather than a structural floor.
Base case (illustrative, estimate)
WFE spending grows through 2027, experiences a modest 2028 digestion cycle, roughly 10 to 15 percent below peak, and resumes growth in 2029-2030, reaching roughly $200 billion by 2030, slightly below management’s assumption. Process-control intensity rises to roughly 8.5 percent of WFE, slightly below management’s target, with KLA holding 57 to 58 percent share; the intensity tailwind is real but partially offset during the downcycle. The Affiliates Rule gets a partial extension or replacement, China revenue stabilizes at 22 to 25 percent of total but absorbs $300 to $400 million of cumulative export-control drag, and domestic substitution reaches 12 to 15 percent in mature-node metrology by 2031. The forward multiple compresses from 56 times to roughly 28 times, normalizing toward a range appropriate for a high-quality but genuinely cyclical industrial compounder growing at low-to-mid teens.
That produces a revenue growth rate of roughly 13 percent a year through FY2031 [estimate], reaching roughly $25 billion, an operating margin of 44 to 45 percent, the midpoint of management’s target range, and non-GAAP EPS around $9.29 post-split [estimate]. At roughly 28 times, the illustrative valuation lands near $260 a share [estimate]. What has to be true: the WFE cycle follows a historically normal up-pause-resume pattern rather than a structural break, process-control intensity keeps rising even if slower than management assumes, and China revenue stabilizes rather than collapses. What tips this toward the bear case: a downcycle deeper or longer than historical norms; what tips it toward the bull case: process-control intensity accelerating faster than management’s own model, which would make any downcycle shallower for KLA specifically even as WFE volume falls.
Bear case (anchored on the skeptic’s strongest arguments, illustrative, estimate)
A severe 2027-2028 AI capex digestion cycle takes hold as hyperscalers cut 20 to 30 percent of capex growth to close the roughly $600 billion annual ROI gap, and WFE falls 15 to 20 percent from a 2027 peak to a 2028 trough, with a slow recovery leaving total WFE at only roughly $170 billion by 2030. Process-control intensity stalls at roughly 8 percent of WFE; the roughly 2x growth spread over headline WFE compresses toward 1x during the downturn, evidence the intensity story was partly a cyclical amplifier rather than purely structural, even as KLA’s share holds near 56 to 58 percent because the total addressable market itself grows slower than modeled. The Affiliates Rule reactivates on November 9, 2026, further Entity List escalation in 2027 brings additional customer restrictions, and controls extend to service and spare-parts revenue on the installed base, dropping China to roughly 15 percent of total by FY2031 as domestic metrology substitution accelerates to 18 to 20 percent, ahead of the 2035 base-case timeline. The forward multiple compresses to roughly 20 times, reverting to historical WFE-peer cyclical-trough levels as the structural-compounder thesis gets challenged directly.
That combination produces a revenue growth rate of only roughly 5 percent a year through FY2031 [estimate], reaching only $16 to $18 billion, 30 to 40 percent below management’s target, an operating margin compressed to 38 to 40 percent, and non-GAAP EPS around $6.00 post-split [estimate]. At roughly 20 times, the illustrative valuation lands near $120 a share [estimate]. What has to be true: hyperscaler AI capex proves unsustainable at its current pace, the WFE downcycle lands at the severe end of the historical range, China export controls escalate beyond current scope, and the 56 times starting multiple proves to have been a cycle-peak artifact rather than a deserved structural premium. What turns a bear back toward base: if KLA’s process-control-versus-WFE growth spread holds near 2x through an actual WFE downturn, that would be the first definitive evidence the intensity tailwind is genuinely structural rather than merely riding the same cyclical wave at a higher beta, and the bear case would weaken substantially.
Catalysts and what to watch
Near term. August 2026: Q4 FY2026 earnings, with FY2027 full-year guidance the most-watched forward data point. October-November 2026: Q1 FY2027 earnings, the first read on whether the “high-teens” calendar-2026 pace extends into the new fiscal year. November 9, 2026: the BIS Affiliates Rule’s automatic reactivation date, the single most consequential near-term binary event for KLAC, AMAT, and LRCX alike. Late 2026: hyperscaler Q3 earnings will set the AI-capex tone for 2027 budgets.
Multi-year. 2027-2028 is the most likely window for AI capex digestion if it materializes, the same window in which TSMC Arizona, Samsung Taylor, and Intel Ohio begin ramping toward sustained production-tool demand. 2028-2030 brings the High-NA EUV volume ramp, which adds new mask-inspection and overlay-metrology requirements that could disproportionately benefit KLA’s core franchise. 2030 is the checkpoint for management’s own long-term targets. 2025-2035 is the decade-scale window over which China’s domestic metrology localization trajectory plays out, currently sub-10 percent, projected to reach roughly 20 to 25 percent by 2035 in mature-node segments.
Leading indicators, in order of leading-to-lagging. Hyperscaler quarterly capex guidance, the top of the demand chain, leads WFE orders by roughly 12 to 18 months. The spread between KLA’s process-control growth rate and SEMI’s WFE growth rate, currently roughly 2x, is the single most important KLA-specific gauge; a narrowing spread is the earliest signal the intensity tailwind is fading. KLA’s remaining performance obligations should be watched for stabilization versus continued decline. The November 9, 2026 BIS decision is a binary, dated event. SEMI’s monthly and quarterly billings data is the aggregate WFE demand signal shared across every name in this space. TSMC’s quarterly capex guidance flows directly through to KLA’s largest customer relationship. China Entity List additions, and any move to restrict service or spare-parts revenue on installed China tools, are a recurring rather than one-time risk to monitor each quarter.
Companies to watch (bull / base / bear)
KLA Corporation (KLAC) - the process-control leader profiled throughout. Bull: structural intensity tailwind compounds through the cycle, moat proves resistant to Chinese substitution, and the services annuity keeps growing toward the 2030 target. Base: the WFE cycle behaves normally, a 2027-2028 digestion phase gets absorbed, and management’s targets land roughly a year late. Bear: the 56x starting multiple proves to have been a cycle-peak artifact, and a severe downcycle paired with China escalation reverts the stock to historical cyclical-trough multiples. Watch: the process-control-versus-WFE growth spread, remaining performance obligations, and the November 9, 2026 BIS date.
Applied Materials (AMAT) - the broadest WFE vendor and KLA’s most direct large-cap comparison. Bull: three simultaneous technology transitions lift content per wafer regardless of unit volume. Base: the AGS annuity cushions a normal cycle turn while Semiconductor Systems revenue tracks the broader WFE rate. Bear: China exposure keeps eroding structurally and the multiple, already near-parity with KLA’s, has little room for disappointment. Watch: China revenue as a percentage of Semiconductor Systems plus AGS, and any BIS compliance news given the company’s existing suspended denial order.
Lam Research (LRCX) - the etch leader, more NAND-concentrated than either KLA or Applied Materials. Bull: NAND layer-count growth and HBM through-silicon-via etch demand are structural, not cyclical. Base: etch demand tracks the broader WFE cycle with a NAND-specific amplifier in both directions. Bear: a NAND inventory-digestion period hits Lam’s order book harder than its more diversified peers. Watch: NAND capex guidance from Samsung, SK Hynix, and Micron.
ASML Holding (ASML) - the one name in this group with an outright, not merely dominant, monopoly. Bull: no advanced chip gets made without an ASML EUV scanner, and High-NA EUV extends the pricing roadmap for a decade. Base: order timing stays lumpy but the multi-year backlog cushions any single quarter’s disappointment. Bear: China DUV sales keep declining and reduced bookings disclosure narrows investor visibility into the order pipeline. Watch: High-NA EUV system shipment pace and China DUV order trends.
Onto Innovation (ONTO) and Camtek (CAMT) - the smaller, faster-growing specialists in advanced-packaging and HBM-adjacent inspection. Bull: both are direct beneficiaries of the advanced-packaging and HBM buildout, a segment growing faster than the broader WFE market. Bear: thin float, elevated short interest relative to the mega-caps, and (for Onto specifically) a recent GAAP earnings decline on record revenue that is not yet fully explained. Watch: second-half 2026 bookings and margin trends at both names as a read on whether the advanced-packaging sub-cycle is broadening or narrowing.
Risk controls
Size any position with the cyclicality of this business in mind: KLA’s Semiconductor Process Control segment amplifies the WFE cycle even with the intensity tailwind layered on top, and no prior WFE downturn has been tested at KLA’s current revenue scale. Treat the 56 times forward multiple as the single largest risk factor in this thesis on its own terms, independent of how the underlying business performs; a stock that fell nearly 12 percent in one session on a rates story with no company-specific news is a stock where multiple compression can happen fast and without warning. Do not treat management’s 2030 targets, or any of the illustrative scenario prices above, as a floor or a guarantee; they are a company-set model and a set of scenario estimates respectively, not audited outcomes. Watch the two dated, binary risks that sit inside this article’s own five-year window with particular attention: the November 9, 2026 BIS Affiliates Rule reactivation date, and any expansion of export controls to cover service and spare-parts revenue on KLA’s already-installed China tool base, which would cut into the company’s highest-margin, most-recurring revenue stream. Recognize the customer-concentration risk as structurally different from Applied Materials’: a TSMC-specific capex pause or timing shift, something that has not happened at scale in the current cycle, would move KLA’s numbers by more than a comparable event would move a more diversified peer’s. Verify every price, market cap, and multiple in this piece independently before acting on it; all of it is stamped to July 1, 2026 and none of it will still be current by the time this is read.
Methodology, sourcing, and data-quality flags
This research draws on KLA’s FY2025 10-K, its Q3 FY2026 10-Q and accompanying earnings press release and call transcript, the March 12, 2026 Investor Day materials, the May 7, 2026 8-K announcing the 10-for-1 split, sell-side and trade-press coverage (Investing.com, TipRanks, TrendForce, Jefferies, Morningstar), stockanalysis.com for point-in-time market data, and Glassdoor for employee-sentiment signal. 131 claims were recorded to this run’s ledger, 76 of them load-bearing; 73 of those 76 were independently verified against a source distinct from the one originally on file, and the remaining 3 are documented, hedged disagreements rather than open gaps, detailed below. No claim in this piece requires a human-gate escalation on evidentiary or legal-sensitivity grounds.
Data-quality flags:
- Process-control market share (roughly 58 percent) is KLA’s own investor-day framing, citing third-party data it did not attribute to a named analyst house. No independent analyst report under its own byline was located carrying the identical figure, though independent trackers corroborate a broadly similar high-50s to low-60s percent range depending on how the market is scoped (one tracker cites nearly 63 percent on a narrower definition; a much broader “metrology and inspection” market definition that includes non-competing vendors like Thermo Fisher and Zeiss yields a figure closer to 17.5 percent). Read the 58 percent figure as company-sourced, not independently audited.
- China revenue share is measurement-window-dependent. Full-year FY2025 was 33.2 percent; the nine-month FY2026-to-date figure is 31.2 percent; the single most recent quarter (Q3 FY2026) was 24.3 percent. All three are correct simultaneously; this piece specifies which window it is citing rather than presenting a single “roughly 33 percent” figure as current.
- The 2030 targets are a company target model, not a forecast or a guarantee. Every mention in this piece uses target or forecast language; none states KLA “will” reach $26 billion or $84 (pre-split) EPS by 2030 as settled fact.
- The 10-for-1 stock split, effective June 12, 2026, makes every pre-split EPS, dividend-per-share, and share-count figure non-comparable to the current price without a 10x adjustment. Every pre-split figure in this piece is labeled as such wherever it appears near a post-split number.
- Consensus analyst price targets are unreliable in the days immediately following the split, given visible split-adjustment inconsistency across data trackers as of the research date; the consensus Buy rating is treated as more reliable than any single consensus price-target figure cited in this window.
- KLA’s return on invested capital is genuinely disputed across data providers, with figures ranging from roughly 33 percent to 73 percent depending on whether the invested-capital base includes goodwill and debt. This piece does not state a single ROIC figure as fact for that reason.
- A ledger data-entry error in Lam Research’s FY2025 revenue was found and corrected during verification (an original garbled figure was mistakenly “corrected” to a value roughly 2.2x too large before an independent re-check caught it); the correct, independently sourced figure used throughout this piece is $18.44 billion, up 23.7 percent year over year.
The full five-factor read
Valuation. KLA trades at the highest multiples in its mega-cap WFE peer group: 55.87 times forward earnings versus 44.06 for Applied Materials, 51.95 for Lam Research, and 47.48 for ASML. The price-to-sales ratio of 26.55 is 30 to 45 percent above every named peer. Morningstar, which assigns KLA a Wide Moat rating, simultaneously puts fair value at roughly $80 post-split, roughly 70 percent below the current price, and flags the stock as overvalued at current levels in the same report used to support the moat argument. The premium is not baseless, KLA’s 61 percent gross margin is 10-plus points above Applied Materials and Lam Research, and the services annuity adds real resilience, but the magnitude of the premium relative to even ASML’s literal lithography monopoly stretches the “justified quality premium” argument. The stock is expensive by every measurable standard, partially but not fully explained by the quality differential.
Growth. The growth trajectory is strong and independently verified: FY2025 revenue grew 24 percent year over year, the Semiconductor Process Control segment is guided above 20 percent for calendar 2026, and management targets a 13 to 17 percent revenue growth rate through 2030. Advanced-packaging process-control revenue is roughly doubling from $635 million to roughly $1 billion in 2026. Services revenue is growing at 13 to 15 percent toward a $6 billion 2030 target. The growth runway is anchored in a physics-driven tailwind, process-control intensity rising from 7.4 percent to 9 percent of WFE, that is distinct from and additive to the headline WFE volume cycle.
Quality. KLA’s business quality is exceptional by every verified metric. GAAP gross margin of 61 percent has held in a narrow band across five consecutive quarters of both accelerating and decelerating growth, the highest in the WFE peer group by 10-plus percentage points. Free cash flow was $3.75 billion on $12.16 billion of revenue in FY2025, with capital expenditure at only roughly 3 percent of revenue. Process-control market share of roughly 58 percent is roughly seven times the nearest competitor. The company returns more than 90 percent of free cash flow to shareholders, with 17 consecutive annual dividend increases. Morningstar assigns a Wide Moat rating. Return on invested capital estimates range from 33 to 73 percent depending on methodology, but even the lower bound reflects outstanding capital efficiency.
Risk. Three material risks are live and verified. First, China export controls: the BIS Affiliates Rule reactivates automatically on November 9, 2026, and the April 2026 Hua Hong shipment halt shows the restriction pattern migrating to mature nodes. Second, customer concentration: a single customer, inferred as TSMC, accounted for 19 to 23 percent of quarterly revenue, and two customers combined for roughly 30 percent. Third, WFE cyclicality: remaining performance obligations declined 20 percent year over year to $7.86 billion even as revenue grew 24 percent, a soft but notable leading indicator. Leverage, $5.9 billion of debt against $4.5 billion of cash and securities, is manageable given free cash flow generation but non-trivial.
Momentum and sentiment. The stock is up roughly 107 percent year-to-date for 2026 even after the 12 percent July 1 selloff. Sell-side consensus is unanimously constructive: 30 percent Strong Buy, 45 percent Buy, 25 percent Hold, zero Sell across roughly 29 analysts. Recent analyst price-target raises cluster in the $275 to $325 range. Insider selling totaled $19.7 million over three months with zero buys, led by CEO Wallace’s roughly $9.99 million sale on June 11 under a pre-scheduled 10b5-1 plan adopted seven months earlier. The 10-for-1 split has broadened retail accessibility, which may have attracted momentum-driven capital that can exit faster than it entered. The July 1 -12 percent day is a concrete demonstration that this multiple compresses asymmetrically on rate or macro repricing.
On balance, the verified evidence across all five factors nets to a Buy: exceptional, independently confirmed growth and quality, a genuinely durable and hard-to-replicate moat, held one notch back from Strong Buy by a valuation that already prices in most of that quality and a risk profile carrying two dated, binary catalysts inside the article’s own outlook window. This is a rules-based research signal built from the evidence above, not personalized investment advice; readers should conduct their own due diligence and consult a qualified financial adviser before making any decision.
Key sources: KLA FY2025 10-K and Q3 FY2026 10-Q (SEC EDGAR, CIK 0000319201); KLA Q3 FY2026 and FY2025 earnings press releases (investor relations); March 12, 2026 Investor Day materials; May 7, 2026 8-K on the 10-for-1 stock split; TrendForce (China export-control impact estimates); Jefferies (China revenue-at-risk estimate); Morningstar (Wide Moat rating and fair-value estimate); SEMI (WFE and total semiconductor equipment forecasts); stockanalysis.com (point-in-time market data, July 1, 2026); Glassdoor (employee sentiment).
Prepared July 1, 2026. Figures are point-in-time and will change. This is research and analysis for educational purposes, not investment advice, not a recommendation, and not a solicitation. Semiconductor-equipment stocks are cyclical and volatile; past performance is not indicative of future results. Verify all figures independently and consult a licensed financial advisor before making any decision.