
Research date: June 22, 2026 | OSINT market research on Micron Technology, Inc. (MU, Nasdaq) - a company-mode deep dive for retail investors.
Important disclaimer. This is OSINT-based research and educational analysis, not investment advice. I am not a financial advisor. Nothing here is a recommendation to buy or sell any security, and the scenarios below are illustrative, not price targets. Memory is one of the most cyclical commodity businesses in technology; valuations and earnings can swing violently with the DRAM and NAND price cycle. Market caps, prices, valuation multiples, and market-share figures are point-in-time (June 22, 2026), press-reported where noted, and move fast. One more thing specific to this name: Micron reports fiscal Q3 2026 on June 24, 2026, two days after this research date, and the options market was pricing a one-day move of roughly 14 to 17 percent on that print. Every figure here could be stale within 48 hours. Do your own due diligence and consult a licensed advisor.
Where this stock could be in 6 months, 1 year, 3 years, and 5 years
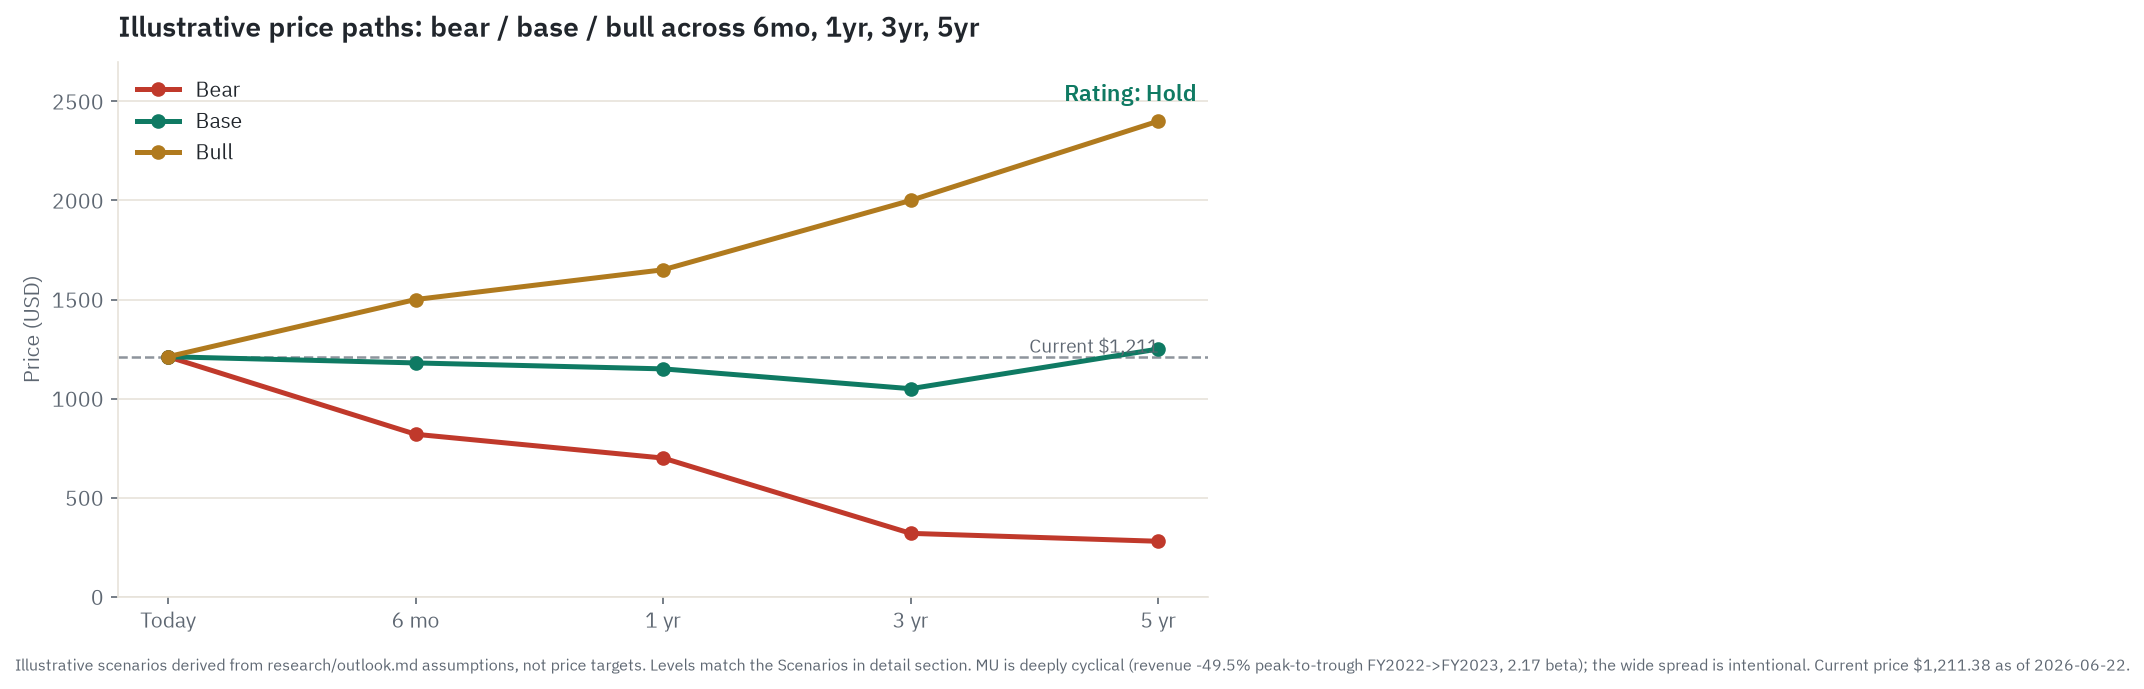
A word before the numbers. Micron is one of the most violently cyclical large companies in the market. Revenue fell 49.5 percent from peak to trough as recently as fiscal 2022 to fiscal 2023, gross margin went from the mid-40s to negative 9.1 percent, and the stock carries a beta of 2.17 with realized volatility near 116 percent. So the spread between the bear and bull paths below is intentionally wide, roughly nine-to-one from the 5-year bear to the 5-year bull. These are illustrative arithmetic from the scenario assumptions, not forecasts and not price targets.
6 months. This window belongs to the June 24 earnings print and the guide that comes with it, not to the structural story. The stock closed at $1,211.38 on June 22, near the very top of its 52-week range, and the options market priced a 14 to 17 percent one-day move into the report (an expected range of roughly $940 to $1,327 the day after). The base case is roughly flat near $1,180 if a strong but already-priced quarter holds the multiple. The bull case is about $1,500 on a clean beat plus a reassuring outlook. The bear case is about $820 if a miss or a cautious next-quarter guide closes much of the cheap-forward-earnings argument and the stock fills toward its 50-day moving average. The single thing most likely to flip this window is the gross-margin and revenue guide for the following quarter, which is the market’s first hard read on whether peak pricing is extending or rolling.
1 year. Still cycle-driven. The base case is about $1,150, which assumes peak earnings hold roughly one more year and the forward multiple stays near 10 times. The bull case is about $1,650 on an extended upcycle that pushes the peak into the back half of 2027. The bear case is about $700, the scenario where the first pricing-roll signal appears (spot memory prices flattening while a hyperscaler trims its 2027 spending plans), forward earnings estimates get cut, and the “cheap 10x” resets on a falling denominator. The flip variable is hyperscaler 2027 capital-spending guidance, which lands on the late-2026 earnings calls.
3 years. Now the structural drivers take over and the spread is roughly six-to-one. The base case is about $1,050, a cycle that turns and normalizes to above-historical-average through-cycle earnings because high-bandwidth memory has permanently reallocated the best wafers. The bull case is about $2,000 if the “this time is different” re-rating holds and new 2027 to 2028 capacity gets absorbed as fast as it lands. The bear case is about $320, a 2018 or 2022-style inventory digestion that compresses trough earnings and mean-reverts the multiple, the textbook outcome after every prior Micron peak. The flip variable is whether channel inventory stays lean or drifts from today’s 2 to 4 weeks toward 8 to 10.
5 years. Pure durability. The base case is about $1,250, roughly flat from today after a full cycle elapses with a deep drawdown and recovery in between. The bull case is about $2,400 and requires the permanent re-rating from “cyclical” to “AI infrastructure” to hold across two-plus years without a pricing roll, which has no precedent in Micron’s 47-year history. The bear case is about $280, a full multiple mean-reversion toward historical peak-cycle levels. The flip variable is whether high-bandwidth memory and long-term contracts have genuinely raised the through-cycle floor or merely the peak.
Where the read lands today. On balance the read holds at Hold: this is a genuinely high-quality, best-balance-sheet-in-its-history franchise riding a real structural upcycle, but it trades above its own analyst consensus at a cycle peak on multiples that only make sense if revenue never reverts. The single thing most likely to flip it is a pricing roll-over, the moment spot memory prices flatten for a couple of weeks while a hyperscaler trims 2027 spending.
Companion tool
Jump to the interactive dashboard to sort and filter every company in the piece, or download the Excel model to flex the scenarios yourself.
TL;DR
The demand starts with hyperscaler AI spending, flows through NVIDIA and AMD accelerators that bundle high-bandwidth memory into every GPU package, and lands on three companies that make HBM: SK Hynix, Micron, and Samsung. Micron is the only US-domiciled one. That demand has driven the steepest financial recovery in the company’s history, from a $15.54 billion revenue trough and an operating loss in fiscal 2023 to a $23.86 billion quarter in Q2 fiscal 2026 at a record 74.4 percent gross margin, with the next quarter guided to $33.5 billion and roughly 81 percent margin. Micron’s 2026 HBM output is sold out under binding contracts. Here is the catch, and it is the whole point of this piece: the forward price-to-earnings ratio of about 10 to 11 times looks cheap only because it sits on peak earnings, the exact setup the stock had at prior cycle tops before earnings collapsed. On the metrics that do not flatter a cyclical at its peak, the stock is rich (about 23 times trailing sales versus a historical 2 to 5, about 18 times book versus a long-run median near 1.9, where price-to-book, or P/B, measures the price against the company’s net assets), and the average Wall Street price target sits roughly 20 percent below the market price. The single biggest risk is the one that has ended every prior memory cycle: the cycle turning on peak earnings.
Explore it yourself: the interactive dashboard
Open the dashboard in a full screen
The hook: a commodity business having an un-commodity moment
For most of its 47 years, Micron was the textbook commodity cyclical. It makes memory chips that are close to interchangeable with the ones SK Hynix and Samsung make, the price is set by the global balance of supply and demand, and that balance swings so hard that the company has gone from near-60-percent gross margins to a billion-dollar operating loss inside of two years more than once. You do not pay a premium multiple for a business like that. You buy it when it looks expensive on depressed earnings and sell it when it looks cheap on peak earnings, which is the opposite of how you treat almost everything else.
Then AI happened, and one product line broke the pattern. High-bandwidth memory, or HBM, is the stacked, ultra-fast memory bolted next to every AI accelerator. Here is the physical fact that makes it special: a gigabyte of HBM eats roughly three to four times the wafer area of a gigabyte of ordinary DDR5. Think of a fab as a kitchen with a fixed-size pantry door. Every tray of HBM you push through that door is three or four trays of regular memory you cannot. So when AI demand pulls HBM through the door, it does not just lift HBM prices, it starves the supply of ordinary PC, phone, and server memory at the same time. That is the “wafer governor,” and it is the most concrete argument that this cycle might be structurally different from the ones before it.
The central question this piece interrogates is exactly that. Is Micron a re-rated AI infrastructure company whose record margins are durable, or is it a commodity cyclical at a peak, wearing an AI costume, that will mean-revert the way it always has? The honest answer runs through both cases, and that is how the rest of this is organized.
How the money flows
flowchart TD
    HCAP["Hyperscaler AI capex<br/>~$700B CY2026 total"]
    HCAP -->|"~30% goes to memory<br/>(up from ~8% in CY2023)"| ACCEL

    ACCEL["NVIDIA / AMD / Broadcom<br/>Bundle HBM in GPU packages<br/>NVIDIA ~80% AI-GPU market"]
    ACCEL -->|"HBM demand: NVIDIA Vera Rubin<br/>(8x HBM4 per GPU)"| HBM

    HBM["HBM oligopoly<br/>SK Hynix ~62% / Micron ~21% / Samsung ~17%<br/>All 2026 supply sold out"]
    HBM -->|"Micron CMBU segment<br/>HBM + cloud DRAM<br/>$7.75B Q2 FY2026"| MU

    DRAM_COMM["Standard DRAM<br/>DDR5 PC / LPDDR5 mobile / server<br/>Big-3: ~90% of revenue"]
    DRAM_COMM -->|"Micron CDBU+MCBU+AEBU<br/>44% of H1 FY2026 revenue"| MU

    MU["Micron Technology<br/>Q2 FY2026 revenue $23.9B<br/>GM 74.4% / Q3 guide $33.5B at ~81% GM"]

    MU -->|"DRAM 79% of revenue<br/>$18.8B Q2 FY2026"| DRAM_OUT
    MU -->|"NAND 21% of revenue<br/>$5.0B Q2 FY2026"| NAND_OUT

    DRAM_OUT["DRAM production<br/>1-gamma node / EUV<br/>Hiroshima / Singapore / Taiwan fabs"]
    NAND_OUT["NAND production<br/>G8/G9 3D NAND<br/>Singapore / Japan fabs"]

    DRAM_OUT -->|"Wafer fab equipment"| WFE
    NAND_OUT -->|"Wafer fab equipment"| WFE

    WFE["WFE: ASML 100% EUV monopoly<br/>Applied Materials / Lam / TEL"]
    WFE -->|"Advanced packaging<br/>HBM TSV + die stacking"| PKG

    PKG["3D Packaging<br/>Micron in-house (Hiroshima)<br/>TSMC CoWoS for SK Hynix<br/>Singapore HBM facility (2027)"]
    PKG -->|"Raw silicon wafers<br/>Shin-Etsu / Sumco (Japan)"| MATS

    MATS["Materials / gases<br/>Japan-concentrated silicon<br/>Linde / Air Products / Entegris"]

    CXMT["CXMT (China)<br/>~5-8% DRAM rev share<br/>DUV only / multi-gen node lag<br/>HBM ceiling from Dec-2024 controls"]
    YMTC["YMTC (China)<br/>~13% NAND shipment share<br/>Price/share risk in commodity NAND"]

    CXMT -.->|"Commodity DRAM<br/>price pressure at low end"| DRAM_COMM
    YMTC -.->|"Commodity NAND<br/>share erosion risk"| NAND_OUT

    CHIPS["CHIPS Act grants<br/>~$6.44B to Micron<br/>Idaho ID1 (2H 2027)<br/>New York (2030+)"]
    CHIPS -.->|"US fab build-out<br/>~$200B commitment"| MU
Read the diagram top to bottom and you see where the pricing power sits. The money originates with hyperscaler AI capital spending, on the order of $700 billion in calendar 2026 across the largest cloud builders, of which an estimated 30 percent now flows to memory, up from roughly 8 percent in 2023. The first toll is collected by the accelerator makers. NVIDIA assembles a GPU around four to eight stacks of HBM; AMD does the same on its MI-series. Every dollar a hyperscaler spends on an accelerator carries an embedded memory spend, so the memory makers’ revenue follows the GPU directly.
The second toll, and the real chokepoint, is the memory oligopoly. Only three companies on earth make HBM at scale. As of mid-2026, by Counterpoint Research’s revenue-based count, SK Hynix holds about 62 percent of HBM, Micron about 21 percent, and Samsung about 17 percent, and the broader three-firm DRAM market is roughly 90 percent of revenue (closer to 95 percent of capacity). There is no routing around this group, and in the upcycle they hold genuine pricing power. The structural twist is that the same wafer-governor effect that enriches HBM also tightens ordinary DRAM, so even a buyer with no interest in AI pays up.
Upstream of Micron sits the equipment layer, and there the chokepoint is even tighter: ASML is the sole maker of the EUV scanners that Micron’s leading-edge 1-gamma DRAM node requires (EUV is extreme-ultraviolet lithography, the only tool that can pattern the smallest features on a leading-edge chip, and it is precisely the machine China’s CXMT is barred from buying), a literal 100 percent monopoly, with Applied Materials, Lam Research, and Tokyo Electron supplying the etch, deposition, and clean steps below it. The two dotted threats at the bottom, China’s CXMT in commodity DRAM and YMTC in NAND, press only at the low end, but they press hardest precisely when the cycle turns. (For a fuller walk through this chain, see the memory supply-chain explainer. To see where Micron sits within the broader AI capital-spending map across semiconductors, power, and networking, the AI supply-chain investment map covers the full picture.)
What Micron actually sells: the field guide
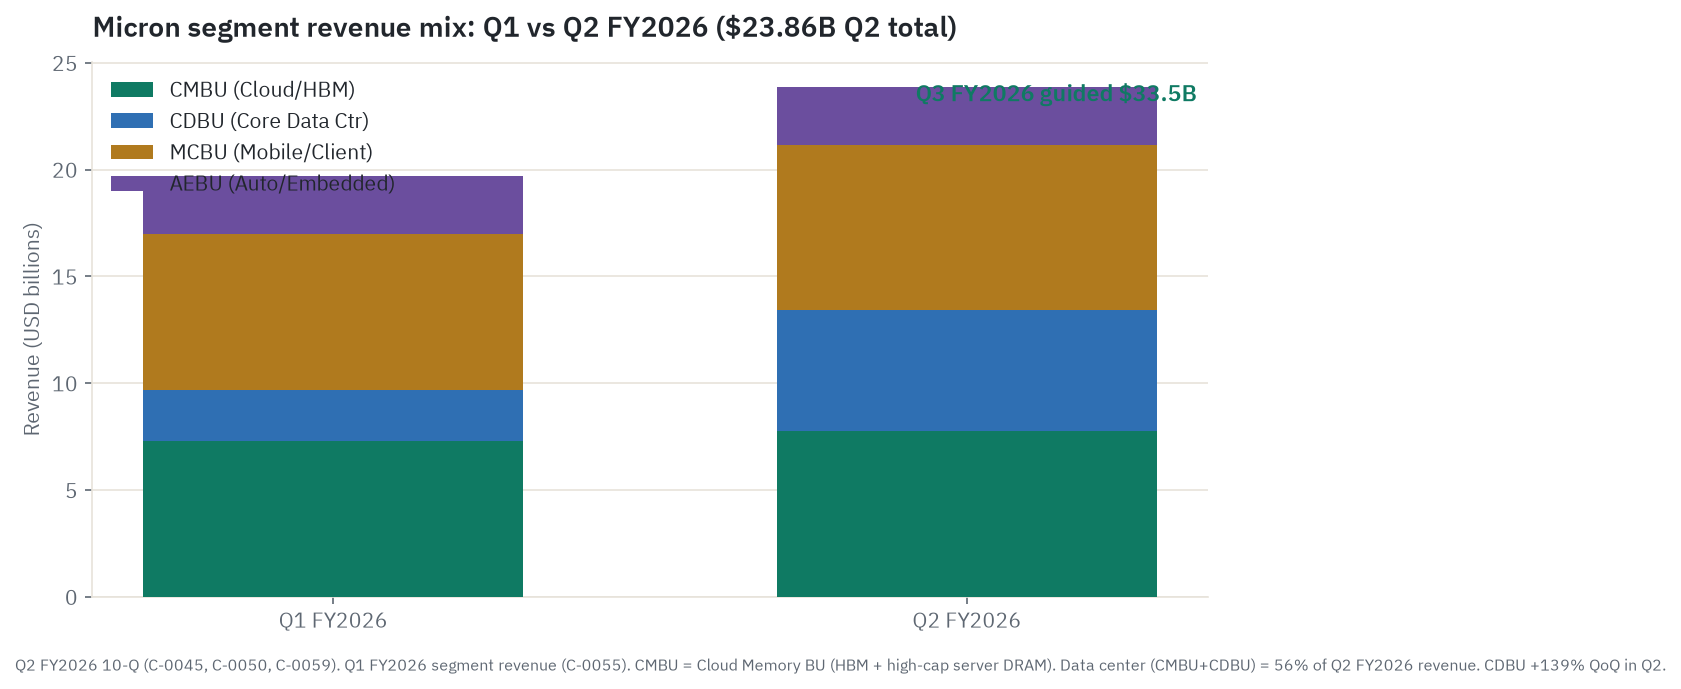
Two product families, four customer-facing segments. The two products are DRAM (working memory, where data lives while a chip computes) and NAND (flash storage, where data sits when the power is off). In Q2 fiscal 2026, DRAM was 79 percent of revenue at $18.8 billion and NAND was 21 percent at $5.0 billion. DRAM is the bigger, higher-margin, and more strategically important half, and it is where HBM lives.
On top of those products, Micron reorganized into four business units that follow the customer:
- Cloud Memory (CMBU) is the profit engine. It houses HBM and high-capacity server DRAM for hyperscalers, and it grew from 15 percent of fiscal 2024 revenue to 36 percent of fiscal 2025, reaching $7.75 billion in Q2 fiscal 2026 alone.
- Core Data Center (CDBU) is traditional server DRAM plus data-center SSDs. It ran at $5.69 billion in Q2, up 139 percent in a single quarter.
- Mobile and Client (MCBU) is phone memory (LPDDR5X) and PC memory (DDR5), at $7.71 billion in Q2.
- Automotive and Embedded (AEBU) is car, industrial, and embedded memory, $2.71 billion in Q2.
Add the two data-center units and you get 56 percent of revenue, the structural shift that defines the current Micron: a company that was roughly 38 to 40 percent data center in fiscal 2024 is now well over half data center, on a much larger base.
A few products worth knowing by name. On the HBM roadmap, Micron is shipping HBM3E (the current generation, in 8-high and 12-high stacks for NVIDIA’s H200 and Blackwell GPUs and AMD’s MI350) and is in high-volume production of HBM4, the next generation, whose interface doubles to 2,048 bits and which Micron built specifically for NVIDIA’s Vera Rubin platform. On storage, the Micron 9650 is the world’s first PCIe Gen6 data-center SSD. On the consumer side, Micron did something telling: it discontinued its Crucial retail brand and exited consumer DRAM and SSDs entirely, because, in the CEO’s own words, the company can meet only 50 to 67 percent of its customers’ demand and is choosing to send every available wafer to higher-margin enterprise and AI buyers.
One non-obvious leg is automotive. Car memory takes 18 to 24 months to qualify against safety standards, which makes the customers captive: they cannot switch suppliers quickly when supply is short. So AEBU revenue jumped 57 percent in a quarter even as bit shipments fell (bits are the industry’s volume measure, total memory capacity sold rather than the number of chips), pure pricing power. As cars move from basic driver-assist (about 16GB of DRAM) toward higher autonomy (300GB and up), the memory bill per vehicle keeps climbing regardless of the cycle.
The HBM opportunity: the crux of the bull case
This is where the structural argument lives, so it deserves the detail.
High-bandwidth memory is the highest-margin product Micron makes, by a wide margin. Industry analysts estimate it generates three to five times the revenue per wafer of standard DDR5. The company does not break out HBM as a financial line, so the exact margin is inference, not a filed fact, but the proxy is suggestive: the Cloud Memory unit ran at about 66 percent gross margin in Q1 fiscal 2026 when the company blended figure was 56 percent. Management has projected the total HBM market growing at roughly a 40 percent compound rate from about $35 billion in 2025 to about $100 billion in 2028, which the CEO framed memorably: the HBM market in 2028 would surpass the entire DRAM market of 2024. Treat the $100 billion as a management estimate, not a fact.
Three things make the bull case real rather than hopeful. First, the wafer governor, the physical scarcity already described: HBM consumes about 23 percent of all DRAM wafer starts in 2026, and because it eats three to four times the area per gigabyte, it structurally starves commodity supply. Second, Micron’s 2026 HBM output is sold out under binding price-and-volume contracts, confirmed by management on consecutive earnings calls, with the annualized HBM revenue run-rate estimated at roughly $8 billion (an analyst estimate, since Micron does not disclose it). Third, Micron has the design-ins that matter: it is in high-volume HBM4 production for NVIDIA’s Vera Rubin and is targeting AMD’s MI400 as its other principal HBM4 socket.
The competitive picture inside HBM is the one number that bounces most by research house, so read it as a range. SK Hynix is the comfortable leader at roughly 55 to 62 percent depending on the quarter and methodology. Micron overtook Samsung to take the number-two slot around mid-2025, a move that several analysts called the biggest competitive surprise of the cycle, and sits in the low-20s percent. Samsung, the historical scale leader, fell to third around 17 percent after repeated HBM yield and qualification stumbles, and is the wildcard: Counterpoint expects it to climb back above 30 percent as its HBM4 ramps. Different houses disagree by five to eight points, and bit-share and revenue-share methodologies tell slightly different stories, but the rank order (SK Hynix first, Micron and Samsung trading second and third) is consistent. Micron’s technology credibility here is genuine: it was the first DRAM maker to ship the 1-gamma node, the first DRAM node to use EUV lithography, and it ramped that node’s yields 50 percent faster than its prior one.
For context on the demand side of this, the NVIDIA deep dive covers the AI-compute customer, and the AI silicon piece covers Broadcom’s custom-accelerator path, both of which pull HBM through the same door.
The honest limit on the bull case: “sold out 2026” is not “sold out forever.” Management has confirmed CY2026 and signed its first five-year strategic customer agreement, but 2027 pricing is directional only, and the entire margin-accretion story rests on inference rather than disclosure. Hold that thought, because it is exactly where the bear case begins.
The DRAM and NAND cycle: the crux of the bear case
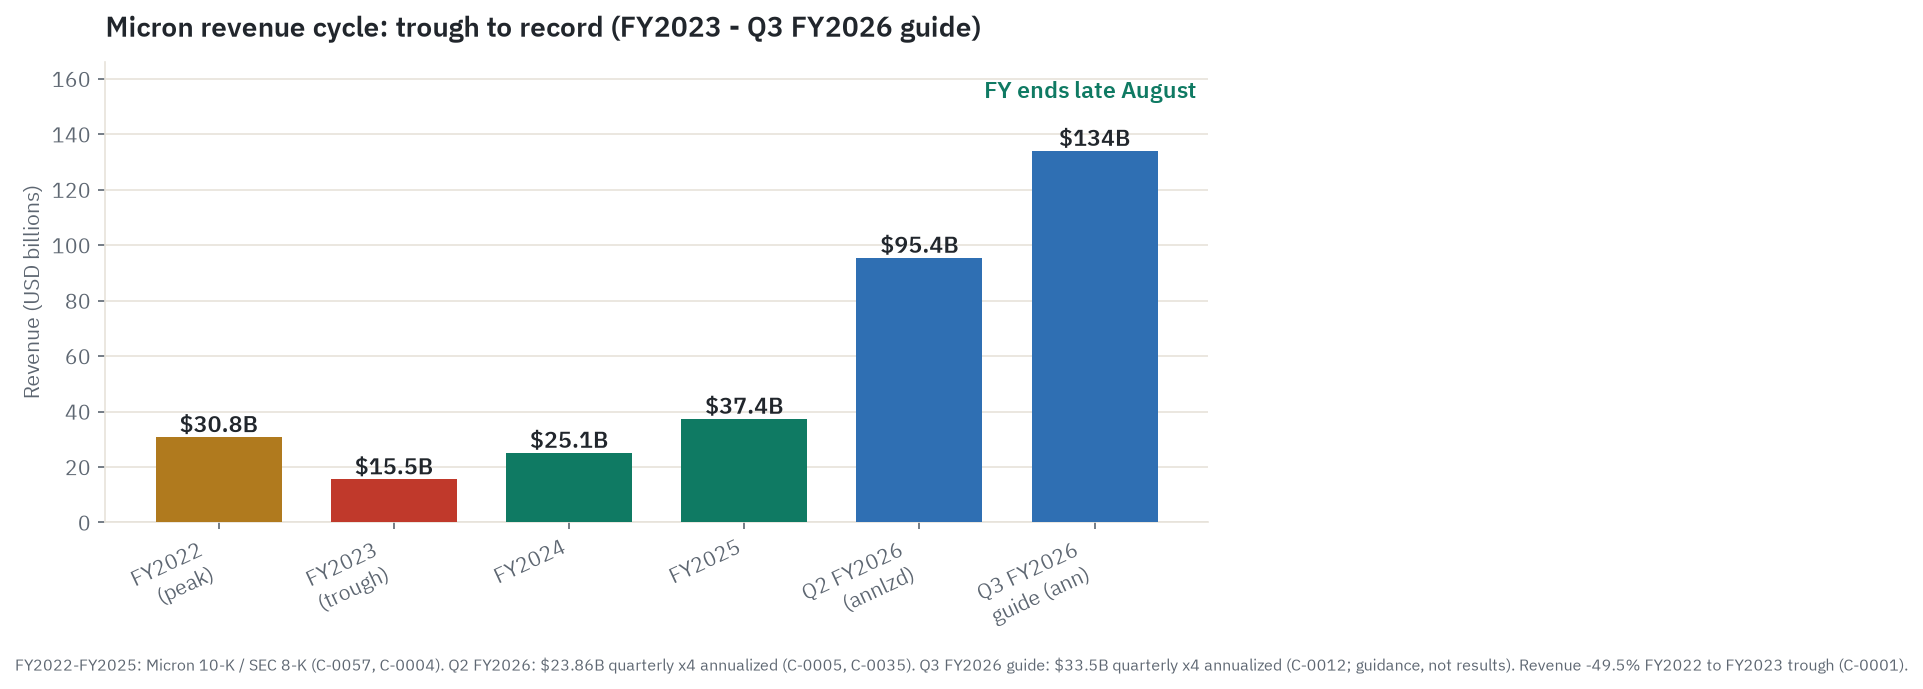
Here is how the memory cycle actually works, and why “this time is different” is the most expensive sentence in markets. A leading-edge DRAM fab costs $15 to $20 billion and takes two to three years to build, so a capacity decision made today determines supply two years out. All three producers read the same demand signals at the same time, so they invest in lockstep, which is precisely what turns a shortage into a glut. The demand side amplifies through the bullwhip: buyers over-order during scarcity, then stop cold when their warehouses are full. The gap between what customers consume and what they order swings far wider than real demand ever does.
The base rate is brutal and well-documented. In the 2018-2019 cycle, the bull argument was identical to today’s, that cloud was a secular driver, not a cyclical one. It was correct. The hyperscalers were structurally growing. And the stock still fell 56 percent and revenue fell about 30 percent, because those same structurally-growing customers had built six to nine months of inventory and simply stopped buying for a year. In the 2022-2023 cycle, Micron’s revenue fell 49.5 percent peak to trough, gross margin went to negative 9.1 percent, and the company booked a $5.83 billion net loss. The pattern across cycles: 25 to 50 percent revenue declines, gross margins from the 45-to-59-percent peak range to deeply negative, stock declines of 50 to 60 percent, all over six to eight quarters.
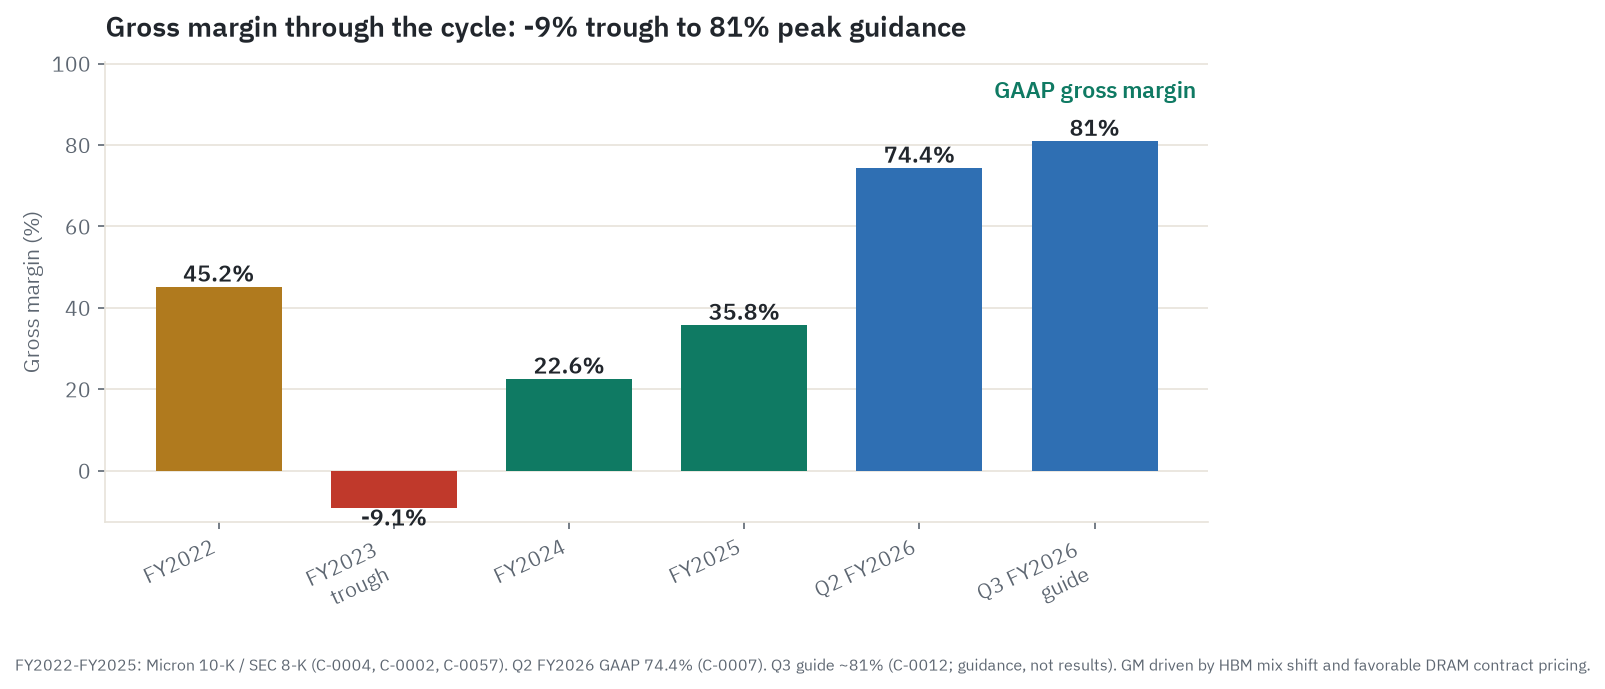
Now look at where pricing sits today, because it is genuinely extraordinary. Contract DRAM prices rose 90 to 95 percent quarter-on-quarter in Q1 calendar 2026, a record for any quarter, and were forecast up a further 58 to 63 percent in Q2 (TrendForce). NAND ran up 55 to 75 percent. Critically, this is mostly price, not volume: in Q2 fiscal 2026 Micron’s DRAM average selling prices rose roughly 65 percent sequentially on only about 5 percent more bits. That pricing-over-volume divergence is what produced an 18-point gross-margin jump in a single quarter, and it is the signature of a fixed-cost machine at full tilt.
So is this cycle different? The bull scorecard is the strongest it has ever been. Channel inventory sits at 2 to 4 weeks versus the 15-plus weeks that preceded every prior major downturn. The wafer governor is real and structural. Hyperscalers are signing multi-year long-term agreements instead of buying spot, including Micron’s first five-year deal. Memory demand is no longer bounded by human device saturation the way PC and phone cycles were. And capacity discipline is holding for now: the big three’s 2026 capex is up only about 14 percent and is aimed at technology migration, not greenfield cleanrooms, so bit-supply growth stays below demand.
The bear scorecard is just as real, and the skeptic’s version is sharper than the bull narrative likes to admit. Structural demand did not save the stock in 2018, and long-term agreements shift when the inventory cycle hits, not whether. The cycle is already about 30 months old, which matches the longest in the data set. Gross margins above 68 percent are above prior peaks, which is a late-cycle reading, not an early one. And there are two demand-side threats the bull story tends to wave away: NAND, still about 21 percent of revenue, has no wafer governor and faces an entrant (YMTC) outside the oligopoly, so it can break first; and software efficiency work, like Google’s claimed memory-compression techniques, could cut HBM per workload without AI spending slowing at all.
The most likely way this goes wrong is not exotic. It is a 2027 inventory digestion: hyperscalers pull demand forward through 2026 to secure scarce supply, new capacity from Micron, SK Hynix, and Samsung all reaches volume together in 2027 to 2028, consumption runs below contracted commitments, channel inventory drifts from 2-4 weeks toward 8-10, and pricing that took two years to inflate rolls over in two to three quarters. NAND breaks first, commodity DRAM follows as CXMT presses the low end, HBM holds longest but cannot offset a blended decline. Weighted across sources, the modal peak lands around Q1 2027 with declines visible by the second half of that year. None of that requires AI to be a bubble. It only requires the mechanism that has ended every prior cycle.
Who wins where: the competitive map
The memory industry groups into four tiers, and the economics live in the top two.
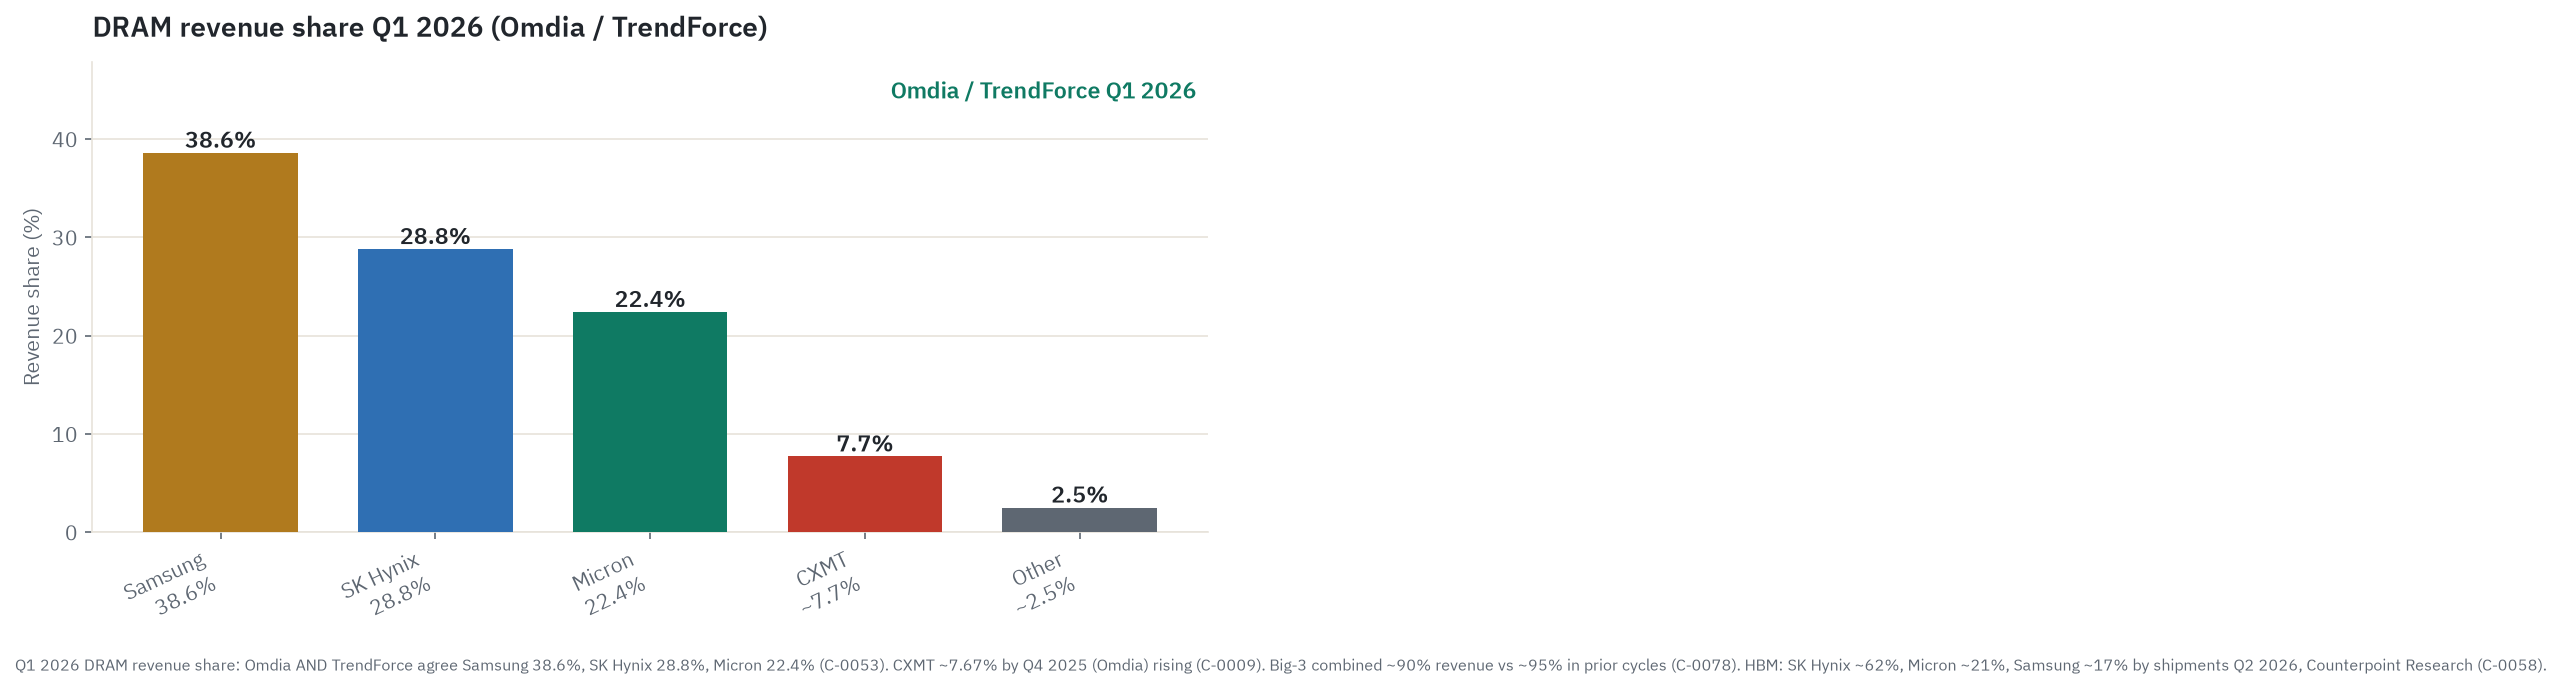
Total DRAM revenue share, Q1 2026 (Omdia / TrendForce): Samsung leads, Micron is third.
The HBM oligopoly. SK Hynix, Micron, and Samsung are the only three companies that make HBM at scale, and they are roughly 90 percent of DRAM revenue. Here is the asymmetry that is the whole competitive story, and the chart above makes it plain: in total DRAM revenue Samsung leads at about 38.6 percent, SK Hynix is second at about 28.8 percent, and Micron is third at about 22.4 percent (CXMT, the Chinese entrant, holds about 7.7 percent and is climbing), but inside HBM the order inverts. SK Hynix is the HBM franchise leader, the primary NVIDIA HBM supplier across generations, with a multi-year co-development agreement and a commanding share. Micron is the technology-credible number two in HBM even though it is third in total DRAM, and it is the only US-domiciled member. Samsung is the scale giant that leads total DRAM but fumbled the HBM transition and fell to third there, and is fighting to recapture share. So Micron is a technology leader and a scale laggard at the same time: it ranks higher in the product that matters most for margin than it does in the market overall. The key nuance on supply: capacity discipline holds at the level of total bit supply (nobody is pouring greenfield commodity cleanrooms), but inside HBM all three are expanding aggressively, with Samsung planning a roughly 50 percent HBM capacity increase by end-2026. That HBM race is what tightens commodity supply for everyone else.
The equipment toll-takers. ASML, Applied Materials, Lam Research, and Tokyo Electron sell the tools every wafer requires. ASML’s EUV monopoly is the single tightest chokepoint in the entire chain. The important warning for anyone thinking of these as a hedge: they are levered to the same memory-capex peak as Micron. Lam Research already has DRAM at a record 39 percent of systems revenue. When memory capex rolls, the equipment names roll with it, not against it.
The commodity fringe. NAND is the looser oligopoly, and that matters because NAND is the segment the bear case says breaks first. Where DRAM has three real players, NAND has five or six of comparable weight: Samsung leads at roughly 29 to 32 percent, then SK Hynix plus its Solidigm unit around 18 to 21 percent, then Kioxia at about 17 percent, with Micron, SanDisk, and China’s YMTC clustered near 13 to 14 percent each (Kioxia in fact edged past Micron in late 2025). Micron is therefore only the fourth-or-fifth-largest NAND maker, not a top-two name, and the crucial point is YMTC: a state-backed entrant outside the oligopoly that reached about 13 percent NAND shipment share by Q1 2026 and is targeting 15 percent. With that many players and no wafer governor on the NAND side, there is no one to act as the supply brake when the cycle turns, which is exactly why NAND has no oligopoly pricing discipline to lean on.
The China threat. CXMT in DRAM and YMTC in NAND are state-backed entrants that cannot reach the leading edge (no EUV access, a multi-generation node lag) but can flood the commodity low end. They are a price threat, not a technology threat, and the threat is asymmetric in time: it bites hardest when the cycle turns and the big three’s margins are already compressing.
Company by company: who’s who
Micron Technology (MU, Nasdaq) is the subject. It designs and makes DRAM (79 percent of revenue) and NAND (21 percent), it is the only US-headquartered DRAM and HBM maker, and it sits third in DRAM by revenue and second in HBM by share. Most recent result: Q2 fiscal 2026 revenue $23.86 billion, up 196 percent year-on-year, at a record 74.4 percent gross margin and $12.07 GAAP diluted EPS, with the next quarter guided to $33.5 billion and roughly 81 percent margin, both of which would be all-time records. Bull: the entire 2026 HBM book is sold out under contract, CHIPS Act funding accelerates the only US DRAM fab, and the company holds 1-gamma EUV node leadership. Bear: peak-cycle multiples (about 23 times sales, about 18 times book) leave no room for error, and any AI-capex digestion or Chinese commodity-DRAM pressure reprices a 2.17-beta stock violently.
The memory peers (note: not easily accessible to US retail)
SK Hynix (000660.KS, Korea Exchange) is the HBM leader at roughly 62 percent share and the number-two DRAM maker overall. It is NVIDIA’s primary HBM supplier across H100, H200, Blackwell, and Vera Rubin, and it began HBM4 mass production in February 2026. Most recent result: Q1 2026 revenue of 52.6 trillion won, up 198 percent, at a record 72 percent operating margin. Bull: a dominant HBM franchise with NVIDIA co-development lock-in and demand exceeding three years of supply. Bear: a 72 percent operating margin is arithmetically a peak; the stock is Korea-listed and effectively inaccessible to most US retail, with only a thin OTC ADR.
Samsung Electronics (005930.KS, Korea Exchange) is the world’s largest chipmaker by revenue and number one in DRAM by revenue share (roughly 38 percent), but only number three in HBM (roughly 17 percent) after repeated HBM4 yield delays. Most recent result: Q1 2026 revenue of 134 trillion won, up 69 percent, with the chip division contributing 94 percent of operating profit. Bull: the largest memory fab footprint on earth, an HBM4E sample lead, and a recovering NVIDIA allocation, so any share recapture is material upside. Bear: HBM has been the biggest competitive miss of the cycle, the consumer-device division is shrinking, and the ADR is highly illiquid for US investors.
The HBM customers (the demand side)
NVIDIA (NVDA, Nasdaq) is the single largest HBM consumer and the driver of the entire AI-memory cycle, the world’s largest company by market cap as of June 2026. Its Vera Rubin platform needs 8 to 16 HBM4 stacks per GPU. Most recent result: Q1 fiscal 2027 revenue $81.6 billion, up 85 percent, with data center at $75.2 billion. Bull: the Vera Rubin ramp, six hyperscaler custom-chip relationships, and CUDA lock-in sustain accelerator demand and HBM pull-through. Bear: this is also Micron’s single-point-of-failure on the demand side. Any hyperscaler AI-capex slowdown removes the dominant HBM demand driver and collapses the whole supercycle narrative.
AMD (AMD, Nasdaq) is the number-two AI GPU vendor, whose MI400 (2026) carries 432GB of HBM4 and positions AMD as the second-largest HBM4 buyer. Most recent result: Q1 2026 revenue $10.3 billion, up 38 percent, with data center up 57 percent. Bull: the MI400 cycle plus EPYC server-CPU share gains. Bear: NVIDIA’s CUDA moat caps AMD’s GPU ceiling, and any MI400 delay removes a 2026 HBM4 demand anchor.
Broadcom (AVGO, Nasdaq) designs custom AI accelerators for several hyperscalers, which consume HBM in training and inference pods. Most recent result: Q2 fiscal 2026 with AI revenue guided to triple toward $16 billion in the following quarter. Bull: a diversified, sticky custom-silicon base that pulls HBM even if NVIDIA’s GPU cycle slows. Bear: custom programs have single points of failure per customer; one cancellation or in-sourcing derates AI revenue fast. The AI silicon piece covers this in depth.
The equipment suppliers (the toll-takers)
ASML (ASML, Nasdaq and Amsterdam) is the sole EUV lithography supplier, an effective monopoly on the critical path to every advanced memory and logic node. Most recent result: Q1 2026 net sales of 8.8 billion euros, up 13 percent. Bull: a monopoly on the enabling tool with a decade-long ramp and no credible competitor. Bear: China is now removed from its market by export controls, and the valuation is priced for perfect execution.
Applied Materials (AMAT, Nasdaq) is the largest equipment company by revenue, with leadership in deposition and etch. Most recent result: Q2 fiscal 2026 record revenue of $7.91 billion, up 11 percent, and it raised its 2026 equipment-market growth outlook above 30 percent. Bull: every dollar of new DRAM and HBM capex flows disproportionately through its deposition tools. Bear: growth stalls when the memory capex cycle peaks.
Lam Research (LRCX, Nasdaq) makes the etch and deposition tools critical to 3D NAND and DRAM scaling, with DRAM now a record 39 percent of systems revenue. Most recent result: Q3 fiscal 2026 revenue of $5.84 billion, up 24 percent, its third straight record. Bull: HBM-driven etch intensity is structurally higher, making Lam the clearest equipment beneficiary. Bear: high memory customer-concentration means a Micron or SK Hynix capex cut hits hard.
The China threat
CXMT (ChangXin Memory Technologies) is China’s largest DRAM maker, state-backed, on a roughly 16nm DUV-only node with no EUV access, holding an estimated 5 to 8 percent of global DRAM revenue and rising. It is not publicly tradeable as of June 22, 2026 (a Shanghai STAR Market IPO is pending), so there is no ticker for trading purposes. Bull (for CXMT, bear for Micron): rapid share gains in commodity DDR4 and DDR5 at sub-market prices could compress ASPs in Micron’s lower-margin floor business. Bear (for CXMT): the EUV export-control ceiling traps it on older nodes with no meaningful HBM through 2027, so the big three can absorb commodity share loss by prioritizing HBM.
What the filings say
The filings tell a single dramatic story: the steepest financial recovery in the company’s history, achieved with the best balance sheet it has ever carried, and management telling you plainly that it will not last.
The cyclical swing in revenue and margin. Annual revenue went from the $15.54 billion fiscal 2023 trough (a $5.74 billion operating loss, roughly $5.83 billion net loss, gross margin negative 9.1 percent) to $25.11 billion in fiscal 2024 to $37.38 billion in fiscal 2025. Then the acceleration: the single Q2 fiscal 2026 quarter at $23.86 billion was nearly the entire revenue of fiscal 2023. Gross margin ran from negative 9.1 percent at the trough through 22.6 percent, 35.8 percent, to 74.4 percent in Q2 fiscal 2026, with the next quarter guided to about 81 percent. That is a 40-plus-point margin swing from trough to guide, the textbook signature of a fixed-cost fab where small pricing moves become huge margin swings.
The bottom line, corrected. Q2 fiscal 2026 GAAP net income was $13.79 billion, with diluted EPS of $12.07 GAAP and $12.20 non-GAAP. (An earlier data-capture step in this research mangled some dollar figures; the numbers here are reconstructed from the actual Q2 press release and 8-K.) For the first half of fiscal 2026, net income was $19.03 billion. For comparison, full-year fiscal 2025 net income was $8.54 billion and the company earned essentially nothing in fiscal 2023.
Segments and geography. Cloud Memory carried the step-change, growing from $3.79 billion in fiscal 2024 to $13.52 billion in fiscal 2025. By Q2 fiscal 2026 the two data-center units were 56 percent of revenue. Geographically, the United States surged to 64.5 percent of fiscal 2025 revenue (up from about 49 percent in fiscal 2023) as AI demand concentrated domestically, while China fell to 7.1 percent (down from about 14 percent) after the 2023 ban, a point this piece returns to below.
Cash flow and the balance sheet. This is the genuinely strong part. Q2 fiscal 2026 operating cash flow was $11.90 billion, net capex $5.0 billion, and adjusted free cash flow $6.9 billion in the quarter. Total debt fell from $14.58 billion at fiscal 2025 year-end to $10.14 billion by February 2026, cut by over $5 billion across three quarters via prepayments. With about $16.6 billion of liquidity, Micron is net cash positive by roughly $6.5 billion. There is no maturity wall in sight. Management raised the dividend 30 percent, from $0.115 to $0.15 per quarter, a confidence signal, though at this price the yield is effectively zero.
Capital intensity and the build-out. Here is the structural cost of all of this. Fiscal 2026 capex is guided above $25 billion net of incentives, the largest program in company history, raised twice during the year. And construction-related capex alone is guided to step up by more than $10 billion in fiscal 2027 as the Idaho and New York fabs move from site prep to tooling. Depreciation, which sits almost entirely in cost of goods sold, was $8.35 billion in fiscal 2025. New fabs add depreciation at scale once equipment is installed, which compresses gross margins during ramp, before yields mature. That is the double-edge: the spending that builds the franchise is also the fixed cost that turns a downturn into a loss.
Management’s own framing. The CEO confirmed that all of calendar 2026, including HBM4, is sold out under contract, and that the company can meet only 50 to 67 percent of demand. He also signed the first five-year strategic customer agreement, a real shift from annual procurement toward visibility. But management has been just as plain in the other direction: current margins are explicitly described as not sustainable. That is unusually candid for a company at a peak, and it should anchor the read.
The risk factors Micron itself discloses. The 10-K leads with cyclicality and ASP volatility, the existential bear case in the company’s own words: increases in supply not matched by demand lead to price declines, and given the fixed-cost base, margins collapse rapidly. It discloses the China and export-control overhang on both sides. It discloses customer and end-market concentration: over half of revenue from the top ten customers, roughly half from the data-center end market. And it carries the capital-commitment and execution risk of a multi-decade, $125-billion-plus US fab program with milestone-gated CHIPS Act funding.
Insider and institutional signal. The CEO has made 63 sell transactions over five years and zero open-market buys, all under pre-arranged 10b5-1 plans, consistent with estate planning and diversification rather than a directional signal. Worth noting, though: there were no open-market purchases by management at any point during the fiscal 2023-2024 downturn when the stock traded between $85 and $130. Management signaled confidence through buybacks, a corporate action, not personal conviction. Ownership is about 84 percent institutional and overwhelmingly passive (Vanguard and BlackRock the largest holders), with no activist or concentrated position.
What the market is paying
All figures here are point-in-time as of June 22, 2026, and the pre-earnings caveat from the top of the piece applies with full force: this section will likely be stale within 48 hours of the June 24 print.
Price and performance. The stock closed at $1,211.38, up 6.82 percent on the session, sitting at the very top of a 52-week range of $103.38 to $1,213.56, essentially at an all-time high, with a market cap around $1.35 trillion on about 1.128 billion shares. The one-year return is the cleanest big number: roughly 880 percent off the August 2025 low. Year-to-date 2026 the figure is disputed across data vendors (somewhere in the range of up 3 to 4 times), so treat it as a range, not a point. Against the field, Micron massively outran the semiconductor index (up roughly 90 to 113 percent YTD) and the Nasdaq-100 (up roughly 19 to 21 percent), running about in line with SK Hynix and ahead of Samsung. The market is paying a premium for Micron’s US-domiciled status and HBM optionality.
This is a violent stock. Beta is 2.17, confirmed by two sources, and 14-day realized volatility was about 117 percent annualized, extreme even for a cyclical semiconductor. The stock moves $60 to $100 on an average day. For context, Micron fell roughly 55 percent from its prior high into the August 2025 low, and 40-to-65-percent peak-to-trough moves are the norm for this name. Position sizing, not stop-losses, is the realistic risk lever here.
The valuation, and the cyclical trap framed both ways. This is the heart of the matter, so let me be precise and two-sided.
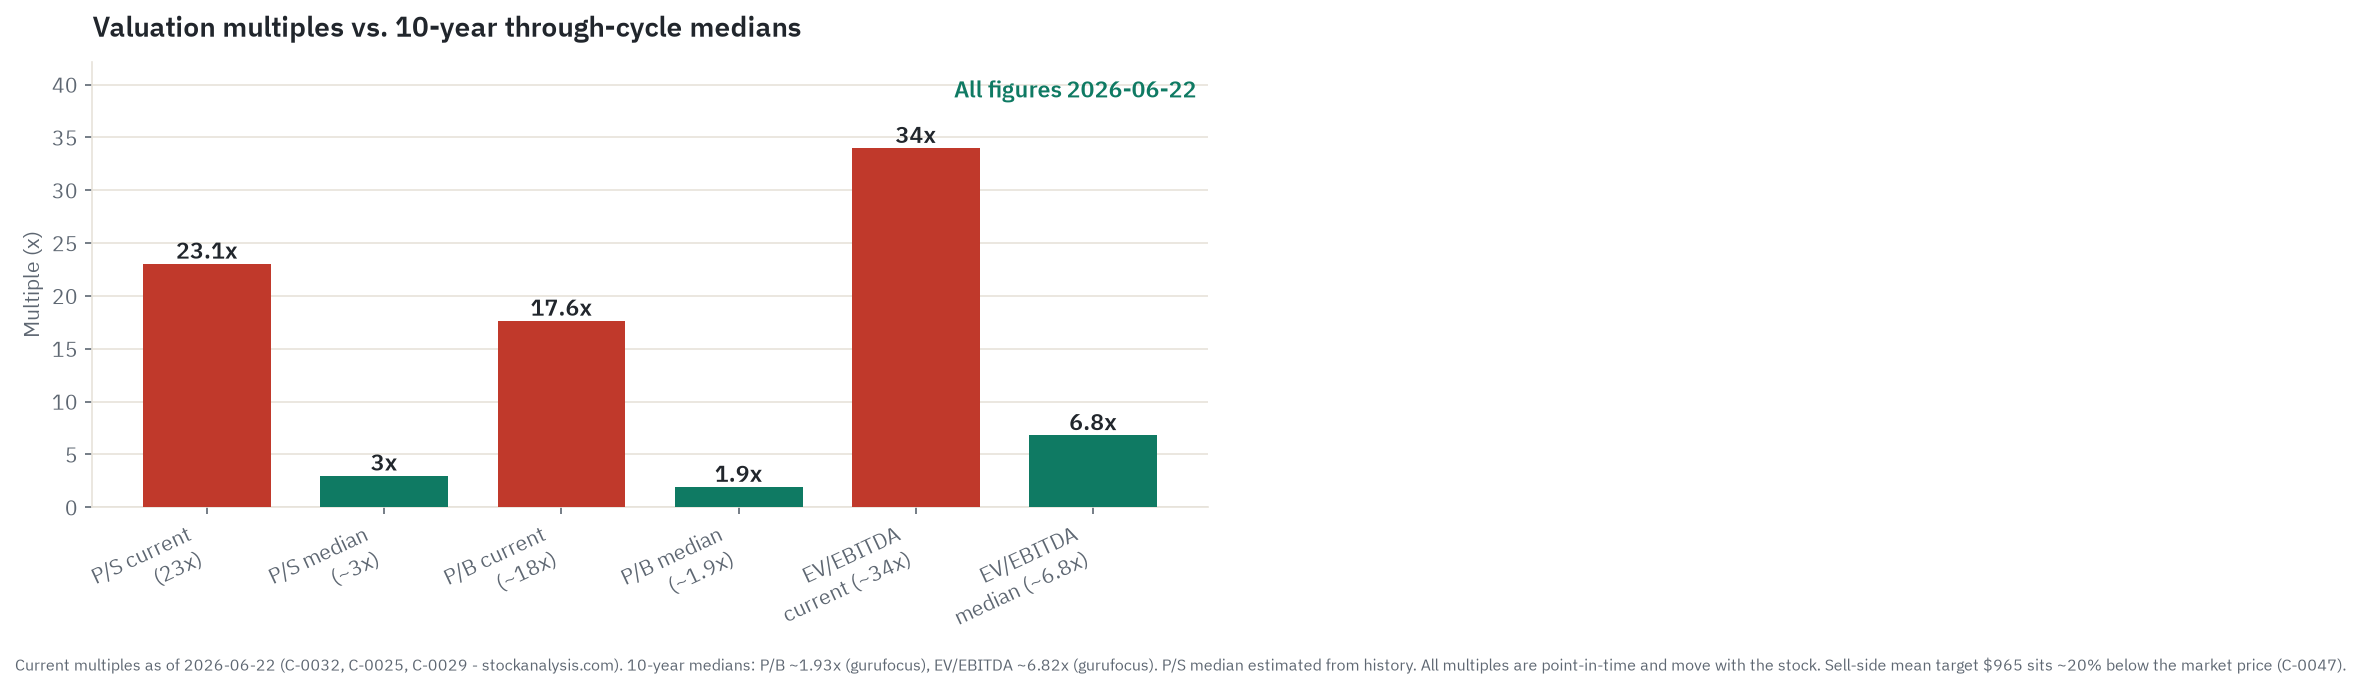
The number that attracts buyers is the forward price-to-earnings ratio of about 10 to 12 times (it moves daily and differs by vendor; the figure is disputed in the 10.5-to-11.7 range). On consensus forward estimates, the stock looks optically cheap, cheaper on future earnings than many consumer-staples names. Here is the trap, stated plainly: that forward multiple is computed on peak earnings. It is the exact setup the stock had at prior tops. In fiscal 2022, Micron’s trailing P/E was 7.39 times because earnings were near peak, and the very next year earnings went negative. A low forward P/E on peak EPS is the historical sell signature, not a buy signal. The moment pricing rolls, the denominator collapses and the “cheap 10x” resets to 25 or 30 times on the new, lower number, while the stock has already repriced down.
Now the metrics that do not flatter a cyclical at its peak, because they do not depend on the earnings phase. Price-to-sales is about 23 times, against a historical 2 to 5. Price-to-book is in the high teens, roughly 18 times, against a 10-year median near 1.93 (about ten times the median). EV/EBITDA is roughly 31 to 37 times depending on construction, against a 10-year median around 6.8. All three are computed on peak revenue and peak EBITDA. Price-to-sales is the cleanest tell because it is immune to earnings-phase distortion: paying 23 times sales means the market is pricing an assumption that revenue does not revert, on a company whose revenue fell 49.5 percent peak-to-trough as recently as four years ago. These are not commodity-cyclical multiples. They are hypergrowth-tech multiples, and the question the whole piece exists to answer is whether the structural-shift premium is earned.
The sell-side does not validate the price. Consensus is Strong Buy on paper (44 analysts, 39 positive), but the mean price target is $965.35, roughly 20 percent below the June 22 close, with a high of $1,750 and a low of $249. The market has simply run through even the upgraded consensus. The most credible bear voice is Goldman Sachs, which maintains Neutral and, even after doubling its target to about $900, still sits below the market, explicitly arguing today’s margins are a cycle peak, not a floor. The fact that the average target sits below the price is not a contradiction to resolve; it is itself the data point. Treat all targets as opinion anchored to models built before the June 22 surge.
Liquidity, shorts, and the setup into earnings. Micron is one of the most liquid names on the Nasdaq, about $66 billion of daily notional. Short interest is low at 3.34 percent of float, 0.7 days to cover, so there is no squeeze fuel. The 6.82 percent gain on June 22 came on below-average volume, which suggests options delta-hedging and pre-earnings re-positioning more than a wave of new buyers. The options market priced a 14-to-17-percent one-day move into the June 24 report, nearly four times the stock’s average post-earnings move over the prior four quarters. That describes a binary: the stock has already moved to record highs pricing a strong quarter, so a miss or a cautious next-quarter guide would close much of the cheap-forward-earnings argument fast.
What the crowd is saying
Sentiment is soft data; treat all of it as signal, not fact.
The dominant narrative as of mid-June 2026 is “AI-memory supercycle validated by record earnings, with June 24 as the confirmation.” Coverage warmed steadily after the March results and crescendoed when Micron crossed $1 trillion in market cap on May 26, a single +19 percent session triggered by a UBS target of $1,625. In the two weeks before earnings, a wave of aggressive analyst target raises landed (Rosenblatt to $1,200, Stifel to $1,500, UBS to $1,625, and others), all citing HBM scarcity. One caution about that wave: analysts issuing upgrades a week before earnings, after the stock has already rallied, is a well-documented momentum-chasing pattern that can manufacture the appearance of independent confirmation when the opinions are partly correlated with recent price action. The credible bear voice, Goldman, is credible precisely because it did not join the wave.
Retail sentiment is bullish but not euphoric. On the June 22 up-day, message-board sentiment skewed Neutral rather than all-in long, which itself is a tell: retail is positioned but waiting for the earnings confirmation. There is no evidence of coordinated promotion or thin-float manipulation, and there could not be: at $1.35 trillion with $66 billion of daily notional and 84 percent institutional ownership, pump-and-dump mechanics are structurally impossible. The viral options-gain post that seeded a lot of the retail FOMO dates to early 2026 at a much lower price; it is a historical artifact, not a current buy signal.
The useful part is where the crowd’s story diverges from the filings. The crowd’s story is that Micron has permanently re-rated from commodity cyclical to AI-infrastructure supplier and “looks cheap” at 10 to 11 times forward earnings. What the filings and cycle history show is three frictions. First, the mean analyst target sits 20 percent below the price, so the market is pricing something more optimistic than even the sell-side that just tripled its targets. Second, the 23-times-sales and 18-times-book multiples are defensible only if revenue does not revert, which every prior cycle has done. Third, the “cheap forward P/E” embeds peak-cycle estimates, the identical setup to fiscal 2022 before the fiscal 2023 loss. The sharpest divergence is the simplest: the market is paying 23 times revenue on the assumption revenue does not revert, and the crowd has not priced reversion risk, it has assumed it away. In the other direction, the crowd may actually underprice the CHIPS Act and US-domicile premium, which is genuinely non-cyclical and absent from standard memory-cycle models.
The economics: what governs the cycle and whether it is durable
Pull the threads together and the durability question resolves into one distinction: a structurally larger demand pool sitting on top of a structurally unchanged cost machine.
The demand is real and partly self-sustaining. Hyperscaler AI capital spending is funded by free cash flow rather than borrowing, the counterparties are investment-grade, and the constraint is supply-side (power, chips, real estate), not demand-side. Each hyperscaler builds defensively because falling behind on AI compounds into lost cloud share, and the spending is chasing actual, disclosed revenue rather than a speculative one, unlike the telecom boom of 1999. So the level of AI spending is durable for 2026 and 2027 under any plausible base case. What is contested is the growth rate. One advisory view (AL Capital) models hyperscaler capex growth decelerating sharply from a very high 2026 rate into the low double digits in 2027 and lower in 2028; Goldman argues the opposite, that 2027 consensus is too low and growth runs nearer 45 percent. Both are attributed estimates, and the underlying “$725 billion 2026 capex” and “30 percent of capex is memory” figures trace to thinly-sourced industry estimates, so hold them loosely. A deceleration in the growth rate, not a reversal, is the more likely 2027-2028 setup, and a deceleration is all the bear case needs.
The cost machine has not changed. A fab is 60 to 70 percent fixed cost, depreciation runs through cost of goods sold regardless of utilization, and incremental revenue flows to gross profit near 90 cents on the dollar in both directions. That is why a roughly 2.5x revenue move from trough to peak historically produces a near-40-point gross-margin swing. The fiscal 2026 capex above $25 billion and the fiscal 2027 step-up commit new-fab depreciation at the top of the cycle, which is exactly the amplifier that turns a normal downturn into a loss if the trough arrives before the new assets are producing.
So the most likely outcome is a split decision, and it is the base case behind the lede chart: a real structural upcycle that nonetheless turns, because structural demand has never immunized this industry against an inventory cycle, but turns to a higher floor than before, because HBM and long-term agreements have genuinely reallocated the best wafers and added visibility the industry never had. The bull’s burden is to prove the floor moved permanently; the bear’s burden is almost nothing, because mean-reversion is the base rate.
The scenarios in detail
The five-year outcome is decided by four variables. Everything below is just different settings of these knobs.
- DRAM and HBM pricing and the cycle phase. The master variable. Pricing flows to gross profit near 90 cents on the dollar in both directions, so when pricing rolls, margin collapses faster than revenue.
- HBM mix and the wafer governor. HBM eats three to four times the wafer area per gigabyte and about 23 percent of all DRAM wafer starts, structurally starving commodity supply. The bull needs this to extend past 2026; the bear notes sold-out-2026 is not sold-out-forever and that HBM economics are inference, not disclosure.
- Capacity versus demand growth, 2027-2028. Micron’s Idaho fab, SK Hynix’s Yongin, and Samsung’s P4/P5 all reach volume together in 2027-2028, two to three years after the decisions were made at the top, against a demand growth rate that is widely (if contestedly) modeled to decelerate. Synchronized supply meeting decelerating demand is the textbook glut mechanism.
- The multiple, and the China and NAND low end. Whether the market keeps paying 23 times sales and 18 times book, and whether CXMT and YMTC break the low-end floor on the way down.
Every dollar figure below is illustrative estimate-tier arithmetic stamped to the stated assumptions, and matches the lede chart exactly. None is a price target.
Bull: “this time is different” holds
HBM stays above 50 percent of DRAM revenue at above 70 percent gross margin through 2027, the wafer governor holds, 2027-2028 capacity gets absorbed as fast as it lands, hyperscaler capex growth runs nearer Goldman’s 45 percent, and the market grants a permanent re-rating to AI-infrastructure status at roughly 25 to 28 times sustained. Revenue compounds from the $130-to-$140-billion 2026 run-rate toward $160 to $180 billion, gross margin holds above 70 percent, and EPS climbs toward $85 to $95 by fiscal 2030. Illustrative arithmetic: roughly $85-95 EPS times roughly 25-28x gives about $2,100 to $2,650, and the 5-year path level is about $2,400. What has to be true is two full years without a pricing roll, which has no precedent in the data set. The single thing most likely to break it is any one hyperscaler trimming 2027 capex guidance, because that demand single-point-of-failure flows straight to Micron’s HBM.
Base: the cycle turns, but to a higher floor
Pricing peaks around Q1 to Q2 2027, then blended margin pulls back from 80-plus percent toward the 60-to-65 range as new supply lands and some contracts renew lower; HBM holds up better than commodity because of longer contracts and higher margin. The multiple de-rates from peak-cycle extremes toward a cyclical-aware roughly 20 times on mid-cycle earnings. Revenue settles toward $50 to $65 billion through-cycle, gross margin normalizes to the 40-to-50 range, and normalized EPS recovers from the high teens toward $45 to $65 mid-cycle. Illustrative arithmetic: mid-cycle roughly $55-65 EPS times roughly 20x gives about $1,100 to $1,300, and the 5-year path level is about $1,250, roughly flat from today with a deep drawdown and recovery in between. What has to be true is that HBM and long-term agreements genuinely raise the trough floor (mid-30s gross margin versus negative 9.1 percent in fiscal 2023). The single thing most likely to break it is the new-fab depreciation amplifier: the capex step-up adds fixed cost at the top, deepening any margin compression if the trough arrives before the assets produce.
Bear: classic cyclical mean-reversion (the skeptic’s case)
A 2027 inventory digestion. Hyperscalers over-order on long-term agreements through 2026, then find consumption below commitments and slow spot buying; channel inventory drifts from 2-4 weeks toward 8-10; spot leads contract down and pricing that took two years to inflate rolls in two to three quarters. NAND breaks first (no wafer governor, YMTC outside the oligopoly), commodity DRAM follows as CXMT presses the low end, HBM holds longest but cannot offset a blended decline. The multiple fully mean-reverts, the “cheap 10x” resets to 25-30 times on the lower number, and sales and book multiples revert toward historical peak-cycle bands. Revenue falls 30 to 50 percent from peak, gross margin compresses toward 30 to 40 percent (possibly toward zero in the severe analog given the new-fab depreciation), and trough EPS lands somewhere around $8 to $12 (the $5-to-$15 figure is single-source and illustrative). Illustrative arithmetic: trough roughly $8-12 EPS times roughly 30x on the collapsed denominator gives about $240 to $360, or roughly $120-150 normalized book times roughly 2-2.5x gives about $240 to $375, and the 5-year path level is about $280. What has to be true is only the same mechanism that ended every prior cycle, no exotic assumptions and no “AI is a bubble” required. The single thing most likely to break the bear (and save the bull) is HBM demand genuinely decoupling from the commodity inventory cycle so blended ASPs hold even as PC and smartphone memory softens.
Catalyst timeline and what to watch
Near term: the June 24 earnings print and the next-quarter guide (the binary the whole valuation prices); late-2026 hyperscaler earnings for the first 2027 capex guidance; 2027 HBM contract negotiations. Multi-year: Micron’s Idaho fab first wafers in the second half of 2027, when synchronized new capacity lands; the 2027-2028 capacity-versus-demand collision; New York fab production around 2030. The leading indicators a reader can actually watch, in order of value: spot DRAM and HBM pricing flattening for two-plus weeks (the earliest tell, spot leads contract down); any hyperscaler trimming 2027 capex guidance; channel inventory drifting above 8 to 10 weeks; whether CY2027 reaches firm sold-out status at held pricing the way 2026 did; and NAND, which breaks first. The bear flips live the quarter a hyperscaler trims 2027 capex while spot flattens.
Companies to watch (bull / base / bear)
Micron (MU). Role: the only US-domiciled HBM maker, the cleanest US-listed pure-play on the memory cycle. Bull: HBM sold out, US-domicile premium, node leadership. Base: a wide-amplitude round trip as the cycle peaks around 2027 and normalizes to a higher floor. Bear: a 2.17-beta stock at 23 times peak sales and 18 times book mean-reverts the way it has after every prior peak. Watch: spot pricing and the next-quarter guide.
SK Hynix (000660.KS). Role: the HBM franchise leader and the demand-side bellwether for the whole group. Bull: dominant share, NVIDIA lock-in. Base: peak margins normalize but it keeps the lead. Bear: a 72 percent operating margin is a peak; Korea-listed and inaccessible to most US retail. Watch: its HBM4 and HBM4E ramp versus Samsung’s recapture.
Samsung (005930.KS). Role: the scale giant and the share wildcard. Bull: HBM recapture above 30 percent is real upside. Base: it stabilizes at number three. Bear: continued yield stumbles; illiquid ADR. Watch: NVIDIA HBM4 allocation.
NVIDIA (NVDA). Role: the demand engine, and Micron’s single largest demand dependency. Bull: Vera Rubin ramp sustains HBM pull-through. Base: growth decelerates but the level holds. Bear: any hyperscaler capex slowdown shows up in Micron’s HBM book first. Watch: hyperscaler 2027 capex guidance on the late-2026 calls. See the NVIDIA deep dive.
Risk controls
The honest risk paragraph. Micron is extreme cyclicality in a single product class. The biggest risk is the cycle turning on peak earnings, the same mechanism that produced a 49.5 percent revenue decline and a negative gross margin as recently as fiscal 2023. The valuation amplifies it: 23 times peak sales and 18 times peak book leave no margin for error, and the consensus target already sits 20 percent below the price. Customer concentration is real: a single customer (widely understood to be NVIDIA, though the 10-K does not name it) is about 17 percent of revenue and the top ten are over half, so a demand air-pocket at one or two accounts is the fastest path to the bear case. The capital intensity is a fixed-cost trap in a downturn: the fiscal 2027 capex step-up commits new-fab depreciation at the top. China and export controls cut both ways. And the stock itself, at a 2.17 beta with 117 percent realized volatility and trading $60 to $100 a day, is not a name where tight stops function; position sizing is the realistic lever. The thing that would change the call toward the constructive side is a cycle-aware re-rating that compresses the through-cycle multiples combined with held 2027 capex guidance; the thing that would change it toward the negative is the first visible pricing roll. There is also a hard, dated caveat baked into this specific moment: Micron reports on June 24, two days after this research date, and a large move in either direction is entirely possible.
Methodology, sourcing, and data-quality flags
This is a company-mode deep dive built from parallel research streams: the value chain and money flow; the SEC filings (10-K, 10-Q, 8-Ks, Form 4 and 13F); the market action and valuation; OSINT and social sentiment; the macro and micro economics of the memory cycle; the HBM and AI-memory opportunity; the DRAM/NAND cycle base rate; end markets; capex, fabs, and the CHIPS Act; the competitive set and supply discipline; and China, CXMT, and export controls. Every load-bearing figure traces to a claim in the ledger with a source and a tier (primary filing, analyst, press, or estimate). The source hierarchy: company financials are primary (Micron IR releases, SEC 8-K and 10-K, cross-confirmed against stockanalysis.com and filing extractions); market and valuation figures are point-in-time press-tier from market-data vendors; share, pricing-forecast, and competitor-capability figures are analyst-tier (TrendForce, Counterpoint, Omdia, IDC), attributed and ranged; sentiment is the softest, treated as signal only.
On the five-factor read, in plain prose rather than scores. Valuation nets to mildly-to-clearly expensive on a through-cycle basis: the forward P/E of about 10 to 12 times looks cheap but sits on peak EPS (the fiscal 2022 sell-signature repeated), while the cycle-proof metrics are rich (about 23 times sales, about 18 times book, roughly 31-37 times EV/EBITDA on peak revenue and EBITDA), and the mean target sits 20 percent below the price with Goldman Neutral at about $900 calling the margins a peak. Growth is strong but cyclical-peak, not durable compounding: Q2 revenue up 196 percent, the next quarter guided to $33.5 billion at roughly 81 percent margin, with a genuinely larger structural HBM draw on wafers earning real credit, offset by management’s own statement that current margins are not sustainable. Quality is genuinely high with a cyclical asterisk: the best balance sheet in company history (net cash roughly $6.5 billion, liquidity about $16.7 billion, debt cut over $5 billion in three quarters, dividend up 30 percent, roughly $6.9 billion of quarterly free cash flow), against the structural fixed-cost fragility and the new-fab depreciation being committed at the top. Risk is the dominant negative: a 2.17 beta and about 117 percent realized volatility at the top of the range, single-customer and top-ten concentration, a thesis that hinges on hyperscaler capex not decelerating, Chinese commodity entrants that can break the low end, HBM economics that are inference not disclosure, and an unseen binary earnings print two days out. Momentum is mildly positive but soft and two-sided: a roughly 880 percent run and a target-raise wave, against an overbought RSI, the move into the print on below-average volume, and a consensus target that sits below the price. Putting those together, the overall lean lands at Hold: a high-quality franchise in a real structural upcycle, trading above its own analyst consensus at a cycle peak on cycle-proof multiples, with the single largest factor firmly negative. The read does not support chasing it here, and it does not support shorting a sold-out HBM book either. It would move toward the constructive side if the through-cycle multiples compress on a cycle-aware re-rating and a clean print plus held 2027 capex guides de-risk the cyclicality; it would move toward the negative side the moment the first pricing roll appears.
Data-quality flags:
- A data-capture step in this research stripped the leading dollar sign (and in some cases a leading digit) from many figures in the raw ledger. Every dollar figure in this article was reconstructed from the actual filings and the verifier’s corrected report. The clearest examples: Q2 fiscal 2026 net income is $13.79 billion (not $3.785 billion) and GAAP EPS is $12.07 (not $2.07).
- Point-in-time market data (price, market cap, all multiples, moving averages, short interest) is as of June 22, 2026, and moves daily. Forward P/E, trailing P/E, P/B, and EV/EBITDA differ by vendor and by GAAP-versus-adjusted and trailing-versus-forward definitions; they are presented as ranges with the date.
- HBM is not a reported financial line item. Micron does not break out HBM revenue or margin; the roughly $8 billion annualized run-rate and the margin-accretion story are estimates from earnings-call color (analyst and estimate tier), not filing facts.
- HBM and DRAM market shares bounce by research house and quarter (Counterpoint versus TrendForce versus Omdia, revenue versus bits). They are cited with the house and presented as ranges; the rank order is consistent, the exact splits are not.
- Q3 fiscal 2026 figures ($33.5 billion revenue, roughly 81 percent margin, $19.15 non-GAAP EPS) are guidance, not results. Actuals are due June 24, 2026; every Q3 figure is labeled guidance.
- Sell-side price targets are opinion, and the $965.35 mean sits about 20 percent below the market price, which is itself a notable data point rather than a contradiction.
- China and competitor claims are framed precisely and attributed. The May 2023 CAC purchase ban citing “serious cybersecurity problems” is stated as a regulatory action Micron disclosed in an 8-K, attributing the cybersecurity characterization to the CAC, not endorsing it. YMTC’s December 2022 Entity List addition and the December 2024 BIS HBM export controls are stated as applied. CXMT’s listing on the DoD 1260H military-company list is presented as reported and attributed. CXMT’s commodity-price-suppression capability is presented only as an attributed analyst view (the 2024 DDR4 episode of a roughly 30 to 40 percent move); the disputed module-price figure from a social-media post is cut. Competitor capability and capacity claims are attributed to the named analysts.
- The macro demand pillars ($725 billion 2026 hyperscaler capex, “30 percent of capex is memory,” the capex deceleration path) are contested estimates, presented two-sided: the deceleration view is one advisory’s, and Goldman publicly argues the opposite (roughly 45 percent 2027 growth).
Key sources: Micron FY2025 10-K and FY2023 10-K (SEC, primary); Micron Q1 and Q2 FY2026 10-Q and 8-K earnings releases (SEC and IR, primary); Micron IR HBM4 production release; stockanalysis.com and Yahoo Finance (market data, press); TrendForce, Counterpoint Research, Omdia, IDC, Yole Group (analyst); Goldman Sachs, UBS, and other sell-side notes (analyst opinion, via press); CNBC, Reuters, Tom’s Hardware, Digitimes, TechCrunch (press); US Commerce/NIST and BIS (CHIPS Act and export controls, primary); Baker McKenzie sanctions blog (analyst). Full per-figure provenance is in the run’s claims ledger.
Prepared June 22, 2026. Figures are point-in-time and will change. This is research and analysis for educational purposes - not investment advice, not a recommendation, and not a solicitation. Memory is one of the most cyclical commodity businesses in technology; valuations and earnings can swing violently with the DRAM and NAND price cycle, and Micron reports fiscal Q3 2026 on June 24, 2026, so these figures and scenarios may move sharply right after publication. Verify all figures independently and consult a licensed financial advisor before making any decision.