
Research date: July 1-2, 2026 | OSINT market research on Seagate Technology Holdings plc (STX, Nasdaq), a company-mode deep dive for retail investors.
Important disclaimer. This is OSINT-based research and educational analysis, not investment advice. I am not a financial advisor. Nothing here is a recommendation to buy or sell any security, and the scenarios below are illustrative, not price targets. STX’s stock has moved more than sixfold over the trailing year and swung double digits across the trading sessions bracketing this research date alone, so treat every figure below as a snapshot, not a fixed fact. Market caps, prices, valuation multiples, and market-share figures are point-in-time (July 1-2, 2026), press-reported where noted, and move fast. Do your own due diligence and consult a licensed advisor.
Where this stock could be in 6 months, 1 year, 3 years, and 5 years
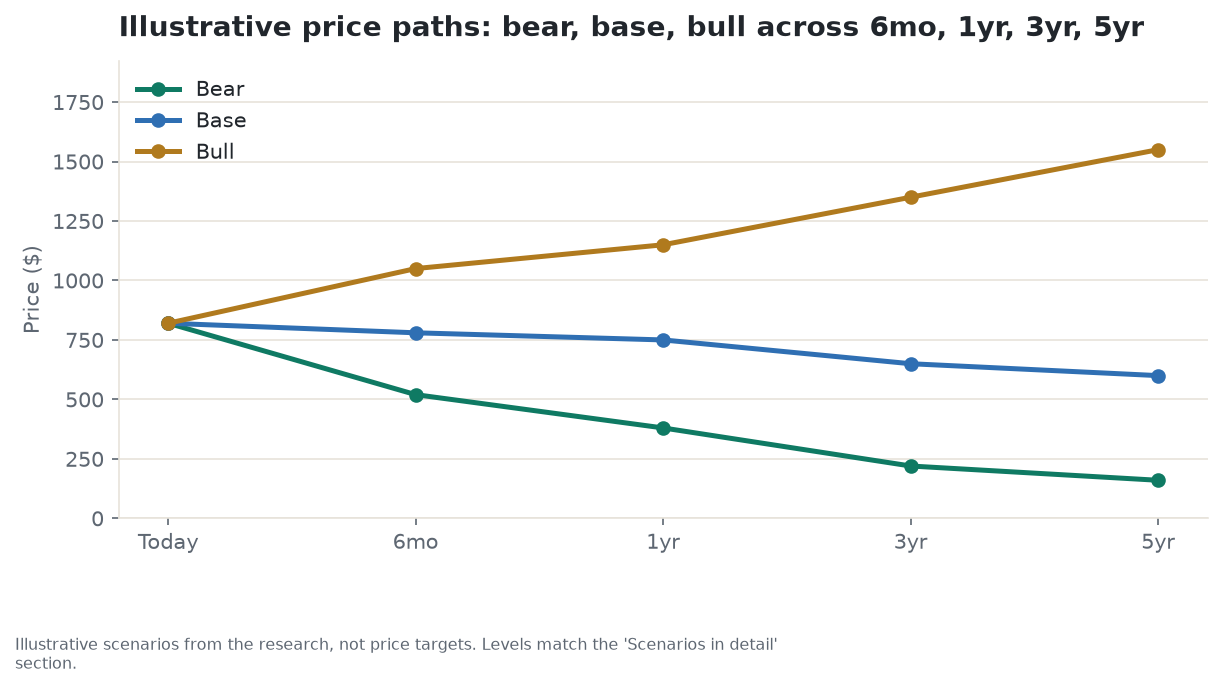
6 months. This window is dominated by two things: the fiscal fourth-quarter earnings report expected around late July 2026, and whether the AI-memory sector pullback already underway at this research date stabilizes or deepens. Management has guided to $3.45 billion in revenue and $5.00 in non-GAAP diluted earnings per share. A print near that guidance, with steady commentary on the next-generation drive ramp, points toward the base case, around $780. A beat with confirmation that two more large customers have moved from testing to buying in volume points toward the bull case, near $1,050. A miss, or signs that worries about AI spending peaking are gaining real traction with big customers, points toward the bear case, near $520. The single number that flips this window is whether pricing for the highest-capacity drives holds or shows its first sign of softening.
1 year. By mid-2027 the market will be judging whether Seagate’s current technology lead over its only rival, Western Digital, widened or narrowed. The base case, near $750, assumes growth cools to a still-healthy pace as pricing normalizes somewhat and Seagate roughly holds its lead. The bear case, near $380, assumes Western Digital closes the gap and Seagate’s more leveraged balance sheet becomes a bigger liability if growth slows. The bull case, near $1,150, assumes the lead widens and demand stays strong enough to push the stock back toward its all-time high.
3 years. This horizon is where the technology race and the industry’s pricing discipline either hold or crack. The base case, near $650, assumes durable but slower growth and continued debt paydown. The bear case, near $220, assumes a genuine down-cycle, the kind this industry has produced before, arriving while Seagate’s own leverage amplifies the pain and Western Digital catches up on technology. The bull case, near $1,350, assumes Seagate turns its current lead into a multi-generation advantage while the two-company market keeps choosing margin discipline over a price war.
5 years. By 2032 the question that matters most is structural: does the falling cost of flash memory keep closing the gap with hard drives in the coldest, cheapest storage tier, the one place hard drives still clearly win on economics? If that gap keeps closing, the bear case, near $160, plays out. If hard drives keep their edge and Seagate keeps its technology lead, the outcome lands closer to the base case, near $600, still below today’s price because it assumes the current rich valuation eventually normalizes, or the bull case, near $1,550, if AI-era data retention permanently enlarges the amount of storage that needs exactly what a hard drive is good at.
Where the read lands today. On balance, the five-factor read holds at Hold: a real technology leader within a two-company market, riding genuine AI-datacenter demand that just had its first sector-wide wobble, priced at a considerably richer multiple than its only direct competitor, and carrying real debt that competitor does not. The single thing most likely to flip it is the fiscal fourth-quarter earnings print expected around late July 2026.
Companion tool
Jump to the interactive dashboard to sort and filter every company in this piece, or download the Excel model to flex the scenarios yourself.
TL;DR
Seagate makes hard disk drives, the spinning-platter storage devices that hold data using magnetized regions on a metal or glass disk, and it is one of exactly two companies left on earth that still does this at the scale big cloud providers need. Right now, Seagate appears to be ahead of its only rival, Western Digital, on the specific technology needed to keep cramming more capacity onto a single drive, and that lead is showing up directly in the numbers: revenue grew 44 percent last quarter, the highest-capacity drives shipped in volume grew 47 percent, and free cash flow hit its highest level in over a decade. The stock has rewarded that story enormously, running from a 52-week low near $138 to an all-time high above $1,140 in June 2026, before pulling back hard in the days around this research date alongside the rest of the AI-memory trade. The complication: Seagate trades at a much richer earnings multiple than Western Digital for a business that carries real debt, a thin equity cushion, and a longer list of unresolved legal matters, none of which show up in the headline growth numbers everyone is excited about.
Explore it yourself: the interactive dashboard
Open the dashboard in a full screen
What Seagate actually does
Seagate makes one thing: hard disk drives, the spinning storage devices that hold data using magnetized regions on a disk. Twenty years ago dozens of companies made these. Today there are two, Seagate and Western Digital. Everyone else went bankrupt, got acquired, or moved entirely to flash memory, the technology behind solid-state drives (SSDs), which has no moving parts and is faster but, gigabyte for gigabyte at very large capacities, still more expensive to manufacture.
Think of it the way the house’s own Western Digital research put it: flash memory is a card-catalog drawer, instant to flip through and increasingly cheap, while a hard drive is a filing cabinet, slower to search but holding vastly more paper per dollar. Datacenters run on both. The card catalog handles files everyone needs right now. The filing cabinet handles the much larger volume of files that need to exist cheaply, for a long time, without needing instant access.
Seagate sells into two end markets, relabeled this fiscal year specifically to reflect the AI story. Data Center is by far the largest and fastest growing: high-capacity drives sold to big cloud providers and enterprises, 80 percent of revenue and rising, with the “nearline” drives inside it (the specific high-capacity products this whole story is about) growing shipments 47 percent year over year in the most recent quarter. Edge IoT is everything else, network-attached storage, mission-critical systems, SSDs, and old-fashioned consumer and client drives, a much smaller and slower-growing 20 percent of revenue. The story of this entire article is really the story of that first number.
How the money flows
flowchart TD
    DEMAND["End demand<br/>AI training/inference datasets, hyperscaler cold/warm storage, video surveillance, edge/NAS backup"]
    HYPER["Hyperscalers + cloud/enterprise<br/>Data Center end market - 80% of STX Q3 FY26 revenue"]
    EDGE["Edge IoT: NAS, mission-critical, SSD, consumer/client<br/>Edge IoT end market"]
    RD["R&D + component design<br/>Heads, media, motors, controllers, firmware"]
    FAB["STX's own HDD manufacturing<br/>Northern Ireland, Thailand, Singapore and other SE Asia sites"]
    TECH["Recording technology tier<br/>Mozaic 4+ HAMR shipping in volume (up to 44TB); roadmap to ~10TB/disk, 100TB+ drives"]
    DUOPOLY["Global nearline/enterprise HDD supply<br/>STX and WDC - a two-company market"]
    STX_DC["STX Data Center segment<br/>~$2.5B Q3 FY26 (80% of $3.11B), nearline exabytes +47% YoY"]
    STX_EDGE["STX Edge IoT segment<br/>~$0.6B Q3 FY26 (20% of $3.11B)"]
    RETURNS["Shareholder returns<br/>$5B buyback authorized, $0.74/share quarterly dividend, debt paydown"]
    SUBSTITUTE["Competing technology<br/>NAND flash/SSD (SanDisk, Samsung, SK hynix, Micron, Kioxia) - the long-run substitution threat"]

    DEMAND --> HYPER
    DEMAND --> EDGE
    RD --> FAB
    FAB --> TECH
    TECH --> DUOPOLY
    DUOPOLY --> STX_DC
    DUOPOLY --> STX_EDGE
    HYPER --> STX_DC
    EDGE --> STX_EDGE
    STX_DC --> RETURNS
    STX_EDGE --> RETURNS
    SUBSTITUTE -.->|cost-per-bit competition, long-run| HYPER
Follow the diagram from the top. Demand starts in two places, but four dollars out of every five now come from the same place: big cloud providers and enterprises buying capacity for AI-era datacenter storage. That demand draws on a manufacturing process Seagate runs end to end, from component research through its own factories in Northern Ireland, Thailand, Singapore, and other Southeast Asian sites, precisely why the industry has consolidated to two survivors instead of the five or six a typical hardware market supports: building a drive at the cost and reliability big cloud providers demand is not something you can outsource or replicate on short notice.
The technology tier in the middle of the diagram is the real chokepoint, and right now it is where Seagate has a genuine lead. Seagate’s Mozaic 4+ drives, using a laser-assisted recording technology called HAMR, already ship in volume to two large cloud providers at up to 44 terabytes per drive, the highest capacity shipping in the industry as of this research date, with two more customers actively testing the drives ahead of an expected volume ramp later in 2026. Western Digital, by its own most recent public disclosure, still describes its customers as testing its comparable drives rather than buying them in volume. Once built, output splits back into the two end markets it came from, and the resulting cash funds Seagate’s capital return program: a $5 billion buyback authorization and a dividend of $0.74 a share, alongside continued debt paydown.
The dotted line at the bottom is the long-run risk this whole piece keeps returning to. Flash memory, made by SanDisk, Samsung, SK hynix, Micron, and Kioxia, competes for the same storage dollar on a falling cost curve, and every year that curve keeps falling is a year the economic case for hard drives in the coldest, cheapest storage tier gets a little harder to make. The toll booth in this chain is not a patent or a brand. It is manufacturing scale and, right now specifically, technology leadership in a business only two companies still run.
The two segments, in plain terms
Data Center covers high-capacity drives sold to big cloud providers and enterprises for datacenter storage. This is where essentially all of Seagate’s growth is coming from: 80 percent of the most recent quarter’s revenue, up from 75 percent a year earlier. Inside this segment, “nearline” drives, the highest-capacity products built for the coldest, cheapest storage tier, shipped 175.4 exabytes of capacity in the most recent quarter, up 47 percent from 119.6 exabytes a year earlier. Seagate’s own disclosure that its nearline capacity is largely booked through the end of calendar 2026, with next fiscal year’s supply contracts already finalized, describes demand that behaves more like a committed, multi-quarter agreement than a one-off hardware sale.
Edge IoT is Seagate’s relabeled catch-all for everything else: drives built into network-attached storage boxes, mission-critical systems, SSDs, and the old-fashioned consumer and client drives an ordinary shopper might actually recognize. At roughly a fifth of revenue and shrinking as a share of the total, this segment still carries the seasonal consumer demand swings that the Data Center business does not share.
The technology roadmap underneath both segments. Seagate’s Mozaic 4+ platform uses heat-assisted magnetic recording, or HAMR: a tiny laser briefly heats exactly the spot being written, which lets the drive pack data more densely without the written data becoming unstable at room temperature, the physical limit that eventually caps how far older recording technology can go. Mozaic 4+ ships at up to 44 terabytes using ten platters at 4.4 terabytes per disk, already qualified and in volume production with two large cloud providers, with two more actively testing the drives ahead of a second-half volume ramp. Management’s own target is for 70 percent of its highest-capacity drive output to be built on HAMR technology by the end of fiscal 2027, with a longer-run roadmap toward roughly 10 terabytes per disk that would eventually enable drives beyond 100 terabytes. Western Digital, as of its own most recent roadmap update, describes its customers as still testing its comparable HAMR drives rather than buying them in volume, a real, if contestable, technology gap that is the single most important variable behind why Seagate currently commands a richer valuation than its only rival.
Who wins where
The hard-drive industry has consolidated to a genuine two-company market, and the economics sort cleanly around who controls that scarcity.
The duopoly itself. Seagate and Western Digital are the only two companies left that design and manufacture hard drives at the scale big cloud providers need. That narrow a supplier base is unusual for any hardware category and is the direct reason both companies have been able to raise prices at the same time they are shipping more capacity, a combination that only happens when demand is genuinely outrunning supply.
The technology leader within the duopoly, for now. As of the most recent public disclosures, Seagate is a step ahead of Western Digital specifically on HAMR, the recording technology both companies need for the next capacity tier. Seagate has its Mozaic HAMR drives already in volume production with two large customers, while Western Digital describes its own HAMR drives as still being tested by customers. That gap, if it persists even one more product cycle, is a real mechanism for share to shift within the duopoly, not just a talking point, though it is also a lead Seagate has to keep defending, not a fixed advantage.
The systems layer, one step removed. NetApp and Everpure (the company formerly known as Pure Storage) build the finished storage systems that big customers actually buy, using drives sourced from Seagate, Western Digital, and flash suppliers. Neither competes with Seagate directly for the same drive-manufacturing dollar, but both are useful cross-checks: NetApp’s much slower single-digit revenue growth, next to Seagate’s 44 percent, shows how much of the current AI storage windfall is being captured at the component-manufacturing layer rather than passed through to the systems layer, while Everpure’s all-flash pitch is the clearest systems-level embodiment of the long-run substitution risk that runs through Seagate’s own bear case.
The scale players one step removed. Micron makes DRAM, NAND, and high-bandwidth memory, and its results are a useful gauge of how far the broader AI-storage-and-memory re-rating has spread beyond any single company’s story.
Company by company: who’s who
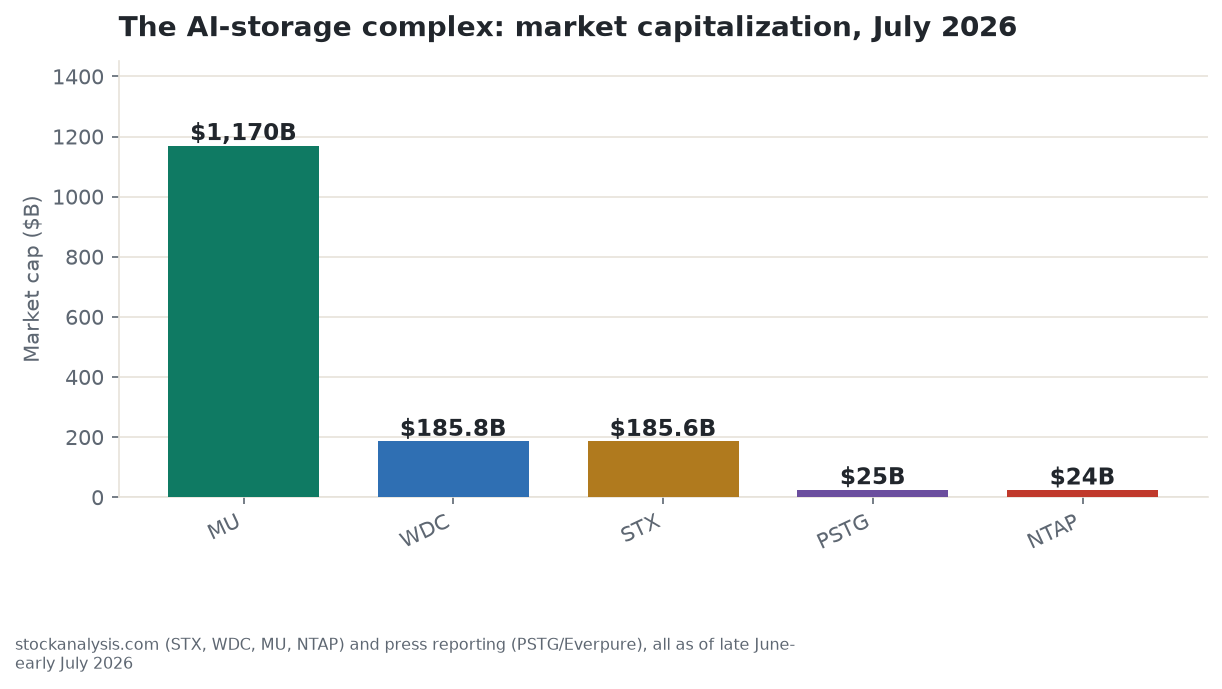
Seagate Technology Holdings plc (STX, Nasdaq). One of exactly two companies in the world that still designs and manufactures hard disk drives at scale, and currently the technology leader within that duopoly on HAMR recording technology. Market capitalization approximately $185.56 billion as of July 2, 2026. Third-quarter fiscal 2026 revenue was $3.11 billion, up 44 percent year over year, with GAAP gross margin of 46.5 percent, and nearline exabytes shipped grew 47 percent year over year. Bull: Seagate’s Mozaic HAMR platform is already qualified and shipping in volume to two large cloud providers, ahead of Western Digital on the technology both companies need for the next capacity tier, in an industry where nearline capacity is booked out through the end of 2026. Bear: Seagate carries real net debt (roughly $2.72 billion) against an unusually thin equity base, trades at a much richer earnings multiple than Western Digital, and faces the same long-run flash-memory substitution threat as the rest of the hard-drive industry.
Western Digital Corporation (WDC, Nasdaq). The other half of the global hard-drive duopoly, and Seagate’s only direct, scale competitor. Market capitalization approximately $185.78 billion as of July 1, 2026, essentially tied with Seagate’s own. Third-quarter fiscal 2026 revenue was $3.34 billion, up 45 percent year over year, with a net-cash balance sheet funding a $6 billion buyback program and a dividend just raised 20 percent. Bull: the same AI-datacenter demand surge lifting Seagate is lifting Western Digital, from a considerably stronger balance-sheet position. Bear: Western Digital’s own roadmap shows it still testing its HAMR drives with customers, a step behind Seagate’s claimed volume production, and a large share of its headline profit this year is a one-time accounting gain on a stake in its former flash-memory business rather than core hard-drive profit.
Micron Technology (MU, Nasdaq). The largest US-headquartered memory maker, spanning DRAM, NAND flash, and high-bandwidth memory for AI accelerators. Market capitalization approximately $1.17 trillion as of July 1, 2026, roughly six times Seagate’s own size. Trailing-twelve-month revenue was $90.27 billion, up 167.0 percent year over year, with net income up 710.7 percent, on a trailing price-to-earnings ratio of just 23.30 times, the cheapest of the AI-storage-and-memory complex on a trailing basis given how fast its earnings have grown. Bull, as a read-through for Seagate: Micron’s results confirm the AI-driven memory and storage re-rating is a broad, multi-company phenomenon, not one stock’s isolated story. Bear, as a read-through for Seagate: the same broad memory-cycle risk applies at a much larger scale, and Micron’s own NAND capacity expansion is part of the flash cost curve that is the long-run threat to Seagate’s core product.
NetApp, Inc. (NTAP, Nasdaq). Builds enterprise data-storage systems and software using drives sourced from Seagate, Western Digital, and flash suppliers, one tier up the value chain from the component makers. Market-cap estimates ranged widely across different snapshots in May and June 2026 ($18.9 billion to $30.3 billion), a data-quality flag on this name worth noting outright rather than picking a single false-precision figure. Fiscal 2026 revenue was $6.93 billion, up a modest 5.37 percent year over year. Bull, as a read-through for Seagate: as a systems integrator one step removed from the component price war, NetApp benefits from the same AI-driven data growth without carrying Seagate’s manufacturing capital intensity. Bear, as a read-through for Seagate: NetApp’s much slower growth next to Seagate’s 44 percent shows how much value the AI storage boom is currently concentrating at the drive-manufacturing layer specifically, concentration that could reverse if customers push back on component pricing.
Everpure, Inc., formerly Pure Storage (PSTG, NYSE). Builds all-flash enterprise storage systems and, as of February 2026, formally renamed itself from Pure Storage to Everpure to reflect a strategic shift toward broader data management rather than a pure hardware pitch; the ticker (PSTG) did not change. Market capitalization roughly $24 to 26 billion as of June 2026. Fiscal 2026 total revenue was $3.7 billion, with the fourth quarter surpassing $1 billion for the first time, up 20 percent year over year. Bull, as a read-through for Seagate: continued growth here shows flash-based systems taking real share in performance-sensitive tiers, evidence the AI-data-infrastructure buildout has room for multiple storage technologies to grow at once rather than a zero-sum fight. Bear, as a read-through for Seagate: Everpure’s all-flash pitch is the clearest systems-level embodiment of the exact substitution risk Seagate’s own bear case names, every workload that migrates from disk arrays to all-flash systems is one permanently leaving Seagate’s addressable market.
What the filings say
Source: Seagate’s Form 10-Q for the quarter ended April 3, 2026, and the accompanying earnings release (filed April 28, 2026).
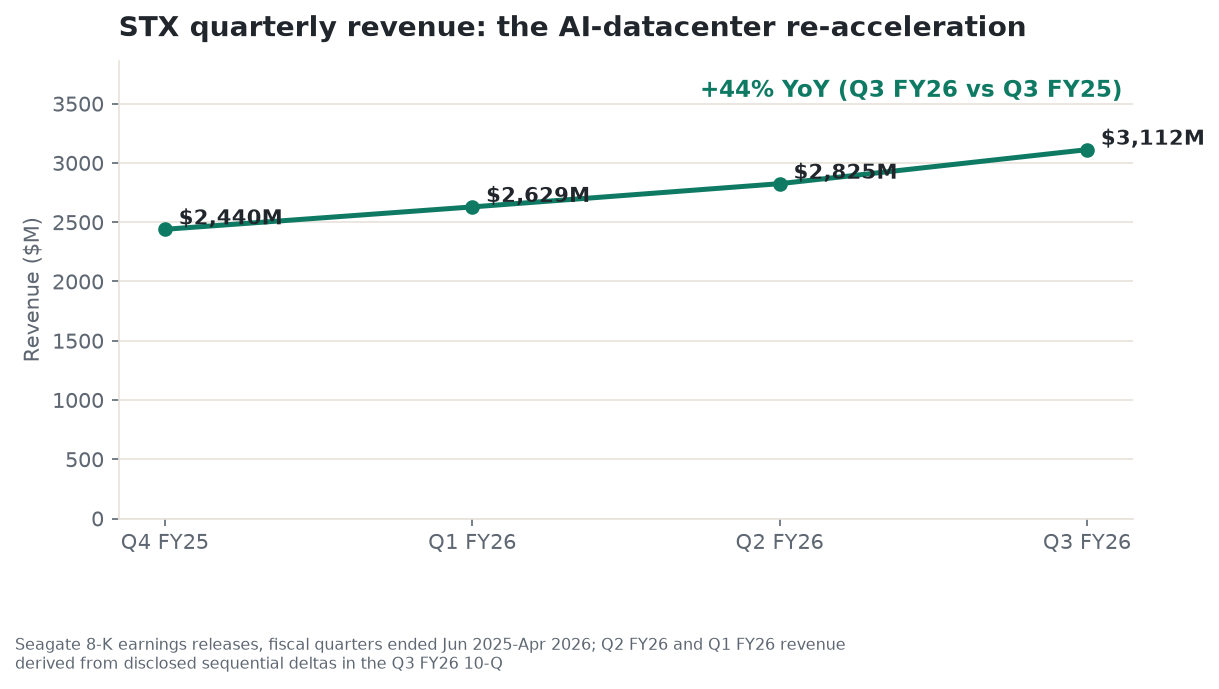
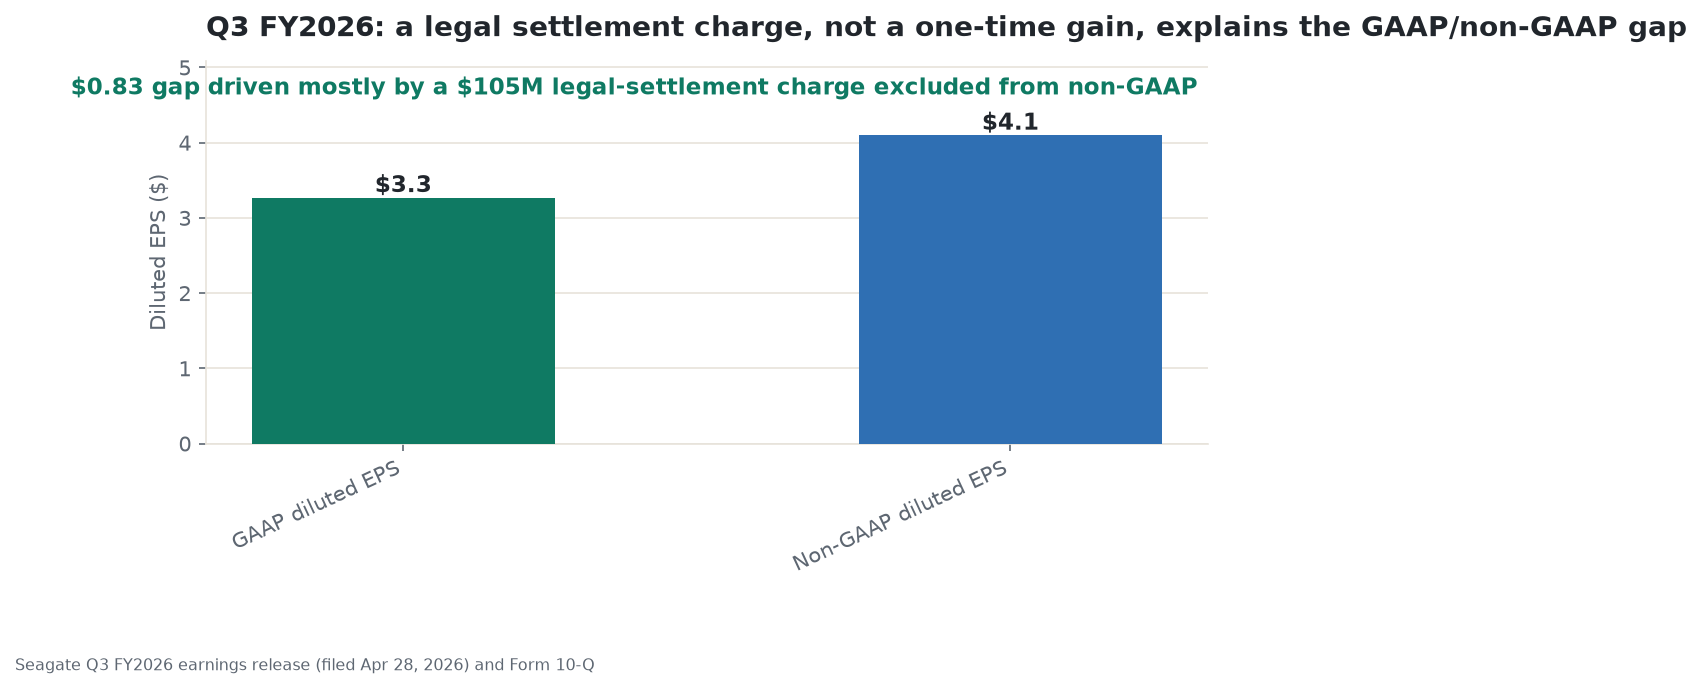
The headline numbers, and the item underneath them. Third-quarter fiscal 2026 revenue was $3,112 million, up 44 percent year over year and up roughly 10 percent from the prior quarter. GAAP gross margin was 46.5 percent (non-GAAP 47.0 percent). GAAP operating income was $998 million, a 32.1 percent operating margin (non-GAAP 37.5 percent). GAAP diluted earnings per share were $3.27; non-GAAP diluted earnings per share were $4.10. That $0.83 gap is smaller than it might look, and it runs in a different direction than the equivalent gap at Western Digital: rather than a one-time gain inflating the GAAP number, Seagate’s GAAP figure is dented by a $105 million legal settlement charge that is excluded from the non-GAAP number. Strip that charge out and Seagate’s core quarter was, if anything, a touch stronger than the GAAP headline suggests, the opposite distortion from the one running through Western Digital’s own numbers this quarter.
Why there’s a settlement charge at all. In July 2023, two securities class action lawsuits were filed against Seagate, its CEO, and its then-CFO, alleging that statements made between September 2020 and April 2023 violated federal securities law. The cases were consolidated later that year. On April 3, 2026, the parties reached a settlement in principle for $175 million total, of which roughly $70 million will be paid by Seagate’s insurers, leaving the $105 million charge booked this quarter as Seagate’s own share. The settlement still needs court approval and a final signed agreement; it is not yet finished, and reaching a settlement “in principle” is not an admission that the underlying allegations were true.
Where the growth is actually coming from. Seagate’s own filing breaks the growth story into the same pattern showing up at Western Digital: nearline exabytes shipped, the highest-capacity drives built for cold datacenter storage, grew 47 percent year over year to 175.4 exabytes, while the company was also able to raise prices, described in the filing as “favorable pricing actions.” Shipping more and getting paid more per unit at the same time is the textbook signature of a supplier whose customers need more than it can comfortably supply.
Segment mix. Beginning this fiscal year, Seagate relabeled its end markets specifically “to better reflect current demand drivers and the growing impact of AI-driven applications.” Data Center revenue was 80 percent of the quarter (up from 75 percent a year earlier); Edge IoT, the catch-all for consumer, client, network-attached storage, mission-critical, and SSD products, was the remaining fifth. By channel: OEMs 79 percent, distributors 15 percent, retailers 6 percent. By geography: Americas 52 percent, Asia Pacific 38 percent, EMEA 10 percent.
Balance sheet: real debt, and a thin equity cushion worth understanding. Cash was $1,146 million; total debt was $3,863 million, down from $4,995 million a year earlier after $641 million was retired in the quarter alone. Netting the two gives Seagate a net debt position of roughly $2.72 billion, a real and meaningfully different picture than Western Digital, which has moved to net cash over the same period. The more unusual feature is on the equity side: total shareholders’ equity was just $1,095 million, the legacy of years of past cyclical losses and heavy buybacks that shrank the equity account faster than profits could rebuild it. That thin base is not a one-time accounting item, but it has a similar distorting effect on ratio analysis: it mechanically inflates return-on-equity and price-to-book figures well beyond what the underlying profitability alone would suggest. A reader who takes Seagate’s eye-popping reported return on equity at face value, without this context, would badly misjudge how the balance sheet actually looks.
Guidance. For fiscal fourth-quarter 2026, management guided (non-GAAP) revenue of $3.45 billion plus or minus $100 million and diluted earnings per share of $5.00 plus or minus $0.20. CEO Dave Mosley: “Seagate delivered outstanding March quarter results, exceeding the high end of our revenue and EPS guidance, achieving record margin performance, and generating close to $1 billion in free cash flow,” adding that “Seagate is entering a new era of structural growth as AI applications amplify data creation and support sustained storage demand.”
Cash flow and capital return. Operating cash flow was $1.1 billion; free cash flow was $953 million, a 31 percent margin the company describes as its highest level in over a decade. The quarterly dividend is $0.74 per share, raised about 3 percent earlier this fiscal year, and the board has a $5 billion buyback authorization in place. Management’s own capital-spending target is 4 to 6 percent of revenue, the same disciplined ratio Western Digital targets, notable for a company that owns its entire manufacturing base rather than outsourcing it.
Disclosed litigation. Beyond the securities class action already described, Seagate faces two active patent-infringement suits as a defendant. Lambeth Magnetic Structures LLC sued in 2016; a district court ruled for Seagate in 2022, but a federal appeals court vacated that ruling in September 2025 and sent the case back for a new trial. Seagate says it believes the claims are without merit and intends to defend the case. A separate suit filed in 2024 by Godo Kaisha IP Bridge 1 alleges infringement of nine patents; Seagate again says it believes the claims are without merit. Separately, Seagate is still paying down a legacy $300 million settlement reached in 2023 with the U.S. Commerce Department over historical hard-drive sales to Huawei that violated export-control rules, with $135 million of that amount still outstanding as of the most recent balance sheet. None of these is presented here as a resolved fact in either direction; each is reported exactly as Seagate’s own filing discloses it.
How far this business has come. Fiscal 2025 revenue was $9.10 billion, with non-GAAP diluted earnings per share of $8.10, itself already a strong recovery year. Fiscal 2024 revenue was $6.55 billion, and fiscal 2023 revenue was $7.38 billion with a GAAP loss per share, a reminder that the hard-drive industry was in a genuine cyclical trough as recently as three years ago, before the AI-driven surge began.
What the market is paying
All figures point-in-time as of the July 1-2, 2026 research window, sourced from stockanalysis.com. STX trades on Nasdaq.
A rough couple of weeks after a roughly 567 percent run. The canonical price used throughout this piece is $820.16, stockanalysis.com’s own quote as of the July 2, 2026 close, down 10.38 percent that single session. A separate press account of the same day put the close at $852, a roughly 3.3 percent spread worth naming outright rather than quietly picking one number, consistent with how a similar same-day discrepancy was handled in the house’s own research on Western Digital during this exact window. That single-day move sits inside a genuinely volatile stretch: the stock hit an all-time high of $1,145.00 on June 18, 2026, then fell 12.24 percent on June 26, a further 4.80 percent on July 1, and again on July 2, moving in lockstep with SanDisk and Micron on a broadly covered story about memory-sector profit-taking and supply-glut fears, not anything specific to Seagate’s own results.
How far this stock has come. The 52-week range is $138.30 to $1,145.00, a 52-week gain of roughly 567 percent. Even after the pullback, the stock sits far above its 200-day moving average of $456.81, while its 50-day moving average ($840.19) is close to the current price, a pattern consistent with a huge re-rating that has recently cooled rather than reversed.
Valuation. Trailing price-to-earnings is 77.68 times, more than double Western Digital’s 32.77 times. Unlike Western Digital’s multiple, which is inflated upward by a one-time accounting gain, Seagate’s richer multiple is closer to the market’s genuine, undistorted read on the business, which is worth sitting with: the market is charging a considerably higher price for essentially the same duopoly exposure. Forward price-to-earnings is lower, at 33.74 times, and the PEG ratio of 0.46 nominally looks attractive, but a PEG ratio built on growth this extreme, coming off a real cyclical loss just two to three years ago, is a signal the market expects an extraordinary growth rate to continue, not proof the stock is cheap. Two other ratios deserve a specific caution: reported return on equity of 1,787.97 percent and price-to-book of 168.08 times are both mechanically inflated by the unusually thin equity base described in the filings section, not evidence of an implausible return on capital.
Liquidity, short interest, and ownership. Short interest is 8.45 million shares, 3.73 percent of float, with 2.53 days to cover, a modest position for a stock that has moved this much this fast. Institutional ownership is 85.15 percent, somewhat lower than Western Digital’s 97.38 percent, and insiders hold just 0.22 percent. Corporate insiders sold more than $107.2 million of stock in the three months before July 1, 2026, a governance signal worth naming alongside the already-small insider stake, though insider selling after a run of this size is common and not on its own evidence of a change in view.
Sell-side consensus, genuinely split. Twenty-five analysts cover the stock with a consensus rating of Buy and an average price target of $948.17, implying roughly 15.6 percent upside from the canonical price, a larger implied upside than Western Digital’s own roughly 9 to 10 percent. But the sell side is not unanimous: one research shop initiated coverage in March 2026 with a Street-high $1,600 target, and two others raised targets to $1,150 and $1,300 in June, while a different firm downgraded the stock from Strong Buy to Hold around July 1, citing an elevated forward earnings multiple, and yet another shop downgraded to Equal-Weight on concerns that market assumptions about hard-drive pricing are too optimistic. That is a genuinely divided picture underneath a headline “Buy consensus.”
Balance-sheet safety. Seagate’s Altman Z-Score of 5.32 sits in the safe zone for bankruptcy risk, somewhat lower than Western Digital’s 7.6, consistent with carrying real net debt rather than net cash. Its Piotroski F-Score of 7 out of 9 is actually stronger than Western Digital’s 5 out of 9 on that particular measure of fundamental quality, reflecting the strength of the reported margin, cash-flow, and leverage trends over the past year even though the absolute leverage level is higher than Western Digital’s.
What the crowd is saying
This section is signal, not fact.
All-time high to a rough two weeks. News flow on Seagate through June and into this research window traces an even sharper arc than Western Digital’s. The stock hit an all-time high on June 18, 2026, on a wave of bullish sell-side coverage, then fell hard: 12.24 percent on June 26, 4.80 percent on July 1 (coverage cited profit-taking after a price-target raise, a downgrade to Hold on valuation grounds, rising rate expectations making debt-funded datacenter spending more expensive, and Seagate’s own leveraged balance sheet as specific reasons for caution), and again on July 2 alongside a broader AI-memory sector slide tied to supply-glut fears. An earlier, smaller wobble in May 2026 came from an unusual source: Seagate’s own CEO saying it would “take too long” to build new hard-drive factories, a comment meant to reassure investors about supply discipline that some of the market instead read as evidence of a capacity constraint.
What this arc says. The dominant story about Seagate has shifted, in the space of about two weeks, from “the technology leader riding the AI storage supercycle to new highs” to “one of the four correlated AI-memory names giving back some of a roughly 567 percent run together.” All four falling on the same days for sector-wide reasons, not company-specific news, suggests a meaningful share of the recent move is sentiment and positioning layered on top of genuinely strong results, not purely a reaction to anything Seagate itself said or did.
The divergence worth naming. Where Western Digital’s headline profit this year is flattered by a one-time gain, Seagate’s headline profit is, if anything, understated by a one-time item working the other way, the legal settlement charge. What deserves separating from the excitement is the balance-sheet picture: Seagate’s extraordinary reported return on equity and its very high price-to-book multiple are artifacts of a thin equity base built up over years of cyclical losses and buybacks, not evidence the business earns an implausible return, and a reader building a narrative around those headline ratios without that context would be working from a distorted picture.
A data-quality note. A dedicated pull of retail and social chatter was not separately attempted for Seagate in this piece; what is reported above comes from press headline aggregation and the sell-side consensus data in the market-action section, both treated as point-in-time signal, not confirmed fact about market psychology.
Is the AI storage boom durable, or is this a cyclical peak with better marketing?
The structural case for durability is concrete, and it is the same case that runs through Western Digital’s own story: AI training runs generate large, growing volumes of data that must be checkpointed to persistent storage repeatedly, and AI inference and agentic systems generate logs, context, and retrieval data that keeps accumulating rather than disappearing. Seagate’s own disclosure that its nearline capacity is largely booked through the end of calendar 2026, with next fiscal year’s supply contracts already finalized, is real, forward-looking evidence of demand behavior, not just a forecast.
The cyclical case for caution is just as concrete, and some of it arrived in the same week as this research. Seagate itself posted a GAAP loss as recently as fiscal 2023, only three years before this research date. And right at this research date, press coverage was already circulating a specific, dated version of the bear case: capacity additions from Samsung and SK hynix expected to soften memory pricing as supply catches up with demand, alongside an explicit expectation that AI capital spending could peak sometime in 2026 and decline after that. Layered on top is a Seagate-specific wrinkle Western Digital does not share to the same degree: real net debt against an unusually thin equity base, which is exactly the combination press coverage cited when explaining why investors turned cautious on the stock’s own leveraged structure during the July 1 pullback.
The most likely outcome is a genuine split rather than a clean call in either direction. The AI-datacenter demand leg is real and larger than any prior HDD demand driver, which likely prevents a repeat of the depth of the 2023 trough. But the margin levels and the valuation multiple as of this research date are close to a cycle peak by Seagate’s own historical standard, and should not simply be extrapolated forward at face value. Some normalization, in both the margin structure and the multiple the market is willing to pay for it, is the more probable path over a multi-year horizon, with the exact timing set by whether Seagate’s HAMR lead over Western Digital widens or narrows, and by how fast flash memory’s own cost curve keeps closing distance on hard drives in the coldest storage tier.
The scenarios in detail
The five-year outcome for Seagate comes down to five variables, and the bull, base, and bear cases below are different settings of these five dials.
- AI-datacenter nearline demand. The dominant near-term variable. Data Center revenue is 80 percent of total revenue and nearline exabytes grew 47 percent year over year on both higher volumes and higher prices at once.
- Duopoly pricing power and contract durability. Nearline capacity is largely booked through the end of calendar 2026, with next fiscal year’s supply contracts already finalized. Whether that pricing discipline holds once combined industry capacity catches up with demand is the key question.
- Mozaic HAMR execution versus Western Digital. Seagate ships Mozaic 4+ (up to 44 terabytes) in volume to two large cloud providers today, with two more actively testing the drives, versus Western Digital’s own comparable drives still being tested by customers. Whether Seagate extends or loses that lead decides relative share within the duopoly.
- NAND cost-per-bit substitution. The structural, multi-year question: whether flash’s falling cost per bit keeps closing the gap with hard drives in the coldest, highest-capacity storage tier. This is not purely a five-year-out question anymore; press coverage was already circulating a version of it right at this research date.
- Balance-sheet leverage. Seagate carries real net debt, unlike Western Digital’s net-cash position, which mostly affects how much cushion the company has if the cycle turns rather than the base-case outcome.
Every dollar figure below is an illustrative estimate, built from a stated non-GAAP earnings trajectory and a stated valuation multiple, never a price target. These levels match the lede chart at the top of this piece.
Bull case, “Seagate wins the HAMR race and the decade.” AI-datacenter demand for persistent, cost-efficient storage keeps compounding through the early 2030s. Seagate extends its current technology lead over Western Digital rather than seeing it narrow, converting that lead into durable share gains in the highest-value nearline tier, while both companies maintain pricing discipline. Revenue grows at a sustained double-digit rate through 2032, non-GAAP gross margin holds in the high-40s to low-50s, and non-GAAP earnings per share reaches roughly $52 as the company keeps delevering and buying back stock. At a 30-times multiple, a premium reflecting sustained conviction that Seagate has become the structural technology leader in a two-company market, that lands near $1,550. What has to be true: AI datacenter spending keeps growing well past 2026, directly contradicting the “AI capex peaks in 2026” thesis already circulating, and Seagate’s HAMR program does not lose its lead to Western Digital. What breaks it fastest: a hyperscaler spending deceleration, or Western Digital closing the technology gap faster than expected.
Base case, “a real business, a normalizing multiple, gradually delevering.” The AI-driven demand surge continues but decelerates from today’s extraordinary pace to a still-healthy high-single to low-double-digit revenue growth rate through 2032. Gross margin settles in the low-to-mid 40s, a genuine structural improvement over Seagate’s pre-cycle norm but below today’s cycle-peak level. Mozaic HAMR ships in growing volume, roughly holding rather than dramatically extending its current edge, and Seagate continues paying down debt toward a more conservative balance sheet. Non-GAAP earnings per share reaches roughly $29. At a 21-times multiple, a still-modest premium to hard drives’ historical multiple reflecting the genuine, if moderated, AI tailwind, that lands near $600, notably below today’s price, because today’s price still carries some of the cycle-peak enthusiasm this base case assumes fades. What has to be true: the demand tailwind is real but not permanently accelerating, and the duopoly holds its structure.
Bear case, “the leverage bites and the substitution catches up.” Flash memory’s falling cost per bit closes enough of the gap with hard drives in the coldest, highest-capacity storage tier that big cloud providers start allocating meaningfully more new cold-storage capacity to flash instead, the exact dynamic already being discussed as a “memory supply glut” risk at this research date. Layered on top, Western Digital closes the HAMR gap faster than Seagate can extend it, costing Seagate share in the highest-value part of the business, and a genuine cyclical downturn, of the kind Seagate’s own fiscal 2023 already demonstrated this industry can produce, arrives as combined industry capacity catches up with a decelerating demand curve. Seagate’s real net debt, unlike Western Digital’s net cash, becomes a genuine constraint in this scenario, limiting the buyback and dividend program exactly when the stock is cheapest. Non-GAAP earnings per share falls to roughly $10 in a trough year. At a 16-times multiple, a commodity-cycle valuation with no growth or duopoly-discipline premium, that lands near $160, close to Seagate’s own 52-week low. This case is anchored on real, disclosed facts, not a tail hypothesis: Seagate posted a GAAP loss as recently as fiscal 2023, and press coverage was already discussing “AI capex peaks in 2026” concerns in the same week as this research. What would break the bear case toward the upside: Seagate extending its HAMR lead within the next product cycle, or flash’s cost curve failing to close further ground in the coldest storage tier.
Catalyst timeline. Near term: the fiscal fourth-quarter earnings report expected around late July 2026 and initial fiscal 2027 guidance; continued qualification progress at the two additional large customers actively testing Mozaic 4+; court approval of the $175 million securities class-action settlement; and any concrete read on whether the “AI capex peaks in 2026” narrative is gaining traction with actual customer capital budgets or fading as noise. Multi-year: Seagate’s own roadmap milestone of reaching 70 percent of nearline capacity on HAMR by the end of fiscal 2027; the pace of further debt paydown toward a more Western-Digital-like balance sheet; the Lambeth Magnetic Structures patent retrial, an uncertain-outcome legal risk with no fixed timeline; and, longer-run, the trend in flash memory’s cost per bit in the coldest storage tier relative to HAMR’s own roadmap.
Leading indicators to watch. Nearline pricing and non-GAAP gross margin at the next earnings print, watching specifically whether pricing holds or shows its first sign of softening. Concrete evidence of the two additional large customers moving from testing to volume purchases of Mozaic 4+, and the pace versus Western Digital’s own comparable technology. Seagate’s net debt trend, currently around $2.72 billion; continued paydown would reduce the leverage risk the bear case leans on. The securities class-action settlement’s court-approval process and the Lambeth Magnetic Structures retrial. And flash memory cost-per-bit trend data in cold and archival storage specifically, alongside Samsung and SK hynix capacity-utilization data already being cited as a “memory supply glut” risk.
Companies to watch (bull / base / bear)
Seagate (STX). Role: the subject of this piece, currently the technology leader within the two-company hard-drive market. Bull: the HAMR lead widens into a durable share gain in the highest-value part of the business. Base: tracks the same industry cycle as Western Digital with continued deleveraging. Bear: Western Digital closes the technology gap while Seagate’s own leverage amplifies any downturn. Watch: the fiscal fourth-quarter print expected around late July 2026 and whether nearline pricing holds.
Western Digital (WDC). Role: Seagate’s only direct, scale competitor, and the other half of the duopoly. Bull: the same AI- datacenter demand keeps outrunning combined industry capacity from a stronger, net-cash balance-sheet position. Base: tracks the same industry cycle as Seagate with a similar amplitude. Bear: still testing its own next-generation drives with customers, a step behind Seagate’s claimed volume production. Watch: Western Digital’s own progress closing the HAMR gap, the clearest read on whether Seagate’s current lead is widening or narrowing.
Micron (MU). Role: the largest US memory maker and a broad cross-check on the AI-storage-and-memory re-rating. Bull: continued strength confirms this is a sector-wide phenomenon, not one company’s story. Base: a wide-amplitude cycle, like the rest of the complex. Bear: the same cyclicality risk as everyone else, at a much larger scale, and its own NAND capacity growth is part of the substitution threat to Seagate. Watch: whether Micron’s results keep confirming AI-driven demand or show cracks first, given its size and diversification.
NetApp (NTAP). Role: a systems maker one tier up the value chain from Seagate, a cross-check on how much value is flowing through to finished storage products versus staying at the component-manufacturing layer. Bull: continued growth here, without Seagate’s capital intensity, shows the AI storage story extending beyond the drive makers themselves. Base: modest, single-digit growth well below Seagate’s own pace. Bear: if its growth stays this much slower than Seagate’s, it is evidence the current windfall is concentrated narrowly at the manufacturing layer, a concentration that could reverse. Watch: whether NetApp’s own growth rate starts closing the gap with the drive makers’ pace.
Everpure, formerly Pure Storage (PSTG). Role: the clearest systems-level embodiment of the flash-versus-hard-drive substitution question. Bull: continued all-flash growth shows multiple storage technologies can grow together rather than a zero-sum fight. Bear: every workload it moves onto all-flash systems is one permanently leaving Seagate’s own addressable market. Watch: whether its growth rate accelerates in exactly the cold-storage tiers Seagate depends on, the earliest sign the substitution threat is becoming concrete rather than theoretical.
Risk controls
The honest risk paragraph starts with the balance sheet, because it changes how every other number in this piece should be read. Seagate carries real net debt of roughly $2.72 billion against a shareholders’ equity base of just $1.095 billion, a legacy of years of cyclical losses and heavy buybacks. That thin equity base mechanically inflates reported return-on-equity and price-to-book figures well beyond what the underlying profitability alone would suggest, and it is exactly the combination (real leverage, a rich multiple) that press coverage cited when explaining investor caution during the July 1, 2026 pullback.
Cyclicality is real and recent, not theoretical: Seagate posted a GAAP loss as recently as fiscal 2023. A real technology race is underway with Western Digital, and Seagate’s current lead, while genuine, has to be continually defended, not banked as a permanent advantage. There is meaningful disclosed legal exposure: an in-progress $175 million securities class-action settlement (Seagate’s own $105 million share, still needing court approval), two active patent-infringement suits as a defendant, and a legacy export- control settlement still being paid down. And the stock’s own volatility, a beta of 2.07 and a roughly 28 percent drawdown from its own June 18 all-time high to the canonical price used here, means this is not a name where a tight stop functions in any conventional sense; position sizing is the more realistic lever for a reader who chooses to hold it.
What would change this read toward the constructive side: Seagate extending its HAMR lead with the two additional large customers named as actively testing Mozaic 4+ moving to genuine volume purchases; continued deleveraging that meaningfully closes the balance-sheet gap with Western Digital; or the sell-side consensus price target moving decisively toward the Street-high $1,600 level. What would change it toward the negative: a soft fiscal fourth-quarter print or cautious fiscal 2027 guidance; concrete evidence Western Digital has closed the technology gap; or hard data showing the flash- memory substitution threat, or the “AI capex peaks in 2026” thesis, accelerating faster than the base case assumes.
Methodology, sourcing, and data-quality flags
This is a company-mode deep dive built from parallel research streams covering the value chain and money flow, Seagate’s own SEC filings (the Form 10-Q and its accompanying earnings releases), the market action and valuation, OSINT and news-sentiment signal, and the macro and micro economics of the hard-drive cycle. Every load-bearing figure traces to a claim in the run’s ledger with a source and a tier: primary (Seagate’s own SEC filings, read directly via a full-document download after standard web-fetch tooling was blocked by SEC.gov), press (stockanalysis.com’s derived market data, cross-checked internally for self-consistency, Seagate’s own earnings-call transcript, and dated news coverage of the June-July 2026 price action), or analyst (peer snapshots for Western Digital and Micron carried from the house’s own separately published Western Digital research for the same July 2026 window, used only for comparative context and not independently re-verified in this run).
On the five-factor read, in plain prose rather than as a score. Valuation nets to overvalued. The trailing price-to-earnings ratio of 77.68 times is more than double Western Digital’s, and while the PEG ratio and forward multiple suggest the market expects continued strong growth to justify the price, that is an assumption, not a fact, especially given the stock’s own eightfold run from its 52-week low. Growth is the strongest factor, arguably stronger than Western Digital’s: 44 percent quarterly revenue growth, 47 percent nearline exabyte growth, and a technology lead Western Digital has not yet matched. Quality is genuinely mixed. Core margin expansion is real and free cash flow hit a decade-plus high, but Seagate carries real net debt against a thin equity base, unlike Western Digital’s net cash position, and has a longer list of open legal matters. Risk is real and weighs on the read: a beta of 2.07, a roughly 28 percent drawdown from the recent all-time high, a more leveraged balance sheet than its only competitor’s, and dependence on continuing to win a genuine multi-generation technology race rather than resting on a settled advantage. Momentum is positive but fragile: a 52-week gain of roughly 567 percent and a Buy consensus with a meaningfully larger implied upside than Western Digital’s own, offset by a genuinely split sell-side picture and a fresh, sector-wide pullback right at the research date. Putting those together, the overall lean lands at Hold: a technology leader within its duopoly riding a real AI-datacenter demand surge, priced at a considerably richer multiple than its closest peer, carrying real leverage that peer does not.
Data-quality flags:
- STX’s own price carried a roughly 3.3 percent same-day spread across two press sources on July 2, 2026 ($852 versus a self-consistent $820.16 from stockanalysis.com). Resolved by using the stockanalysis.com figure throughout, with the discrepancy stated explicitly rather than silently picked, consistent with how an analogous spread was handled in the house’s own Western Digital research for the same window.
- NetApp’s market-cap figures ranged widely across different snapshots in May and June 2026 ($18.93 billion to $30.32 billion), a wider spread than a normal single-day discrepancy would produce. Reported as a named range, used only for directional value-chain context, never as a claim about Seagate itself.
- Insider-selling and analyst-downgrade attributions were sourced from a single press aggregator, not primary SEC insider-transaction filings or original analyst notes. Framed as reported color, not independently re-derived primary fact.
- The securities class-action settlement, the patent litigation, and the legacy export-control settlement are disclosed exactly as Seagate’s own 10-Q states them. No outcome is predicted or implied for any unresolved matter, and no admission of wrongdoing is implied by a settlement reached “in principle.”
- Peer snapshots for Western Digital and Micron were carried from the house’s own prior Western Digital research, not independently re-pulled in this run. They are used only for comparative scale and context, never as claims about Seagate itself.
Key sources: Seagate’s Form 10-Q for the quarter ended April 3, 2026 (SEC EDGAR, primary) and the accompanying Q3 FY2026 earnings release (primary); Seagate’s own Q3 FY2026 earnings-call transcript (press); stockanalysis.com for price, valuation, and statistics data on STX (press, point-in-time); dated news coverage of the June-July 2026 AI-memory-sector price action (press, headline-level); the house’s own separately published Western Digital research for Western Digital and Micron peer context (analyst tier, not independently re-verified in this run). Full per-figure provenance is in the run’s claims ledger.
FAQs: six-month to five-year outlook
Q: What is the 6-month outlook for STX? A: The fiscal fourth-quarter earnings report expected around late July 2026 and initial fiscal 2027 guidance are the deciding events. An in-line print near the guided $3.45 billion revenue and $5.00 non-GAAP EPS points to the base case near $780. A beat with confirmation two more large customers moved to volume purchases points toward $1,050. A miss or a cautious guide points toward $520.
Q: What is the 1-year forecast for STX? A: By mid-2027 the market judges whether Seagate’s technology lead over Western Digital widened or narrowed. The base case sits near $750 as growth cools to a still-healthy pace. The bear case, near $380, assumes Western Digital closes the gap while Seagate’s leverage becomes a bigger constraint. The bull case, near $1,150, assumes the lead widens and demand stays strong.
Q: What is the 3-year outlook for STX? A: This is where the technology race and the industry’s pricing discipline either hold or crack. Base case near $650 assumes durable but slower growth and continued deleveraging. Bear case near $220 assumes a real down-cycle plus Seagate’s leverage amplifying the pain. Bull case near $1,350 assumes Seagate turns its lead into a multi-generation advantage.
Q: What is the 5-year forecast for STX? A: By 2032 the deciding question is structural: does flash memory’s falling cost keep closing the gap with hard drives in the cheapest storage tier? Bear case near $160 if it does. Base case near $600, still below today’s price because it assumes today’s rich multiple normalizes even if the business performs fine. Bull case near $1,550 if AI-era data retention permanently enlarges hard drives’ addressable market faster than flash can close the gap.
Q: What’s the biggest risk to owning STX right now? A: The combination of real net debt and a thin equity base. Seagate carries roughly $2.72 billion of net debt, unlike Western Digital’s net-cash position, and its extraordinarily high reported return on equity and price-to-book ratios are artifacts of an unusually small equity account built up over years of cyclical losses and buybacks, not evidence of an implausibly efficient business. That leverage would become a real constraint in any cyclical downturn, exactly the scenario the bear case describes.
Prepared July 1-2, 2026. Figures are point-in-time and will change. This is research and analysis for educational purposes, not investment advice, not a recommendation, and not a solicitation. STX’s stock has moved more than sixfold over the trailing year and swung double digits across the trading sessions bracketing this research date alone. Verify all figures independently and consult a licensed financial advisor before making any decision.