
Research date: June 25, 2026 | OSINT market research on Lam Research Corporation (LRCX, NASDAQ), the world’s leading etch and deposition equipment specialist - the company whose tools carve and build the three-dimensional structures inside every advanced memory chip - sitting at the convergence of the 3D NAND layer-count race toward 1,000 layers, the HBM/DRAM boom fueled by AI datacenter demand, and an export-control crisis that sent China’s share of revenue from 43% to a sub-30% trajectory in the span of two fiscal quarters. Lam Research’s fiscal year ends in late June; FY2026 closes June 28, 2026 - three days from the research date. Full-year FY2026 results are not yet reported.
Important disclaimer. This article is OSINT research produced for educational and informational purposes only. It is not investment advice, not a solicitation to buy or sell any security, and not a personalized financial recommendation. All figures are point-in-time as of the research date stated and move fast - verify before acting. Past performance is not indicative of future results. Do your own due diligence and consult a qualified financial adviser before making any investment decision.
LRCX-specific risks: WFE cycle risk (Lam Research is the most memory-concentrated WFE name among large peers, with NAND and DRAM representing 39% of Systems revenue in Q3 FY2026; in a concurrent NAND and DRAM downturn, Lam’s revenue decline could reach 25-35% without an HBM cushion, roughly double the 14.5% decline observed in the FY2024 trough); China export-control risk (China was 43% of revenue in Q1 FY2026; the Bureau of Industry and Security 50%-affiliate rule is currently suspended through November 9, 2026 and reinstates automatically absent a new Federal Register extension, carrying an estimated $200M per quarter impact when active per Jones Day and Arnold & Porter legal analysis; the Hua Hong Semiconductor restriction is a separate active restriction with no stated expiration; both restrictions are additive, not overlapping); customer concentration (Samsung Electronics and TSMC are each disclosed in Lam’s FY2025 10-K as accounting for more than 10% of total revenue; together with SK Hynix, Micron, and Intel - widely understood to be among the next tier of significant customers based on geographic and device-type revenue data, though not separately named at the 10% threshold in filings - the top customers represent the majority of revenue); NAND inventory and oversupply risk (NAND WFE fell approximately 50-55% peak-to-trough in 2022-2023, and the next oversupply event remains a credible scenario in 2027-2028); moat risk (Tokyo Electron has disclosed cryo-etch development work with production-of-record qualifications anticipated, and has been dual-sourced alongside Lam at Samsung V10 NAND at the qualification stage); valuation risk (EV/EBITDA of 60-64x as of June 25, 2026 is at or near the 10-year historical maximum and sits 333-360% above the 10-year median); and the point-in-time nature of all prices, market caps, and FY2026 estimates given Q4 FY2026 has not yet been reported as of this writing (results expected on or around July 28, 2026).
Where this stock could be in 6 months, 1 year, 3 years, and 5 years
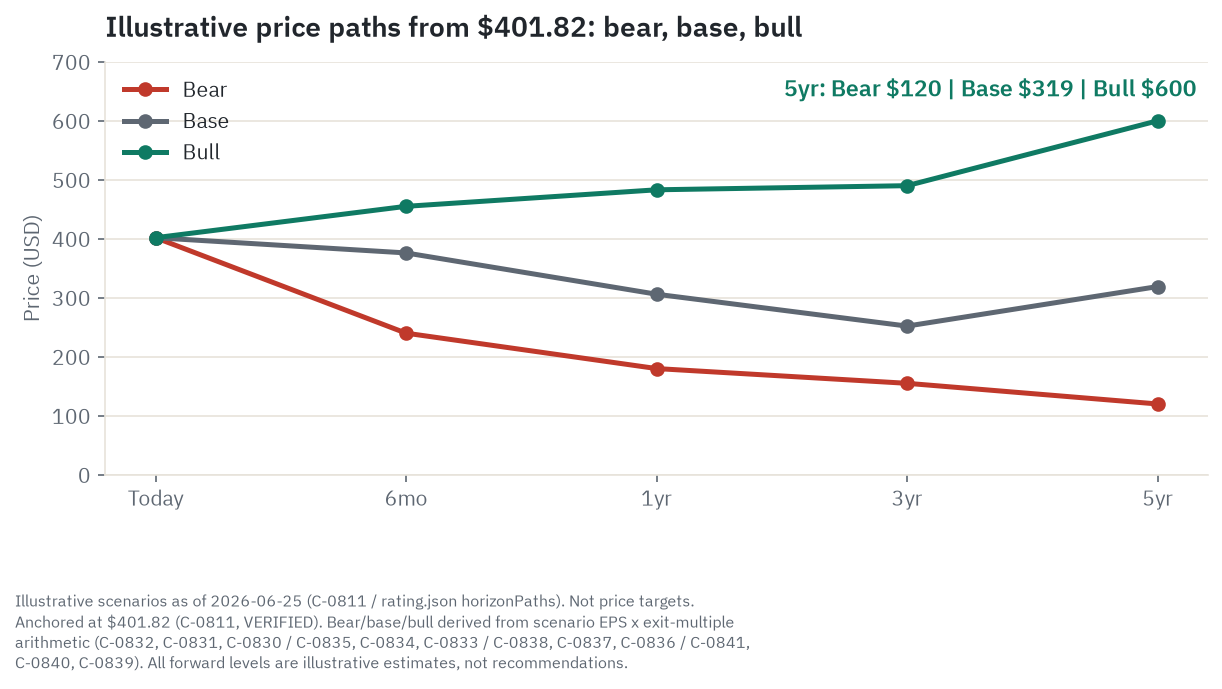
Lam Research closed at $401.82 on June 25, 2026 (post-split, adjusted for the 10-for-1 split effective October 2, 2024), within $8 of its 52-week and all-time high of $409.75 set three sessions earlier. The stock had traveled from approximately $90.94 in summer-fall 2025 - during the worst of the China BIS affiliate-rule shock - to that level in under twelve months, a gain of more than 340% from trough to near-peak. It is up +135.17% on a total-return basis from the December 31, 2025 close of $171.18 through June 25, 2026. All dollar ranges below are illustrative estimates derived from stated scenario EPS assumptions and stated exit multiples. They are not price targets and not guarantees of any outcome.
6 months (by December 2026). This window is controlled by two datable events sitting almost exactly twelve and nineteen weeks out. The first is Q4 FY2026 earnings, expected on or around July 28, 2026 - the first full-quarter read after the April 2026 Hua Hong restriction and the clearest signal on whether NAND order momentum is accelerating or stalling. The second is November 9, 2026, when the BIS 50%-affiliate rule reinstates automatically absent a new Federal Register extension, carrying an estimated $200M per quarter impact on China Systems revenue. In the base case, Q4 delivers near the guidance midpoint of $6.6B in revenue and $1.65 in non-GAAP EPS, the BIS rule lapses or is extended through US-China trade negotiations, DRAM and HBM demand stays elevated at 25%+ of Systems, and mild multiple compression from the current roughly 53x forward P/E to roughly 50x offsets near-flat sequential earnings - producing a stock in the approximately $376 range [illustrative estimate, C-0831]. The thing most likely to break this upward is the BIS rule reinstating on November 9 without extension, coinciding with a Q4 earnings miss or soft FY2027 initial guidance; the combination compresses FY2027 EPS estimates to roughly $6.00 and the multiple to roughly 40x, producing approximately $240 [illustrative estimate, C-0832]. The bull case requires Q4 to beat materially, Samsung V10 NAND high-volume manufacturing confirmed, and the BIS rule lapsing cleanly - pointing toward roughly $455 [illustrative estimate, C-0830].
1 year (by June 2027). The driver shifts from binary policy events to the NAND upgrade cycle. CEO Tim Archer cited a $40B NAND upgrade spend expected to complete before the end of calendar 2027 - a Lam management estimate, not independently confirmed by SEMI or TrendForce, and more aggressive than the company’s prior multi-year framing. Whether that $40B spend is visibly landing in NAND’s share of Systems revenue (currently 12% of Systems, well below its 30-40% historical peak in a full upcycle) is the clearest observable signal for this horizon. In the base, NAND recovers toward 20% of Systems but falls short of management’s accelerated timeline, the BIS rule reinstates and compounds with the Hua Hong restriction to push China toward 18-22% of revenue, and the market compresses the multiple to roughly 36x on FY2028 estimates of approximately $8.50 - producing approximately $306 [illustrative estimate, C-0834], a nominal 24% decline from today driven almost entirely by multiple compression rather than earnings deterioration. The bull at roughly $483 [illustrative estimate, C-0833] requires Samsung V10 high-volume manufacturing, a second Aether customer announcement, and the BIS rule lapsing cleanly. The bear at roughly $180 [illustrative estimate, C-0835] requires the BIS reinstatement compounding with NAND upgrade disappointment and the first visible signs of Tokyo Electron cryo etch revenue at Samsung becoming material - the three-way compression the skeptic identifies as the most damaging scenario.
3 years (by June 2029). The structural verdict on the HAR etch moat becomes visible in this window. Either Lam has maintained primary process-of-record status at SK Hynix and Kioxia for the next NAND generation beyond 400 layers - validating the cryo etch position the bull thesis rests on - or TEL has won a second major NAND customer and structural share transfer is confirmed. The $40B NAND upgrade cycle also resolves: either it delivered on or near the management timeline (bull), stretched into 2028-2029 due to supply/demand timing (base), or was interrupted by a 2027-2028 NAND oversupply event as Samsung V10 and Kioxia BiCS10 ramp simultaneously into decelerating AI storage demand (bear). In the base, FY2029 non-GAAP EPS reaches approximately $10.50 after a mild digestion year, and the market exits at roughly 24x - producing approximately $252 [illustrative estimate, C-0837], representing roughly 37% below today and driven almost entirely by multiple compression rather than earnings failure. The bull at roughly $490 [illustrative estimate, C-0836] requires intact HAR etch positions at SK Hynix and Kioxia, second Aether customer confirmed, and DRAM/HBM sustained. The bear at roughly $155 [illustrative estimate, C-0838] requires the dual-leg deceleration scenario: NAND oversupply in 2027-2028 plus TEL moat erosion visible plus AI capex digestion pulling foundry/logic WFE simultaneously.
5 years (by June 2031). The five-year outcome is determined by two structural questions above all others. First: does Lam maintain the HAR etch toll at 80:1+ aspect ratios (approximately 500-layer NAND and beyond) as the sole or primary qualified supplier, or does TEL establish co-equal status across multiple NAND makers? Second: does the multiple permanently re-rate to a structural-compounder band (25-30x) or does it revert toward the 15-20x range that historically accompanied WFE cyclical players? In the base, EPS grows to approximately $14.50 (roughly 4% CAGR, absorbing one digestion cycle) at 22x exit - producing approximately $319 [illustrative estimate, C-0840], a nominal 21% decline from today over five years as multiple compression slightly outpaces EPS growth from the current 53x entry point. The math is the same as the AMAT base case: starting at a historically elevated multiple guarantees that even a good business produces a nominal loss in the base scenario. The bull at roughly $600 [illustrative estimate, C-0839] requires the HAR moat fully intact, Aether at 4-5 customers, and the content-per-wafer compounding confirmed across five consecutive years. The bear at roughly $120 [illustrative estimate, C-0841] reflects TEL and AMEC eroding the moat from opposite sides while the memory cycle produces one more meaningful trough before 2031.
I’d call Lam a Hold at $401.82. The underlying business is genuinely excellent: the narrowest-and-deepest WFE franchise in the world, a real cryo etch position that intensifies in value as NAND stacks deepen, and structural content-per-wafer expansion across NAND layers, HBM TSV steps, and the emerging Aether dry-resist platform. The problem is the same problem AMAT has at $668: the excellent business has already been paid for. At EV/EBITDA of 60-64x (333-360% above the 10-year median), with consensus analyst targets sitting 15-17% below the current price, and with the single most important competitive challenge in Lam’s history - TEL qualifying cryo etch at Samsung’s next NAND generation - unresolved, the risk-reward at current levels is asymmetric in the wrong direction.
Companion tool
The interactive dashboard lets you sort and filter Lam Research’s key metrics against its ten-company competitive peer set across valuation, growth, quality, risk, and momentum. The Excel model is a downloadable scenario builder with adjustable EPS growth and exit multiple assumptions for each of the four horizons above.
TL;DR
Lam Research is the world’s leading etch and deposition equipment company - a company that has never designed or manufactured a semiconductor chip and never will. What it makes are the machines that carve and build: plasma etch tools that remove material from a wafer with atomic precision (carving the three-dimensional channel holes in 3D NAND chips and the transistor structures in logic), and deposition tools that lay down ultra-thin films of dielectrics, metals, and barrier layers (including atomic-layer deposition systems that place films exactly one molecular monolayer at a time). Lam’s fiscal year ends in late June; FY2026 closes June 28, 2026, three days from the research date, with results expected July 28. The most recent completed fiscal year is FY2025 (ended June 29, 2025), in which Lam posted total revenue of $18,435.6M, up 23.7% year-over-year - a new all-time record. The company reports two segments: Systems (new capital equipment, 62.3% of FY2025 revenue at $11,492M) and CSBG, the Customer Support Business Group (spares, services, upgrades, and the Reliant non-leading-edge equipment line, 37.7% of FY2025 revenue at $6,944M on an installed base that has crossed 102,000 chambers). CSBG is a hybrid - approximately 70-75% is genuinely recurring (spares, service contracts, upgrades) and approximately 25-30% is Reliant, a capital equipment line for trailing-edge customers that is more cyclical; comparing it directly to Applied Materials’ pure-recurring AGS segment overstates its defensive character. The core bull thesis is the memory-leverage argument: every doubling of layer count in a 3D NAND stack roughly doubles Lam’s etch and deposition content per wafer start, so the industry’s march from 200 layers toward 400 and eventually 1,000 is a revenue escalator for Lam independent of aggregate bit demand. Lam’s Cryo 3.0 platform is currently the only publicly disclosed, commercially production-proven cryogenic HAR etch solution at aspect ratios above 60:1 - achieved at 400-layer NAND channel holes - though Tokyo Electron has separately disclosed cryo-etch development work with production-of-record qualifications anticipated. China was 33.7% of FY2025 revenue ($6.21B) and spiked to 43% in Q1 FY2026 ($2.28B in one quarter) as domestic Chinese customers pulled forward deliveries ahead of the BIS affiliate rule issued September 29, 2025; that rule is currently suspended through November 9, 2026, with an estimated $200M quarterly impact when active. A separate Hua Hong Semiconductor restriction active from approximately April 2026 is permanent. Aether dry EUV resist - Lam’s most novel bet, deploying metal-organic photoresist inside the EUV vacuum environment - was adopted for production use by an unnamed leading memory manufacturer in January 2025, widely believed by industry observers to be SK Hynix, though Lam has not confirmed the identity. At $401.82 per share as of June 25, 2026, the market cap is $502.50B; forward P/E sits in the 49-54x range and EV/EBITDA in the 60-64x range (both DISPUTED between sources, presenting the range), placing it at or near the 10-year EV/EBITDA maximum with the analyst consensus mean target of $334-341 sitting 15-17% below the current price. On balance, the evidence across valuation, growth, quality, risk, and momentum lands at Hold: exceptional growth and quality offset by a 10-year-peak valuation, the most concentrated risk profile in the WFE peer set, and an HAR etch moat that is being challenged at the precise node the bull case relies on.
Explore it yourself: the interactive dashboard
What Lam Research actually is
Most investors encounter Lam Research as “a chip equipment stock” and treat it as a semiconductor proxy. That misses two things: what Lam actually does, and what makes it sharply different from every other equipment company in the sector.
The etch-and-deposition specialist. Lam does not build the full WFE toolkit. Applied Materials (AMAT) - the broad-line WFE toll-taker covered here - competes in deposition, etch, CMP, ion implant, and inspection simultaneously. Lam competes only in etch and deposition. That narrowness is not a weakness; it is the source of the company’s technical depth and pricing power. Being the world’s best etch company and a strong number two in deposition is worth more than being a broad but thinner competitor in five categories.
Etch and deposition work together on every chip. Etch is carving: a plasma of reactive gases attacks the wafer surface exactly where a mask allows, removing material with sub-nanometer precision. You use etch to open the channel holes in a 3D NAND chip, to pattern the interconnect metals in a logic chip, and to release the silicon nanosheets inside a gate-all-around transistor. Deposition is building: gases react on the wafer surface to form a new thin film - an oxide, a nitride, a metal, a high-k dielectric - exactly one atomic monolayer at a time in the most demanding cases. A modern 3D NAND chip requires hundreds of alternating etch and deposition passes, each pass adding or removing a film just nanometers thick.
The high-aspect-ratio (HAR) challenge is the engineering problem that makes etch a specialized, defensible business. In a 3D NAND chip at 200 layers, the channel hole connecting all the cell layers is roughly 100 nanometers wide and 6,000-8,000 nanometers deep - an aspect ratio of 60:1 or more, the equivalent of drilling a tunnel 60 times deeper than it is wide with atomic-level precision. Conventional plasma etch fails at this geometry: ions scatter, the hole bows outward, and the yield collapses. Cryogenic etch - where the wafer is cooled to near -100 degrees Celsius before plasma processing - suppresses the lateral passivation chemistry that causes profile degradation. Lam’s Cryo 3.0 platform achieves less than 0.1% critical-dimension deviation at up to 10 microns of channel depth, and does so at 2.5x the etch rate of conventional processes. That performance spec is the toll.
Two reported segments. Lam’s Systems segment covers every new tool sold for leading-edge fab manufacturing: the Flex and Vantex platforms for HAR dielectric etch (the NAND channel-hole tools); Kiyo for conductor etch (patterning metal interconnects in logic and DRAM); Syndion for deep silicon etch (through-silicon vias in HBM stacks); VECTOR CVD for the thick oxide-nitride films that alternate in a 3D NAND stack; STRIKER and ALTUS ALD for atomic-scale conformal gate dielectrics and barrier films; and Aether for dry EUV photoresist deposition. CSBG is the aftermarket engine: spare parts (consumable chamber components that wear out over thousands of wafer cycles), service contracts, technology upgrades to existing tools, and the Reliant product line for non-leading-edge customers. CSBG is explicitly not a pure-service annuity; Reliant is capital equipment and is more cyclical than the service sub-base.
Scale and context. By etch market share, Lam is the global leader - according to multiple industry analyst estimates, it holds approximately 45% of global plasma etch equipment revenue, ahead of Applied Materials at roughly 25% and Tokyo Electron at roughly 20%. In deposition, AMAT leads at 40-45%; Lam holds roughly 17-20%, strong in ALD and CVD for memory but absent from PVD and epitaxy. KLAC - covered here as the inspection/metrology specialist - is complementary to Lam’s process steps, not competitive. ASML holds the EUV lithography monopoly; Lam does not compete in lithography at all. Lithography is the patterning step that precedes etch and deposition and is categorically distinct from them: a light source (in EUV, a laser-generated plasma emitting 13.5nm wavelength photons) projects the circuit design through a patterned reticle onto a photoresist-coated wafer, photographing the circuit geometry into the resist film before any material is etched or deposited. Lam’s Aether platform is litho-adjacent rather than litho: it deposits the photoresist film on the wafer that the EUV tool then exposes, handling the resist-coating sub-step that comes before the light-exposure step ASML owns - which is why Aether and ASML’s scanners are complementary rather than competitive. Lam is the second-largest WFE company by revenue, behind AMAT and slightly ahead of TEL.
Why memory is Lam’s world. Approximately 45-55% of Lam’s Systems revenue in a normalized cycle comes from NAND and DRAM combined - roughly double AMAT’s memory concentration. No other major WFE peer is as concentrated in memory. In Q3 FY2026, the most recent reported quarter, DRAM alone was 27% of Systems revenue (a record) and NAND was 12%, for a combined 39% - and NAND is still in early recovery from the 2022-2023 downcycle, well below its 30-40% peak share. That concentration means Lam captures an outsized share of memory WFE upswings and suffers an outsized share of memory WFE downswings. The CSBG annuity modulates that volatility, but it does not eliminate it.
How money flows through Lam Research
flowchart TD
    AI["AI datacenter build-out\nHyperscaler capex combined ~$725B in 2026"]
    CONSUMER["Consumer / mobile demand\nSmartphones, PCs, SSDs"]
    MEMORY["Memory chipmakers\nSamsung, SK Hynix, Micron, Kioxia\n(YMTC restricted)"]
    FOUNDRY["Foundry / logic chipmakers\nTSMC, Samsung Foundry, Intel Foundry"]
    CAPEX["Fab capex budgets\nTop 5 chipmakers: ~$130B+ combined"]
    WFE["WFE market ~$140B in 2026\nLam management estimate"]
    LITHO["Lithography - ASML EUV monopoly\nLam does NOT compete here"]
    ETCH["Plasma etch ~20% of WFE\nLRCX #1 ~45% share\nAMAT #2 ~25%, TEL #3 ~20%"]
    DEPO["CVD / ALD deposition ~20% of WFE\nAMAT #1 ~40-45%\nLRCX #2 ~17-20%"]
    HAR["HAR etch chokepoint\nCryo 3.0: less than 0.1% CD deviation at 60:1+\nOnly publicly disclosed production-proven solution"]
    SYS["Lam Systems ~$11.5B FY2025\nNew etch and deposition tools"]
    CSBG["Lam CSBG ~$6.9B FY2025\nSpares + service + upgrades\n+ Reliant (25-30% cyclical)"]
    RETURNS["Shareholder returns\nFY2025: $3.4B buybacks + $1.1B dividends = 84% of FCF"]
    CHINA["China / BIS export controls\nBIS affiliate rule: suspended Nov 9 2026\nHua Hong: ACTIVE, permanent\n34% of Q3 FY2026 revenue"]
    UPGRADE["NAND layer-count upgrade cycle\nManagement estimate: $40B before end-2027\nEvery new layer = more Lam content per wafer"]

    AI --> MEMORY
    AI --> FOUNDRY
    CONSUMER --> MEMORY
    MEMORY --> CAPEX
    FOUNDRY --> CAPEX
    CAPEX --> WFE
    WFE --> LITHO
    WFE --> ETCH
    WFE --> DEPO
    ETCH --> HAR
    HAR --> SYS
    DEPO --> SYS
    SYS --> CSBG
    SYS --> RETURNS
    CSBG --> RETURNS
    CHINA -.->|"Restricts new tool sales\nto advanced Chinese fabs"| SYS
    UPGRADE -->|"Mandates new etch and ALD tools\nregardless of aggregate bit demand"| SYS
Money flows through Lam in two parallel paths. The first is a capital event: a memory maker or foundry announces a new node or layer-count transition, places an equipment order with a 6-18 month lead time, Lam manufactures the tool at its Penang (Malaysia) facility or Fremont/Tualatin plants, ships and installs it in the fab, and recognizes revenue on acceptance. The second is the annuity: every installed tool enters the 102,000-chamber installed base and generates 10-plus years of spare-part, service-contract, and upgrade revenue at margins above the original tool sale.
The NAND feedback loop is Lam-specific and matters. Each layer-count transition - from 200 to 300 layers, from 300 to 400 - does not merely sell a tool. It sells many tools: new Flex HAR etch chambers for the deeper channel holes, new VECTOR CVD systems for the thicker oxide-nitride stacks, new STRIKER ALD passes for the increased capacitor dielectric steps. And once those tools are in the fab, every wafer that runs through them generates more spares consumption per wafer start than the prior generation’s tools, because each wafer requires more process passes. The installed base compounds faster than tool count alone suggests.
China cut through this chain in 2025-2026 like a blade. Domestic Chinese customers (CXMT, YMTC affiliates, SMIC affiliates, and Hua Hong before the April 2026 restriction) pulled forward deliveries in the quarter ending September 28, 2025 - one day before the BIS affiliate rule was issued - producing a 43% China spike in Q1 FY2026 that then collapsed as restrictions took effect. That spike-and-drop creates a difficult year-over-year comparison base for the remainder of FY2026 and into FY2027.
The two segments: where revenue actually comes from
Systems: the capital-equipment engine
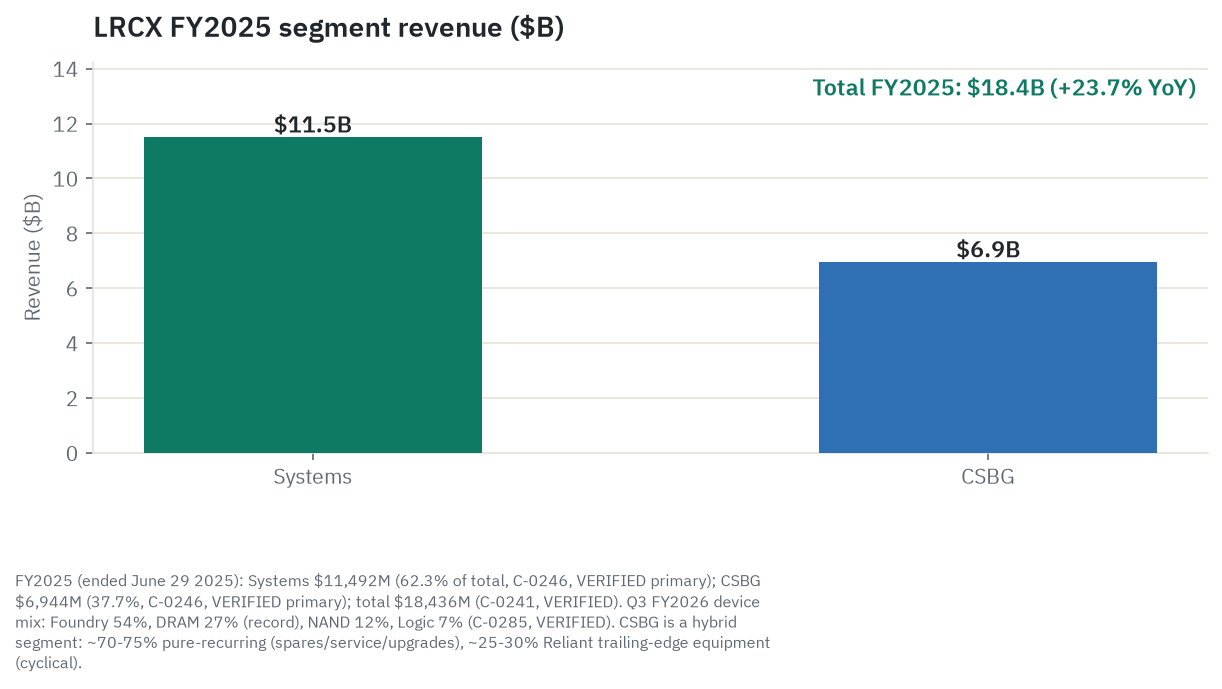
FY2025 Systems revenue was $11,492M (62.3% of total), up 28.8% from the FY2024 trough of $8,924M. This segment is Lam’s primary WFE cycle amplifier. The product families:
- Etch: Flex and Vantex for high-aspect-ratio dielectric etch (the NAND channel-hole and DRAM storage-node flagship); Kiyo for conductor etch (metal patterning in logic and DRAM); Syndion and Akara for deep silicon etch and advanced packaging (HBM through-silicon vias); cryo-etch capability as a module on the Flex/Vantex platform.
- CVD / ALD deposition: VECTOR for thick-film CVD (the critical tool for depositing the alternating oxide-nitride pairs that form the 3D NAND stack); STRIKER and ALTUS for ALD (conformal gate dielectrics, capacitor dielectrics, barrier films, and the new ALTUS Halo for molybdenum metallization); SPEED HDP-CVD for gap fill; Sola UV cure for film densification.
- Aether: dry EUV photoresist deposition - a tool that deposits a metal-organic resist film inside the EUV scanner’s vacuum environment, enabling higher EUV absorption efficiency and eliminating wet-resist pattern collapse at advanced nodes. Adopted for production by an unnamed leading memory manufacturer in January 2025.
The mix within Systems matters. In Q3 FY2026, the device-type breakdown of Systems revenue was: Foundry 54%, DRAM 27% (a record high), NAND 12%, and Logic/Other 7%. NAND at 12% is well below its historical 30-40% share in a full upcycle - the current read is that NAND is in early recovery, not yet at cycle-peak contribution. When NAND recovers toward 20-25% of Systems, the total Systems revenue base grows materially even if the other categories hold flat.
Systems gross margin is estimated at approximately 48-49% based on blended margin behavior and management commentary, but segment-level margin is not disclosed in quarterly earnings releases; this estimate has not been verified at primary tier (the FY2025 10-K note was inaccessible during research due to EDGAR access restrictions and is flagged as an unverified estimate).
CSBG: the hybrid annuity
FY2025 CSBG revenue was $6,944M (37.7% of total), and in Q3 FY2026 CSBG crossed $2,110.9M in a single quarter for the first time - a 25% year-over-year increase on a $2B milestone. The installed base of approximately 102,000 chambers generates an implied revenue of roughly $69,400 per chamber per year at FY2025 levels (a derived estimate: $6,944M divided by approximately 100,000 chambers, not a separately disclosed Lam metric).
CSBG has three genuine-recurring sub-components. Spares and consumables (chamber liners, edge rings, gas delivery components that wear out over thousands of wafer cycles) grow with wafer starts on the installed base, not with new tool orders. Service contracts (preventive maintenance, repair, field engineering) are increasingly multi-year, with renewal economics similar to software subscriptions. Upgrades are the highest-value sub-component: they bring existing Flex chambers to Cryo 3.0 capability, or extend ALTUS systems to molybdenum metallization, deferring customers’ new-capital purchases while extending Lam’s process edge on the installed base.
The fourth sub-component is Reliant - new or refurbished tools for non-leading-edge customers (power devices, automotive, IoT, trailing-edge NAND and logic). Reliant represents approximately 25-30% of CSBG revenue, an estimated $1.7-2.1B annually at FY2025 run rates (a derived estimate, confirmed by management commentary, labeled as VERIFIED in claims). Reliant is capital equipment and is more cyclical than the service sub-base; it also faces growing competition from AMEC and Naura at the trailing nodes it serves. This is the key reason investors should not compare Lam’s CSBG directly to Applied Materials’ Applied Global Services: AMAT restructured AGS to 100% pure-recurring revenue in Q1 FY2026 by transferring the 200mm equipment business to Semiconductor Systems. Lam’s CSBG still carries the Reliant capital-equipment sub-line. The pure-recurring CSBG sub-base is approximately $4.9-5.2B annually (70-75% of $6.94B), not the full $6.94B.
Revenue by device type and geography
Device-type mix: NAND is the missing leg
| Quarter | Foundry | DRAM | NAND | Logic/Other |
|---|---|---|---|---|
| Q1 FY2026 (Sep 2025) | 60% | 16% | 18% | 6% |
| Q2 FY2026 (Dec 2025) | 59% | 23% | 11% | 7% |
| Q3 FY2026 (Mar 2026) | 54% | 27% | 12% | 7% |
(All figures as a percentage of Systems revenue; source: quarterly earnings disclosures, C-0285, VERIFIED primary)
The DRAM trajectory tells the HBM story in a single data series: 16% to 27% of Systems in two quarters, driven almost entirely by SK Hynix HBM3E and HBM4 capacity expansion at its M15x facility in Korea. Management confirmed DRAM’s serviceable addressable market is growing more than 20% from 1C-node dielectric deposition step-count increases alone - meaning even flat DRAM wafer starts generate more Lam revenue per wafer start at each new node, because capacitor dielectrics require more ALD passes to maintain charge storage at scaled geometries.
NAND at 12% of Systems is the conspicuous gap. At the peak of the last NAND upcycle (FY2021-FY2022), NAND represented 30-40% of Lam’s Systems revenue. The current 12% reflects two years of subdued NAND investment, with the NAND WFE market recovering to approximately $21-22B annually as of 2025-2026 (an analyst-tier estimate, C-0219, VERIFIED), still 40-45% below the prior cycle peak. Management’s estimate of a $40B NAND upgrade cycle to be completed before end of calendar 2027 - a Lam management figure, not independently confirmed by SEMI or TrendForce - captures the investment required as the industry moves from sub-200-layer to 300-plus-layer production, driven by the layer-count physics described in the next section.
Geographic mix: the China spike-and-cliff
| Period | China % | Context |
|---|---|---|
| FY2024 | 42.2% | Domestic Chinese chipmakers front-loading ahead of anticipated controls, while global memory makers cut capex |
| FY2025 (full year) | 33.7% | $6.21B; verified from FY2025 10-K |
| Q4 FY2025 | 35% | Last quarter before the BIS affiliate rule |
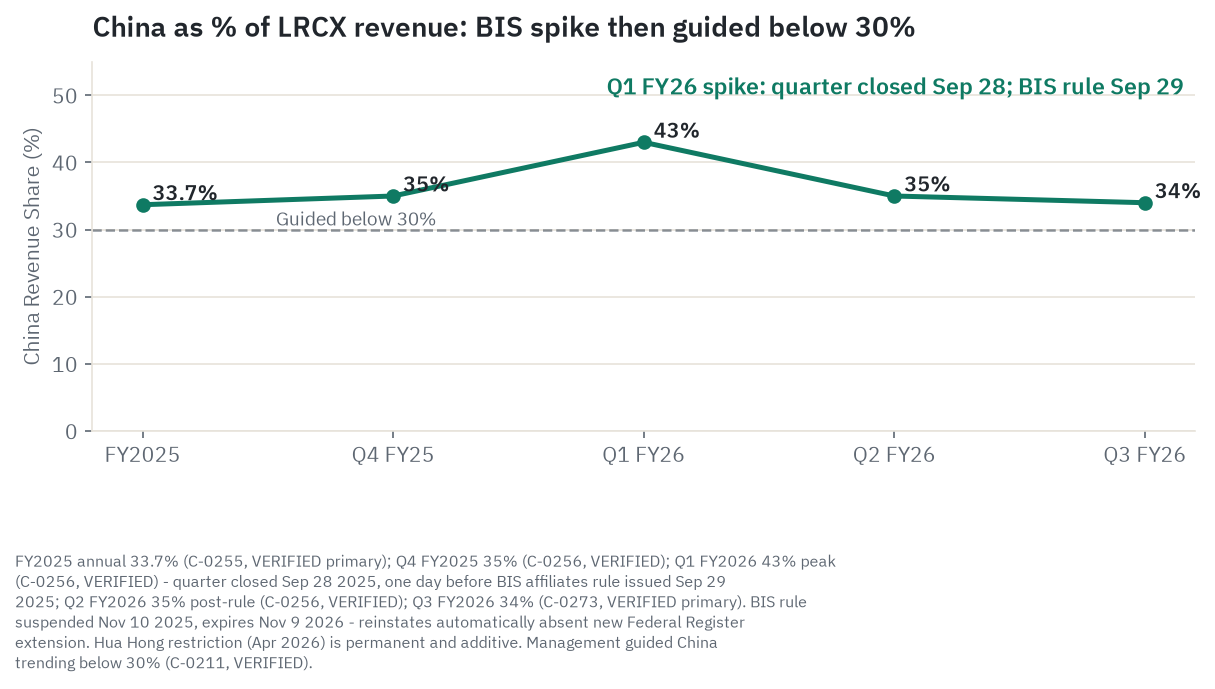
| Q1 FY2026 (ended Sep 28, 2025) | 43% | Pre-rule spike; Q1 ended one day before the BIS rule was issued Sep 29, 2025 |
| Q2 FY2026 | 35% | Rule issued, then suspended Nov 10; timing-shifted shipments |
| Q3 FY2026 | 34% | Stabilizing; Hua Hong restriction added approximately April 2026 |
| Q4 FY2026 | Below 30% (guided) | Management guidance; not yet reported |
The Q1 FY2026 spike to 43% reflects domestic Chinese customers - CXMT affiliates, YMTC affiliates, SMIC affiliates, and Hua Hong before the restriction - accelerating deliveries ahead of anticipated BIS action. The quarter ended September 28, one day before the BIS rule was issued; the spike therefore represents pre-rule customer behavior, not a period of unrestricted access after the rule. What follows is the mirror image: each subsequent quarter pulls lower as restricted entities can no longer receive shipments.
The Hua Hong restriction deserves separate treatment from the BIS affiliate rule. The US Department of Commerce ordered Lam Research, Applied Materials, and KLA to halt certain equipment shipments to Hua Hong Semiconductor - China’s second-largest chipmaker - targeting 28nm and 22nm facilities. This restriction is active and has no stated expiration date; it is not subject to the November 9, 2026 expiry of the BIS affiliate rule. The two restrictions are additive, not overlapping. Lam has not disclosed the specific Hua Hong revenue exposure. Analysts treating the China risk as a single BIS policy event are understating the structural China erosion because Hua Hong represents a permanently restricted customer regardless of BIS affiliate rule outcomes.
Korea (approximately 22-23% of FY2025 revenue), Taiwan (approximately 18-19%), and the United States (approximately 7-8%) are the non-China growth destinations, partially but not fully absorbing the China decline. CHIPS Act fabs - TSMC Arizona Phase 2, Micron New York, Samsung Taylor - add incremental non-restricted demand through 2026-2029.
The memory-leverage thesis: why every NAND layer is a Lam tollbooth
This is the section most specific to Lam versus any other WFE peer. It is also the central bull argument, and the one most worth examining closely.
3D NAND layer count: from 96 to 1,000 layers
3D NAND began as a stack of a few dozen cell layers. Today’s leading-edge devices - Micron’s G8B, Samsung V-NAND Gen 8, SK Hynix 238L - are above 200 layers. The next generation approaches 300-400 layers; industry roadmaps extend toward 1,000 layers by the early 2030s.
Each layer requires at minimum one deposition pass (VECTOR CVD for the oxide-nitride film pair forming the cell) and one or more etch passes (Flex dielectric etch for patterning the stack). A 300-layer device requires approximately 50% more etch passes than a 200-layer device, and the etch time per pass is longer because the stack is physically taller - a physics-based estimate, not a disclosed primary figure from Lam.
The critical inflection comes at the channel-hole aspect ratio. A 200-layer NAND channel hole has an aspect ratio of roughly 50:1 (approximately 100nm wide, 5,000nm deep). At 300-400 layers, the ratio approaches 60:1. At 800-1,000 layers, it approaches 100:1. At 50:1, standard plasma etch works. At 60:1 and above, conventional etch profiles bow outward and yield collapses. Cryogenic etch - where the wafer is cooled to near -100 degrees Celsius before plasma processing, suppressing the lateral chemistry that degrades the profile - is the only production-proven solution. Lam’s Cryo 3.0 achieves less than 0.1% critical-dimension deviation at up to 10 microns of channel depth, at 2.5x the etch rate of conventional processes. This is the physical basis of the competitive moat.
The TEL challenge. Tokyo Electron disclosed “cryo etching POR wins anticipated in 2026” in its FY2026 annual results. Yole Group and SemiAnalysis have confirmed that Samsung is dual-sourcing cryo HAR etch between Lam and TEL at its V10 NAND generation (targeting 400+ layers, with volume manufacturing originally scheduled H2 2025, delayed to 2026). The volume split between Lam and TEL at Samsung V10 is not publicly known; TEL is at qualification stage, not yet confirmed at high-volume manufacturing scale. Lam’s CD deviation specification has not been matched by any TEL public disclosure. But this is still the most strategically important competitive development in Lam’s history: TEL is qualifying at the exact node - the 400-layer, 60:1+ generation - that should have been Lam’s proof point of monopoly. If TEL volumes up at Samsung and then qualifies at SK Hynix or Kioxia, the moat-premium embedded in the 60-64x EV/EBITDA will need to be reassessed.
A full process-of-record qualification-to-volume ramp typically takes 12-24 months from initial POR designation to material revenue, meaning a TEL qualification at Samsung V10 today would likely not surface as volume revenue until 2027 or later. The key observable signal is TEL’s NAND-category equipment revenue in its October-December 2026 quarterly reporting - that will be the first reporting window where early V10 tool shipments could appear in the numbers. The important distinction: Samsung historically qualifies backup suppliers for process redundancy without necessarily splitting volume equally. A 20-30% TEL share at Samsung is different from a 50-50 split. Lam’s primary process-of-record status at SK Hynix and Kioxia - the two largest non-Samsung NAND makers - is the swing variable for the long-term bull case.
DRAM, HBM, and the AI overlay
While NAND is in early recovery, DRAM is in a full expansion cycle. Total DRAM capex is forecast at approximately $61.3B in 2026 (up roughly 14% year-over-year from $53.7B in 2025, an analyst-tier TrendForce estimate), led by SK Hynix at approximately $20.5B for HBM4 expansion. HBM - the stacked DRAM used in AI accelerators like Nvidia’s B200 and H200 GPU series - requires approximately 19 additional manufacturing steps versus standard DRAM and consumes roughly 3x the wafer area per bit. That step-count expansion lands directly in Lam’s product portfolio: Syndion deep silicon etch for through-silicon vias connecting the stacked DRAM dies, STRIKER ALD for TSV liner deposition, and ALTUS for barrier films before copper fill.
Lam’s record DRAM share of 27% of Systems revenue in Q3 FY2026 is the HBM story in a single data point. This is not steady-state; it reflects the most aggressive HBM capacity expansion in memory history, concentrated at SK Hynix’s M15x facility. Micron (MU) - the US memory leader benefiting from CHIPS Act funding for its New York DRAM expansion - is a secondary but growing source of Lam HBM-related demand.
SAM expansion: the mid-30s% claim
Management characterizes Lam’s serviceable addressable market as “slightly more than mid-30s percent of WFE,” targeting the “high-30s percent” over the medium term. At the $140B WFE level (Lam’s own calendar 2026 estimate), mid-30s% implies roughly $47-49B of addressable etch and deposition spending. Lam’s $18.4B FY2025 revenue implies a SAM capture rate of approximately 50-55% of its own addressed market - unusually high and reflecting genuine market leadership in HAR etch, where no competing tool currently matches the qualified production spec.
Technology inflections: where Lam gains content per wafer
Aether dry EUV resist: the non-litho EUV play
Traditional EUV lithography uses wet photoresist - a liquid spin-on chemical coating that limits achievable resolution and is prone to pattern collapse at advanced nodes. Lam’s Aether platform deposits a metal-organic dry resist directly inside the EUV scanner’s vacuum environment. The dry film absorbs EUV photons 3-5x more efficiently than carbon-based wet resists, enables lower EUV dose (higher throughput, lower cost per wafer), and eliminates the pattern collapse that plagues wet resist processing at sub-10nm half-pitch.
Aether was adopted for production use by an unnamed leading memory manufacturer as the tool of record for advanced DRAM EUV patterning processes (announced January 29, 2025; Lam Newsroom, primary source). That customer is widely believed by industry observers to be SK Hynix, based on the 2022 Lam/SK Hynix dry-resist development collaboration and SK Hynix’s DRAM technology leadership, but Lam has not confirmed the customer identity; the article uses “unnamed leading memory manufacturer” throughout and this framing is mandatory.
A separate IBM five-year collaboration (announced March 2025) covers co-development of sub-1nm logic fabrication using High-NA EUV and Aether dry resist. The JSR Corporation cross-licensing deal addresses the resist materials supply chain. These are R&D agreements, not near-term shipment events. Aether is 3-5 year revenue story at scale; a second production customer would validate the commercial model. No second customer has been announced as of the research date.
Molybdenum gate fill and carbon gapfill
Two specific materials innovations Lam has already commercialized and placed in production: molybdenum CVD to replace tungsten in gate contacts for advanced logic (lower resistivity at sub-10nm gate widths, and in NAND word lines), and carbon-based CVD gapfill for deep trenches in 3D NAND word-line structures and DRAM cells. Management cited “several hundred million dollars” in NAND and moly shipments in 2025 as near-term drivers. These represent incremental dollar-per-wafer additions on existing tool platforms.
Gate-all-around: selective SiGe etch
GAA transistors stack silicon nanosheets surrounded by gate dielectric on all four sides, replacing the three-sided FinFET architecture. The critical Lam-specific step: selective SiGe etch. To form a silicon nanosheet, the process grows alternating layers of silicon and silicon-germanium (SiGe); a highly selective plasma etch then removes only the SiGe layers, leaving the silicon nanosheets suspended. This etch must remove SiGe without touching the silicon at all - a demanding selectivity requirement. Lam competes with AMAT for the SiGe selective etch process-of-record at TSMC N2, Samsung SF2, and Intel 18A. As of the research date, neither Lam nor AMAT has publicly confirmed a process-of-record win for GAA selective SiGe etch at TSMC N2 or Samsung SF2; the revenue split between the two companies at those nodes remains unresolved in the public record, and readers should treat both companies’ claims to that content as contested rather than secured. Intel 18A adds a further Lam content opportunity through backside power delivery networks (BSPDN): routing power rails to the back side of the wafer creates additional back-side dielectric etch and deposition steps - a module that did not exist at prior Intel nodes - incrementally expanding Lam-addressable content per wafer start. The GAA ALD gate-dielectric step (STRIKER competing with AMAT Centura and ASM International Pulsar/Sprinto) is the other major GAA content add.
Advanced packaging: Akara and HBM TSV
Lam’s advanced packaging portfolio - Akara for through-mold via etch and advanced fan-out patterning, Syndion for HBM TSV drilling, ALTUS for TSV liner deposition - is growing more than 50% in calendar 2026 per management guidance at the Q3 FY2026 earnings call. This growth reflects the conversion of standard DRAM capacity to HBM, which increases etch and ALD content per wafer start by roughly 2-3x versus standard DRAM.
China exposure and the export-control gauntlet
China’s share of Lam’s revenue followed a trajectory that no single data point captures: 25.6% in FY2023, 42.2% in FY2024 (domestic Chinese chipmakers front-running anticipated restrictions while global memory makers cut capex), 33.7% in FY2025, spiking to 43% in Q1 FY2026 (one day before the BIS rule), and now declining below 30% as restrictions compound.
The BIS 50%-affiliate rule. Issued September 29, 2025, this rule extended export controls to companies more than 50% owned by entity-listed Chinese fabs (YMTC, CXMT, SMIC, and Hua Hong affiliates). The rule was suspended November 10, 2025, for one year through November 9, 2026, pending US-China trade negotiations. It reinstates automatically on November 9, 2026, absent a new Federal Register extension or revocation. When active, the rule created an estimated $200M per quarter, $600M annual revenue impact (Jones Day and Arnold & Porter legal analysis, press-tier attribution; this figure is not a Lam filing disclosure). The November 9 date is the most important binary event in the next six months for Lam shareholders.
The Hua Hong restriction. The US Department of Commerce ordered Lam, AMAT, and KLA to halt certain equipment shipments to Hua Hong Semiconductor (China’s second-largest chipmaker) targeting 28nm and 22nm facilities, issued approximately April 2026. This restriction is active and has no stated expiration date. It is separate from and independent of the BIS affiliate rule - the two restrictions are additive, not a single policy event. Lam has not disclosed its specific revenue exposure to Hua Hong.
The YMTC and CXMT entity lists. These are permanent restrictions (absent a US government reversal) in place since 2022-2023. Tools cannot be shipped to these entities without a license that is typically denied for advanced node equipment.
Domestic substitution - the structural overlay. Analyst consensus treats China revenue decline as primarily a policy story. The data suggests it is also a structural one. China domestic semiconductor tool adoption reached approximately 35% of overall equipment spend in 2025, exceeding the government’s 30% target. The Chinese government now mandates 50% domestic sourcing for new capacity additions. AMEC (688012.SS) holds a dominant position in China’s domestic ICP etch market, estimated by industry analysts at approximately 70-75% of that segment though this figure is not confirmed at primary tier; AMEC reported FY2024 revenue of approximately $1.25B, up 44.7% year-over-year. AMEC’s HAR etch capability is estimated by analysts to lag Lam’s Cryo 3.0 by one to two technology generations at aspect ratios above 60:1 - this characterization is an analyst inference, not a primary-source confirmation. For sub-200-layer NAND at sub-60:1 aspect ratios (where the majority of Chinese NAND production currently operates), AMEC tools are reportedly competitive for certain etch steps. AMEC’s substitution risk accelerates toward the 3-5 year horizon if Chinese fabs continue pushing layer counts toward 200L+.
Even if the BIS affiliate rule lapses permanently tomorrow, Chinese fabs that have already qualified AMEC tools for mature-node etch are unlikely to revert. Analyst consensus expects China to settle structurally at 18-22% of Lam revenue under the current restriction regime; the precise outcome depends on US-China trade policy developments through and beyond the November 9, 2026 affiliate-rule expiry.
The CSBG China tail: BIS restrictions to date target new tool (Systems) deliveries. Lam’s China-installed CSBG base - estimated at $700M-$1.1B of annual service and spares revenue, an analyst estimate not verified at primary tier - currently generates revenue from already-delivered tools. If BIS were to extend controls to service contracts and spare parts for tools already installed at restricted entities, that annuity is directly at risk. Management has flagged this risk in the FY2025 10-K risk factors. It is not current policy, but it is the highest-magnitude downside scenario for CSBG.
Customer concentration and key relationships
Samsung Electronics and TSMC are each disclosed in Lam’s FY2025 10-K as individually accounting for more than 10% of total revenue in FY2025, FY2024, and FY2023. No other customer is named at the 10% threshold. SK Hynix, Micron, and Intel are widely understood to be among the next tier of significant customers based on geographic and device-type revenue data - Korea’s 22% share of FY2025 revenue implies Samsung and SK Hynix together as the dominant customers; the US 7.5% share points to Micron and Intel - but neither is separately named in Lam filings at the 10% threshold.
Samsung. Likely the single largest customer, covering both NAND (V-NAND generations, with V10 at 400+ layers now in qualification) and DRAM (HBM3E and standard DRAM). Samsung’s V10 timeline slip from H2 2025 to targeting H2 2026 (confirmed by multiple trade press sources) is the single most important operational variable for NAND upgrade timing. Samsung’s capex allocation between memory and its foundry business (Samsung SF2 ramp at 3nm and 2nm GAA) is a secondary variable.
SK Hynix. The HBM3E leader supplying Nvidia and the most likely candidate for the unnamed Aether production customer. SK Hynix’s $20.5B capex budget for 2026 (TrendForce analyst estimate) is the primary source of Lam’s record DRAM share of Systems revenue. SK Hynix HBM4 at its M15x facility drives the Syndion TSV etch and STRIKER ALD demand through 2026-2027.
Micron (MU). The CHIPS Act beneficiary, receiving $6.1B for New York DRAM expansion. Micron’s HBM3E ramp at its Boise Idaho fab and the New York DRAM capacity are both Lam demand sources. The New York fab expansion adds US-geography demand that is entirely outside export-control risk.
Kioxia / Western Digital. Joint-venture NAND fabs in Japan (Yokkaichi and Kitakami) are critical to Lam’s NAND revenue and Japan’s roughly 10% share of Lam revenue. Kioxia BiCS9 (332 layers, Kitakami facility) uses Lam’s HAR etch tools. Kioxia-SanDisk BiCS10 capex is reportedly rising approximately 41% year-over-year (TrendForce, VERIFIED analyst tier) - a significant NAND supply addition that the skeptic flags as a potential oversupply trigger if demand disappoints.
TSMC. N2 GAA ramp at TSMC Hsinchu and Arizona Fab 21 Phase 2 is the most important near-term logic capex event for Lam’s etch and ALD revenue in foundry. TSMC’s $52-56B 2026 capex budget (management disclosure, C-0356, VERIFIED) directs roughly 70-80% at N2 and A16 (GAA) nodes.
Competitive position
Lam vs AMAT: co-leaders in etch and deposition
Applied Materials is Lam’s most direct competitor across both etch and deposition. AMAT’s Sym3 platform competes in conductor and dielectric etch; AMAT’s Centura ALD competes with Lam’s STRIKER. The key structural difference: AMAT also competes in CMP, ion implant, and PVD - categories where Lam has no product. In return, Lam dominates HAR etch for 3D NAND channel holes in a way AMAT does not match; AMAT has no disclosed production-ready cryo HAR etch platform at the 60:1+ specification as of the research date.
| Metric | LRCX | AMAT | KLAC | ASML |
|---|---|---|---|---|
| Market cap (Jun 25, 2026) | $502.50B | $530.36B | $338.06B | $698.29B |
| Trailing P/E | ~76x | ~63x | ~73x | ~61x |
| Forward P/E | 49-54x (DISPUTED) | ~45x | ~54x | ~47x |
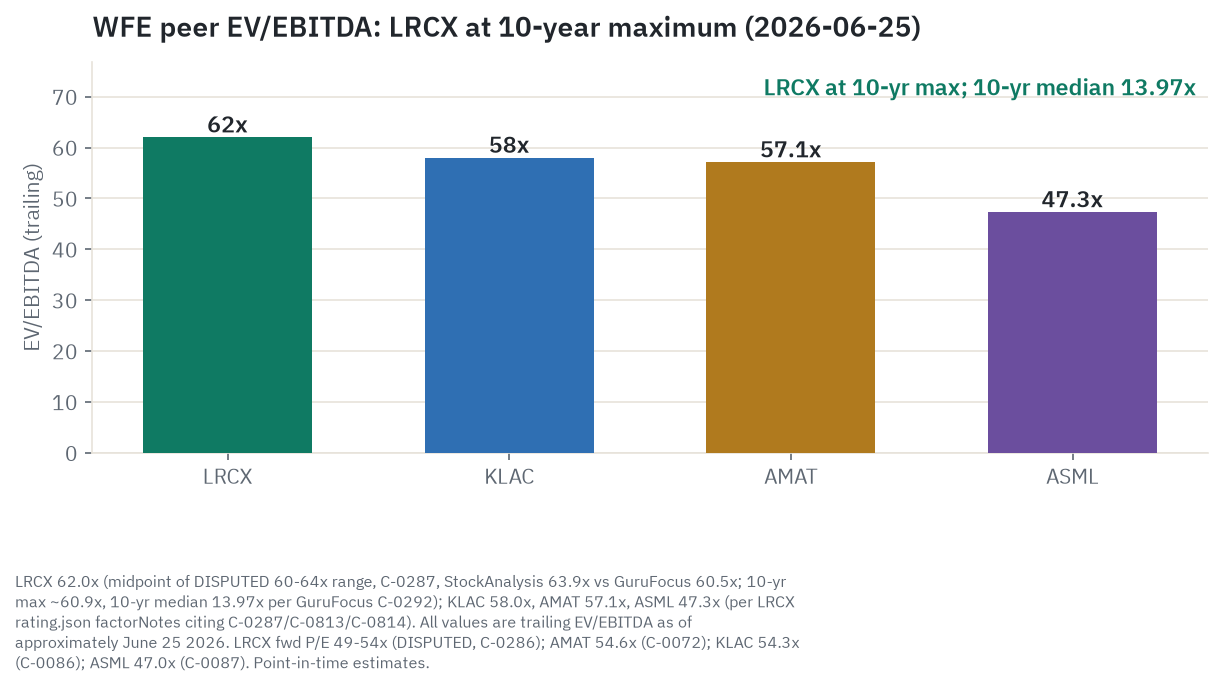
| EV/EBITDA | 60-64x (DISPUTED) | ~57x | ~58x | ~47x |
(Market cap figures: C-0811 LRCX, C-0812 AMAT, C-0813 KLAC, C-0814 ASML; all point-in-time June 25, 2026. Forward P/E and EV/EBITDA are DISPUTED between data vendors as noted in the methodology section.)
Lam’s EV/EBITDA at 60-64x is the highest in the US-listed WFE peer set, above both AMAT (approximately 57x) and KLAC (approximately 58x), and materially above ASML (approximately 47x). The premium reflects the market’s view that Lam’s HAR etch near-monopoly and NAND leverage justify a structural growth premium over the broader WFE basket. Whether that premium survives the TEL cryo etch challenge at Samsung V10 is the central valuation question.
Lam vs TEL: the most important competitive development
Tokyo Electron competes with Lam in NAND thick-film deposition using thermal furnaces and has now disclosed cryo etch development. TEL’s thermal furnace platforms offer lower cost-per-wafer for certain thick-film deposition applications, but VECTOR single-wafer CVD provides tighter uniformity for leading-edge NAND. The cryo etch disclosure is new and significant: TEL’s FY2027 guidance flagged cryo etch POR wins anticipated in 2026, and the Samsung V10 dual-sourcing at qualification stage is confirmed at analyst tier (Yole Group). TEL’s HAR etch market entry at the 400-layer generation is the bear case catalyst that the skeptic assigns the highest probability weight.
Lam vs KLAC and ASML
KLAC is inspection and metrology - it measures what Lam etches and deposits. Largely complementary. ASML holds the EUV lithography monopoly. Lam does not compete in lithography. Aether is a litho-adjacent tool that feeds into ASML’s EUV ecosystem rather than competing with it; ASML must support Aether resist compatibility for adoption to scale.
Screen Holdings: non-competitive, co-occurring
Screen Holdings (7735.T, Tokyo Stock Exchange; approximately $4B in annual semiconductor-equipment revenue as of the fiscal year ended March 2026; no liquid US ADR) makes single-wafer wet-clean equipment and coat/develop systems - the tools that clean wafer surfaces before and after each process step and apply photoresist for lithography. Screen does not make etch or deposition tools and does not compete with Lam in any product category. The relevance here is structural: Screen’s wet-clean tools co-occur with Lam’s Flex and VECTOR tools in every advanced fab, and as 3D NAND escalates to 300-400 layers, the number of clean steps that bookend each Lam etch and deposition pass grows proportionally. Screen is a non-competitive peer that benefits from the same NAND layer-count driver that benefits Lam, without the moat risks or China exposure in the same form. US investors wanting this exposure need an international brokerage with Tokyo Stock Exchange access; the currency risk (JPY/USD) applies.
China domestic competitors: AMEC and Naura
AMEC’s dominant position in China domestic ICP etch (estimated 70-75% of that segment, analyst-tier, unconfirmed at primary) and Naura’s broader portfolio represent the two faces of the structural erosion of Lam’s accessible Chinese TAM. Naura (002371.SZ, Shenzhen Stock Exchange; approximately $5.4B revenue in its fiscal year 2025, up 31% year-over-year) is actually larger by revenue than AMEC (approximately $1.7B in FY2025) and poses a wider systemic threat because its portfolio spans CVD, ALD, PVD, etch, and diffusion - roughly the combined breadth of AMAT’s and Lam’s deposition and etch product lines at trailing-edge nodes. AMEC is the most direct etch-specific threat; Naura is the most diversified systemic threat. Neither has demonstrated production-capable HAR etch at aspect ratios above 60:1 as of the research date, but both are advancing rapidly in the sub-200-layer NAND and trailing-edge categories where the majority of Chinese NAND production currently operates.
ACM Research (ACMR, NASDAQ-listed; approximately $900M revenue in FY2025, more than 85% from Chinese fab customers) adds a third dimension. ACM’s single-wafer wet-clean and advanced packaging tools - including HBM through-silicon via cleaning equipment - serve Chinese fabs that cannot buy certain Lam etch tools under current restrictions. ACM does not substitute for Lam’s etch or deposition platforms, but its TSV cleaning tools are functionally complementary to Lam’s Syndion TSV etch at those same restricted fabs, and its growth is the mirror image of Lam’s China Systems revenue decline. Unlike AMEC and Naura (accessible only through Chinese exchanges), ACM Research is fully US-listed, making it the most accessible China semiconductor localization proxy for US investors.
The technology gap in HAR etch at 60:1+ aspect ratios - estimated at one to two technology generations for AMEC specifically (an analyst inference, not a primary-source figure) - provides time but not a permanent wall for Lam’s Chinese installed base.
Financials from the filings
All dollar figures are GAAP unless noted. All per-share figures are post-split (10-for-1, effective October 2, 2024).
Income statement: the recovery and the trajectory
| Fiscal Year | Revenue | YoY | Gross Margin | Operating Margin | GAAP Diluted EPS |
|---|---|---|---|---|---|
| FY2023 (ended Jun 25 2023) | $17,428.5M | - | 44.6% | 29.7% | $3.32 |
| FY2024 (ended Jun 30 2024) | $14,905.4M | -14.5% | 47.3% | 28.6% | $2.90 |
| FY2025 (ended Jun 29 2025) | $18,435.6M | +23.7% | 48.7% | 32.0% | $4.15 |
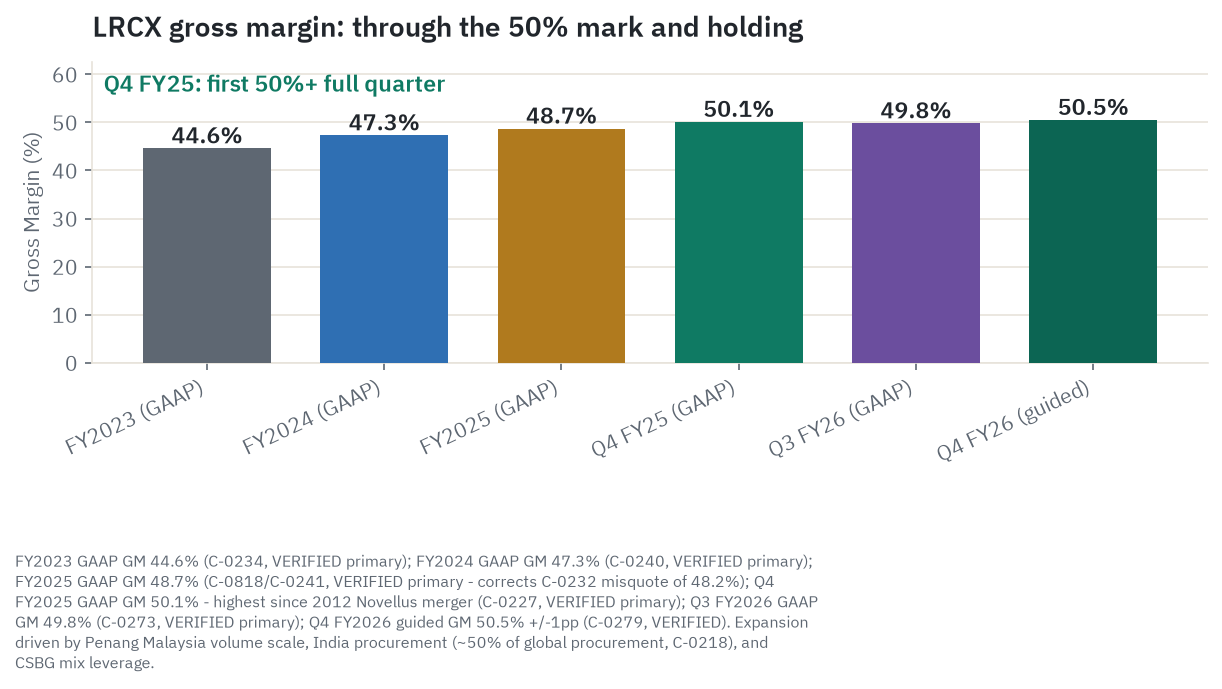
FY2024 was the memory capex trough year. Revenue fell 14.5% - deceptively mild given that NAND WFE fell approximately 50-55% from its 2021-2022 peak, because CSBG’s roughly $6B floor and HBM/DRAM partial recovery absorbed much of the Systems shortfall. Gross margin improved during the trough year (from 44.6% to 47.3%) because CSBG’s higher-margin revenue mix rose to 40.1% of the total. FY2025 recovered to a new all-time revenue record with gross margin expanding to 48.7% (48.7%, not the 48.2% that appeared in an earlier research draft; 48.7% is the verified primary figure from the Q4 FY2025 earnings press release).
FY2026 quarterly progression:
| Quarter | Revenue | YoY | Gross Margin | Non-GAAP EPS |
|---|---|---|---|---|
| Q4 FY2025 (Jun 2025) | $5,171.4M | +33.6% | 50.1% | $1.33 |
| Q1 FY2026 (Sep 2025) | $5,324.2M | +13.0% | 50.4% | $1.26 |
| Q2 FY2026 (Dec 2025) | $5,344.8M | +22.0% | 49.6% | $1.27 |
| Q3 FY2026 (Mar 2026) | $5,841.5M | +24.0% | 49.8% | $1.47 |
| Q4 FY2026 (guided) | $6,600M +/-$400M | ~+28% | 50.5% +/-1% | $1.65 +/-$0.15 |
Q4 FY2026 has not yet been reported as of the research date (June 25, 2026); the quarter ends June 28, 2026. Guidance of $6.6B in revenue and $1.65 non-GAAP EPS is management guidance, not a reported actual; results are expected on or around July 28, 2026. Annualizing Q1 through Q3 at $16,510.5M plus the Q4 guidance midpoint of $6,600M implies full-year FY2026 revenue of approximately $23.1B, roughly 25% above FY2025, if Q4 delivers at the midpoint. All full-year FY2026 figures in this article are therefore estimates derived from guidance plus three reported quarters, not reported actuals.
The gross margin crossing 50% at Q4 FY2025 and holding near that level since is a structural improvement, not a mix accident. Management attributes it to: the Penang, Malaysia manufacturing facility (approximately 800,000 sq ft, the largest Lam facility) providing scale-driven cost efficiencies; India operations handling approximately 50% of global procurement, lowering component costs; and favorable product mix as CSBG’s higher-margin spares and services grew faster than Systems in recent quarters.
R&D expense was approximately $2,100M in FY2025 (approximately 11.4% of revenue), an estimate based on the Q4 FY2025 quarterly run-rate of $580M annualized; the exact FY2025 annual total was not independently verified from a directly accessed 10-K annual table due to EDGAR access restrictions during the research session.
Cash flow and balance sheet
FY2025 free cash flow was $5,414.1M (29.4% FCF margin), a record. Operating cash flow was $6,173.3M; capital expenditures were $759.2M (4.1% of revenue). The capital-light model - Lam’s own capex is a fraction of the capex of the memory makers it serves, which spend 20-30% of revenue on plant and equipment - is fundamental to the FCF margin structure.
Through Q3 FY2026 (nine months), cumulative buybacks totaled $3,604.8M and dividends paid $945.3M, for total capital returns of $4,550.1M - funded by $3,622.8M in nine-month FCF plus balance sheet cash. The $10B buyback authorization (announced May 21, 2024, no expiration) had approximately $4.3B remaining as of the Q3 FY2026 earnings date (April 22, 2026). In Q3 FY2026 alone, Lam returned 139% of free cash flow to shareholders.
The balance sheet is net cash-positive. At Q3 FY2026 end (March 29, 2026): cash and investments of $4,750.9M against total debt of $3,734.5M, net cash of approximately $1,017M. The Q3 cash position declined sharply from Q2 ($6,180.4M) because Lam retired $750M of 3.75% senior notes at maturity in March 2026 while simultaneously repurchasing $1,162.8M of stock. No near-term debt maturities remain; the next significant obligations are 4.0% notes due 2029 and 1.9% notes due 2030.
The operating leverage read
At Q4 FY2026 guidance midpoint of $6.6B in a single quarter (annualizing to approximately $26B), the guided operating margin is 36.5% - roughly 450 basis points above FY2025’s 32.0%. The explanation is straightforward: R&D (approximately $2.1B per year) and SG&A (approximately $950M per year) are largely fixed over the short term, so every incremental revenue dollar above the cost base flows through at very high incremental margins. In the FY2024 downcycle, the operating margin fell only from 29.7% to 28.6% on a 14.5% revenue decline - the CSBG mix expansion partially offset the Systems revenue drop.
Market action and valuation
Price and recent performance (all figures point-in-time, June 25, 2026)
- Close: $401.82 (NASDAQ, June 25, 2026; post-split; C-0811, VERIFIED)
- Market cap: $502.50B (C-0260, VERIFIED; StockAnalysis cross-confirmed CNBC)
- 52-week high: $409.75 (June 22, 2026)
- 52-week low: approximately $90.94 (summer-fall 2025, during the BIS affiliate-rule shock)
- Position in 52-week range: 97.5% - the stock ended within $8 of its all-time high
- YTD 2026 total return: +135.17% from $171.18 (December 31, 2025 close; ytdreturn.com, C-0270, VERIFIED)
- Beta (5-year): approximately 1.87 (StockAnalysis; single-source, flagged UNVERIFIED as a standalone figure but directionally consistent with observed volatility)
All figures above are point-in-time and move daily; verify before acting.
The move from approximately $90.94 to $401.82 in roughly twelve months (+342%) is among the most powerful single-year recoveries in WFE history. It was driven by a combination of: NAND recovery signals in the NAND spot price and capex commentary; HBM/DRAM AI capex strength (record 27% DRAM share of Systems in Q3 FY2026); Q3 FY2026 earnings of $5,841.5M (+24% YoY) and non-GAAP EPS of $1.47 above the guidance high end; and Micron’s strong Q3 2026 results boosting sector sentiment in June 2026.
Valuation: the highest multiple in the peer set
At $401.82, Lam trades at:
- Trailing P/E: approximately 76x on TTM GAAP EPS of approximately $5.30 (four quarters: Q4 FY2025 $1.35 + Q1-Q3 FY2026 $1.24+$1.26+$1.45; single-source StockAnalysis, flagged UNVERIFIED as standalone)
- Forward P/E: 49-54x (DISPUTED: StockAnalysis 53.47x vs GuruFocus 49.00x; both figures recorded, neither selected as definitive). At 53.47x, the implied FY2027 consensus non-GAAP EPS is approximately $7.51 (derived: $401.82 / 53.47).
- EV/EBITDA: 60-64x (DISPUTED: StockAnalysis 63.90x vs GuruFocus 60.54x as of approximately June 11, 2026). Both confirm the multiple is at or near the 10-year historical maximum of 60.9x (GuruFocus, single-source, directionally reliable). The 10-year median EV/EBITDA is approximately 13.97x (GuruFocus, C-0292, single-source), placing the current multiple 333-357% above the long-run norm - the most stretched single valuation figure in this analysis.
This is the highest EV/EBITDA in the US-listed WFE peer set at the research date: LRCX at 60-64x versus AMAT at approximately 57x, KLAC at approximately 58x, and ASML at approximately 47x.
The reversion math is stark. At management’s own FY2028 targets of $25-27B revenue and 35% operating margins (company targets, management forecasts, not verified future outcomes), a reversion to 25x EV/EBITDA implies enterprise value of approximately $237-250B - roughly 50-53% below the current enterprise value of approximately $501B. Even at 30x EV/EBITDA, the implied value is approximately $285-300B, still roughly 40-43% below current levels. The bear case for valuation does not require any fundamental deterioration in the business; it requires only that the multiple reverts to a level that is still comfortably above Lam’s own 10-year median.
The stock is at or near its 10-year EV/EBITDA maximum, which has historically preceded multiple compression in prior WFE cycle turns.
The jump from the roughly 14x 10-year median EV/EBITDA to the current 60-64x is not irrational on its face. The approximately 14x median reflected the market pricing Lam as a pure memory-capex cyclical: no meaningful CSBG annuity at scale, no content-per-wafer structural driver visible to investors, and a NAND cycle prone to 50% peak-to-trough collapses that made the business look like a commodity equipment supplier. The re-rating to 50-60x reflects the market assigning structural-compounder status: the HAR etch physics barrier that intensifies with every generation of deeper NAND, the CSBG annuity compounding toward $7B-plus on more than 100,000 chambers, and the Aether SAM expansion adding a litho-adjacent revenue category. The risk is that the re-rating depends entirely on the HAR etch moat holding - if TEL reaches co-equal status at multiple NAND makers, the structural-compounder narrative deflates and the multiple reverts toward the historical cyclical range.
Rate sensitivity adds a distinct risk channel on top of the cycle and moat considerations. At 60-64x EV/EBITDA, Lam’s multiple is substantially more sensitive to discount-rate movements than peers trading at 30-40x: a sustained rise in the 10-year US Treasury toward 5% - a level reached in late 2023 and not a remote scenario - could compress Lam’s multiple toward 40-45x independent of any change in the earnings trajectory. That compression alone would reduce enterprise value by roughly 30-35% even in a scenario where Lam delivers exactly on management guidance. Lower-multiple peers face the same rate pressure in direction but absorb it with lower absolute magnitude.
Sell-side consensus (point-in-time, June 25-26, 2026)
34-35 analysts cover LRCX. The breakdown: approximately 28-29 at Buy or Strong Buy, 5-6 at Hold, 0-1 at Sell. Consensus label: Moderate Buy. Mean price target: $334-341 (MarketBeat $334.43, StockAnalysis/S&P Global $340.58). High target: $480 (Bank of America, raised June 23, 2026). Low target: $115-220 (range across sources; the $115 appears to be a stale or outlier entry).
The critical observation: the consensus mean of $334-341 sits approximately 15-17% below the current price of $401.82. This is the stale-target dynamic, not a statement that the stock is 17% overvalued. The most recently revised targets (BofA $480, Wells Fargo $450, Citi $450 - all raised June 17-23, 2026 following the CFO’s BofA Technology Conference comments) are closer to or above the current price. The mean is dragged down by older, unrevised models from analysts who have not yet reset estimates following the April 22 earnings beat and the June CFO conference. A consensus mean target below a rising stock price is a sell-side lag signal, not a valuation call.
Technical read (description, not a prediction)
All from Barchart, as of June 25, 2026:
- 20-day SMA: $352.64 (price is $49, or +14%, above)
- 50-day SMA: $308.07 (price is $94, or +30%, above)
- 200-day SMA: $215.82 (price is $186, or +86%, above)
- RSI (14-day): 64.74 - approaching overbought territory but not yet at the extreme readings above 70 that have historically preceded near-term pullbacks
Short interest: 32.07 million shares, 2.57% of float (StockAnalysis, June 2026). Bears are not pressing the case aggressively; the low short base also means minimal short-covering fuel is available to sustain a further rally.
Insider activity (Form 4, factual)
Over the twelve months ending June 25, 2026: 0 insider buys, 6 sells totaling approximately $72.26M. Notable disclosures: Eric Brandt (Director) sold approximately 54,500 shares at $350.80 on June 11, 2026 (approximately $19.1M, per Form 4); Douglas R. Bettinger (CFO) sold approximately 90,386 shares in March 2026 (approximately $20.5M total, per Form 4). This selling activity is consistent with executive compensation plan exercises in the context of a stock that had more than doubled year-to-date. It does not on its own indicate negative fundamental conviction. The pace of $72M in 12 months with zero offsetting purchases by any insider is a mild contrarian data point that belongs in any complete picture, not a bearish signal by itself.
Sentiment and the narrative read
The dominant narrative arc over the six months through June 2026: record-quarter beat drives WFE supercycle confirmation, China restriction jolt causes sharp dip, fast recovery to all-time high. This pattern - dip on China news, recover within days - has now repeated three times in the past year. The market has habituated to China bad news as a buying opportunity.
That behavioral pattern is precisely where narrative and fundamentals diverge. The crowd frames China restriction as a “known, priced-in risk.” The filed data shows China was 43% of revenue as recently as Q1 FY2026; even at the current 34% trajectory, the BIS affiliate rule reinstating November 9 would apply its $200M quarterly impact on top of the permanent Hua Hong restriction. A broader BIS extension to service/spare parts would be qualitatively different from the restrictions priced so far. Three sharp China-news dips followed by fast recoveries conditions investors to buy the dip; the fourth event might not follow the same script.
The crowd also tends to capitalize Aether as a near-term revenue driver. The filed reality is one production adoption at one unnamed customer since January 2025. The IBM collaboration is R&D. The JSR cross-licensing addresses materials supply. No second customer has been announced. Aether is option value that the market is capitalizing alongside the current business multiple, not a near-term earnings contributor.
The sell-side target-raise wave of June 2026 (Barclays, Oppenheimer, Citi, Wells Fargo, BofA all raising targets in a 12-day window following the June 2 BofA Technology Conference) is a conventional sell-side revision cluster, not independent confirmation of a higher intrinsic value. Each firm cited CFO Douglas Bettinger’s conference comments as the direct catalyst. Revision clusters after a management event often lag the price move rather than lead it.
What the OSINT data gets right: the NAND layer-count toll thesis is directionally correct and analytically sound. Management’s $40B NAND upgrade estimate (a company forecast, not a SEMI or TrendForce figure) represents a real and physically mandated capital cycle. The HBM/DRAM AI capex investment (DRAM at a record 27% of Systems) is genuine, not speculative. The CSBG annuity growing 25% year-over-year with the installed base is real progress. The business has earned much of the re-rating it has received.
What it tends to skip: the TEL dual-sourcing at Samsung V10 at the exact node the bull case describes as a Lam monopoly; the $72M in insider selling with zero insider buys in the past twelve months; and the arithmetic fact that at 53x forward P/E, even the bull case over five years produces only a 50% total return, while the base case produces a nominal loss.
Macro and durability
WFE cycle: where we stand in mid-2026
SEMI confirmed global semiconductor manufacturing equipment billings of $135.1B in 2025, up 15% from $117.1B in 2024. Lam management raised its calendar 2026 WFE estimate to $140B at the Q3 FY2026 earnings call (April 22, 2026), with “upward bias.” The two figures are not directly comparable (Lam’s $140B includes back-end equipment; SEMI’s front-end-only estimate is lower), but both directional signals point to a third consecutive year of expansion. The growth rate is decelerating in a normal late-cycle pattern: WFE grew roughly 24% year-over-year in mid-2025, moderated to 14% by early 2026, and SEMI projects approximately 9% for full-year 2026. Deceleration from 24% to 9% is maturation, not reversal - but it is not the acceleration that justifies multiples near the 10-year peak.
The AI capex chain and the durability question
The AI-to-WFE chain: hyperscaler compute spend feeds Nvidia GPU demand, which feeds TSMC and Samsung Foundry capex at leading nodes, which feeds WFE etch and deposition orders. Simultaneously, every Nvidia H200/B200 GPU uses 6-8 HBM3E stacks, which feeds SK Hynix and Micron HBM capex, which feeds DRAM WFE for TSV etch and ALD. Lam sits at the intersection of both chains.
Combined Microsoft, Alphabet, Amazon, and Meta capital expenditures for 2026 are guided at approximately $725B, up approximately 77% from 2025 levels. TSMC’s 2026 capex budget is $52-56B (TSMC management guidance). These commitments are real and funded. The credible concern is 2027-2028: Sequoia’s David Cahn estimated a roughly $600B annual gap between what hyperscalers are investing and what AI-attributable revenues currently justify at a 25% return threshold (an analyst estimate, not a verified accounting figure). If enterprise AI adoption proves slower than anticipated and hyperscaler capex growth decelerates from 77% to 13% in 2027 (an analyst estimate, Allianz research), that deceleration reaches TSMC’s capex guidance with a 12-18 month lag - implying logic/foundry WFE orders moderate in late 2027 and 2028.
For Lam, the AI digestion risk is modulated by the NAND overlay. Even if foundry/logic WFE growth slows in 2027-2028, the NAND layer-count upgrade spending creates an independent demand leg. In the prior cycle (2022-2023), NAND collapsed while logic/foundry held up. The reverse - logic/foundry moderating while NAND upgrades deliver - could partially buffer Lam from a 2027-2028 logic WFE slowdown, depending on NAND upgrade timing.
The most likely trigger for a downturn: a NAND oversupply event in 2027-2028, triggered by Samsung, Kioxia/SanDisk, or SK Hynix committing to new wafer-start capacity simultaneously with the 300-400 layer upgrade cycle, at a time when AI storage demand grows more slowly than the simultaneous supply adds. That event is not imminent: as of mid-2026, NAND contract prices are elevated and Kioxia’s entire 2026 production output is reportedly sold out per TrendForce monitoring, making a near-term glut unlikely. The risk window opens in 2027-2028 as Samsung V10 and Kioxia BiCS10 both reach high-volume ramp in the same window. NAND capex fell approximately 50-55% from its 2021-2022 peak to the 2023 trough. If the next NAND bust coincides with AI capex digestion pulling logic/foundry WFE simultaneously, Lam faces the dual-leg deceleration that produced its deepest prior drawdowns.
The scenarios in detail
The driver tree
Four variables decide the five-year outcome:
-
HAR etch moat durability. Whether Lam’s Cryo 3.0 platform (demonstrated at less than 0.1% CD deviation at 60:1+) maintains primary process-of-record at SK Hynix and Kioxia for the next NAND generation beyond 400 layers, or whether TEL establishes co-equal status across multiple customers.
-
NAND/DRAM capex cycle timing and depth. Whether management’s $40B NAND upgrade cycle compresses into 2026-2027 (bull), stretches to 2028-2029 (base), or is interrupted by a 2027-2028 oversupply event (bear). Whether the HBM cycle sustains DRAM at 25%+ of Systems through FY2027.
-
China revenue trajectory under BIS. Whether the BIS affiliate rule reinstates November 9, 2026 (the default legal outcome) and whether it eventually extends to service/spare parts; and whether AMEC closes the HAR etch gap in the 3-5 year horizon.
-
Multiple compression path from the current 53x forward P/E. At 333% above the 10-year EV/EBITDA median, the stock prices a structural compounder narrative. If the EPS CAGR from FY2026E approximately $5.65 to FY2031 is 10-15%, the multiple must compress from 53x to roughly 22-30x just to keep the stock flat over five years.
Bull - NAND/HBM triple-driver fires; Aether optionality monetized
The bull case requires: TEL’s cryo etch volumes at Samsung but fails to qualify at SK Hynix or Kioxia before 2028, confirming the moat holds at the two largest non-Samsung NAND makers; the $40B NAND upgrade cycle delivers on or near management’s accelerated timeline; HBM4 investment from SK Hynix sustains DRAM at 20%+ of Systems through FY2029; BIS affiliate rule lapses cleanly November 9, 2026 without reinstatement; a second Aether customer is announced by FY2027.
Under these assumptions, FY2031 EPS reaches approximately $20.00 (approximately 29% CAGR from FY2026E), and the market exits at roughly 30x (structural compounder narrative confirmed by delivery, comfortably below the current 53x), producing approximately $600 [illustrative estimate, C-0839] - roughly 50% above today over five years. This is not a generous bull case by any standard. The five-year bull at $600 requires all three demand legs firing simultaneously for five consecutive years and no further China escalation.
What breaks it: TEL winning a cryo etch process-of-record at SK Hynix or Kioxia - the single competitive event that collapses the structural compounder narrative and re-rates the multiple toward 22-25x.
Base - moderate multiple compression; NAND upgrade delivers late
The base assumes: Lam maintains primary HAR etch at SK Hynix and Kioxia; TEL holds a backup or co-equal position at Samsung only; the BIS affiliate rule reinstates November 2026, combining with Hua Hong to push China toward 18-22% of revenue by FY2027; NAND upgrade spending stretches to 2028-2029 rather than completing by end-2027; Aether remains at 2-3 customers by FY2029 but is not yet a material revenue line; and DRAM moderates from its record levels as HBM supply catches AI GPU demand.
Under these assumptions, FY2031 EPS reaches approximately $14.50 (roughly 4% CAGR, absorbing one moderate digestion year), and the market exits at 22x - still a premium to the 10-year median of approximately 13.97x, reflecting CSBG annuity quality - producing approximately $319 [illustrative estimate, C-0840]. That is a nominal 21% decline from today over five years. Multiple compression from 53x to 22x more than outpaces EPS growth from approximately $5.65 to approximately $14.50. This is the AMAT dynamic replicated in Lam’s situation: starting at a historically elevated multiple guarantees that even a good business produces a nominal loss in the base scenario.
Bear - skeptic’s primary scenario: dual-leg deceleration plus moat erosion
The bear assembles the skeptic’s most likely failure scenario. TEL volumes at Samsung V10 and qualifies at a second memory maker (SK Hynix or Kioxia) by 2028 - making HAR etch a two-supplier category rather than a Lam-dominated one. The BIS affiliate rule reinstates November 2026 and eventually extends to service/spare parts, directly impairing CSBG China revenue. NAND oversupply materializes in 2027-2028 as Samsung V10 and Kioxia BiCS10 ramp simultaneously into decelerating AI storage demand, while hyperscaler capex deceleration flows through TSMC capex guidance into foundry/logic WFE moderation in the same window. Lam faces declining demand from both memory and logic/foundry simultaneously.
Under this scenario, FY2028 EPS troughs at approximately $4.50 before partial recovery; FY2031 EPS of approximately $8.00 reflects a structurally lower base as the moat narrows from three sides (TEL competition, AMEC China substitution, Aether stalling at one customer). The market exits at 15x (post-correction cyclical industrial, moat premium eliminated) - producing approximately $120 [illustrative estimate, C-0841], a roughly 70% decline from today.
What breaks the bear into base/bull: two consecutive quarters of NAND Systems revenue above 20% of Lam Systems by mid-2027, which would confirm the $40B upgrade cycle is delivering on schedule and disconfirm the dual-leg deceleration thesis.
What to watch: leading indicators and risk controls
Five observable metrics in priority order:
-
China as a percentage of quarterly revenue. Q3 FY2026 was 34%; management guided below 30% for Q4 FY2026 (results expected July 28). If Q4 holds 30-35%, the floor is stabilizing (base/bull). If Q4 falls below 25%, structural erosion is accelerating (bear). The sequence post-Q4 will show whether the Hua Hong restriction impact has been fully absorbed or is still printing through the numbers.
-
BIS Federal Register for LRCX-related rules (November 2026). Whether the BIS affiliate rule is extended, revoked, or reinstates is a binary observable event. Watch Federal Register notices from the Bureau of Industry and Security in October-November 2026. A reinstatement with an added CSBG service/spare-parts component is the highest-magnitude negative surprise in the near-term horizon.
-
NAND as a percentage of Lam Systems revenue. Currently 12% of Systems. NAND recovering to 20%+ of Systems in Q4 FY2026 or Q1 FY2027 validates the $40B upgrade cycle. NAND staying below 15% through FY2027 signals the timeline is stretching from management’s “before end of 2027” toward the base case 2028-2029. As of mid-2026, NAND contract prices are elevated and Kioxia’s 2026 output is reportedly sold out per TrendForce, making immediate oversupply unlikely - the 2027-2028 window is the credible risk horizon as Samsung V10 and Kioxia BiCS10 volume ramps converge. TrendForce’s monthly NAND contract price data is the earliest signal: two or more consecutive quarters of contract price declines would flag that supply is beginning to outpace demand, the precursor to capex cuts 2-4 quarters later.
-
TEL quarterly NAND revenue (TEL fiscal year reporting, October-December 2026). The leading indicator on whether TEL cryo etch at Samsung V10 is transitioning from qualification to volume. Any material sequential step-up in TEL’s NAND-category revenue is the moat canary. TEL semi-annually reports NAND etch revenue that can be compared to Lam’s.
-
Hyperscaler quarterly capex guidance (Q3-Q4 2026 earnings, October-February window). Microsoft, Alphabet, Amazon, and Meta capex guidance leads WFE logic/foundry orders by 12-18 months. Flat or negative sequential capex in any single report in this window starts the deceleration clock for Lam’s FY2028 foundry/logic Systems revenue.
Risk controls: Lam’s beta of approximately 1.87 means a 10% broad market decline typically implies an 18-19% LRCX decline. The technical support levels at $380 (pivot S1), $352 (20-day SMA), and $308 (50-day SMA) provide rough context for how far a correction could reach without breaking the structural trend from the summer 2025 low. RSI approaching 65 and the stock at 97.5% of its 52-week range suggest limited incremental technical momentum from the current level.
Methodology, sourcing, and data-quality flags
The five-factor research read
Valuation. At $401.82 per share (June 25, 2026), Lam’s EV/EBITDA falls in the 60-64x range (DISPUTED between StockAnalysis at 63.90x and GuruFocus at 60.54x; both confirm the multiple is at or near the 10-year historical maximum of 60.9x). The 10-year median EV/EBITDA is approximately 13.97x (GuruFocus, single-source, directionally reliable; C-0292), placing the current multiple 333-357% above the long-run norm. Forward P/E in the 49-54x range (DISPUTED: StockAnalysis 53.47x vs GuruFocus 49.00x) implies FY2027 non-GAAP consensus EPS of approximately $7.51 at the higher figure. The analyst consensus mean target of $334-341 sits 15-17% below the current price. The skeptic’s reversion math shows that at management’s own FY2028 targets of $25-27B revenue at 35% operating margins (company targets, management forecasts), a reversion to 25x EV/EBITDA implies enterprise value approximately 50-53% below the current level. Valuation is the most negative factor in the analysis - the strongest drag on the overall lean.
Growth. FY2025 revenue grew 23.7% to $18,435.6M (C-0241, VERIFIED primary). Q3 FY2026 revenue grew 24% year-over-year to $5,841.5M (C-0273, VERIFIED primary). Full-year FY2026 is annualizing toward approximately $23.1B if Q4 delivers at the guidance midpoint, roughly 25% above FY2025. DRAM reached a record 27% of Systems in Q3 FY2026 (C-0285, VERIFIED primary), driven by SK Hynix HBM3E and HBM4 investment; management confirmed DRAM’s SAM is growing more than 20% from 1C-node dielectric step-count increases alone (C-0361, VERIFIED). Advanced packaging is growing more than 50% in calendar 2026 (C-0225, VERIFIED). The content-per-wafer structural driver - every NAND generation transition expanding etch and ALD intensity per wafer start independent of aggregate bit volume - provides a structural floor on growth that reduces single-cycle dependency. Management’s FY2028 targets of $25-27B revenue and $6-7 non-GAAP EPS (C-0223, company targets, management forecasts) imply roughly 6-8% revenue CAGR from FY2026E. Growth is the strongest positive factor in the analysis.
Quality. FY2025 FCF of $5,414.1M (29.4% FCF margin, C-0247, VERIFIED primary) is structurally superior to any memory maker Lam serves. Gross margin expanded from 44.6% (FY2023) to 48.7% (FY2025) to guided 50.5% in Q4 FY2026 (C-0279, VERIFIED), driven by Penang manufacturing scale and India procurement improvements. Net cash approximately $1.0B at Q3 FY2026 end (C-0318, VERIFIED). CSBG first crossed $2B in a single quarter in Q3 FY2026 (C-0273, VERIFIED). ROIC estimated at 40-55% (C-0510, estimate-tier), above AMAT and below KLAC. Two quality deductions: CSBG is approximately 25-30% Reliant equipment (cyclical, C-0338, VERIFIED), not a pure recurring annuity; segment-level gross margins for Systems and CSBG are not confirmed at primary tier (flagged as estimates, C-0340, C-0341). Insider selling of approximately $72M in 12 months with zero insider buys (C-0316, VERIFIED per Form 4 filings) is noted as a mild contrarian data point, consistent with compensation-plan exercises but unusual in pace. Quality is a net positive factor, with the two deductions (CSBG’s hybrid annuity character and the unverified segment margins) preventing a stronger read rather than reversing the direction.
Risk. Lam is the most memory-concentrated WFE name among large peers, with NAND and DRAM representing 39% of Systems revenue in Q3 FY2026 (C-0285, VERIFIED), approximately twice AMAT’s memory concentration. In a concurrent NAND and DRAM downturn without an HBM cushion, revenue decline could reach 25-35% (C-0362, macro.md estimate). China at 34% of Q3 FY2026 revenue (C-0273, VERIFIED) faces two active BIS constraints: the BIS affiliate rule reinstating automatically November 9, 2026 at an estimated $200M per quarter impact (C-0817, VERIFIED, Jones Day/Arnold & Porter), and the Hua Hong restriction that is permanent and separate. TEL dual-sourced at Samsung V10 cryo HAR etch at qualification stage (C-0801, C-0808, analyst-tier, Yole Group and smbom.com) threatens the specific moat that justifies the premium multiple. AMEC holds a dominant position in China domestic ICP etch (estimated 70-75% of that segment by industry analysts, unconfirmed at primary tier; C-0343 numbering discrepancy noted between micro.md and claims.jsonl). NAND capex fell approximately 50-55% from peak to trough in 2022-2023 (C-0351, analyst-tier estimate). Risk is the second most negative factor in the analysis, tied with valuation in the degree to which it constrains the overall lean.
Momentum. Price +135.17% YTD (C-0270, VERIFIED) from the summer 2025 BIS-shock low is a powerful trend. The stock is 86% above its 200-day SMA of $215.82 (C-0815, VERIFIED). RSI at 64.74 is approaching overbought (C-0815). Sell-side: 28-29 of 34-35 analysts at Buy/Strong Buy (C-0307, C-0308, VERIFIED). Consensus mean $334-341 below spot (C-0816, VERIFIED) reflects sell-side lag, not a sell signal. Short interest at 2.57% of float (C-0279, VERIFIED) means minimal short-covering fuel. Insider selling $72M, zero buys (C-0316, VERIFIED) is a mild negative within the otherwise positive momentum profile. Momentum is a net positive factor, though the stock’s position at 97.5% of its 52-week range and RSI approaching overbought conditions limit the incremental technical case for additional near-term gains.
Overall lean. Growth is genuine and strong. Business quality is high. Momentum is firmly positive. Those three point upward. But valuation is at a 10-year peak, risk is the most concentrated in the WFE peer set, and the stock has run 15-17% above even a bullish sell-side consensus mean. Those two points down with enough weight to hold the overall direction to neutral. The risk-reward at current levels is asymmetric to the downside: the base case produces a nominal decline over five years driven by multiple compression; the bear case produces a 50-70% drawdown without requiring the business to fail. I’d call Lam a Hold at $401.82.
Data quality flags
-
Market-action figures are point-in-time (June 25, 2026). Price ($401.82), market cap ($502.50B), forward P/E (49-54x), EV/EBITDA (60-64x), and analyst targets ($334-341 mean) all move daily and have moved since the research date.
-
Forward P/E and EV/EBITDA are definition-sensitive (DISPUTED). Two vendors compute them differently; the ranges (49-54x fwd P/E; 60-64x EV/EBITDA) are both valid representations of the same underlying price.
-
Q4 FY2026 not yet reported. The quarter ends June 28, 2026; results expected July 28. All full-year FY2026 figures are derived from three reported quarters plus Q4 guidance - they are estimates, not reported actuals.
-
CSBG is NOT a pure annuity. Approximately 25-30% of CSBG (estimated at $1.7-2.1B annually) is Reliant equipment, a cyclical capital equipment sub-line. Describing CSBG as purely recurring overstates its defensive character.
-
BIS affiliate rule is suspended, not resolved. The rule expires November 9, 2026 and reinstates automatically absent a new Federal Register extension. The $200M/quarter impact estimate is from Jones Day and Arnold & Porter legal analysis, a press-tier source attributed as such; it is not a Lam filing disclosure.
-
Hua Hong restriction is separate and permanent. The Hua Hong restriction from approximately April 2026 is active and independent of the November 9 BIS affiliate rule expiry. The two restrictions are additive.
-
Aether customer is unnamed. The January 29, 2025 production adoption announcement from Lam names the customer only as “a leading memory manufacturer.” SK Hynix is widely believed by industry observers to be the customer but has not been confirmed by Lam. The article uses “unnamed leading memory manufacturer” throughout.
-
HAR etch “only production-proven” language. Lam’s Cryo 3.0 press release uses “production-proven,” not “sole-qualified.” The characterization that no competitor has a comparable production-scale cryogenic HAR etch tool is an analyst inference (C-0824) corroborated by the absence of any competitor announcement - but TEL has disclosed cryo etch POR wins anticipated in 2026. This article frames Lam as “currently the only publicly disclosed, commercially production-proven” solution with the TEL caveat attached.
-
$40B NAND upgrade cycle is management’s estimate. CEO Tim Archer’s $40B before-end-of-2027 estimate (C-0226, C-0254, VERIFIED as a management statement) has not been independently confirmed by SEMI, TrendForce, or any third-party analyst at the specific dollar figure. It is a company forecast.
-
Segment-level gross margins are unverified estimates. Systems approximately 48-49% and CSBG spares/services approximately 55-60%+ are derived from blended margin behavior and management commentary (C-0340, C-0341), not from a directly accessed 10-K note. The FY2025 10-K segment note was inaccessible during the research session due to EDGAR access restrictions.
-
AMEC market-share figure (70-75%) is an industry analyst estimate that has not been confirmed at primary tier; the claims.jsonl numbering reference in micro.md is noted to have a numbering discrepancy (micro.md’s C-0343 reference corresponds to a different claim in claims.jsonl). The figure is directionally supported by multiple analyst sources but is not a primary disclosure.
-
SK Hynix, Micron, and Intel as customers are inferred, not 10-K-disclosed. Only Samsung Electronics and TSMC are named in the FY2025 10-K as individually accounting for more than 10% of total revenue.
-
Insider selling context. The Form 4 sales by Eric Brandt and Douglas Bettinger (C-0316, VERIFIED) are public record events. The interpretation that they reflect standard compensation-plan behavior is editorial judgment; they do not on their own indicate negative fundamental views.
This research was conducted on June 25-26, 2026. Claims are recorded in companies/LRCX/claims.jsonl with source URLs and confidence tiers. VERIFIED claims have been confirmed by an independent source; DISPUTED claims have conflicting source data and are presented as ranges; estimate-tier claims are clearly labeled throughout.
This article is OSINT research for educational and informational purposes only. Nothing in this article is investment advice, a solicitation to buy or sell any security, or a personalized financial recommendation. Lam Research Corporation (LRCX) stock involves significant risk, including but not limited to semiconductor equipment cycle risk, China export-control risk, customer concentration risk, technology transition risk, and valuation risk. All forward-looking figures and scenario prices are illustrative estimates derived from stated assumptions; they are not price targets and not predictions. The author holds no position in LRCX as of the research date and receives no compensation from Lam Research Corporation or any related party. Verify all figures before acting. Consult a qualified financial adviser before making any investment decision.