
Research date: June 25, 2026 | OSINT market research on Applied Materials, Inc. (AMAT, NASDAQ), the world’s largest semiconductor equipment maker outside lithography - the company that builds the deposition, etch, CMP, ion implant, and inspection tools that every leading-edge fab on earth depends on, without ever designing or manufacturing a chip itself. AMAT sits at the intersection of the AI-driven wafer fab equipment supercycle, the transition from FinFET to gate-all-around transistors, the emergence of backside power delivery networks, and a China revenue question that has become one of the most consequential binary risks in the semiconductor equipment sector. Applied Materials’ fiscal year ends in late October; FY2025 refers to the year ending October 26, 2025.
Important disclaimer. This article is OSINT research produced for educational and informational purposes only. It is not investment advice, not a solicitation to buy or sell any security, and not a personalized financial recommendation. All figures are point-in-time as of the research date stated and move fast - verify before acting. Past performance is not indicative of future results. Do your own due diligence and consult a qualified financial adviser before making any investment decision.
AMAT-specific risks: WFE cycle risk (Semiconductor Systems revenue amplifies the semiconductor cycle and can fall 15-20% in a downturn); China export-control risk (China was 37% of revenue in FY2024 and is declining structurally under Bureau of Industry and Security (BIS) rules; further escalation cannot be ruled out); customer concentration (two unnamed customers represented approximately 19% and 15% of FY2025 revenue per the 10-K; widely understood in the semiconductor industry to be the leading Taiwanese foundry and the leading Korean memory and foundry group, though AMAT has not confirmed this); technology transition risk (AMAT must win process-of-record positions at each new node or lose content-per-wafer gains); BIS settlement compliance tail (a 3-year suspended denial order attached to the February 2026 settlement is conditional and contingent on a future compliance failure - it is not a current export restriction - but if triggered would deny all AMAT export licenses globally, reaching TSMC, Samsung, and SK Hynix, not only China); valuation risk (at approximately 54x forward non-GAAP earnings the multiple leaves no room for cycle error); and the uncertainty inherent in all forward scenario prices below, which are illustrative estimates derived from stated assumptions and are not price targets.
Where this stock could be in 6 months, 1 year, 3 years, and 5 years
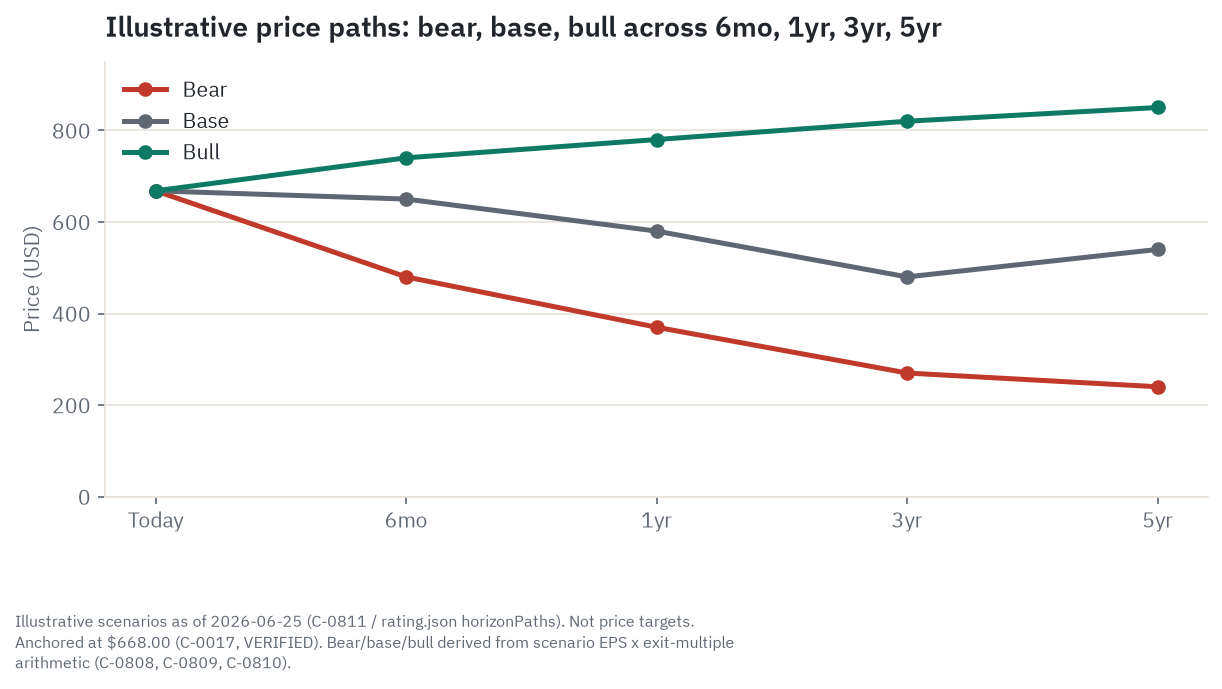
Applied Materials closed at $668.00 on June 25, 2026 - a new 52-week high set on the same session as the company’s record Q2 FY2026 earnings and the simultaneous announcement of six new AI chipmaking systems covering deposition and CMP tools for HBM DRAM, advanced packaging, and AI logic. The stock had traveled from a 52-week low of $154.46 (set roughly a year earlier, during the worst of the China export-control shock) to that new high in under twelve months, a gain of approximately 333% from trough to close. All dollar ranges below are illustrative estimates derived from stated scenario EPS assumptions and stated exit multiples. They are not price targets and not guarantees of any outcome.
6 months (December 2026). The dominant event in this window is Applied Materials’ Q3 FY2026 earnings (August 2026) and Q4 FY2026 guidance (November 2026). The Q3 guide stands at $8.95 billion in revenue and $3.36 in non-GAAP EPS - up 23% and 36% year-over-year, respectively, making it the highest quarterly bar AMAT has set for itself. If Q3 delivers near the guide and Q4 is guided at $3.45 or higher (implying full-year FY2026 EPS of $12.50 or above), the AI-cycle narrative stays intact and the stock likely consolidates or grinds toward the $650-$740 range [illustrative estimate]. The single driver in the six-month window is Semiconductor Systems quarterly revenue: specifically whether the SS line in Q3 and Q4 continues its sequential acceleration from Q2’s $5.97 billion toward the $6.9 billion Q3 guide. In the bear case near $480 [illustrative estimate], Q3 SS revenue misses the guide or Q4 guidance disappoints, the BIS Affiliates Rule suspension is reconsidered, and the market prices FY2026 EPS tracking below $12.00 at a compressed 40x multiple. Near-term technical conditions reinforce caution: the RSI stood at 72.52 after the June 25 gap, and the stock sat 104% above its 200-day moving average. The thing most likely to flip this horizon in either direction is the August 2026 Q3 earnings call and specifically the Semiconductor Systems revenue vs the $6.9 billion guide.
1 year (June 2027). By mid-2027, Applied Materials will have reported FY2026 full-year results (fiscal year ending October 2026) and at least two quarters of FY2027. The one-year window is where the AI-capex ROI debate begins to resolve: either hyperscaler capital expenditure commitments hold near their 2026 highs and sustain TSMC and Samsung fab capex, or the Sequoia-flagged revenue gap relative to infrastructure spend produces visible deceleration signals that flow through WFE orders. In the bull case near $780 [illustrative estimate], FY2027 non-GAAP EPS tracks toward $16-17 as TSMC A16 tool installs begin contributing, HBM4 is in full ramp, and the first BSPDN-related order commentary appears in backlog; the market prices that at roughly 45-48x. In the base case near $580 [illustrative estimate], FY2027 EPS tracks $14-15 with some WFE growth moderation but no correction, and the multiple compresses to 38-42x as the AI-cycle premium begins to normalize toward a high-quality industrial band. In the bear case near $370 [illustrative estimate], FY2027 EPS tracks $11-12 as the BIS Affiliates Rule is reinstated and WFE guidance begins softening, with the multiple compressing to 30-33x as the cycle narrative breaks.
3 years (mid-2029). The three-year window resolves the central question in the AMAT thesis: does the content-per-wafer story deliver measurable revenue, or does WFE cyclicality dominate? BSPDN (backside power delivery networks) should be contributing $0.2-0.6 billion annually from TSMC A16 tool installs by FY2028-2029 if the technology ramp proceeds on schedule. NAND capex recovery - currently deeply trough-like at 4% of AMAT’s SS mix - adds $1-2 billion annually if Kioxia/SanDisk supply tightness drives new layer-count investment. AGS should be at $8-10 billion annually (mid-teens CAGR from $6.4 billion in FY2025) given 90%-plus service contract renewal rates and an installed base growing at 5% or more per year. In the bull case near $820 [illustrative estimate], FY2029 EPS tracks $22-24 and the market prices a confirmed structural compounder at 33-36x. In the base case near $480 [illustrative estimate], FY2029 EPS of $18-19 reflects a good business that had a mild WFE digestion year in FY2028, priced at 25-27x. In the bear case near $270 [illustrative estimate], FY2029 EPS of $12-13 reflects a WFE correction and China escalation scenario, priced at 20-22x as the multiple re-rates toward cyclical-industrial levels. The single indicator that separates bull from bear by this horizon: whether BSPDN tool orders appear in AMAT’s backlog commentary by Q1 FY2027 earnings.
5 years (mid-2031). Over a full five-year horizon, the structural thesis either compounds or fails. The bull case near $850 [illustrative estimate] requires FY2031 non-GAAP EPS of approximately $28 (a 17-18% CAGR from $12.50 in FY2026) at a 30x exit multiple - a level the market would assign only if AGS compounding at mid-teens and content-per-wafer delivery are both confirmed over five consecutive years. The base case near $540 [illustrative estimate] requires EPS of approximately $23-24 (10-13% CAGR) at a 23x exit multiple, reflecting AMAT as a premium capital equipment compounder with a durable annuity. The bear case near $240 [illustrative estimate] reflects FY2031 EPS of approximately $15 (essentially flat with FY2026 in nominal terms, having troughed in FY2028 at $10.50 and partially recovered) at a 16x exit multiple - the market’s price for a WFE cyclical that lost the structural re-rating narrative. The math of starting at 54x forward earnings is starkly honest: even the bull case produces only roughly 25-30% total return over five years from the current price; the base case produces a nominal loss; the bear case produces a severe one.
I’d call AMAT a Hold at $668. The underlying business is genuinely excellent: the broadest WFE franchise in the world, a record $6.4 billion recurring-revenue annuity growing at mid-teens, and a real structural thesis across GAA, BSPDN, and advanced packaging. The problem is the price. At 54x forward earnings and 99x trailing free cash flow, the excellent business has already been paid for. Any stumble in the WFE cycle or China escalation compresses both earnings and the multiple simultaneously - the double-punch pattern that has historically made AMAT drawdowns severe.
Companion tool
The interactive dashboard lets you sort and filter AMAT’s key metrics against its ten-company competitive peer set across valuation, growth, quality, risk, and momentum. The Excel model is a downloadable scenario builder with adjustable EPS growth and exit multiple assumptions for each of the four horizons.
TL;DR
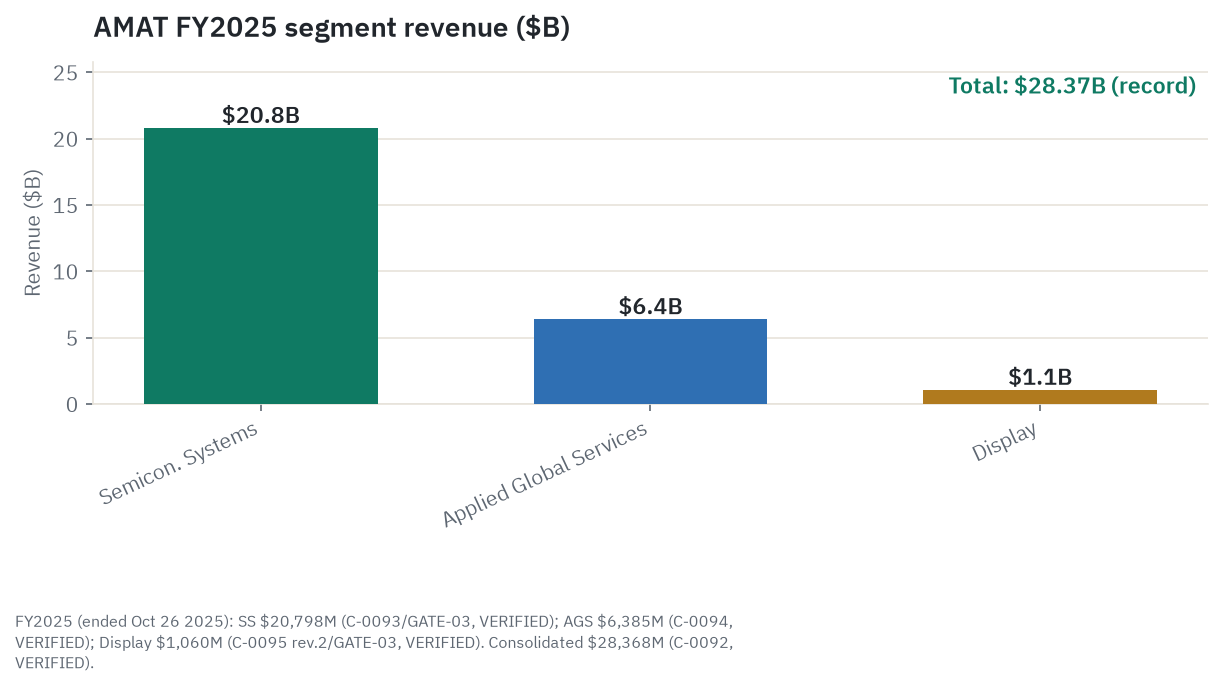
Applied Materials is the largest non-lithography wafer fab equipment maker by revenue, the company that builds the deposition, etch, CMP, ion implant, and inspection tools that chipmakers at every major fab in the world cannot operate without. It does not design or make chips; it makes the machines that make chips, and it earns a recurring aftermarket annuity - Applied Global Services (AGS) - on those machines for the next 10-15 years after each sale. Applied Materials’ fiscal year ends in late October. In FY2025 (the year ending October 26, 2025), the company posted total revenue of $28.37 billion (a sixth consecutive annual record), broken across three reported segments: Semiconductor Systems at $20.80 billion, Applied Global Services at $6.39 billion (also a record), and Display at $1.06 billion. Starting in Q1 FY2026, the company restructured AGS to remove a roughly $125 million annual 200mm equipment business, making AGS a 100% recurring-revenue segment and raising the long-term AGS growth outlook to mid-teens annually. The technology inflection thesis is the reason the stock has re-rated from the low $100s in mid-2025 to $668 today: the transition from FinFET (the fin-shaped transistor architecture dominant since ~2012, where the gate wraps the channel on three sides) to gate-all-around (GAA) transistors at TSMC N2 and Samsung SF2, the emergence of backside power delivery networks (BSPDN) at Intel 18A and TSMC A16, and the HBM (High-Bandwidth Memory, the stacked-DRAM memory used in AI accelerators)-driven advanced packaging boom together represent a structural step-up in AMAT’s addressable revenue per wafer start - management and industry analysts estimate GAA alone adds roughly 30% to AMAT’s serviceable addressable market per 100,000 wafer starts per month (a management and analyst estimate, not a filing-confirmed commitment). Against that genuine growth story sits a genuine valuation problem: at a forward FY2026 non-GAAP P/E (price-to-earnings ratio) of approximately 54.6x on a consensus EPS of $12.24, the stock is priced at more than triple its 10-year median GAAP P/E of approximately 19x. China revenue fell from 37.2% of total revenue in FY2024 to 30.1% in FY2025 to 24% of Semiconductor Systems plus AGS in Q2 FY2026; the BIS Affiliates Rule that drove much of that decline was subsequently suspended in early 2026, but the direction of domestic substitution by Naura and AMEC continues structurally regardless of policy. The WFE market is growing more than 30% in calendar 2026 per management’s own guidance; Q3 FY2026 is guided at $8.95 billion in revenue and $3.36 in non-GAAP EPS. On balance, the read lands at Hold: a best-in-class tool vendor priced at a level that requires near-perfection across three simultaneous technology transitions, with a WFE cycle clock still running and a China structural headwind that policy alone cannot reverse.
Explore it yourself: the interactive dashboard
What Applied Materials actually is
Most investors encounter Applied Materials as “a chip stock” and treat it as a proxy for semiconductor demand. That framing misses what the company actually does. Applied Materials does not design, fabricate, or sell semiconductors. It builds the machines that chipmakers use to manufacture semiconductors: the tools that deposit ultra-thin films of material onto a silicon wafer, the tools that etch circuit patterns into those films, the tools that polish wafer surfaces to atomic flatness, the tools that fire ions into silicon to alter its electrical properties, and the tools that check the result of every one of those steps for defects. Every advanced chip in the world passes through tools built by a small group of companies, of which Applied Materials is the largest outside lithography.
The WFE toll-taker model. AMAT earns revenue each time a fab is built, expanded, upgraded, or retooled, regardless of which chips are being made or who is winning the AI chip arms race. TSMC’s most valuable fab customer might be Apple or Nvidia or a hyperscaler’s custom chip group; AMAT gets paid on every wafer TSMC runs at N2 regardless. This customer-winner-agnosticism is not marketing language. It reflects the fact that the tool qualification is with the fab, not with the chip designer, and the tool market positions are determined by physics and process chemistry rather than sales relationships. AMAT’s Reflexion CMP platform is process-of-record at TSMC for a specific planarization step (process-of-record is the official designation a fab awards when it commits to a specific vendor’s tool as the standard for a given process step, typically after 2-3 years of qualification and effective for the life of that node) because its recipe library, slurry-pad chemistry, and in-situ endpoint detection have been tuned to TSMC’s specific integration flow over years of collaborative development. A competitor cannot walk in and swap it out. That is the toll gate.
The five core disciplines. Deposition (CVD, PVD, ALD, and epitaxy) lays down ultra-thin films of material, from the silicon-germanium nanosheet stacks that form the body of a GAA transistor to the tungsten metal that fills the contact holes connecting the transistor to the wiring above it. Etch removes material by plasma or chemistry with sub-nanometer precision, carving the patterns defined by lithography into the actual wafer. CMP (chemical mechanical planarization) polishes the wafer surface after each deposited layer, restoring global flatness before the next patterning step - without it, the accumulated topography of dozens of layers would make the next photolithography step impossible. Ion implantation fires a beam of ions (boron, phosphorus, arsenic) into the silicon at controlled energies to alter its conductivity, creating the source and drain regions of a transistor. Inspection and metrology check every result with electron beams and optical tools, feeding defect data back into the process control loop.
Three reported segments.
Semiconductor Systems is the capital-equipment engine. It contains every physical tool AMAT sells for front-end chip manufacturing: CVD, PVD, ALD, etch, CMP, ion implant, epi, and inspection. As of Q1 FY2026, it also received the approximately $125 million annual 200mm equipment business previously reported under AGS. Revenue moves with WFE spending cycles; this segment amplifies the semiconductor cycle both up and down.
Applied Global Services (AGS) is the annuity engine. Starting Q1 FY2026, the segment is entirely recurring revenue: service contracts, spare parts, certified refurbished parts, software subscriptions, and productivity tools tied to AMAT’s approximately 55,000 active installed systems worldwide. AGS compounds structurally as each new Semiconductor Systems tool shipment adds to the installed base, and it is far less cyclical than SS because fabs do not stop running tools when they stop buying new ones.
Display sells tools for flat-panel display manufacturing (OLED, LCD). It is the smallest and most volatile segment, tied to display maker capex cycles, and management has signaled it is no longer a strategic growth driver.
Scale and context. By revenue, Applied Materials is the largest non-lithography wafer fab equipment vendor in the world. Per analyst-tier analysis, ASML overtook AMAT as the largest WFE vendor overall by revenue in 2023, primarily because EUV system prices far exceed the ASP of deposition or etch tools. So the accurate frame is: AMAT is the largest WFE company by revenue outside lithography, ahead of Lam Research (LRCX), KLA Corporation (KLAC), and Tokyo Electron (TEL). Its headquarters are in Santa Clara, California; CEO Gary Dickerson has held that role since 2013. At the June 25, 2026 close of $668.00, the market capitalization was $530.36 billion (793.96 million diluted shares outstanding).
One analogy that holds. AMAT is the toll plaza on the highway of semiconductor manufacturing. It does not matter whether the cars are Teslas or Fords; every car pays the toll. As chip design forces fabs to build more highway lanes (more process steps per wafer), the toll collected per vehicle rises. The AI era is adding entirely new toll plazas AMAT had not previously collected: advanced packaging lines, backside power delivery sequences, and high-bandwidth memory stacking facilities all require tool sets that did not exist at prior-generation nodes.
How money flows through Applied Materials
flowchart TD
    AI["AI / cloud / consumer end demand\nHyperscaler capex $725B combined in 2026"]
    CHIP["Chipmakers collect revenue\nTSMC, Samsung, Intel, Micron, SK Hynix"]
    CAPEX["Fab capex budgets\nTSMC alone: $52B-$56B in 2026"]
    WFE["WFE market\n$115.7B in 2025, growing >30% in CY2026"]
    LITHO["Lithography / patterning\nASML monopoly on EUV, >26% of WFE"]
    DEPO["Deposition CVD/PVD/ALD/Epi\nAMAT largest non-litho vendor, ~40% share"]
    ETCH["Etch and clean\nLRCX #1 ~40%, AMAT #2 ~25%, ~20% of WFE"]
    METRO["Metrology / inspection\nKLA >50% share, ~13% of WFE"]
    CMP["CMP\nAMAT dominant tool position, ~5% of WFE"]
    IMPLANT["Ion implant\nAMAT #1 ~55% share, ~4% of WFE"]
    AMAT_SYS["AMAT Semiconductor Systems\n$20.80B FY2025, ~18% of WFE"]
    AGS["AMAT Applied Global Services\n$6.39B FY2025, 100% recurring from Q1 FY2026"]
    RETURNS["AMAT shareholder returns\nBuybacks $4.895B + dividends $1.384B in FY2025"]
    CHINA["China / BIS export controls\n30% of FY2025 revenue; BIS Affiliates Rule suspended early 2026"]

    AI --> CHIP
    CHIP --> CAPEX
    CAPEX --> WFE
    WFE --> LITHO
    WFE --> DEPO
    WFE --> ETCH
    WFE --> METRO
    WFE --> CMP
    WFE --> IMPLANT
    DEPO --> AMAT_SYS
    CMP --> AMAT_SYS
    IMPLANT --> AMAT_SYS
    ETCH --> AMAT_SYS
    AMAT_SYS --> AGS
    AMAT_SYS --> RETURNS
    AGS --> RETURNS
    CHINA -.-> AMAT_SYS
The money flows in two paths. The first is the capital-equipment sale: a chipmaker decides to build a new node, places an equipment order with a 6-18 month lead time, AMAT manufactures the tool in Santa Clara or Singapore, ships and installs it in the fab, and recognizes revenue on acceptance. The second is the AGS annuity: once the tool is installed, it enters the active installed base and begins generating service contract fees, spare parts revenue, and software subscription payments for the rest of its useful life - typically 10-15 years at leading-edge fabs, longer at trailing-edge. The two paths are economically separate: the first swings wildly with the WFE cycle; the second compounds steadily as the installed base grows.
The cycle amplifier works as follows. When chipmakers see strong end demand, they raise capex budgets and WFE orders accelerate. AMAT’s Semiconductor Systems revenue lags the order by one to two quarters (tool lead times). When the cycle turns - as it did in 2022-2023, when NAND oversupply wiped roughly 18% off the WFE market - SS revenue falls sharply, but AGS holds because fabs keep tools running and service contracts active regardless of whether they are buying new systems. The amplifier on the upside: technology node transitions require entirely new tool sets that cannot be reused, so AMAT’s addressable revenue per unit of wafer capacity grows structurally at each inflection regardless of the spending cycle.
The three segments: where the revenue actually comes from
Semiconductor Systems: the capital-equipment engine
FY2025 Semiconductor Systems revenue was $20.80 billion, representing 73.3% of total company revenue - up 4.5% from $19.91 billion in FY2024. This segment is the primary WFE cycle lever. The product mix spans the five core disciplines: PVD (Physical Vapor Deposition) for metal films via the Endura platform; CVD/ALD (Chemical Vapor Deposition and Atomic Layer Deposition) for dielectrics and high-k materials via the Centura and Vantage platforms; etch via the Sym3 platform; CMP (planarization) via the Reflexion platform; ion implantation via the VIISta and Optima platforms; and epitaxial deposition via the Centura Epi system, which is the tool at the heart of the GAA nanosheet thesis.
In Q2 FY2026 (the quarter ending April 26, 2026), SS revenue was $5.97 billion, up 10% year-over-year and a record. The mix: foundry and logic 67%, DRAM 29%, Flash memory 4%. The DRAM number is the HBM story in a single figure - it represents the highest logic and memory combined intensity in AMAT’s SS history, driven by TSMC N2 node ramp on the logic side and SK Hynix/Micron HBM3E and HBM4 capacity expansion on the memory side. Q3 FY2026 is guided to approximately $6.9 billion in SS revenue, a 16% sequential step from Q2.
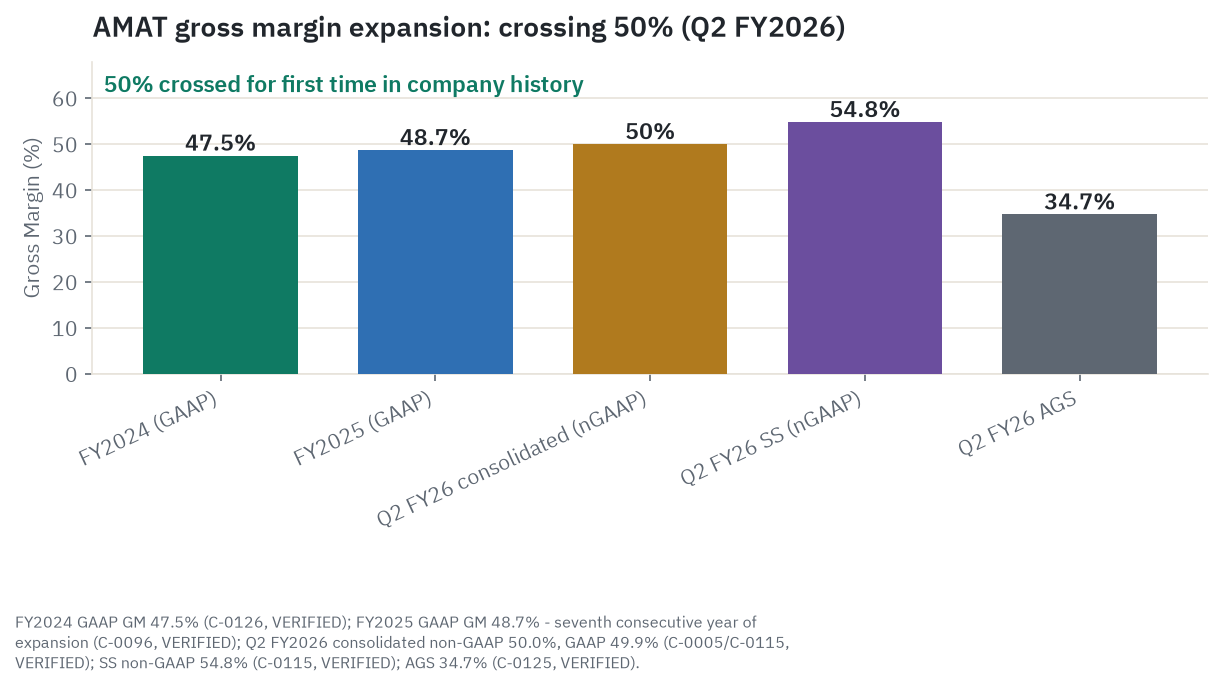
The SS non-GAAP gross margin in Q2 FY2026 was 54.8%, reflecting the highest-margin tool mix in the company’s history: N2-node foundry tools carry pricing premiums vs trailing-edge tools, and the declining China share (which was mostly ICAPS trailing-edge at lower margins) is actually improving the blended SS margin.
Beginning Q1 FY2026, SS also absorbed the approximately $125 million annual 200mm equipment business transferred from AGS. This makes year-over-year SS comparisons from Q1 FY2026 onwards slightly higher than the underlying growth rate.
Applied Global Services: the recurring annuity
AGS is the most structurally durable part of Applied Materials’ business. FY2025 AGS revenue was $6.39 billion, a record, up 2.7% from $6.23 billion in FY2024. The modest revenue growth obscures the quality shift happening within: in FY2025, management reported that more than two-thirds of AGS service revenue was recurring subscription revenue ($4.28 billion or more). The remaining third was the 200mm equipment business (more cyclical, lower-margin), which was transferred to SS effective Q1 FY2026.
Post-restructuring, AGS is 100% recurring: service contracts at 90%-plus renewal rates with an average contract length of approximately 2.9 years, spare parts, certified refurbished components, software and productivity subscriptions, and process support services. The AIx platform is AMAT’s connected-tool digital service offering: it links more than 35,000 chambers (as of Q2 FY2026) to central AMAT systems for remote diagnostics, process-parameter monitoring, AI-based recipe and yield optimization, and predictive maintenance alerts. Customers pay for AIx subscriptions on top of hardware service contracts, which deepens the AGS annuity, adds a software-margin revenue layer, and raises switching costs by embedding AMAT’s process intelligence directly into the fab’s production workflow. The long-term AGS growth guidance was raised from low-double-digit to mid-teens annually following the restructuring.
The economics of the AGS annuity are compelling in absolute terms. The approximately 55,000 active installed tools (the service-contracted active base; note this is distinct from a larger cumulative-ever-shipped figure) generated $6.39 billion in FY2025 AGS revenue, implying roughly $116,000 per active installed tool per year. At Q2 FY2026’s 34.7% gross margin, one installed tool generates roughly $40,000 per year in gross profit from AGS alone. Over a 15-year tool life, that is approximately $600,000 in cumulative AGS gross profit from a single system - often exceeding the gross profit of the initial tool sale itself.
In Q2 FY2026, AGS revenue was $1.67 billion, up 17% year-over-year and another record. Q3 FY2026 guidance is $1.75 billion in AGS revenue.
The key downside risk to AGS is not the WFE cycle - it is BIS policy. Service and spare parts for AMAT tools already installed in Chinese fabs are not currently export-controlled. But if BIS were to extend controls to cover service contracts and spare parts for tools already shipped to restricted Chinese fabs, that would directly threaten the AGS annuity from China. The estimated exposure is approximately $1.5-1.6 billion in annualized China AGS revenue (a derived estimate, not separately disclosed by AMAT, and not under any current BIS restriction - this is a tail scenario, not base case). The gap between “tools already in China generating AGS revenue” and “BIS restricting new tool shipments” is where the China bear case on AGS lives.
Display: small and declining
FY2025 Display segment revenue was $1.06 billion, up roughly 20% year-over-year from approximately $882 million in FY2024, but still representing only 3.7% of total company revenue. The segment sells OLED and LCD panel manufacturing equipment to display makers in Korea (Samsung Display, LG Display) and China (BOE Technology). It is volatile, tied to display maker capex cycles, and management has not identified it as a strategic growth priority. In Q2 FY2026, Display and Other revenue was $280 million.
The WFE toll-taker thesis: why every fab upgrade makes AMAT richer
The WFE market and AMAT’s place in it
SEMI confirmed global semiconductor manufacturing equipment billings of $135.1 billion in calendar 2025, up 15% from $117.1 billion in 2024, with front-end WFE at approximately $115.7 billion. SEMI’s December 2024 forward forecast calls for front-end WFE of $126.2 billion in 2026 (+9% year-over-year) and $135.2 billion in 2027 (+7.3%). Applied Materials’ own management guidance at the Q2 FY2026 earnings call was more bullish than SEMI’s baseline: they guided the WFE market growing more than 30% in calendar 2026, raised from the prior guidance of more than 20%.
Applied Materials competes in every WFE category except lithography. Its estimated WFE market share is approximately 18-19% of the total addressable WFE market. The largest category by WFE spend is lithography (more than 26% of WFE), where ASML holds an effective monopoly on EUV and dominates DUV. AMAT does not compete in lithography. The second-largest categories are deposition and etch (roughly 20% each), where AMAT is the leading deposition vendor and the second-place etch vendor (behind Lam Research). CMP is a smaller category where AMAT holds a dominant tool position. Ion implant is a category where AMAT leads but faces growing competition. Inspection and metrology is dominated by KLA.
The breadth of AMAT’s product portfolio - the fact that it competes in deposition, etch, CMP, ion implant, and inspection simultaneously, while peers tend to be concentrated in one or two disciplines - is simultaneously its greatest competitive advantage and the reason it trades at a structural discount to more focused peers. TSMC can buy a large portion of its tool stack from one vendor relationship. The downside: AMAT faces direct competition from Lam Research or Tokyo Electron in several of those categories, unlike KLAC (near-monopoly in inspection) or ASML (monopoly in EUV).
How the WFE cycle works
WFE spending is a capital goods cycle that amplifies the semiconductor demand cycle. When chip demand is strong, chipmakers invest in both capacity and new nodes simultaneously; WFE spending grows faster than chip revenue. When chip demand softens, fabs cut utilization first, then cut capex orders. WFE spending falls faster and earlier than chip revenue.
The historical correction amplitude: WFE fell approximately 11-12% peak-to-trough in the 2018-2019 correction over four to five quarters, and approximately 18% from the 2022 cycle peak (approximately $107 billion) to the 2023 trough (approximately $88 billion) as NAND inventory normalized. Applied Materials’ Semiconductor Systems revenue follows a similar path; the AGS annuity provides partial insulation but does not prevent meaningful EPS compression in a severe downturn.
The current cycle is in its third year of expansion from the 2023 trough. WFE billings growth decelerated from +24% year-over-year in Q2 2025 to +14% in Q1 2026 - a normal maturation signal, not a collapse. The pace of growth is normalizing, but the direction is still up, and multiple overlapping demand drivers (leading-edge logic for AI, HBM DRAM for memory, CHIPS Act fab buildouts, the early stages of NAND recovery) reduce the single-driver risk of prior cycles.
Why AI changes the WFE equation
The AI data center buildout differs from prior WFE demand cycles in one structural way: hyperscaler capex is driven by multi-year infrastructure investment decisions, not by consumer sentiment. Microsoft, Alphabet, Amazon, and Meta combined are guiding approximately $725 billion in 2026 capital expenditures, up 77% from approximately $410 billion in 2025. Roughly half of that goes to servers and chips, which flows through to TSMC’s and Samsung’s fab capex. TSMC alone guided $52-56 billion in 2026 capex - the largest single-year semiconductor capex commitment in semiconductor history, with 70-80% directed at N2 and A16 process nodes.
AI chip demand is also memory-intensive: HBM (High-Bandwidth Memory) for Nvidia, AMD, and custom silicon AI accelerators requires substantially more process steps than standard DRAM, consuming three times the wafer area per bit. SK Hynix, Micron, and Samsung are all simultaneously expanding HBM3E and HBM4 capacity, creating a synchronized multi-customer DRAM tool demand cycle that is historically unusual.
The durability question is real. Sequoia Capital has estimated roughly a $600 billion annual revenue gap between what hyperscalers are spending on AI infrastructure and what AI-attributable revenues currently justify at a 25% return threshold (meaning that for each dollar of AI capex deployed, roughly 25 cents of annual operating income is needed to clear a typical tech company’s cost of capital; current AI-attributable revenues fall well short of that bar at today’s infrastructure cost levels). Enterprise AI adoption is broad (80-90% of firms piloting AI) but shallow - fewer than 40% have scaled beyond pilots. The concern is not imminent: hyperscalers are building physical infrastructure with 10-15 year useful lives, and they have guided aggressively for 2026 and 2027. The plausible risk is that in 2027-2028, when management teams reassess ROI and investor pressure intensifies, the rate of growth in data center capex decelerates materially. A deceleration from 77% capex growth to flat capex growth would still leave WFE at current elevated levels but would remove the incremental tailwind. WFE orders lead revenue by 12-18 months, so any 2027 capex digestion would manifest as a Semiconductor Systems order softening signal in late 2026.
The content-per-wafer expansion thesis
AMAT’s core bull case is not simply “more wafers” but “more AMAT tools per wafer.” Each technology inflection (GAA transistors, backside power delivery, advanced packaging) requires additional process steps, and most of those incremental steps fall in AMAT’s core disciplines: more deposition steps, more CMP steps, new epitaxial growth steps. Management and industry analysts estimate the FinFET-to-GAA transition adds approximately 30% to AMAT’s serviceable addressable market per 100,000 wafer starts per month - this is a management and analyst estimate, not a filing-confirmed commitment, and should be read as directional. BSPDN adds a further uplift (per management indication, directional only, primary transcript not confirmed for the specific figure). These content gains are additive because they represent genuinely new process steps, not a reallocation from one vendor to another.
Technology inflections: GAA, backside power delivery, and advanced packaging
Gate-all-around transistors
The semiconductor industry began transitioning from FinFET transistors (the dominant architecture since approximately 2012) to Gate-All-Around (GAA, also called Nanosheet) at 2nm and below. In a FinFET, the gate wraps around the fin channel on three sides. In a GAA transistor, the gate wraps around all four sides of a nanosheet channel, providing better electrostatic control and enabling continued transistor scaling below 2nm. TSMC’s N2 and Samsung’s SF2 (Samsung Foundry 2nm) are the first commercial GAA nodes in high-volume manufacturing; Intel’s RibbonFET at 18A is a GAA variant.
AMAT gains at GAA through four mechanisms. First, nanosheet epitaxy: the silicon-germanium and silicon nanosheet stacks that form the GAA channel body are grown in AMAT’s Centura Epi chambers - a step that did not exist at FinFET nodes, representing entirely incremental AMAT revenue at every wafer start. Second, selective SiGe release etch: removing the sacrificial SiGe layers to free the silicon nanosheets is a new selective etch step where AMAT and Lam Research both compete, splitting the benefit. Third, high-k metal gate ALD coating all four nanosheet surfaces requires more ALD tool time per wafer than the three-sided FinFET coating; AMAT competes here with ASM International (ASMI.AS on Euronext Amsterdam; ASMIY on US OTC markets), the dedicated ALD specialist. Fourth, additional CMP steps after each new deposited layer - and AMAT holds a dominant position in CMP tools. Net, GAA is materially favorable for AMAT relative to FinFET, with the strongest gains in epi (AMAT-specific) and CMP (AMAT-dominant).
TSMC’s N2 wafer capacity ramp is the most immediate commercial manifestation: TSMC is targeting 80,000-90,000 wafer starts per month of N2 capacity by end-2026, and Samsung’s Taylor, Texas fab is targeting 2nm GAA mass production in late 2026. The volume of GAA wafer starts at these two customers in the next 12-24 months is the primary near-term driver of AMAT’s SS revenue growth above the WFE market rate.
Backside power delivery networks
Backside Power Delivery Networks (BSPDN) represent one of the most consequential architectural shifts in advanced logic: moving the chip’s power delivery network from the front side (where transistors live, crowded with signal routing wires) to the back side of the wafer. This eliminates power-rail wiring from the front-side routing layers, reducing IR drop, improving clock frequency, and improving energy efficiency.
BSPDN requires new process steps on the back side of the wafer - steps that simply did not exist at FinFET or early GAA nodes. Those steps include PVD metal seed and barrier layer deposition on the wafer’s back side (AMAT Endura platform), CVD dielectric fill, and back-side CMP planarization (AMAT Reflexion platform). These three categories are AMAT’s strongest positions globally. Lam Research does not benefit materially from BSPDN’s back-side processing steps - this is one of the clearer competitive inflection points in AMAT’s favor within the WFE ecosystem.
Per management indication (directional only; primary transcript not confirmed), BSPDN represents approximately $1 billion in incremental AMAT addressable revenue per 100,000 wafer starts per month. Intel’s 18A node (currently in risk production) is the first commercial BSPDN implementation. TSMC’s A16 node incorporates BSPDN and is targeted for commercial availability in 2026-2027. At initial TSMC A16 capacity of 20,000-30,000 wspm in 2027-2028, the annual AMAT revenue contribution from BSPDN tools at TSMC alone would be in the $200-300 million range. BSPDN is a 2027-2028 revenue story, not a FY2026 driver - but the order book for TSMC Arizona Fab 21 Phase 2 (equipment installation beginning Q3 2026) already includes A16 tooling.
The single event that would most accelerate the BSPDN revenue thesis: TSMC A16 tool order commentary appearing in AMAT’s backlog discussion during the Q1 FY2027 earnings call (February 2027). That would be the first concrete signal that the $1 billion-per-100K-wspm management estimate is becoming order-book reality.
Advanced packaging and high-bandwidth memory
Advanced packaging - stacking multiple chips or dies in 3D structures - is the fastest-growing new tool market for Applied Materials. AMAT’s management guided advanced packaging revenue to grow more than 50% in calendar 2026, following growth of more than 90% in recent reported periods.
HBM drives the bulk of this. Each HBM memory stack requires approximately 19 additional manufacturing steps compared with standard DRAM and consumes roughly three times the wafer area per bit. The conversion of DRAM capacity to HBM production simultaneously creates tool demand (new steps requiring new equipment) and a supply constraint (less DRAM capacity available per wafer), which is why DRAM pricing has been strong. AMAT earns in HBM through TSV (Through-Silicon Via) CVD liner deposition, PVD seed layers for TSV copper fill, CMP planarization after TSV fill, and wafer thinning before stacking. Lam Research earns through the TSV etch step itself (deep reactive ion etch). The HBM tool benefit is split roughly equally between the two.
In Q2 FY2026, AMAT’s DRAM revenue reached $1.7 billion, up 18% year-over-year, representing 29% of Semiconductor Systems revenue. SK Hynix (HBM3E and HBM4), Micron (HBM3E ramp and new Idaho fab), and Samsung (HBM4 ramp) are all simultaneously expanding HBM capacity - a synchronized demand from three major customers that creates more durable order flow than single-customer-driven cycles. AMAT also holds a 9% equity stake in BE Semiconductor (Besi), the leader in die-to-wafer hybrid bonding equipment, positioning it for the next packaging generation without competing directly in the bonding step. AMAT has additionally announced intent to acquire NEX, a panel-level packaging technology company, extending its addressable packaging market from die-level TSV packaging into panel-level packaging for AI accelerator modules - a format that allows more dies per substrate and potentially lower cost-per-compute than conventional wafer-level approaches.
Where AMAT gains and loses vs peers at each inflection
GAA logic: AMAT gains most in epi (wholly new, AMAT-specific step) and CMP (dominant position). Lam Research gains in selective etch. ASM International competes in high-k/metal gate ALD. Net: GAA is AMAT-favorable relative to Lam, giving AMAT a higher share of the incremental content.
BSPDN: AMAT gains across PVD, CVD, and CMP in the back-side processing module. Lam Research gains little from BSPDN specifically. This is the clearest case of an inflection where AMAT-specific tool content grows and peer content does not.
Advanced packaging / HBM: AMAT and Lam share the benefit roughly equally (CVD liner/PVD seed/CMP for AMAT; TSV etch for Lam). KLA benefits through inspection intensity increases. ASML is not directly involved in packaging.
NAND recovery (when it comes): Lam Research is the primary beneficiary of NAND capex through high-aspect-ratio etch (channel holes and word-line contacts). AMAT benefits through oxide-nitride CVD stack deposition but captures a smaller fraction of the NAND capex increment than Lam. At Q2 FY2026, Flash memory was only 4% of AMAT’s SS revenue - a cycle trough. A full NAND recovery would add perhaps $1-1.5 billion to AMAT’s annual SS revenue, meaningful but less than what Lam would capture from the same event.
Demand drivers: AI logic, DRAM/HBM, NAND, and the CHIPS Act
Leading-edge logic: TSMC, Samsung, Intel
TSMC is the largest single WFE buyer globally and AMAT’s most important customer relationship. Its N2 GAA node is in early high-volume manufacturing ramp in 2025-2026; its A16 node (with BSPDN) targets commercial availability in 2026-2027. The $52-56 billion 2026 capex budget - the largest in semiconductor history - has 70-80% directed at N2 and A16, making TSMC’s node ramp the single most important driver of AMAT’s Semiconductor Systems growth. TSMC Arizona Fab 21 Phase 2 (N2/N3 node) begins equipment installation in Q3 2026 with production starting in 2027, contributing US-geography SS revenue into AMAT’s order book through 2027-2028.
Samsung Foundry’s SF2 (2nm GAA, internally called MBCFET) is targeting high-volume manufacturing in late 2026 at its Taylor, Texas facility. Samsung received a $4.7 billion CHIPS Act award for the Taylor fab. A Samsung Taylor ramp on schedule is the second major source of GAA content-per-wafer revenue for AMAT alongside TSMC N2.
Intel Foundry’s 18A node (RibbonFET GAA architecture plus BSPDN PowerVia) is in risk production at Intel’s Arizona fabs. Intel received a modified $7.86 billion CHIPS Act award. If Intel 18A yields improve and Intel wins external foundry customers, it becomes a significant BSPDN tool order source for AMAT. Intel’s path has been uncertain over the past two years, and any Intel Foundry ramp delay directly delays AMAT’s first commercial BSPDN revenue. Intel is both the highest-potential and highest-uncertainty customer relationship in AMAT’s book.
DRAM and HBM: the memory bull cycle
Total DRAM capex is forecast at approximately $61.3 billion in 2026 (+14% year-over-year), led by SK Hynix ($20.5 billion, +17%), Samsung DRAM ($20 billion, +11%), and Micron ($13.5 billion, +23%). This is the strongest memory capex cycle in history, driven by the HBM architecture shift. HBM requires the 19 additional process steps mentioned above, and converts each wafer into significantly more value per bit of capacity - which is why memory makers are racing to add HBM-capable capacity even at elevated capex-to-revenue ratios.
SK Hynix is the leading HBM supplier to Nvidia and has been investing aggressively in its M15x facility. New SK Hynix HBM supply at meaningful scale does not arrive until approximately mid-2027, keeping the supply-demand balance tight through AMAT’s FY2026 and most of FY2027. Micron’s June 2026 earnings (released simultaneously with AMAT’s Q2 results on June 25) beat expectations and signaled continued HBM demand strength - a direct positive read-through for AMAT’s DRAM tool demand.
NAND: tepid recovery
NAND flash capex growth is modest, approximately 5% year-over-year in 2026 (total approximately $22.2 billion), with Samsung and SK Hynix redirecting NAND budgets toward DRAM and HBM. Only Kioxia/SanDisk and Micron (in NAND) are accelerating. Kioxia states its entire 2026 NAND production is sold out - a tightness signal that historically precedes new capacity investment by 2-4 quarters.
NAND was only 4% of AMAT’s SS revenue in Q2 FY2026. A normalization to a 10-12% NAND mix within SS (at the Q2 FY2026 SS run rate of roughly $6.9 billion guided for Q3) would add approximately $400-550 million quarterly or $1.5-2.2 billion annually to SS revenue. But the primary beneficiary of NAND recovery is Lam Research through high-aspect-ratio etch; AMAT participates through oxide-nitride CVD deposition, CMP, and PVD liner steps but captures a smaller share of the NAND capex dollar.
CHIPS Act and geographic diversification
The US CHIPS and Science Act, Japan’s semiconductor subsidy program (JASM fabs and the Rapidus initiative), and the EU Chips Act together represent the largest government-directed semiconductor investment wave in history. For AMAT, the commercial significance is that fab construction outside China is pulling WFE demand into geographies that were historically underrepresented.
TSMC Arizona, Samsung Taylor (Texas), Intel Arizona/Ohio, Micron New York (CHIPS-backed), and GlobalFoundries New York are all active or planned. The equipment installation cycle for TSMC Arizona Fab 21 Phase 2 begins in Q3 2026. These fabs are building for AI-era node processes (N2, N3, 18A) that carry the highest AMAT content per wafer of any node generation. North American WFE actually fell 20% in 2025 (the gap between fab groundbreakings and equipment installation), but the catch-up begins in earnest in H2 2026 as these fabs move from concrete to tool installs.
The geographic diversification thesis is the partial offset to the China revenue decline. TSMC’s Taiwan operations are the primary engine today, but TSMC Arizona, Samsung Taylor, and eventually TSMC Germany represent multi-year WFE demand that is government-backed and therefore less discretionary than private capex.
China exposure and the export-control gauntlet
The revenue trajectory
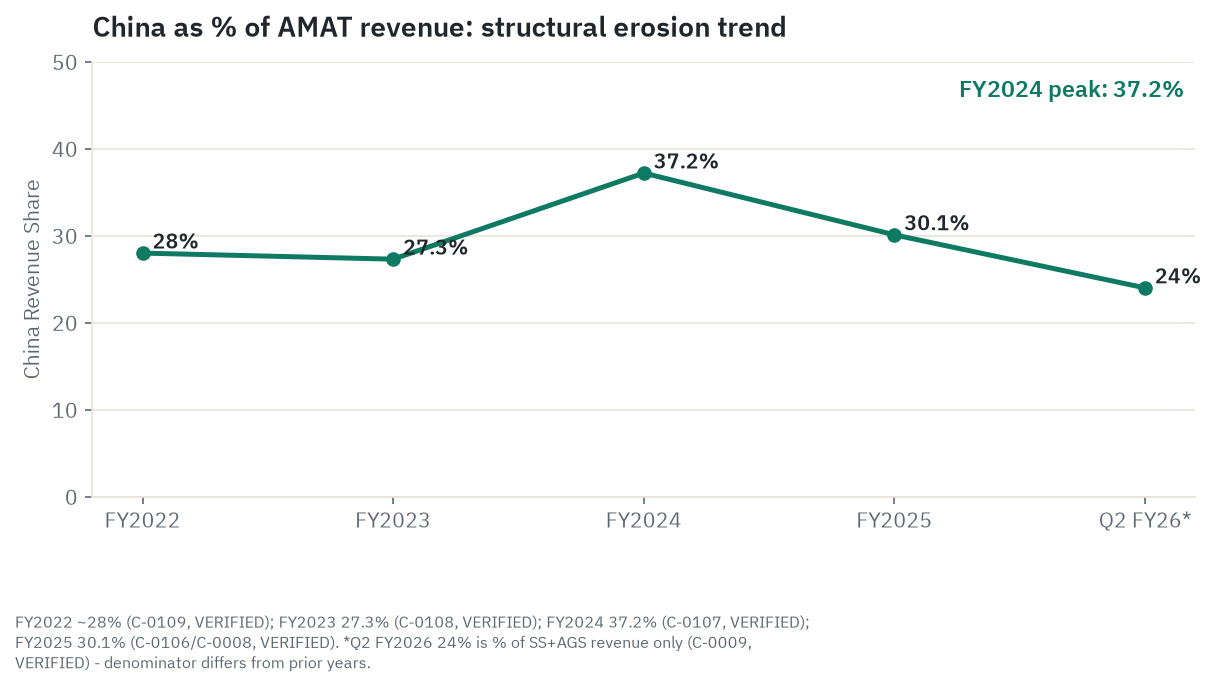
China was Applied Materials’ single largest geography in FY2024 at 37.2% of total revenue ($10.12 billion). By FY2025, China had declined to 30.1% of total revenue ($8.53 billion). By Q2 FY2026, China represented 24% of combined Semiconductor Systems and AGS revenue - the metric management now uses because the Display segment (small and tied to Chinese panel makers) distorts the “restricted equipment” read. The direction is structurally downward from two independent forces: export controls by the Bureau of Industry and Security (BIS, the US Department of Commerce agency that issues and can revoke US semiconductor export licenses) limiting new tool shipments to advanced-node Chinese fabs, and domestic Chinese equipment vendors qualifying substitute tools at trailing-edge nodes.
The FY2024 peak was artificially elevated. Chinese fabs front-ran anticipated BIS restrictions in 2023-2024, stockpiling equipment before the restrictions took effect. The 47.8% jump in China revenue from FY2023 ($7.25 billion, 27.3% of total) to FY2024 ($10.12 billion, 37.2% of total) was a pre-restriction surge, not a structural demand increase. The subsequent decline is a combination of the stocking effect normalizing and the BIS rules removing certain customers from the addressable market.
The BIS Affiliates Rule issued September 29, 2025 extended export restrictions to 50%-or-more-owned affiliates of entity-listed Chinese fabs (SMIC, CXMT, YMTC, and their affiliates). AMAT management initially flagged a roughly $600 million FY2026 revenue headwind from this rule and a $110 million Q4 FY2025 impact. The rule was subsequently suspended in early 2026 following US-China trade negotiations, and AMAT management confirmed the suspension re-enables much of that revenue. The $600 million headwind should be framed as a historical event that was largely reversed, not as a current ongoing drag on revenue.
Management guided China ICAPS (IoT, Communications, Auto, Power, Sensors) business and worldwide ICAPS “flat to slightly higher” for calendar year 2026, with all known export restrictions factored into guidance.
The BIS settlement: what it is and what it means
Applied Materials and its Korean subsidiary Applied Materials Korea (AMK) agreed to pay $252.5 million - the statutory maximum and the second-largest BIS civil penalty on record - to resolve BIS civil allegations that AMK made 56 unauthorized reexports of ion implanter equipment to SMIC between March 2021 and June 2022. Transaction value underlying the alleged exports was approximately $126 million; the penalty is twice that amount. Applied Materials settled the matter without admitting or denying wrongdoing. No related DOJ or SEC actions were brought. The settlement was announced February 11, 2026. The cash payment was made in Q2 FY2026, which is why Q2 FCF was only $210 million despite strong operating results. The settlement is closed.
Two compliance obligations attach. First, two internal audits of AMAT’s export compliance program (the first due July 2027). Second, a three-year suspended denial order (SDO), which is conditional and contingent on a future violation of the settlement terms - it is not a current export restriction. If triggered by a future compliance failure, the SDO would deny all AMAT export licenses globally - not only China-related licenses, but licenses covering shipments to TSMC in Taiwan, Samsung in Korea, SK Hynix in Korea, and every other export destination. This is the SDO’s distinguishing feature and its unique severity as a tail risk: a single compliance failure anywhere in AMAT’s global operations could theoretically cut off the company’s ability to ship tools to its most important customers for years. The first audit in July 2027 passes without disclosure unless a violation is found; the market gets no intermediate signal.
This risk receives negligible coverage in sell-side models, which treat the settlement as resolved. It is resolved from a legal liability standpoint. The compliance obligation and SDO tail run for three years from the settlement date.
Which Chinese customers remain addressable
Not all Chinese semiconductor customers are subject to current restrictions. SMIC, CXMT, YMTC, and their direct affiliates are restricted. Customers that fall outside the entity list and its affiliate radius - primarily Chinese fabs building trailing-edge chips (28nm and above) for IoT, automotive, industrial, and power applications using domestic Chinese-brand process nodes - remain accessible under the ICAPS framework. These are the customers generating AMAT’s approximately 24% of SS+AGS China revenue as of Q2 FY2026.
The question is whether 24% is a floor or a midpoint on the way to a lower level. On policy grounds, the BIS Affiliates Rule remaining suspended argues for modest stabilization. On structural grounds, two forces argue for continued gradual decline: additional BIS restrictions are possible given the consistent trajectory of US semiconductor policy since October 2022, and Chinese domestic tool substitution is advancing regardless of BIS policy.
China domestic tool threat: Naura and AMEC
The strategic risk beyond export controls is domestic substitution: Chinese fabs qualifying tools from Naura Technology Group, AMEC, and ACM Research to replace AMAT tools at trailing-edge and eventually more advanced nodes.
Naura Technology Group, China’s largest domestic equipment maker, reported revenue of approximately $5.4 billion in FY2025, up 31% year-over-year. Per semiconductor equipment industry analysts, Naura holds approximately 12% of PVD market share in China - a category where AMAT holds a leading position globally. China’s domestic semiconductor equipment adoption reached approximately 35% of total China WFE spend in 2025, exceeding the government’s 30% target and ahead of its 2025 timeline. The Chinese government now mandates 50% domestic sourcing for new capacity additions.
Industry analysts argue that once a Chinese fab qualifies a domestic tool for a specific process step at a specific node, it does not subsequently re-qualify the foreign tool it replaced - the switching cost runs in both directions. Management has not described AMAT’s China revenue loss as permanent, and a BIS policy relaxation or a domestic vendor performance gap could partially reverse the trend. But the analyst thesis - that the displacement is structurally one-way at the node and customer level - reflects the economic logic of qualification switching costs, and the trajectory of domestic adoption is consistent with that thesis. AMAT’s most defensible China positions are in categories where Naura and AMEC remain years behind on performance: leading-edge logic CMP, precision ion implant at advanced DRAM, and certain ALD steps at advanced nodes.
ACM Research (ACMR, NASDAQ) is the one name in this competitive cluster accessible to US equity investors. ACM earns approximately 85% of its roughly $900 million in FY2025 revenue from Chinese fabs through single-wafer wet-clean equipment and advanced packaging tools - a different process category from AMAT’s core deposition/etch/CMP, but drawing from the same pool of Chinese fab capex that AMAT is losing to domestic substitution. Its approximately $6.4 billion market capitalization (as of June 25, 2026) and full US listing make ACMR the most accessible proxy for tracking the pace of China domestic tool adoption. Rising ACMR revenue relative to AMAT’s China-specific order declines is the clearest signal that localization is accelerating beyond the 1-2 percentage point per year rate assumed in the base case.
Customer concentration and key relationships
The FY2025 10-K discloses that two customers represented approximately 19% and approximately 15% of FY2025 net revenue - combined, approximately 34% from two buyers. AMAT does not name these customers in the filing. Based on the geographic revenue distribution (Taiwan was 24.2% of FY2025 revenue; Korea was 19.8%) and the known customer profile, these two customers are widely understood within the semiconductor industry to be the leading Taiwanese foundry (TSMC) and the leading Korean memory and foundry group (Samsung), though Applied Materials has not confirmed this publicly.
The concentration math is stark: two customers contributing 34% of revenue means the capital expenditure cycle of either buyer hits AMAT with concentrated force. TSMC’s N2 ramp accelerating (as it is doing now) is the strongest near-term bull driver. Any TSMC capex cut or Samsung memory/foundry budget reduction would hit AMAT’s SS revenue with amplified speed and severity.
TSMC’s $52-56 billion 2026 capex is the anchor. As TSMC ramps N2 and prepares A16, AMAT’s tool orders from TSMC flow through the backlog. The relationship is not a commercial arrangement that AMAT negotiates annually - process-of-record wins at each node are secured 2-3 years before high-volume revenue and then retained for the life of that node. AMAT’s current TSMC POR positions at N2 (epi, CMP, CVD for GAA steps) make the near-term revenue stream from TSMC highly visible.
Memory customers (SK Hynix, Micron, Samsung Memory) collectively represent a large and increasingly important share of AMAT’s Semiconductor Systems revenue as HBM ramps. In Q2 FY2026, DRAM was 29% of SS revenue - the highest memory share in the company’s recent history. The synchronized HBM expansion at all three major memory makers creates unusual demand durability for AMAT’s DRAM tool set.
Intel is the high-risk, high-reward relationship. Intel Foundry’s 18A with BSPDN PowerVia is the first commercial BSPDN node; if it ramps successfully, AMAT benefits from the initial BSPDN tool orders and, more importantly, from the proof-of-concept that validates BSPDN adoption at TSMC A16. If Intel’s ramp slips further, AMAT loses both the Intel-specific order flow and the 18A reference that was meant to demonstrate BSPDN to TSMC’s volume ramp decision-makers.
Competitive position: the WFE peer set
AMAT vs Lam Research (LRCX): direct competition in etch and deposition
Lam Research is AMAT’s closest peer and most direct competitor in several tool categories. Both sell etch and CVD/ALD deposition tools. Lam’s FY2025 (fiscal year ending June 2025) revenue was $20.6 billion, up 27% year-over-year. At the June 25, 2026 close, Lam’s market cap was approximately $503-514 billion.
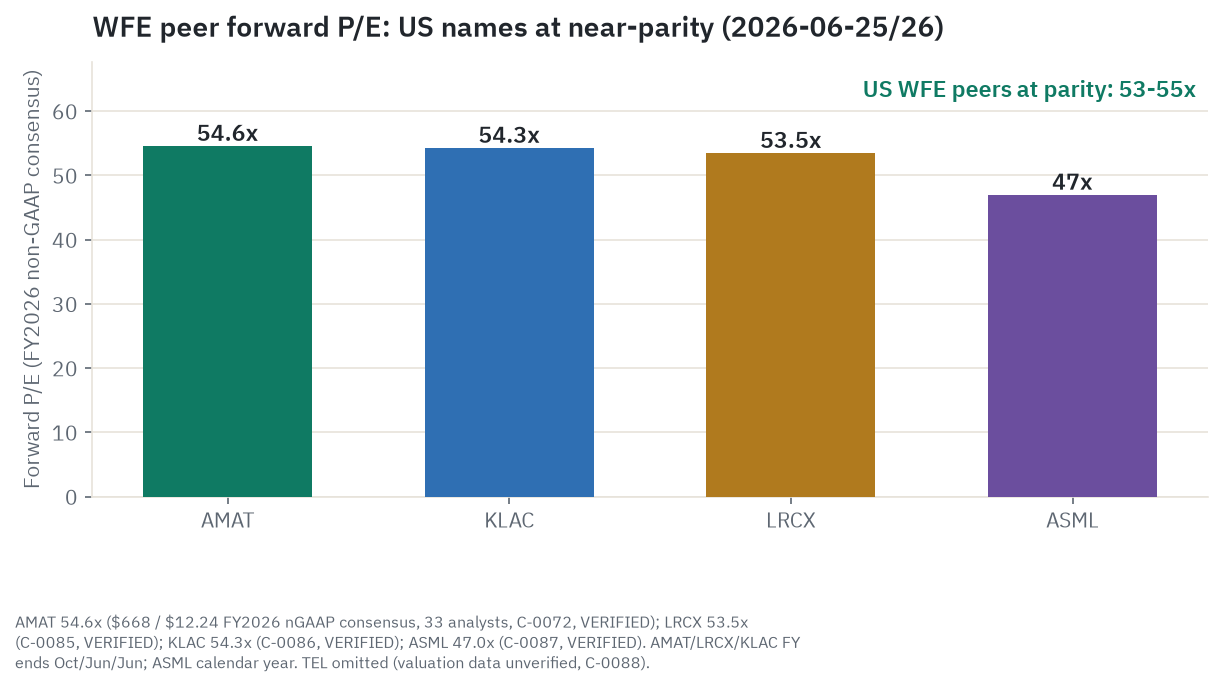
On valuation, Lam traded at approximately 75.9x trailing GAAP P/E and approximately 53.5x forward FY2026 non-GAAP P/E (versus AMAT’s 62.8x trailing and 54.6x forward). The three US WFE names (AMAT, LRCX, KLAC) are essentially at parity on forward P/E at approximately 53-55x - the “AMAT is cheapest WFE” framing applies on trailing P/E but disappears on forward.
Where they compete directly: NAND high-aspect-ratio etch (Lam is dominant), DRAM capacitor etch, GAA selective SiGe nanosheet release etch, advanced packaging TSV etch, and several CVD/ALD categories. Where AMAT has standalone advantages: CMP (Lam has no CMP product), ion implant, Centura Epi for nanosheet formation, and BSPDN back-side processing. Where Lam may have advantages: NAND channel-hole etch franchise (Lam’s strongest individual position in WFE), certain ALD barrier/liner steps (Lam Striker ALD). The current WFE cycle (logic-led, HBM-led) is structurally more favorable to AMAT than a NAND-recovery-led cycle would be.
Morgan Stanley’s May 2026 downgrade of AMAT to Equal Weight (with a $502 price target) and simultaneous upgrade of Lam Research explicitly framed this as a within-WFE relative rotation call: MS argued that AMAT’s 2027 growth would be in-line with the WFE market rather than above it, while Lam would benefit more from a potential NAND recovery. That thesis remains the most coherent institutional bear case for AMAT relative to LRCX.
AMAT vs KLA Corporation (KLAC): complementary with overlapping edges
KLA Corporation is primarily an inspection and metrology company: it checks what AMAT and Lam deposit and etch. The relationship is largely complementary - more process steps mean more inspection steps, so KLA grows with AMAT’s content expansion. Where AMAT and KLA overlap: AMAT sells its own SEMVision e-beam inspection and film measurement tools, competing with some KLA products in specific process-control niches.
KLA’s FY2025 (ending June 2025) revenue was approximately $12.16 billion, with a market cap of approximately $330-340 billion. Its forward FY2026 non-GAAP P/E is approximately 54.3x - essentially identical to AMAT’s. The distinction is quality: KLA’s gross margin and ROIC are structurally higher than AMAT’s, reflecting its near-monopoly position in wafer inspection where the physics of electron beam scattering create barriers that cannot be overcome by capital or scale. KLA’s reported ROIC (return on invested capital) in FY2025 was approximately 73%, versus AMAT’s 29.3%. KLA earns a higher multiple within the peer group (on trailing P/E: 73.3x vs AMAT’s 62.8x) because the market prices its position as more structurally durable.
ASML: adjacent and complementary
ASML holds an effective monopoly on EUV lithography and dominates DUV. Every leading-edge fab also needs AMAT deposition, etch, and CMP tools around the ASML lithography systems; the relationship is entirely complementary. ASML overtook AMAT as the largest WFE vendor by revenue in 2023 (analyst-tier data), driven by the high average selling price of EUV systems (each EUV system sells for approximately $180+ million; AMAT’s highest-value tools are a fraction of that).
ASML traded at approximately 60.5x trailing GAAP P/E and 47.0x forward NTM P/E as of June 25, 2026, with a market cap of approximately $698 billion. It trades at a lower forward multiple than the three US names, partly reflecting EUV order timing lumpiness and concerns about China EUV restrictions already embedded in estimates.
On EV/EBITDA (enterprise value to earnings before interest, taxes, depreciation, and amortization), AMAT (57.1x) sits above ASML (47.3x) despite ASML’s superior moat. This reflects ASML’s higher absolute EBITDA margins (monopoly pricing on EUV systems) relative to its revenue base.
Tokyo Electron (TEL): the Asian peer
Tokyo Electron (TSE: 8035) competes in thermal CVD, ALD, etch/clean systems, and track systems (photoresist coating and developing). It is AMAT’s second-most direct peer in deposition and etch categories. Japan joined the Western semiconductor equipment export-controls framework in 2023 - a sector-wide constraint affecting all Japanese equipment makers, not TEL specifically - reducing TEL’s China exposure in certain tool categories. TEL’s valuation multiples (approximately 29-36x P/E directionally, approximately 20x EV/EBITDA directionally) appear dramatically cheaper than the US WFE peers, but these figures carry significant caveats: Japan GAAP differs from US GAAP, the OTC ADR is illiquid, and yen/USD FX effects complicate comparisons. Treat TEL’s multiples as directional only.
Peer comparison (as of June 25, 2026)
| Ticker | Trailing P/E | Fwd P/E (FY2026 nGAAP) | EV/EBITDA | Market Cap |
|---|---|---|---|---|
| AMAT | 62.8x | 54.6x | 57.1x | $530B |
| LRCX | 75.9x | 53.5x | 63.9x | $503-514B |
| KLAC | 73.3x | 54.3x | 58.0x | $330-340B |
| ASML | 60.5x | 47.0x | 47.3x | $698B |
| TEL | ~29-36x* | ~36x* | ~20x* | n/a |
*TEL multiples directional only; Japan accounting and OTC ADR liquidity effects. All US figures as of 2026-06-25. Sources: StockAnalysis, Finviz, corroborated.
AMAT is the cheapest US WFE name on trailing P/E and EV/EBITDA, but all three US names trade at near-identical forward P/E (53-55x). The discount AMAT has historically traded at versus LRCX and KLAC is a product of its broader but more contested tool portfolio: LRCX dominates NAND etch (a high-share position), KLAC near-monopolizes wafer inspection, and AMAT is #1 in deposition and CMP but faces direct competition from Lam and Tokyo Electron in etch and from ASM International in ALD. Breadth is AMAT’s advantage as a customer partner; it is the reason AMAT’s individual positions are less defensible and carry a lower multiple than its more concentrated peers.
Financials from the filings
Income statement: FY2025 and FY2026 year-to-date
FY2025 total revenue was $28.37 billion (the fiscal year ending October 26, 2025), up 4.4% from $27.18 billion in FY2024. This was AMAT’s sixth consecutive annual revenue record, representing roughly a 12% annualized CAGR since FY2019.
| Metric | FY2023 | FY2024 | FY2025 | YoY (FY25/24) |
|---|---|---|---|---|
| Total revenue | $26.52B | $27.18B | $28.37B | +4.4% |
| Semiconductor Systems | $19.70B | $19.91B | $20.80B | +4.5% |
| Applied Global Services | $5.73B | $6.23B | $6.39B | +2.7% |
| Display | ~$1.09B | ~$1.04B | $1.06B | +1.9% |
| GAAP gross margin | ~47.3% | 47.5% | 48.7% | +120 bps |
| Non-GAAP operating income | n/a | $7.92B | $8.56B | +8.1% |
| Non-GAAP operating margin | n/a | 29.1% | 30.2% | +110 bps |
| GAAP net income | n/a | $7.18B | $7.00B | -2.5% |
| Non-GAAP diluted EPS | n/a | $8.65 | $9.42 | +8.9% |
| R&D expense | n/a | $3.23B | $3.57B | +10.5% |
GAAP net income declined 2.5% in FY2025 despite higher revenue, primarily because capital expenditures nearly doubled from $1.19 billion in FY2024 to $2.26 billion in FY2025 (Singapore Tampines Campus expansion plus US manufacturing investment), increasing depreciation. Non-GAAP EPS grew 8.9% because share count declined roughly 3.1% via buybacks.
FY2026 is tracking toward approximately $31-32 billion in revenue based on Q1 and Q2 actuals plus Q3 guidance. Q1 FY2026 (January 25, 2026) delivered $7.01 billion in revenue, beating the $6.85 billion midpoint guidance. Q2 FY2026 (April 26, 2026) delivered $7.91 billion, beating both the prior-quarter guidance midpoint and consensus. Q3 FY2026 is guided at $8.95 billion, which would be another record if achieved. The implied FY2026 EPS consensus of approximately $12.24 (33 analysts as of June 25) would represent 30% growth over the $9.42 in FY2025.
The most important FY2026 income statement development is the gross margin inflection. Non-GAAP gross margin crossed 50.0% for the first time in company history in Q2 FY2026 (GAAP: 49.9%). Q3 FY2026 is guided at 50.1% non-GAAP. Management noted that non-GAAP gross margin has expanded 800 basis points since CEO Gary Dickerson took office in 2013 - a decade-long sustained expansion driven by leading-edge tool mix, a fixed-cost base spread over growing volume, and the reduction of lower-margin China trailing-edge revenue as a fraction of the total.
R&D at $3.57 billion in FY2025 (12.6% of revenue) is the highest absolute R&D spend in the WFE peer group. The investment is focused on GAA nanosheet tools, BSPDN deposition and planarization, advanced packaging systems, and the AIx digital service platform for AGS. This R&D pipeline has a 3-5 year lag from investment to process-of-record revenue recognition, which means AMAT’s FY2025-FY2026 R&D investments are building the tool positions that will generate FY2028-FY2030 SS revenue.
Revenue by geography: the rotation story
| Region | FY2025 Revenue | FY2025 % | FY2024 % |
|---|---|---|---|
| China | $8.53B | 30.1% | 37.2% |
| Taiwan | $6.86B | 24.2% | 14.8% |
| Korea | $5.61B | 19.8% | 16.5% |
| United States | $3.06B | 10.8% | n/a |
| Japan | $2.27B | 8.0% | n/a |
| Southeast Asia | $1.08B | 3.8% | n/a |
| Europe | $0.96B | 3.4% | n/a |
The geographic rotation from FY2024 to FY2025 is the most important story in these numbers. China fell from 37.2% to 30.1% while Taiwan surged from 14.8% to 24.2% (TSMC N2 ramp) and Korea rose from 16.5% to 19.8% (HBM/DRAM expansion). This is not a coincidence. The AI-driven demand at TSMC and Samsung is partially replacing the BIS-restricted China revenue. The question for FY2026 and beyond is whether the Taiwan and Korea growth rates continue at pace as China stabilizes near 24% of SS+AGS.
Cash flow and capital allocation
FY2025 operating cash flow was $7.958 billion (C-0806, verified). Capital expenditures were $2.260 billion (nearly double FY2024’s $1.19 billion), driven by the Singapore Tampines Campus expansion. Free cash flow was $5.698 billion, down 24% year-over-year from $7.49 billion in FY2024.
Capital returns in FY2025: buybacks of $4.895 billion plus dividends of $1.384 billion equals total returns of $6.279 billion (C-0807, verified). That $6.279 billion return exceeded the $5.698 billion FCF for the year, meaning AMAT drew modestly on its balance sheet to sustain the capital return program. The buyback pace was possible because of the $14 billion-plus remaining buyback authorization (after a new $10 billion authorization added March 10, 2025).
In H1 FY2026, buybacks slowed to $737 million (Q1: $337 million, Q2: $400 million) because the $252.5 million BIS settlement cash payment in Q2 temporarily reduced available capital. With the settlement payment behind it and Q3 FCF expected to rebound materially (the depressed Q2 FCF of $210 million was almost entirely caused by the BIS payment), buyback pace is likely to accelerate in H2 FY2026.
Dividends: the quarterly rate was raised 15% to $0.46 per share in March 2025 (the eighth consecutive annual increase). A further increase was announced alongside Q2 FY2026 earnings in May 2026, raising the quarterly rate to approximately $0.53 per share; this is identified in sentiment research but the exact figure should be verified from primary Applied Materials investor relations materials before citing in any trading context. The annualized rate would imply approximately $2.12-2.12+ per share; at $668, the dividend yield is approximately 0.32%.
Balance sheet
At FY2025 year-end (October 26, 2025): cash and equivalents of $7.24 billion; short-term debt of $100 million; long-term debt of $6.56 billion; total debt of $6.66 billion; net cash approximately $0.58 billion. At Q2 FY2026 end, cash and investments (broader measure including short-term investments) was $13.38 billion, with debt roughly unchanged. The net cash position is near-neutral but effectively positive in an operating cash-flow context: the $7-8 billion annual OCF covers the $6.5 billion long-term debt position in under a year.
Market action and valuation
Price and performance
AMAT closed at $668.00 on June 25, 2026 (793.96 million diluted shares outstanding; market cap $530.36 billion). The session gain was +$79.03 (+13.42%), triggered by the Q2 FY2026 earnings release (record revenue, first non-GAAP gross margin above 50%) and the simultaneous announcement of six new AI chipmaking systems targeting deposition and CMP applications for HBM DRAM capacity expansion, advanced packaging process steps, and AI logic front-end processing.
52-week range: $154.46 (set approximately June-August 2025, during the China export-control shock) to $669.22 (intraday high set June 25, 2026). The stock essentially moved from its 52-week low to its 52-week high in under 12 months. The one-year return as of June 25, 2026 was +264.89% (from approximately $183). Year-to-date 2026 return: +159.93% (from approximately $257 at year-start).
AMAT is a high-amplitude cycle stock: approximately +84% in 2021, approximately -38% in 2022, approximately +68% in 2023, approximately +1% in 2024, and +160% year-to-date in 2026 through June 25. The amplitude reflects the WFE cycle, the China binary, and the AI-capex re-rating. It is not a calm stock.
Technical context as of June 25: RSI 72.52 (overbought); stock trading 24% above 20-day MA, 44% above 50-day MA, and 104% above 200-day MA. These are extreme readings for a large-cap industrial name. Overbought conditions after earnings gaps can persist for weeks before mean-reverting, but they do set a higher bar for near-term continuation. The pre-earnings close of $588.97 and the approximate $600 round number are the nearest logical reference levels for investors who missed the June 25 gap.
Valuation multiples (all as of June 25, 2026)
| Multiple | AMAT | Notes |
|---|---|---|
| Trailing GAAP P/E | 62.8x | TTM GAAP EPS approximately $10.65 |
| Forward non-GAAP P/E (FY2026) | 54.6x | Consensus $12.24; 33 analysts |
| Forward P/E (Finviz FY2027-based) | ~40.5x | Different denominator; ~$16.50 NTM EPS |
| EV/EBITDA (LTM) | 57.1x | Enterprise value $529.39B |
| Price/Sales (LTM) | 18.3x | LTM revenue approximately $29.0B |
| Price/FCF (LTM) | 99.3x | LTM FCF approximately $5.70B |
| Dividend yield | approximately 0.32% | $2.12 annualized at current quarterly rate |
The 62.8x trailing GAAP P/E sits approximately 138% above AMAT’s 10-year GAAP P/E median of approximately 19.23x, above even the 2021 AI-cycle peak of approximately 47x. The market is pricing a structural re-rating: the view that GAA, BSPDN, HBM, and advanced packaging represent a durable step-up in AMAT’s dollar content per wafer rather than a cyclical peak. Whether that re-rating is justified depends on whether EPS growth validates the multiple over the next 2-3 years.
The P/FCF (price-to-free-cash-flow) ratio of 99.3x is the hardest single multiple to defend at face value. FCF lags reported EBITDA because AMAT nearly doubled its own manufacturing capex in FY2025. If normalized capex returns to the FY2024 level of $1.2 billion (from $2.26 billion), FCF would be approximately $7.0-7.5 billion - implying a normalized P/FCF of roughly 71-76x. Still elevated, but more consistent with the reported EBITDA-based multiples.
Analyst consensus
As of June 23, 2026 (the last full data set before the June 25 earnings gap): 39 analysts; 28 Strong Buy, 4 Buy, 6 Hold, 1 Sell, 0 Strong Sell. Consensus mean price target: $532-$563. Consensus high target at the time: approximately $715-720 (Wells Fargo $715, Citi $710-720).
This data is now substantially stale. With AMAT at $668.00 on June 25, the pre-gap consensus mean of $532-$563 implies 15-20% downside to consensus - a classic post-gap dynamic where the stock has moved faster than the analyst revision process. The market should expect a wave of upward target revisions in the days following June 25. The leading post-gap revisions: Jefferies raised its target to $770 and Wells Fargo raised to $740 on June 26. Until those revisions propagate through the consensus machinery, the mean target data should be treated as stale and not as a current forward-looking signal.
Morgan Stanley’s Equal Weight with a $502 target (issued May 18, 2026) represents the most visible institutional bear call, and it was set before the June 25 earnings gap. Philippe Laffont of Coatue Management publicly cited AMAT as a preferred AI infrastructure vehicle, which circulated widely among retail investors - a high-profile institutional endorsement that amplified interest in the name.
Institutional and insider ownership
Institutional ownership: approximately 83-85% of shares outstanding. Short interest: approximately 2.51-2.77% of float (approximately 19.95-21.91 million shares; approximately 2.76 days to cover). The low short interest means there is no meaningful short-covering dynamic to amplify either a rally or a selloff.
Insider transactions in the weeks preceding the June 25 gap deserve note. CEO Gary Dickerson sold approximately 83,000 shares at $590-600 in June 15-16, generating approximately $49 million in proceeds. Multiple SVPs and a director sold concurrently in June 3-18. All executive sales occurred before the June 25 earnings gap; none sold into the 13% move. The clustering of sales across multiple executives in a narrow window is consistent with coordinated 10b5-1 pre-planned schedule execution rather than discretionary selling on negative information. The fact that the June 25 earnings then beat expectations significantly makes an adverse-information reading of the sales implausible.
Sentiment and narrative read
The three-act narrative
The period from Q4 FY2025 (November 2025) through the June 25, 2026 product announcement is best read as three sequential narrative phases.
Act 1 (September to November 2025): China shock. The BIS Affiliates Rule landed September 29, triggering a $600 million FY2026 revenue warning and a $110 million Q4 FY2025 impact. China’s share of revenue had already fallen from a Q1 FY2024 near-45% peak to 29% in Q4 FY2025. The stock fell more than 4% after-hours on the Q4 FY2025 earnings call, and coverage was uniformly cautious. The 52-week low of approximately $154 reflected peak export-control-shock pessimism.
Act 2 (February 2026): Settlement clearance. The $252.5 million BIS settlement removed the legal uncertainty overhanging the stock. DOJ and SEC closed their parallel investigations without action, removing the criminal prosecution tail. Q1 FY2026 earnings beat on both revenue and EPS despite the $253 million GAAP charge. Coverage pivoted to “the overhang is lifted.” The stock recovered from the mid-$100s toward the $400-500 range through the spring.
Act 3 (May to June 2026): AI re-acceleration. Q2 FY2026 results (May 14) delivered record revenue, the first non-GAAP GM above 50%, and the Q3 guide of $8.95 billion. Management raised the WFE market growth outlook from “more than 20%” to “more than 30%” for calendar 2026. Also in May, Broadcom formally joined AMAT’s EPIC center (the Enablement Platform for Integrated Circuits, AMAT’s collaborative advanced-packaging R&D hub connecting the company with chip designers, OSATs, and university research groups to co-develop next-generation packaging processes) - an industry-level endorsement of the packaging strategy from a leading chip designer that consumes advanced packaging at scale. Then on June 25, six new AI chipmaking product announcements plus Micron’s simultaneous strong quarterly results sent AMAT up 13.42% to a new all-time high. Coverage is now hot.
Where the crowd and the filings diverge
The crowd treats the China headwind as essentially resolved - “in the price” after the 2025 drawdown. The filings say something more nuanced: China was 24-27% of revenue in H1 FY2026 (still a top-3 geography), domestic substitution continues regardless of BIS policy, and the SDO compliance obligation runs three years with the first audit in July 2027. The crowd’s confidence that “China is handled” understates the compliance friction embedded in the settlement.
The crowd’s “cheapest WFE” frame is accurate within the peer group (AMAT at 62.8x trailing vs LRCX 75.9x and KLAC 73.3x) but misleading as an absolute valuation argument. AMAT’s 10-year median GAAP P/E is approximately 19.23x. The “cheap WFE” stock is still trading at more than triple its own long-run average. The relative-value framing works only if you believe the entire WFE peer group multiple is justified - which requires continued AI-capex durability and WFE cycle extension.
The re-rating narrative (GAA content plus BSPDN plus packaging) is being priced as both certain and imminent. The filings show that BSPDN revenue is a 2027-2028 story tied to TSMC A16 volume (orders being placed now, revenue in 2027-2028), the content-per-wafer numbers are management estimates and analyst models rather than booked orders, and the FCF at 99.3x P/FCF requires a clear ramp in H2 FY2026 and FY2027 to normalize.
Where the crowd is behind the filings: the 34% revenue concentration in two unnamed customers is rarely discussed in retail forums; the SDO’s reach (global, not just China) receives negligible coverage; and P/FCF at nearly 100x is almost never cited in retail discussions that focus on the forward P/E and the peer-relative trailing P/E comparison.
Macro context: the WFE cycle, AI capex, and export controls
WFE cycle position as of mid-2026
The WFE market is in the third year of an expansion from the 2023 trough ($88 billion). SEMI’s base case projects $126.2 billion in front-end WFE in 2026 (+9% year-over-year) and $135.2 billion in 2027 (+7.3%). AMAT management guided the market growing more than 30% for calendar 2026 - a materially more bullish view than SEMI’s baseline, reflecting visibility into their own order book.
The pace of billings growth is normalizing: from +24% year-over-year in Q2 2025 to +14% in Q1 2026. This deceleration is normal cycle maturation, not a reversal signal. WFE companies characteristically see top-line growth moderate before order books turn, because backlog burn sustains revenue even as new order rates level off.
The critical distinction from prior cycles is the overlapping demand structure: the logic/foundry leg (AI chips at TSMC N2/A16), the memory leg (HBM at SK Hynix/Micron/Samsung), and the early NAND recovery are sequential rather than simultaneous, which is why the WFE curve has not followed the standard sharp boom-bust of a single-driver cycle. The more accurate read is a structurally elevated cycle with multiple overlapping drivers - not an unconstrained supercycle, but not the standard single-memory-cycle boom either.
AI data center capex durability
The hyperscaler capex commitment is historic. Microsoft, Alphabet, Amazon, and Meta combined are guiding approximately $725 billion in 2026 capital expenditures, up 77% from approximately $410 billion in 2025. These are physical infrastructure investments with 10-15 year useful lives, and management teams have explicitly committed to them in public guidance. The concern is not that hyperscalers stop spending next quarter; it is that in 2027-2028, when ROI scrutiny intensifies, the rate of capex growth decelerates materially from 77%.
A deceleration from 77% capex growth to flat capex growth (not a cut, just flat) would still leave WFE at current elevated levels but remove the incremental tailwind. WFE orders lead delivery by 12-18 months, so any 2027 capex digestion would manifest as Semiconductor Systems order softening in late 2026. The ROI gap (hyperscaler AI infrastructure spend significantly exceeding current AI-attributable revenue) is the 12-24 month leading risk, not an imminent cliff. The AI infrastructure buildout has structural momentum: fabs ordered now take years to complete, and training compute requirements keep scaling.
CHIPS Act and allied-country fab buildouts
The CHIPS Act geographic diversification is a genuine multi-year WFE tailwind. TSMC received $6.6 billion in CHIPS Act direct funding; Samsung received $4.7 billion; Intel received $7.86 billion. The equipment installation cycle for TSMC Arizona Fab 21 Phase 2 begins Q3 2026 with production in 2027. These fabs are building AI-era processes (N2, N3, 18A) that carry the highest AMAT content per wafer of any node generation.
North American WFE fell 20% in 2025 (the gap between fab groundbreakings and equipment installation). The catch-up begins in H2 2026, contributing to AMAT’s US-geography SS revenue through 2027-2028. This demand is government-backed and therefore less discretionary than private capex, providing a degree of insulation from AI demand cycle swings.
Export control policy trajectory and macro risk to rates
The US has tightened semiconductor equipment export controls in stages: October 2022 (initial advanced-node restrictions), October 2023 (expanded scope), September 2025 (BIS Affiliates Rule). The direction since 2022 has been consistently toward more restriction, not less. The next potential escalation point - discussed but not enacted as of June 2026 - is controls on service and spare parts for tools already installed at restricted Chinese fabs. That specific escalation would be uniquely damaging because it would reach AMAT’s AGS recurring revenue, which is currently outside BIS scope.
On rates: AMAT’s own balance sheet carries near-neutral net cash, so direct interest-rate sensitivity is modest. The macro rate risk operates through the equity multiple channel: at 54-57x EV/EBITDA and 62.8x trailing P/E, AMAT’s valuation is very sensitive to discount-rate assumptions. A material rise in the risk-free rate or credit spreads would apply downward pressure on the high-multiple portion of the WFE peer group without changing a single line of AMAT’s income statement.
Micro economics: unit economics, margin, and capital efficiency
Semiconductor Systems unit economics
AMAT’s average selling price per tool varies by product: high-end ALD systems for GAA gate dielectrics can run $5-10 million or more; CMP tools run $2-5 million; ion implant tools $3-8 million; inspection tools $3-10 million. ASPs have risen over time as process complexity increases - N2-node tools carry pricing premiums vs N3 tools, which carried premiums vs N5. This ASP inflation is part of the mechanism behind the 800 basis point gross margin expansion since 2013.
The SS non-GAAP gross margin in Q2 FY2026 was 54.8%, the highest in recent history, driven by three factors: (1) leading-edge logic tool mix at its highest share ever (67% foundry/logic), (2) China ICAPS trailing-edge volume (lowest margin) declining as a fraction of the mix, and (3) a predominantly fixed manufacturing cost structure spread across record revenue, reducing overhead cost per unit shipped.
AGS unit economics: the annuity math
AGS generated $6.39 billion in FY2025 from approximately 55,000 active installed tools, implying approximately $116,000 per installed tool per year. At the Q2 FY2026 gross margin of 34.7%, each installed tool generates roughly $40,000 per year in AGS gross profit. Over a 15-year leading-edge tool life, one system generates approximately $600,000 in cumulative AGS gross profit - often more than the original tool sale’s gross profit contribution.
The AGS economics improve over a tool’s lifetime for two reasons. Per-tool revenue tends to expand as customers opt into upgraded service agreements, add software subscriptions (AIx platform, process control tools), and as AMAT’s recipe library for that tool grows in value relative to the customer’s process flow. And the renewal rate exceeds 90% with an average contract term of approximately 2.9 years, meaning AMAT retains more than 90 cents of every dollar of AGS revenue through each renewal cycle.
Why AGS compounds even when the WFE market is flat: the installed base grows at approximately 5% annually from new tool shipments. Revenue per installed tool is also growing (through software layers and higher-value service tiers). And AGS held up through both the 2018-2019 WFE correction (-11-12%) and the 2022-2023 correction (-18%) because fabs keep their tools running regardless of whether they are buying new ones. This makes AGS the single most important earnings floor in any bear case for AMAT.
The 34.7% AGS gross margin is lower than SS’s 54.8%, but this should not be read as a low-quality business. The recurring nature, near-zero capital requirements (servicing existing tools does not require new R&D investment), and 90%-plus renewal rates give AGS a quality profile that a 34.7% gross margin on new tool hardware would not capture. AGS operating margin in Q2 FY2026 was 29.2%.
R&D intensity and the moat maintenance cost
AMAT invested $3.57 billion in R&D in FY2025 (12.6% of revenue), the largest absolute R&D dollar amount in the WFE peer group. KLA’s R&D was approximately $1.36 billion (11.2% of revenue). The R&D focus is well-aligned with near-term commercial opportunity: GAA nanosheet tools (qualifying for TSMC N2 and Samsung SF2 POR positions), BSPDN processing modules (in development for TSMC A16 and Intel 18A), advanced packaging systems (TSV, hybrid bonding deposition), and the AIx digital service platform for AGS. The lag from R&D investment to process-of-record win to revenue recognition is 3-5 years, meaning FY2025-FY2026 R&D investments are the seeds of FY2028-FY2030 SS revenue.
Capital allocation: buybacks, dividend, and capex
AMAT returned $6.279 billion to shareholders in FY2025 ($4.895 billion in buybacks plus $1.384 billion in dividends) against $5.698 billion in FCF - a payout ratio above 100% that was funded by modest balance sheet drawdown, a reflection of management’s confidence in the normalized FCF trajectory. The buyback pace reduced diluted shares from approximately 845 million in FY2023 to 808 million in FY2025 and approximately 794 million as of June 25, 2026. At the current pace, AMAT retires roughly 3% of its outstanding shares annually, which adds roughly 3% to per-share earnings growth on top of operating profit growth.
The $14 billion-plus remaining buyback authorization and approximately $7-8 billion normalized annual FCF (once the elevated capex year normalizes) mean capital returns are durable. The elevated FY2025 capex ($2.26 billion) reflected a genuine capacity expansion investment (Singapore Tampines Campus doubling cleanroom capacity) rather than maintenance capex. If manufacturing capex normalizes toward $1.2-1.4 billion, FCF would be approximately $7.0-7.5 billion annually - a P/FCF of approximately 71-76x on normalized figures rather than 99.3x on the LTM elevated-capex figure.
Durability and synthesis
What makes the franchise structurally durable
Process-of-record wins at GAA nodes (TSMC N2, Samsung SF2, Intel 18A) take 1-3 years to qualify and are nearly impossible to displace mid-node. A fab’s qualification of AMAT’s Centura Epi for nanosheet formation is embedded in the process flow, the recipe set, the technician training, and the yield model. Re-qualifying a competitor’s epi tool would require starting a multi-year qualification process from scratch, at risk to yield during the transition. AMAT’s current POR positions at these nodes will generate recurring Semiconductor Systems and AGS revenue for the useful life of those tools - 10-15 years for leading-edge tools. Wins made now compound through the decade.
The AGS restructuring to 100% recurring revenue removes the lumpy 200mm equipment sales from the segment comparison base, making the annuity quality more visible. At $6.4 billion in FY2025 growing toward $8 billion or more by FY2028 at mid-teens, AGS compounds at a rate that cushions SS cycle downturns and provides a structural cash floor regardless of WFE spending.
Advanced packaging and HBM represent genuinely new revenue, not a reallocation from existing AMAT categories. The deposition and CMP steps for TSV-based HBM and hybrid bonding precursor films did not previously exist at meaningful scale. AMAT’s 90%-plus growth in advanced packaging revenue (prior year) and the 50%-plus growth guide for calendar 2026 are the most visible new-market proof point in the thesis.
AMAT’s product breadth (CMP, ion implant, inspection - categories Lam and Tokyo Electron do not fully cover) means it can serve as a single-vendor partner for more process steps, reducing customer qualification burden. This “fewer vendor relationships” value proposition strengthens AMAT’s position at chipmakers who prefer to minimize the number of tool platforms they qualify and support.
Where the genuine vulnerabilities sit
China revenue was 37.2% of total revenue in FY2024 and is on a structurally downward path to approximately 24% of SS+AGS in Q2 FY2026, with domestic substitution progressing at trailing-edge nodes regardless of BIS policy direction. Industry analysts argue this displacement is structurally one-way at the node and customer level given re-qualification switching costs; management has not described the trajectory as permanent. But the math is clear: even under the most favorable policy scenario, AMAT’s China TAM is contracting as Naura and AMEC qualify at more trailing-edge process steps.
The suspended denial order is the most distinctive risk in the AMAT investment case - a risk that receives almost no coverage in sell-side research. A single export compliance failure anywhere in AMAT’s global operations between the February 2026 settlement date and February 2029 would trigger a denial order covering all AMAT export licenses globally, including to TSMC, Samsung, and SK Hynix. This is not a theoretical risk; it is a documented conditional legal obligation with a July 2027 first audit and a three-year term.
At 54-57x forward/EV/EBITDA multiples, the stock prices in a sustained cycle upturn. Any WFE spending correction - the historical trough amplitude is 15-20% - would compress Semiconductor Systems revenue by $3-4 billion annually. Given AMAT’s predominantly fixed cost base, that revenue decline translates to 25-35% EPS compression. Multiply a lower EPS by a lower multiple (which typically contracts simultaneously with earnings in a cycle downturn) and the magnitude of a bear case scenario becomes clear: the 2022-2023 decline from approximately $167 to approximately $70 was a 58% peak-to-trough drawdown, and that occurred from a much lower multiple than today’s.
Synthesis
Applied Materials is the broadest-portfolio WFE company in the world: it is toll-taker in planarization (CMP dominant), metallization (PVD undisputed leader), and epitaxial transistor formation (Centura Epi for nanosheets), a premium competitor in deposition and parts of etch, and an annuity owner in aftermarket services on 55,000 installed tools. The technology inflection thesis - GAA plus BSPDN plus advanced packaging - is real, visible in the order book, and partially provable from early adoption data. But none of it is guaranteed: BSPDN is a 2027-2028 revenue story, the ~30% GAA content uplift is a management and analyst estimate, and “advanced packaging growing 50%” starts from a small base.
The China structural erosion and the SDO compliance tail are two risks that the bull consensus largely dismisses. Neither is base-case: China has stabilized near 24% of SS+AGS, and AMAT’s compliance machinery is being substantially upgraded. But they are not zero either.
The stock at $668 requires near-perfection across three simultaneous technology transitions with a WFE cycle clock still running and a valuation triple its own long-run average. The business is excellent. The price is the problem.
The scenarios in detail
Bull: the content-per-wafer compounding thesis confirmed
The bull case requires four things to go right simultaneously and to deliver on schedule.
Semiconductor Systems grows at 12-15% CAGR from FY2026 to FY2031. TSMC A16 tool installs begin in H2 FY2026 and BSPDN contributes $0.3-0.5 billion annually by FY2028, scaling to $1-2 billion by FY2030 as Intel 18A and TSMC A16 volumes reach meaningful wspm. HBM4 at SK Hynix, Samsung, and Micron drives DRAM revenue above $2.5 billion annually by FY2028. NAND begins recovering in FY2027-2028, adding $1-1.5 billion to annual SS revenue.
China stabilizes at 18-22% of SS+AGS throughout. The BIS Affiliates Rule remains suspended; ICAPS customers continue modest investment; AMAT retains the China positions where domestic tools cannot yet match performance (leading-edge logic CMP, precision ion implant, advanced ALD).
AGS grows 15-17% annually to approximately $14 billion by FY2031, driven by AIx software subscription layers on top of service contracts and an installed base growing 6%-plus annually.
Non-GAAP gross margin expands from 50.0% toward 52-54% by FY2030 as leading-edge logic and BSPDN tools (the highest-margin SS categories) become a larger fraction of the mix.
At a 28-32x FY2031 non-GAAP EPS exit multiple - structural compounder status confirmed by five consecutive years of above-cycle earnings growth - and approximately $28 in FY2031 EPS [estimate], the illustrative bull 5-year price is approximately $850 [estimate; not a price target].
What breaks the bull: the SDO first audit in July 2027 finds a compliance issue (binary tail, no intermediate signal); or TSMC A16 tool order commentary does not appear in backlog discussion by Q1 FY2027 earnings (the key confirmation event for BSPDN thesis); or a 2027 hyperscaler capex digestion produces a WFE order deceleration signal before the content-per-wafer gains can offset it.
Base: moderate compounding with a digestion year
SS revenue grows at 8-10% CAGR, with a mild WFE digestion year in AMAT’s FY2028 (ending October 2028) as hyperscaler capex growth decelerates from 77% to 10-20%. SS revenue is roughly flat to slightly down in FY2028, recovering in FY2029. BSPDN contributes modestly from FY2028 ($0.1-0.3 billion). NAND adds $0.8-1.2 billion from FY2028.
China falls gradually from 24% of SS+AGS in Q2 FY2026 to 18-20% by FY2028 as domestic substitution continues at 1-2 percentage points per year and some BIS scope remains post-suspension. ICAPS customer business partially stabilizes the floor.
AGS grows 12-14% annually, slightly below mid-teens management guidance, as China installed-base attrition from domestic tool adoption provides a modest structural drag on renewal rates.
Non-GAAP gross margin expands modestly to 51-52%, dips toward 49-50% in the FY2028 digestion year as SS mix falls, and returns to 51-52% by FY2030.
At a 20-24x FY2031 exit multiple on approximately $23.50 in FY2031 EPS [estimate] - a premium to AMAT’s 10-year P/E median reflecting AGS annuity quality but well below today’s cycle premium - the illustrative base 5-year price is approximately $540 [estimate; not a price target].
What breaks the base into the bear: the FY2028 digestion deepens into a full 20-25% WFE correction (as in 2022-2023), or BIS reinstates the Affiliates Rule while China domestic substitution accelerates beyond the 1-2 percentage point per year assumption.
Bear: multiple compression meets cycle correction and China escalation
The bear case is a sequence, not a single event. First, in Q3 or Q4 FY2026, Semiconductor Systems order growth begins decelerating as TSMC’s initial N2 tool set is largely installed and A16 orders have not yet ramped. Revenue growth on the +23% YoY Q3 guide becomes the ceiling rather than the floor. Second, the BIS Affiliates Rule is reinstated in late 2026 or early 2027 as US-China trade negotiations stall. China falls from 24% to below 18% of SS+AGS by FY2028. Third, by FY2028, Semiconductor Systems revenue contracts 10-15% year-over-year as the AI capex ROI gap materializes and hyperscalers guide flat-to-declining CY2027-2028 capex.
SS revenue grows only 5-7% in FY2027, then contracts 12-15% in FY2028. Recovery is slow. China falls to 15-17% of SS+AGS by FY2028 and continues eroding. AGS grows only 7-9% annually as China installed-base attrition removes renewal candidates faster than new non-China tool shipments can replace them. Non-GAAP gross margin compresses toward 47-48% in the FY2028 trough.
At a 14-18x FY2031 exit multiple - the market’s price for a cyclically challenged WFE equipment company that failed to sustain its structural re-rating - on approximately $15 in FY2031 EPS [estimate], the illustrative bear 5-year price is approximately $240 [estimate; not a price target].
What would prevent the bear: TSMC A16 tool orders appearing in backlog commentary by Q1 FY2027 earnings, sustaining SS revenue above $7.5 billion quarterly throughout FY2027. That single signal would remove the primary bear trigger by demonstrating that BSPDN content is flowing into the order book before the cycle digestion arrives.
The single most important leading indicator: AMAT Semiconductor Systems quarterly revenue on a sequential basis. The Q3 FY2026 guide is $6.9 billion, up 16% from Q2’s $5.97 billion. If Q4 FY2026 is then guided at $7.3 billion or higher, the bull case is tracking. If Q4 FY2026 is guided flat or down from Q3’s $6.9 billion, the sequential deceleration signal is present and the bear scenario gains credibility regardless of year-over-year comparisons.
Companies to watch
The AMAT thesis plays out or fails through the trajectory of a cluster of connected companies. Each name below is a signal source, not just a peer:
TSMC (TSM/2330.TW): TSMC monthly revenue (reported on the 10th of each month in Taiwan) is the most timely leading indicator for WFE demand. TSMC’s N2 wafer volume ramp and A16 capex guidance are the single most important external data series for AMAT’s SS revenue. In the bull case, TSMC raises 2026-2027 capex guidance; in the bear case, TSMC cuts capex as utilization softens. Prior marketsupplychain.com coverage of ASML is the closest current cross-reference in the site’s research; TSMC’s equipment order cadence runs through that same WFE ecosystem.
Nvidia (NVDA): Nvidia’s data center GPU demand drives HBM demand from SK Hynix, Micron, and Samsung, which drives AMAT’s advanced packaging and DRAM tool revenue. Nvidia’s quarterly data center revenue guide is the most upstream leading indicator for AMAT’s HBM tool order flow. The prior NVDA coverage on this site provides context on the AI chip demand trajectory.
Lam Research (LRCX): AMAT’s most direct competitor. If Lam wins the GAA selective nanosheet release etch POR at TSMC N2/A16, AMAT’s content gain is lower than modeled. Track Lam’s SS and memory equipment commentary for competitive intelligence on whether AMAT or Lam is taking the incremental GAA etch win. Lam’s China exposure trajectory is also a comparable reference: if Lam’s China percentage is declining at the same rate as AMAT’s, it suggests a BIS policy effect; if AMAT is declining faster, it suggests AMAT-specific domestic substitution.
KLA Corporation (KLAC): KLAC’s revenue growth is a proxy for total WFE process intensity - more steps means more inspection. If KLAC beats and raises, it validates the content-per-wafer thesis for the whole sector. A KLA miss would signal either customer capex restraint or a step-count disappointment that would read negatively for AMAT’s GAA and BSPDN content story.
ASML: ASML’s EUV shipment count and High-NA EUV order book is the constraint that governs the pace of leading-edge node ramps at TSMC and Samsung. If ASML shipments disappoint or High-NA EUV adoption slows, TSMC and Samsung node ramps slip, and AMAT’s associated tool installs follow with a lag. The prior ASML deep-dive on this site is the natural cross-reference.
Micron (MU): Micron’s HBM capex trajectory is a direct proxy for AMAT’s DRAM and advanced packaging tool orders. Micron’s June 25 earnings beat (the same session as AMAT’s Q2 results) was a direct positive read-through. Any future Micron capex cut would remove one of the three HBM-demand legs simultaneously with AMAT’s order book.
Naura Technology Group (002371.SZ) / AMEC (688012.SS): The domestic Chinese tool vendors are the long-run structural threat. Track Naura’s quarterly revenue growth and customer base expansion. If Naura’s annual revenue crosses $7-8 billion with confirmed major SMIC or CXMT tool qualifications beyond trailing-edge nodes, China domestic substitution is accelerating faster than the bear case assumes.
Intel (INTC): Intel Foundry’s 18A ramp timeline is directly tied to AMAT’s BSPDN tool POR revenue. Any Intel 18A commercial delay announcement is a near-term AMAT headwind. Any Intel 18A external customer win announcement (the first customer beyond Intel’s own chips) is a bull-case catalyst that would validate the BSPDN node and accelerate TSMC A16 adoption decisions.
Axcelis Technologies (ACLS): According to semiconductor equipment industry analysts, Axcelis has gained meaningful ion implant share from AMAT’s historically dominant position. Axcelis’s pending merger with Veeco (expected H2 2026), if completed, would add epitaxial deposition capabilities to Axcelis’s ion implant franchise, creating a more formidable competitor in two AMAT categories simultaneously. Track: Axcelis quarterly ion implant revenue and any named customer wins at leading-edge logic or DRAM nodes.
SCREEN Holdings (7735.T, TSE; no liquid US ADR): SCREEN is the dominant supplier of single-wafer wet-clean equipment at leading-edge fabs - a step AMAT does not lead. Its Raynance platform holds process-of-record wins for inter-step wafer cleaning at TSMC, Samsung, and SK Hynix. Cleaning steps multiply alongside deposition and etch steps at advanced nodes (GAA, BSPDN, HBM packaging all add cleaning cycles), making SCREEN a direct beneficiary of the same rising step-count thesis that drives AMAT’s content-per-wafer narrative. LTM revenue approximately $4 billion (fiscal year ending March 2026). SCREEN trades only on the Tokyo Stock Exchange; there is no liquid US ADR, making it impractical for most US investors to hold directly. It functions best as a signal source: SCREEN’s quarterly revenue guidance and leading-edge tool order commentary provide an independent read on fab cleaning-step intensity across the WFE cycle.
Risk controls
Practical risk framing for a position in AMAT at $668:
China export-control escalation. The $600 million FY2026 headwind from the BIS Affiliates Rule was historically significant but was subsequently suspended. The ongoing risk is reinstatement of the rule or its extension to service and spare parts. Monitor: quarterly China percentage of SS+AGS revenue (currently 24%; a move below 20% without management explanation signals accelerating domestic substitution or BIS escalation); Federal Register notices from BIS on semiconductor equipment service rule proposals.
WFE cycle risk. Historical trough amplitude is 15-20% peak-to-trough in SS revenue. At $20.8 billion in FY2025 SS revenue, a 15-20% correction would remove $3.1-4.2 billion annually. Given AMAT’s fixed manufacturing cost base, EPS would compress 25-35% from the revenue correction alone, before any multiple re-rating. The early-warning indicators are hyperscaler quarterly capex guidance (the most leading signal, 12-18 months ahead of WFE revenue) and SEMI monthly equipment billings (the aggregate sector signal). Current readings are constructive; watch for a sustained deceleration below +5% year-over-year in billings as the first cyclical inflection signal.
Valuation risk - independent of demand. At 54-57x forward P/E and EV/EBITDA, a reversion of the multiple toward AMAT’s 10-year median of approximately 19x GAAP P/E would produce significant stock price compression even if EPS grows. Multiple compression from the current level to the historical median, even with 20% annualized EPS growth, produces a deeply negative 3-year return. The risk is not that the business fails; it is that a fair business at an extraordinary price underperforms for years as the multiple normalizes.
Technology transition risk (losing POR). If Lam Research wins the key GAA selective SiGe etch step at TSMC N2 or Samsung SF2, or if ASM International wins the critical high-k/metal gate ALD step at multiple customers, AMAT’s content gain per wafer is lower than the ~30% management/analyst estimate. These POR decisions are made 2-3 years before volume revenue; negative signals emerge through indirect channels (conference commentary, tool qualification announcements in TSMC or Samsung supply chain press). Monitor: AMAT management commentary on specific node tool qualifications at each earnings call.
BIS settlement compliance tail. The SDO (suspended denial order) is the most severe binary risk in the AMAT investment case, and the one least covered by sell-side research. Any BIS compliance enforcement action involving AMAT - even an inquiry ultimately resolved without action - would create severe market uncertainty before the outcome is known. The first audit in July 2027 passes without disclosure unless a violation is found. Monitor: any DOJ/BIS enforcement news involving AMAT in the 2026-2029 window.
Intel Foundry risk. Intel’s 18A BSPDN ramp is the validation event for the BSPDN thesis and a meaningful equipment order pipeline for AMAT. Intel’s recent history includes significant schedule slippage at advanced nodes. Any delay announcement for 18A volume production reduces AMAT’s near-term BSPDN revenue and, more importantly, slows the industry’s BSPDN adoption narrative that is embedded in the stock’s forward multiple.
Advanced packaging revenue concentration in HBM. The majority of AMAT’s advanced packaging order book is HBM-tied. If HBM memory pricing corrects sharply or if memory makers over-invest and generate an HBM inventory glut, advanced packaging tool orders decelerate. Monitor: HBM DRAM spot pricing from memory market research services, and SK Hynix/Micron capacity guidance at each quarterly earnings call.
Display segment structural decline. Display revenue at $1.06 billion (3.7% of FY2025 total) is not a primary investment driver but is a structural drag that management has not signaled any reversal. Chinese display panel makers are adopting domestic equipment for some display steps, further reducing AMAT’s Display addressable market. Not material to the thesis, but worth noting as a revenue category that will likely continue declining as a percentage of total company revenue.
Geopolitical concentration in Taiwan. TSMC is AMAT’s largest or second-largest customer and is headquartered in Taiwan. Any Taiwan Strait escalation scenario that threatens TSMC’s operational continuity is existential for the leading-edge WFE industry, not only for AMAT. This is a tail risk of extreme severity if triggered, not a base-case scenario, but it is load-bearing for the five-year outlook.
Methodology, sourcing, and data-quality flags
Sources
Primary-tier sources: AMAT FY2025 10-K (filed December 12, 2025, fiscal year ending October 26, 2025); Q1 FY2026 10-Q (January 25, 2026) and 8-K earnings press release; Q2 FY2026 10-Q (April 26, 2026), 8-K earnings press release, and earnings call transcript; BIS settlement announcement February 11, 2026; March 10, 2025 buyback and dividend announcement. Note: EDGAR direct fetch returned HTTP 403 errors for some filing URLs; all primary figures were corroborated across two or more filing-grade secondary sources (GlobeNewswire, TIKR, StockTitan) before being recorded as VERIFIED.
Analyst-tier sources: SEMI global equipment billings reports (calendar year 2025 actuals, 2026-2027 forecasts); TrendForce and Mizuho China domestic equipment adoption figures; management and analyst commentary on GAA SAM uplift (approximately 30%) and BSPDN SAM (approximately $1 billion per 100,000 wspm, directional only from management indication - primary transcript not confirmed); Axcelis ion implant share gain characterization; ASML WFE ranking relative to AMAT (ASML overtook AMAT by revenue in 2023); WFE market share estimates for deposition, etch, CMP, and ion implant categories.
Press-tier sources: GlobeNewswire (AMAT earnings press releases, treated as filing-grade for financial figures given they are company-issued); MarketBeat (insider transactions from SEC Form 4 filings); StockAnalysis, Yahoo Finance, Finviz (market data, corroborated across sources for June 25, 2026 close). Analyst price targets from StockAnalysis (S&P Global Market Intelligence sourced, June 23, 2026); post-gap Jefferies $770 and Wells Fargo $740 targets from press-tier sources (June 26, 2026).
Data-quality flags
Price and market cap: $668.00 per share, $530.36 billion market cap (793.96 million diluted shares outstanding) - VERIFIED from StockAnalysis, Yahoo Finance, Finviz, three-source corroboration for June 25, 2026 close. Point-in-time; moves daily.
FY2025 segment revenues: SS $20.80 billion / AGS $6.39 billion / Display $1.06 billion - VERIFIED from GlobeNewswire Q4 FY2025 earnings release (primary-tier). Note: the Display figure corrects a $1.18 billion figure that appeared in some research summary materials; $1.06 billion is the confirmed primary-source figure.
OCF and FCF: OCF $7.958 billion, capex $2.260 billion, FCF $5.698 billion (FY2025) - VERIFIED via C-0806 correction row (original C-0101 had shell-variable corruption). Buybacks $4.895 billion, dividends $1.384 billion, total returns $6.279 billion - VERIFIED via C-0807 correction row (original C-0103 had corruption in buybacks figure).
China revenue trajectory: FY2024 37.2% / $10.12 billion, FY2025 30.1% / $8.53 billion, Q2 FY2026 24% of SS+AGS - all three VERIFIED from primary or press sources. Note the Q2 FY2026 figure uses SS+AGS as denominator (management’s stated metric); annual figures use total company revenue.
Forward P/E spread: Three sources give different forward P/E figures (40.47x Finviz using FY2027, 54.6x StockAnalysis using FY2026 non-GAAP, 55.87x Yahoo Finance using a GAAP-adjusted denominator). This article uses the FY2026 non-GAAP consensus P/E of 54.6x as the primary figure because it is the most comparable to how peers (LRCX at 53.5x, KLAC at 54.3x) are quoted and how sell-side research frames the “parity” valuation argument.
Consensus price targets: The $532-$563 mean target (June 23, 2026) is substantially stale relative to the $668.00 June 25 close; all pre-gap targets should be treated as historical, not forward-looking. The leading post-gap revisions (Jefferies $770, Wells Fargo $740, June 26) are press-tier sourced and represent the leading edge of a wave of expected upward revisions.
CMP market share: A single analyst source cited approximately 71% CMP tool market share; this figure appears in micro research as DISPUTED because it may mix equipment share with consumables market share. This article uses “dominant tool position in CMP” without the specific 71% figure.
BSPDN SAM ($1 billion per 100,000 wspm): Per management indication in analyst summaries; the specific primary earnings call transcript confirming this figure has not been independently confirmed. Treated as directional only and labeled as such throughout.
GAA SAM uplift (~30%): Management and analyst estimate from Q4 FY2025 earnings call commentary. Not a filing-confirmed commitment. Labeled throughout as management/analyst estimate.
China AGS service revenue ($1.5-1.6 billion): A derived estimate (approximately 24% of $6.39 billion AGS, proportional to China’s SS+AGS share) that AMAT does not separately disclose. Not under any current BIS restriction. Appears only as a tail scenario characterization, not base case.
BIS Affiliates Rule status: The rule was issued September 29, 2025, initially flagged as a ~$600 million FY2026 headwind, and subsequently suspended in early 2026 following US-China trade negotiations. Management confirmed the suspension re-enables much of that revenue. The $600 million is a historical figure, not a current drag. Reinstating the rule is an identified risk scenario, not the current policy state.
Installed base count: Approximately 55,000 active service-contracted tools - the figure management uses in the context of AGS economics. A separate cumulative “ever shipped” figure of approximately 85,000 also appears in some management communications; the active 55,000 is the relevant figure for AGS annuity analysis.
Two unnamed customers: FY2025 10-K confirms approximately 19% and 15% of net revenue from two unnamed customers. Their identification as TSMC and Samsung is widely understood in the semiconductor industry but has not been confirmed by Applied Materials.
Axcelis ion implant share: Framed as analyst-tier; the specific share gain percentages are industry analyst estimates rather than filing-confirmed figures from either AMAT or Axcelis.
ASML vs AMAT WFE ranking: Analyst-tier data indicating ASML overtook AMAT as the largest WFE vendor by revenue in 2023. AMAT is the largest non-lithography WFE vendor. The unqualified “world’s largest WFE” description is not used here.
The five-factor research read
Valuation. Applied Materials at $668.00 (June 25, 2026) trades at approximately 54.6x the FY2026 non-GAAP EPS consensus of $12.24 (33 analysts) and 62.8x trailing twelve-month GAAP earnings. The 10-year GAAP P/E median is approximately 19.23x - placing the current trailing multiple at more than triple the long-run average and above the 2021 cycle peak of approximately 47x. The P/FCF of approximately 99.3x reflects both the elevated stock price and temporarily compressed FCF from capex that nearly doubled in FY2025; on a normalized capex basis the P/FCF would be approximately 71-76x, still elevated. The “cheapest WFE” framing is accurate on trailing P/E vs peers (LRCX 75.9x, KLAC 73.3x) but disappears on forward FY2026 non-GAAP basis where all three US names sit at 53-55x. Pre-gap consensus mean target of $532-$563 was below the current price; even the most prominent post-gap upgrades (Jefferies $770, Wells Fargo $740) imply modest upside from $668. Valuation is overvalued relative to own history, peer-group-relative valuation, and multiple intrinsic value frameworks.
Growth. The near-term growth picture is genuinely strong. Q3 FY2026 is guided at $8.95 billion revenue (+23% year-over-year) and $3.36 non-GAAP EPS (+36%). AGS reached $1.67 billion in Q2 FY2026 (+17% year-over-year), with long-term growth guidance raised to mid-teens. Advanced packaging revenue is guided to grow more than 50% in calendar 2026. DRAM revenue grew 18% year-over-year to $1.7 billion in Q2 FY2026, driven by HBM. Management guided the WFE market growing more than 30% in calendar 2026. Multiple structural drivers - GAA content uplift, BSPDN early orders, HBM synchronized expansion at three customers, CHIPS Act fabs entering equipment installation - overlap in 2026-2028, reducing single-driver cycle risk relative to prior WFE up-cycles. Growth is strong across near-term actuals and visible medium-term pipeline.
Quality. Non-GAAP gross margin crossed 50.0% for the first time in company history in Q2 FY2026, guided at 50.1% for Q3. ROIC of 29.3% (three-year average 33.2%) is strong for a capital equipment company competing in contested tool categories. The AGS annuity at $6.4 billion with 90%-plus renewal rates and now 100% recurring revenue mix provides genuine earnings durability through WFE downturns. Near-neutral net cash position and $14 billion-plus buyback authorization support capital returns. Quality is partially penalized: FY2025 FCF fell to $5.70 billion from $7.49 billion as capex nearly doubled; the P/FCF of 99.3x requires a substantial FCF ramp to normalize; and the BIS suspended denial order imposes a compliance cost and three-year existential tail risk on every export decision, the severity of which has been systematically underestimated by the sell-side. Overall quality is high but the FCF compression and SDO tail reduce the score from the top tier.
Risk. China structural erosion is the primary idiosyncratic risk: from 37.2% of FY2024 revenue to 30.1% in FY2025 to 24% of SS+AGS in Q2 FY2026, with domestic vendor substitution advancing structurally at trailing-edge nodes. Industry analysts characterize the displacement as structurally one-way at the node level due to re-qualification switching costs; management has not described it as permanent; but the trend line is clear and the underlying force (government mandate of 50% domestic sourcing for new capacity additions) is not BIS-policy-dependent. The BIS suspended denial order is the single most distinctive tail risk in the AMAT investment case: conditional, not a current restriction, but if triggered by any compliance failure anywhere in AMAT’s global operations, it reaches all export licenses globally. Two unnamed customers representing 34% of FY2025 revenue (widely understood to be the leading Taiwanese foundry and the leading Korean memory and foundry group) create concentrated capex cycle exposure. The AI capex ROI gap creates a credible 2027-2028 WFE digestion scenario. Historical WFE corrections of 15-20% produce 25-35% EPS compression at AMAT’s predominantly fixed cost structure. Risk is elevated on multiple concentrated dimensions simultaneously.
Momentum and sentiment. The +264.89% one-year return and +13.42% single-session gap on June 25, 2026 place Applied Materials at a new 52-week high and among the strongest large-cap performers in the US market year-to-date. Sell-side sentiment is Strong Buy (28 of 39 analysts), with the Morgan Stanley Equal Weight ($502 target, May 2026) representing the most visible institutional bear call. Short interest is very low (approximately 2.5-2.8% of float), removing short-covering as a downside amplifier. The RSI of 72.52 signals near-term overbought conditions. CEO Dickerson and multiple SVPs sold shares in mid-June at $590-634 before the June 25 gap, consistent with 10b5-1 plan execution rather than adverse-information selling, but the pattern warrants note. Momentum is clearly positive; the near-term technical read is stretched.
The overall lean: A rules-based composite of the five factors above yields a Hold rating. The outstanding growth and genuine structural thesis (growth: strong; quality: high; momentum: positive) are fully offset by the overvaluation relative to own history and to defensible intrinsic value frameworks (valuation: overvalued), the concentrated risk profile including the SDO tail and China structural erosion (risk: elevated). The net position is a genuinely excellent business at a price that requires near-perfection for five consecutive years to generate positive returns from the current level. This is a rules-based research signal, not personalized investment advice; readers should conduct their own due diligence and consult a qualified financial adviser before making any investment decision.
This research was produced using the deep-market-research-harness on 2026-06-25. Figures are point-in-time as of the research date and subject to change. All forward scenario prices are illustrative estimates derived from stated assumptions and are not price targets. Nothing in this article constitutes investment advice or a recommendation to buy, sell, or hold AMAT or any other security.