
Research date: July 2, 2026 | OSINT market research on Royal Bank of Canada (NYSE: RY / TSX: RY.TO), Canada’s largest bank
Important disclaimer. This is OSINT-based research and educational analysis, not investment advice. I am not a financial advisor. Nothing here is a recommendation to buy or sell any security, and the scenarios below are illustrative, not price targets. Bank stocks carry credit, rate, and regulatory-capital risk that can move a share price fast, and RY carries an extra layer most US-listed peers do not: its earnings and dividend are declared in Canadian dollars while it trades on the NYSE in US dollars, so a US holder’s return depends on the exchange rate as well as the business. Market caps, prices, valuation multiples, and market-share figures are point-in-time (July 2, 2026), press-reported where noted, and move fast. Do your own due diligence and consult a licensed advisor.
One housekeeping note before anything else, because it matters more for this name than for a purely US-domiciled bank. Royal Bank of Canada trades under two tickers at once: RY on the NYSE, priced and quoted in US dollars, and RY.TO on the Toronto Stock Exchange, its primary home listing, priced in Canadian dollars. The bank’s underlying business, though, reports entirely in Canadian dollars. Every segment figure, every dividend declaration, and every provision-for-credit-losses number below is in Canadian dollars (marked C$) unless stated otherwise; the share price, market capitalization, and valuation multiples are in US dollars (marked $ or US$), matching the NYSE line this piece is written around. A US holder of the NYSE-listed shares is making two bets at once: one on RBC’s Canadian-dollar business, and one, entirely separate and unhedged unless you do it yourself, on where the Canadian dollar goes from here.
Where this stock could be in 6 months, 1 year, 3 years, and 5 years
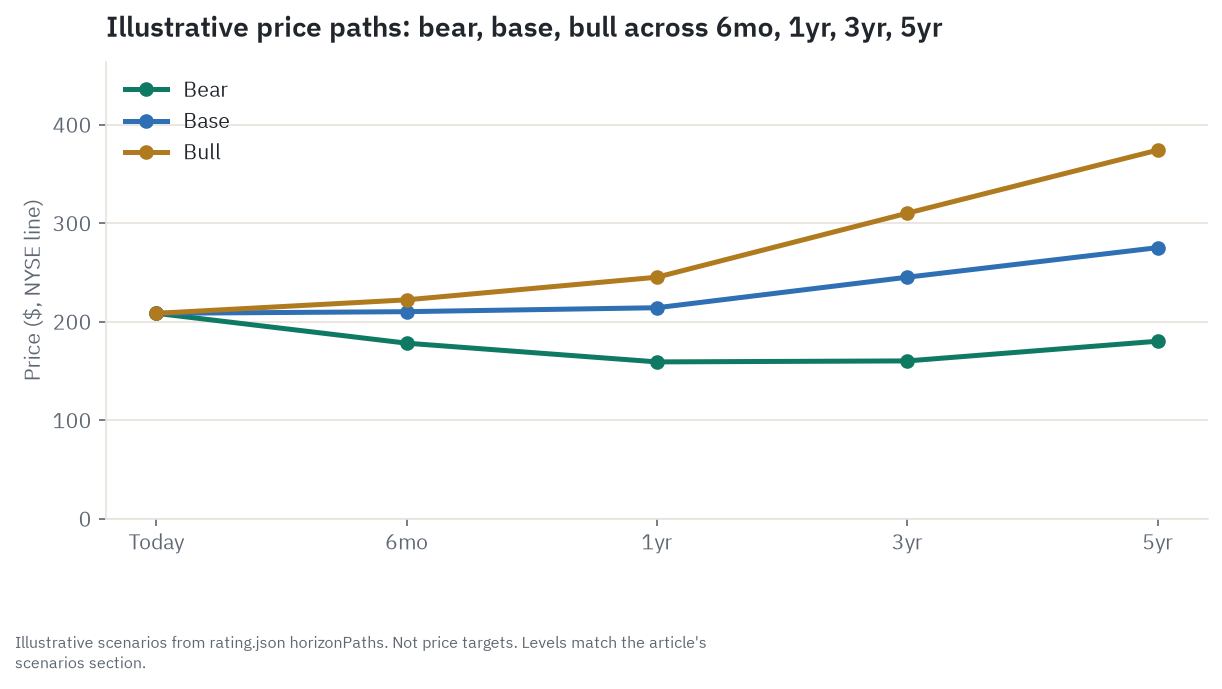
Six months. This window is decided by the next two data points: RY’s Q3 FY2026 earnings release, expected around late August 2026, and the Bank of Canada’s July 15, 2026 rate decision. The single most important line inside that earnings release is the provision for credit losses, which fell 36 percent year over year in the quarter just reported. That decline cannot repeat forever, and the first sign it is flattening, rather than continuing, is the thing most likely to move the stock in either direction over the next two quarters. The base case assumes one more solid, if decelerating, quarter and a Bank of Canada that holds rates again, landing around $210. A clean beat with no negative surprise on credit costs is the bull path, to about $222. The bear path, to about $178, is what happens if provisions stop falling and the market reads that as the expiration date on this quarter’s biggest tailwind.
One year. Over twelve months the dominant question is whether Canada’s credit cycle and the Bank of Canada’s rate path resolve toward the “gentler landing” that the current mortgage-renewal commentary assumes, or toward something closer to the two-sided trap the central bank itself is currently describing: weak domestic growth on one side, oil-driven inflation on the other, with no clean signal yet on which one wins. The base case, around $214, assumes an uneventful continuation of the current setup. The bull case, around $245, assumes the HSBC Canada integration finishes on schedule and City National’s turnaround keeps building with no fresh setback. The bear case, around $159, assumes the credit cycle actually turns while the stock is still trading near its richest-in-peer-group multiple, a double hit rather than a single one. Watch the pace of change in RY’s own credit-loss ratio and the tone of the Bank of Canada’s next two or three statements.
Three years. By this horizon, the structural drivers matter more than any single quarter’s credit-cost print. HSBC Canada’s committed synergies are supposed to be fully realized by management’s own fiscal year-end 2026 timeline, so the real question three years out is whether the combined franchise’s underlying growth (commercial-lending share gains, a growing Wealth Management fee base, a stabilized City National) is a durable, multi-year compounder or a one-time integration boost that has already faded. The base case, around $245, assumes a durable but unspectacular mid-single-digit earnings grower. The bull case, around $310, assumes the five-segment diversification story keeps proving out and the market pays up for it. The bear case, around $160, assumes a genuine cyclical trough has been reached and the multiple has settled at a lower, more ordinary-bank level. Watch Wealth Management’s asset trend and RY’s commercial-lending share numbers as the cleanest read on whether the structural case is real.
Five years. This is the durability question in full: does Canada’s five-bank oligopoly, protected by high regulatory capital floors that entrench the incumbents, keep compounding RY’s deposit-and-lending moat through an entire credit cycle, or does the mortgage-renewal wall or a stalled Bank of Canada produce a genuine multi-year credit-cost cycle, this time starting from a richer valuation than the last one? The base case, around $275 plus a dividend currently yielding roughly 2.2 to 2.3 percent, assumes the moat holds and growth settles into a mature-bank pace. The bull case, around $374, assumes the current breadth across all five segments becomes closer to the new normal. The bear case, around $180, assumes a real multi-year credit cycle plus a de-rating back toward peer-average multiples, a genuine drawdown but one cushioned by the dividend and by a capital ratio that, even in this scenario, stays well above the regulatory floor.
Where the read lands today. On balance, the five-factor read holds at Hold: this is a genuinely high-quality, well-capitalized franchise, but it is also the richest-multiple name in its own peer group at a moment when the research behind this piece shows the current growth rate is a cyclical, falling-credit-cost print rather than a repeatable structural one. The single thing most likely to flip that read, in either direction, is what RY’s own provision-for-credit-losses line does over the next two or three quarters.
Companion tool
Jump to the interactive dashboard to sort and filter RY against its Canadian and US bank peers, or download the Excel model to flex the scenarios yourself.
TL;DR
RY just posted a genuinely broad-based quarter: net income up 25 percent year over year with every one of its five segments growing, a record Capital Markets result, a 7 percent dividend hike, and a fresh buyback. The reason that headline deserves a second look is mechanical, not skeptical for its own sake: roughly a third of that growth traces to provisions for credit losses falling 36 percent year over year, a tailwind that has a mathematical floor and cannot repeat indefinitely, while management’s own forward guidance points to a far more modest mid-single-digit pace of net interest income growth from here. Underneath that cyclical print sit real structural assets, Canada’s largest deposit franchise now scaled up further by the HSBC Canada acquisition, a top-tier commercial-lending share, and a City National unit in the United States that is showing verified loan growth after a rough 2023 to 2024 stretch that included a federal enforcement action. What the market is being asked to pay for that combination is the richest multiple in the Canadian Big Five, at a price near its 52-week high, with sell-side price targets, across four independently sourced vendors, sitting modestly below the current quote even under a nominal Buy rating. Add a mortgage-renewal wall still working through Canada’s largest mortgage book, a Bank of Canada stuck between weak growth and elevated energy-driven inflation, and an unhedged Canadian-dollar-to-US-dollar translation layer for NYSE holders, and the picture is a strong business, not obviously mispriced, where the near-term story is more about whether the current cycle holds than about whether RY is executing well. It is.
Explore it yourself: the interactive dashboard
Open the dashboard in a full screen
What RY actually does
Royal Bank of Canada is not one business wearing a single label; it is five different businesses sharing one balance sheet, one brand, and one Toronto head office. Think of it less like a single factory and more like a shopping mall with five anchor stores under one roof, sharing the parking lot, the security staff, and the landlord’s balance sheet, but each running its own inventory and its own margins. RBC is Canada’s largest bank by both assets and market capitalization, ranks among the top 15 banks globally by market cap, and operates in 29 countries with more than 101,000 employees serving more than 19 million clients.
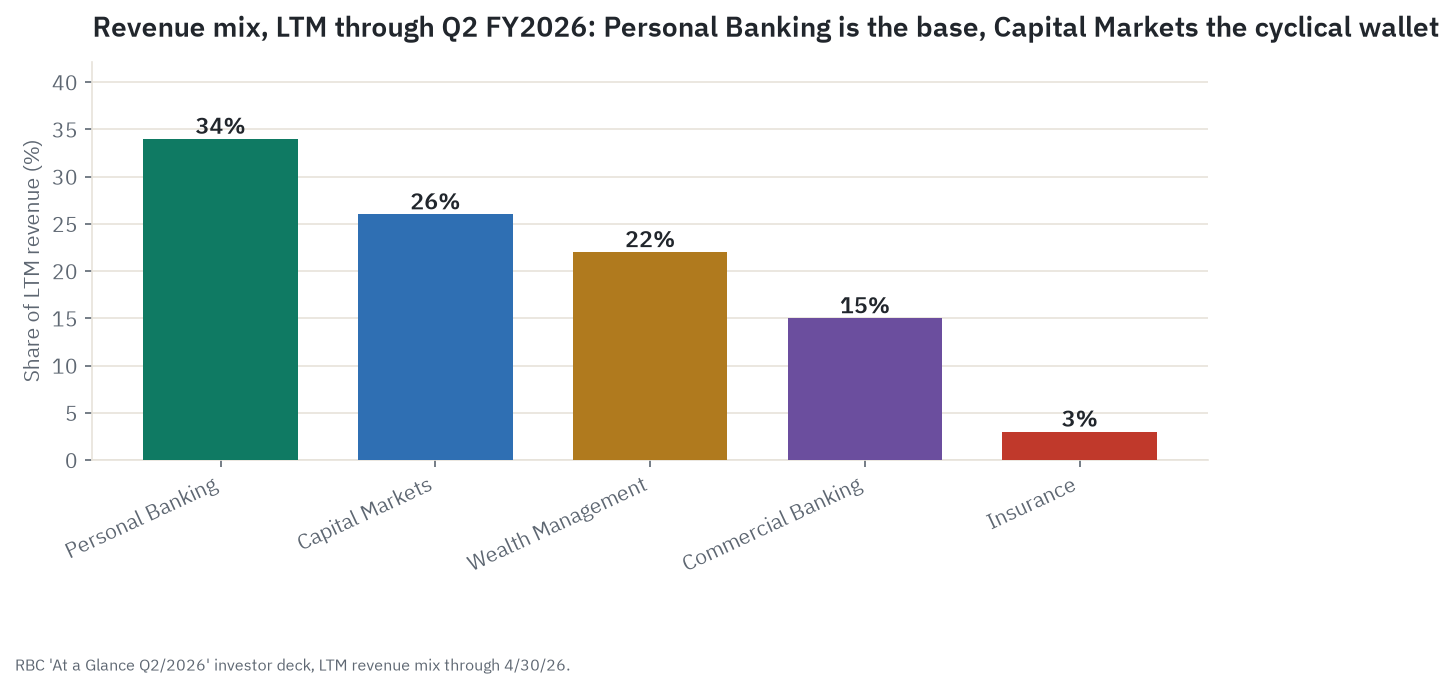
The five stores, in order of how much of the mall’s revenue they generate over the trailing twelve months through April 30, 2026: Personal Banking (34 percent of revenue) sells chequing and savings accounts, mortgages, credit cards, and personal loans to Canadian households, and posted C$1.870 billion of net income in the most recent quarter, up 17 percent year over year. Capital Markets (26 percent of revenue) advises on mergers, underwrites securities, and trades on behalf of corporate and institutional clients, and just posted a record C$1.484 billion of net income, up 23 percent. Wealth Management (22 percent of revenue) manages money for individuals and institutions and earns a recurring, asset-based fee, posting C$1.185 billion of net income, up 28 percent, the fastest growth rate of any segment, on assets under management of C$1,621 billion. Commercial Banking (15 percent of revenue) does the same deposit-and-lending job as Personal Banking but for Canadian businesses, and posted C$854 million of net income, up 43 percent, the single largest percentage move of any segment this quarter. Insurance (3 percent of revenue) underwrites life, health, home, and auto policies, an entirely different, actuarially priced business from the other four, and posted C$218 million of net income, up 3 percent, the smallest and steadiest of the five. Geographically, 63 percent of revenue is Canadian, 26 percent American (largely City National Bank and the US arm of Wealth Management), and 11 percent international.
RBC’s position inside each of these five businesses is not merely large, it is close to dominant. Per RBC’s own investor materials, it won 10 of 11 categories in the 2025 Ipsos Financial Service Excellence Awards as Canada’s leading retail bank, holds the largest lending and deposit balances among the six biggest Canadian banks in Commercial Banking, is Canada’s number-one retail mutual fund company and holds the largest share of the high-net-worth wealth market, is Canada’s largest bank-owned life insurer with roughly 4.9 million clients, and ranks 10th globally among investment banks by fees per Dealogic’s league tables. That breadth of number-one or near-number-one positions across five genuinely different businesses is the core of the moat argument for this stock, and it did not happen by accident: Canada’s six largest banks, RBC among them, are designated Domestic Systemically Important Banks by the Office of the Superintendent of Financial Institutions, which imposes a capital surcharge and a minimum Common Equity Tier 1 ratio target of at least 11.5 percent. That is a real, structural barrier to entry, not a marketing claim; it is expensive and slow for a new entrant to meet the same regulatory bar RBC already clears with room to spare.
How the money flows
flowchart TD
    DEP["Deposits: personal, business, institutional + ex-HSBC Canada book"]
    DEP --> FUND["Funding base (cheapest input; HSBC Canada added ~780K customers)"]

    FUND --> PB["Personal Banking: $1.87B net income Q2'26 (+17% YoY)"]
    FUND --> CB["Commercial Banking: $854M net income Q2'26 (+43% YoY)"]
    FUND --> CM["Capital Markets: $1.484B net income Q2'26 (+23% YoY, record)"]

    PB --> NII["Net interest income (NIM 1.58%, +3bps QoQ)"]
    CB --> NII
    CM --> FEES["Advisory/underwriting/trading fees"]

    WM["Wealth Management: $1.185B net income Q2'26 (+28% YoY)"]
    INS["Insurance: $218M net income Q2'26 (+3% YoY)"]

    NII --> REV["Total revenue: $17.45B Q2 FY2026"]
    FEES --> REV
    WM --> REV
    INS --> REV

    REV --> PCL["Provision for credit losses: $912M (-36% YoY, 35bps ratio)"]
    REV --> OPEX["Operating expenses"]
    PCL --> NETINC["Net income: $5.5B Q2'26 (+25% YoY), ROE 17.2%"]
    OPEX --> NETINC

    NETINC --> CAP["Capital layer: CET1 13.5% (OSFI D-SIB buffer caps payout)"]
    CAP --> DIV["Dividend: $1.76/share/qtr (+7%)"]
    CAP --> BUYBACK["Buyback: up to 45M shares (~3% of float)"]
    CAP --> RETAIN["Retained capital / reinvestment"]
Follow the chain top to bottom and the shape of the business becomes clear. It starts with deposits, the cheapest funding a bank can get, cheaper than borrowing in wholesale markets, and RBC’s scale as Canada’s largest deposit-taker, reinforced by the roughly 780,000 retail customers it added when it closed its purchase of HSBC Bank Canada in March 2024, is the first and most durable toll booth in the whole chain. That funding base then splits three ways: into Personal and Commercial lending, where the spread between what RBC pays depositors and what it charges borrowers (the net interest margin, 1.58 percent in the most recent quarter) is the revenue engine; into Capital Markets, an entirely different, fee-and-trading business that rises and falls with deal volume rather than with the steadier deposit-and-loan cycle; and, running in parallel rather than through the funding base at all, into Wealth Management’s recurring asset-based fees and Insurance’s underwriting premiums.
Everything that survives funding costs, credit losses, and operating expenses then hits the chain’s real chokepoint: the regulatory capital layer. As a Domestic Systemically Important Bank, RBC must hold a minimum level of capital set by its regulator, and its Common Equity Tier 1 ratio of 13.5 percent, down slightly quarter over quarter as buybacks and loan growth outpaced internal capital generation, is the hard ceiling on how much of everything upstream can actually reach shareholders. What clears that ceiling gets split between reinvestment and capital return, and in the most recent quarter RBC returned C$4.0 billion to shareholders, C$1.7 billion in buybacks and C$2.3 billion in dividends, while raising the quarterly dividend to C$1.76 per share.
The shape that matters for an investor is this: four of the five stores in the mall (Personal, Commercial, Wealth, Insurance) generate relatively steady, relationship-based revenue that renews without a new sale each quarter, while the fifth (Capital Markets) is genuinely lumpy and cyclical by nature. The current quarter’s strength comes from all five running well simultaneously, which is unusual and, by its own nature, unlikely to be permanent.
Who wins where
The Canadian banking market is one of the most concentrated in the developed world: five banks, plus National Bank of Canada as a smaller sixth, dominate a market that in the United States is fragmented across thousands of banks and credit unions. That concentration is the single biggest structural fact about this business. Within that oligopoly, RBC and Toronto-Dominion Bank are the two clear scale leaders, both with market capitalizations well above the other three; Bank of Montreal has shown the sharpest year-over-year improvement in profitability this cycle, working off a lower starting base after its 2023 Bank of the West acquisition; Bank of Nova Scotia is rebuilding its historically lower return on equity after a multi-year strategic reset away from some of its international exposure; and Canadian Imperial Bank of Commerce, the smallest of the five by scale, posted the single highest return on equity of the group this quarter despite being the only one of the six major Canadian banks not to raise its dividend alongside earnings.
Outside Canada’s borders, the comparison shifts. RBC’s roughly $287 to $290 billion market capitalization is a fraction of JPMorgan Chase’s roughly $879 billion or Bank of America’s roughly $411 billion, a reminder that even Canada’s largest, most dominant bank operates at a meaningfully smaller absolute scale than the largest US universal banks. RBC Capital Markets competes directly against both its four Canadian peers and the US bulge-bracket firms for cross-border and US-domiciled deal flow, and its edge there is balance-sheet scale and Canada-US corridor relationships, not a cost advantage over larger, better-capitalized American rivals. Digital-only challengers such as Wealthsimple and EQ Bank are growing quickly, both now carrying tens of billions of Canadian dollars in assets, but industry observers view them as more likely acquisition targets for the Big Five than genuine disruptors, given how much branch infrastructure and regulatory scale still matters in this business.
Company by company: who’s who
Royal Bank of Canada (NYSE: RY / TSX: RY.TO). Canada’s largest bank by both assets and market capitalization, roughly $287 to $290 billion USD as of early July 2026. Q2 FY2026 (quarter ended April 30, 2026): net income C$5.5 billion, up 25 percent year over year; diluted earnings per share C$3.85, up 27 percent; return on equity 17.2 percent; a record Capital Markets net income of C$1.484 billion; a Common Equity Tier 1 ratio of 13.5 percent; and a dividend raised 7 percent to C$1.76 per share, with provisions for credit losses down 36 percent year over year to C$912 million. Bull: unmatched scale, a top-tier deposit franchise, HSBC Canada integration synergies still landing, and falling credit provisions in a Bank of Canada easing cycle. Bear: still concentrated in a slowing, rate-sensitive Canadian economy with a real, if now milder, mortgage renewal wall, and Capital Markets strength is inherently cyclical; RY also trades at the richest multiple of any of its Canadian peers.
Toronto-Dominion Bank (TD). Canada’s second-largest bank by market cap, roughly $197 to $202 billion, with the largest US retail branch footprint of any Canadian bank through TD Bank, America’s Most Convenient Bank. Q2 FY2026: adjusted earnings C$4.2 billion, up 15 percent; adjusted earnings per share C$2.38 (US$2.76), up 21 percent; return on equity 14.4 percent; a fourth consecutive quarter of positive operating leverage. Bull: the largest cross-border retail footprint of the Canadian banks, with its US business finally regaining momentum. Bear: a Fed-imposed asset cap and an ongoing anti-money-laundering remediation program dating to 2024 to 2025 remain a credibility and growth-ceiling issue relative to peers who never had one.
Bank of Montreal (BMO). Canada’s third or fourth largest bank by market cap, roughly $122 to $125 billion, with a large US Midwest footprint built out through its 2023 Bank of the West acquisition. Q2 FY2026: adjusted earnings per share $3.67, up 40 percent, the sharpest year-over-year improvement of the peer group; record net income of C$2.7 billion; return on equity 13.5 percent, up 370 basis points. Bull: the sharpest earnings and ROE improvement in the Canadian peer group as its US integration matures. Bear: still working from a lower ROE base than RY or TD and carrying US commercial real estate and integration risk.
Bank of Nova Scotia (BNS, Scotiabank). Roughly $106 billion market cap, the most internationally diversified of the Big Five, concentrated in Mexico, Peru, Chile, and Colombia. Q2 FY2026: net income C$2,632 million versus C$2,032 million a year earlier; diluted earnings per share C$2.00 versus C$1.48; return on equity 13.1 percent, up from 10.1 percent; Canadian Banking earnings up 53 percent. Bull: the clearest year-over-year turnaround of the group, off a depressed prior-year base. Bear: Latin American exposure remains the most geopolitically and currency-volatile earnings stream in the group, and its historical ROE has lagged RY, TD, and CIBC for years.
Canadian Imperial Bank of Commerce (CIBC, ticker CM). The smallest of the Big Five by market cap, roughly $104 to $106 billion. Q2 FY2026: revenue C$8,006 million, up 14 percent; net income C$2,465 million, up 23 percent; adjusted diluted earnings per share C$2.54, up 24 percent; return on equity 16.4 percent, up 250 basis points, the highest single-quarter ROE in the peer group. Bull: the smallest, most nimble of the Big Five with ROE now competitive with or ahead of larger peers. Bear: less scale and international diversification than RY, TD, or BNS to absorb a Canadian-specific downturn, and it was the only one of the six major Canadian banks not to raise its dividend this quarter.
JPMorgan Chase (JPM). Included here for scale context, not as a direct Canadian-bank peer. The largest US bank by assets, roughly $879 billion market cap, spanning consumer banking, commercial banking, a top global investment bank, and asset and wealth management. Bull: unmatched scale and diversification across every banking business line in the world’s largest capital market. Bear: the heaviest regulatory and systemic-risk scrutiny of any North American bank, and sheer size caps its percentage growth rate against smaller peers like RY.
Bank of America (BAC). Also scale context rather than a direct peer. The second-largest US bank by assets, roughly $411 billion market cap, spanning consumer banking, Merrill Lynch wealth management, and a global banking and markets arm. Bull: a re-accelerating trading and investment-banking business alongside strong net interest income sensitivity. Bear: more consumer-credit- and rate-sensitive than pure wealth or investment-banking peers, so results lean heavily on the Fed’s path and US consumer health.
What the filings say
RBC’s fiscal year ends October 31, and as a Canadian foreign private issuer it does not file a 10-K or 10-Q with the SEC; instead it files an annual Form 40-F and furnishes quarterly Form 6-K current reports containing its earnings release and investor presentation. Everything below traces to the Q2 FY2026 Form 6-K, furnished around May 28, 2026 for the quarter ended April 30, 2026, and to the FY2025 Form 40-F for the year ended October 31, 2025, both independently re-pulled and re-checked against their own primary text for this piece, not taken on faith from a summary.
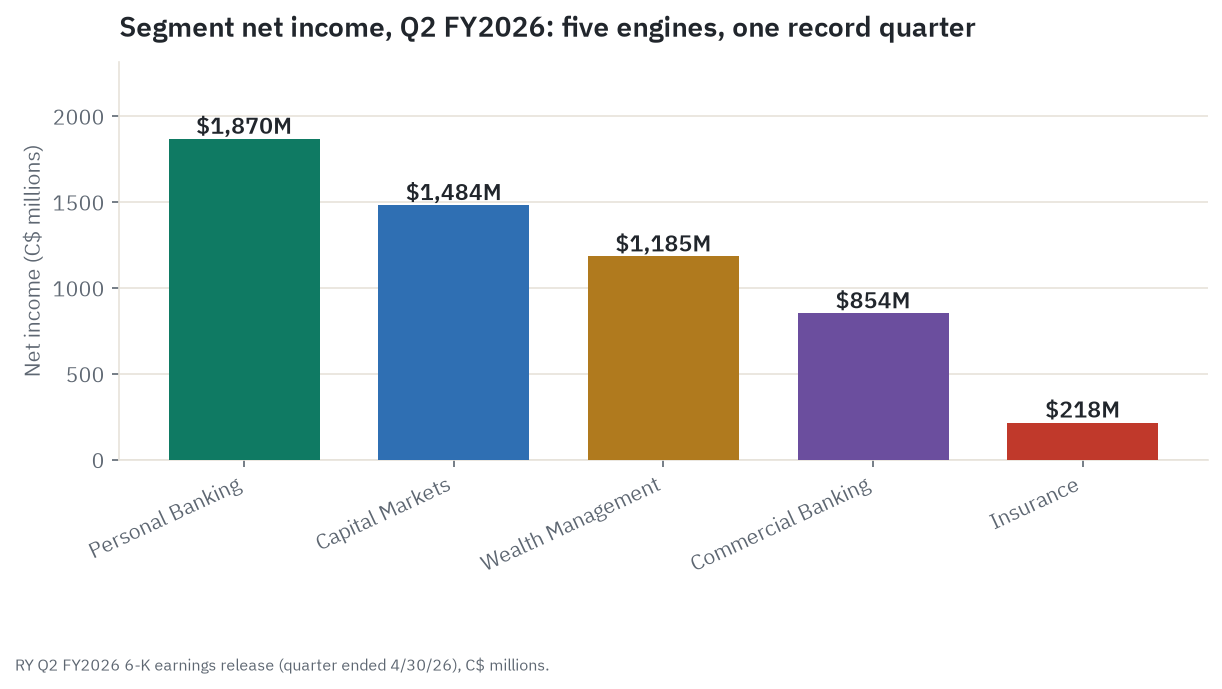
The quarter itself. Total revenue was C$17.453 billion. Net income was C$5.5 billion, up 25 percent year over year and down 5 percent from the prior quarter. Diluted earnings per share were C$3.85, up 27 percent year over year. Return on equity was 17.2 percent, up 300 basis points from a year earlier though down 40 basis points from the prior quarter. Pre-provision, pre-tax earnings were C$8.0 billion, up 15 percent year over year. Every one of these figures was independently confirmed in this pass directly against RBC’s own primary Report to Shareholders text, not merely a press release summary of it.
The full fiscal year behind it. Fiscal 2025 (the year ended October 31, 2025) net income was C$20.4 billion, up C$4.1 billion, or 25 percent, from fiscal 2024, on revenue exceeding C$66 billion, with management attributing the growth to gains across all business segments. A word of caution here: some secondary coverage of RBC’s year-end results conflates a single quarter’s segment breakdown with the full year’s figures, and this research could not cleanly extract a clean, full-fiscal-year segment table from the primary 40-F in the time available. Treat the Q2 FY2026 segment table above as the reliable, single-quarter reference point rather than any full-year segment breakdown you might see quoted elsewhere.
Credit quality. The provision for credit losses was C$912 million in the quarter, down 36 percent year over year and 16 percent from the prior quarter, with a provision-on-loans ratio of 35 basis points, down 23 basis points year over year. The total allowance for credit losses on the balance sheet stood at C$7.8 billion. RBC’s own chief risk officer has said provisions are expected to stay elevated for several quarters given trade-tension uncertainty, a caution worth taking at face value even as the headline trend has been improving. Net interest margin was 1.58 percent, up 3 basis points from the prior quarter; a separate data aggregator publishes a different “bank-only” net interest margin of 1.73 percent, which most likely reflects a different asset base or calculation window rather than a genuine contradiction, and the two figures should not be read as disagreeing about the same thing.
Capital and capital return. The Common Equity Tier 1 ratio was 13.5 percent at quarter end, down 20 basis points from the prior quarter as buybacks and business-driven growth in risk-weighted assets outpaced internal capital generation, still comfortably above the roughly 11.5 percent regulatory target for a Domestic Systemically Important Bank, though the exact Domestic Stability Buffer RBC is held to above that floor was not separately disclosed in the materials reviewed for this piece. RBC returned C$4.0 billion to shareholders in the quarter alone, C$1.7 billion in share buybacks and C$2.3 billion in dividends, and raised its quarterly dividend to C$1.76 per share, an increase of C$0.12, or 7 percent, alongside a new authorization to repurchase up to 45 million shares, roughly 3 percent of shares outstanding. The dividend payout ratio was 42 percent, inside management’s stated 40 to 50 percent target range, leaving room for further increases without a change in policy.
The HSBC Canada integration. RBC closed its C$13.5 billion acquisition of HSBC Bank Canada in March 2024 from parent HSBC Holdings, the London- and Hong Kong-anchored global bank that exited the Canadian market as part of its own broader pivot toward Asia wealth management, the largest bank acquisition in Canadian history, adding roughly 130 branches and about 780,000 retail customers, along with a committed target of roughly C$740 million in annual pre-tax cost synergies and C$300 million in revenue synergies. As of an early-2025 update, RBC had realized roughly 70 percent of the cost-synergy target, with personal-banking integration described as ahead of plan and more than 90 percent of acquired HSBC mortgage customers also holding a core RBC chequing account, a strong signal of successful cross-sell. Management has reiterated that the revenue-synergy target remains on track for full realization by fiscal year-end 2026, though notably, the Q2 FY2026 release itself did not include a fresh, quantified dollar update on that progress, a gap between the confident qualitative narrative in press coverage and what the most recent primary filing actually discloses. On the Q2 FY2026 earnings call, management also flagged more than C$250 million of declining purchase-price-accounting benefits tied to the deal as those benefits amortize down, a real headwind to net interest income growth that should be modeled in even as the deal remains accretive overall.
City National Bank, the US arm. RBC’s US private and commercial banking subsidiary had a genuinely rough 2023 to 2024 stretch: rate-driven securities losses, a US$65 million fine from the Office of the Comptroller of the Currency in February 2024 over what regulators characterized as systemic deficiencies in risk-management practices, a cease-and-desist order, and a capital infusion from the Canadian parent that press reporting has put at several billion dollars, though this research could not independently confirm the precise figure and treats it as unverified color rather than a firm number. What is independently verified for the most recent quarter is more specific and more modest than some press coverage has implied: RBC’s own Q2 FY2026 earnings call confirms City National’s loan book grew 9 percent year over year in US dollars, a real and encouraging data point, though a specific current-quarter profitability figure for the unit could not be traced to a primary RBC disclosure in this research (City National’s results are folded into the broader “US Wealth Management including City National” segment line, not broken out separately). Treat City National as a turnaround in progress, not a fixed problem.
Ownership. Per aggregator data independently re-checked in this pass, RBC is roughly 44 to 48 percent institutionally owned and under 1 percent insider-owned, with the balance, roughly 52 to 56 percent, held by retail and individual investors, a notably higher retail ownership share than is typical for a bank of RBC’s size, consistent with its status as a widely held Canadian household dividend stock.
What the market is paying
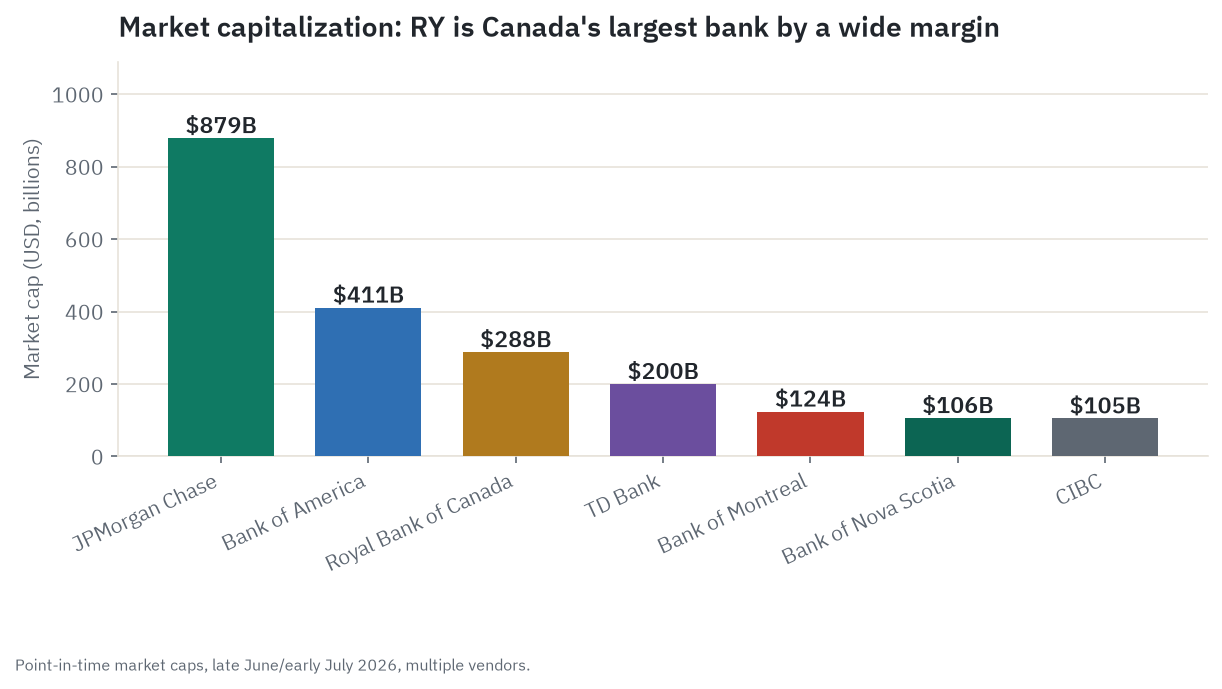
RY closed the NYSE session on July 1, 2026 at $208.31, sitting at or very near its 52-week high of $209.37 (the 52-week low was $127.38). At that price the market capitalization works out to roughly $287 to $290 billion, comfortably the largest of the five major Canadian banks: about 1.4 times Toronto-Dominion, 2.3 times Bank of Montreal, and roughly 2.7 times both Bank of Nova Scotia and CIBC. Against the two US money-center comparators included here for scale, RY sits well below JPMorgan Chase’s roughly $879 billion and modestly below Bank of America’s roughly $411 billion.
On the multiples that matter for a bank, RY is not cheap. Trailing earnings sit around 18 times (an independent re-pull in this research reconciled an earlier 16.25-to-18.52-times discrepancy toward the higher end), against a sector average that one source pegs closer to 20 times. Price to book runs somewhere between roughly 2.4 and 2.8 times depending on the exact date pulled, itself a live illustration of how fast these figures move: two pulls taken hours apart during this research produced two different numbers, both correct for their moment. The dividend yield sits around 2.2 to 2.3 percent. Beta, independently confirmed across two separate data vendors in this research, runs around 0.9 to 0.94, meaningfully below 1.0 and notably lower than the roughly 1.2 beta typical of a US capital-markets-heavy bank, consistent with RY’s larger, steadier deposit-and-lending base relative to its smaller (though growing) capital-markets wallet.
The sell side rates RY a consensus Buy across roughly 15 covering analysts, but the average price target tells a more cautious story. Across four independently sourced vendors and two currencies, three Canadian-dollar-denominated targets averaging roughly C$261 to C$272 and a separate US-dollar-denominated target of $190.48, every single one sits below the price it was measured against, implying downside in the range of roughly 6 to 7 percent from current levels. That is not a screaming sell signal, and the nominal rating label has not flipped to Hold across any of these sources, but it is a consistent, cross-vendor, cross-currency signal that the sell side, in aggregate, sees RY as close to fully valued rather than cheap, even after a strong quarter.
What the crowd is saying
The dominant story in financial media coverage of RY through late May and June 2026 has been an unambiguous earnings beat, with “record” and “beat consensus” language running across coverage of the Q2 FY2026 results, layered on top of a slower-burn narrative about the HSBC Canada integration and a live debate about whether Canadian bank valuations have already priced in the good news. Every one of RY’s five segments grew earnings year over year this quarter, an unusually broad beat; most quarters at most large banks show at least one soft segment, and this one did not.
RY is not a meme stock or a high-social-attention name the way a volatile growth stock can be, but it carries unusually high genuine retail ownership for a bank of its size, consistent with its status as a core, widely held Canadian dividend name, held directly inside individual portfolios, RRSPs, and TFSAs, as much as an institutional holding. No coordinated bullish or bearish social campaign was identified in the sources reviewed for this research, and the discussion that does exist skews toward dividend-investor and Canadian-market commentary rather than momentum trading chatter, consistent with that ownership base. It is worth flagging honestly that this research did not directly query social platforms such as Reddit, StockTwits, or X for RY-specific chatter volume or sentiment, so the retail-sentiment read here is inferred from ownership structure and general coverage tone rather than measured directly; treat it as the softest-sourced part of this piece.
The most useful signal is where the crowd’s story and the underlying numbers start to pull apart. The crowd’s story is straightforward: RBC is Canada’s blue-chip bank compounder, with scale, the largest deposit franchise, a completed transformational acquisition, and an earnings base now firing on every cylinder simultaneously. That story is real and well supported by the fundamentals; this is not a case of hidden weakness. But two genuine tensions sit underneath it. First, credit provisions have already fallen 36 percent year over year, and there is a mathematical limit to how much further that particular tailwind can keep contributing to earnings growth; if credit quality merely stabilizes rather than continuing to improve, reported growth has to come from revenue alone, a materially higher bar. Second, the Bank of Canada’s own language in June 2026, describing economic activity in Canada as “weak” and the economy as likely to remain “in excess supply” even after an expected rebound, sits in real tension with RY’s “record quarter, every segment up” narrative. A bank’s trailing results are typically a lagging indicator of household and business credit stress, not a leading one, and the central bank’s own forward-looking caution has not yet been fully absorbed into a stock trading near its highs. Neither of these is a red flag by itself. Both are timing and durability questions a reader should weigh honestly rather than a reason to distrust the headline numbers, which are genuine.
Why the record quarter deserves a second look
The physical analogy that fits here is a car engine running at redline on every cylinder at once. It is genuinely impressive, and it is not something you should expect to sustain indefinitely without something eventually giving. RBC’s Q2 FY2026 print has five cylinders firing simultaneously: falling credit costs, a record capital-markets quarter, a fast-growing wealth business riding strong markets, a still-accretive acquisition, and resumed capital return. Every one of those five, examined individually, is a genuinely favorable but explicitly cyclical or time-limited condition rather than a permanent re-rating of RBC’s underlying earnings power.
Start with the credit-cost tailwind, the single largest driver of this quarter’s headline growth. Commercial Banking’s 43 percent year-over-year net income growth, the largest percentage move of any segment, is a textbook example: revenue grew only modestly, but provisions for credit losses fell sharply, so nearly the entire earnings improvement flowed through from lower credit costs rather than from a bigger loan book or wider margins. That is not a criticism of RBC’s underwriting; it is simply arithmetic that cannot repeat at the same pace once provisions stop falling, which they mathematically must at some point.
Then there is Capital Markets, which posted a record quarter riding a genuinely strong global dealmaking and trading environment in 2025 and 2026. By its nature, this business is lumpy: it depends on deal volume, issuance windows, and market volatility that RBC does not control and cannot smooth. A record quarter, definitionally, is not a new steady state.
Wealth Management’s 28 percent growth, the fastest of any segment, is driven substantially by strong equity and bond markets lifting the value of assets under management, on which RBC earns a fee, mechanically, without additional selling effort. If markets pull back, that fee base pulls back with them, independent of anything RBC does operationally.
HSBC Canada’s integration synergies are, by management’s own description, a finite, largely one-time uplift, targeted for full realization by fiscal year-end 2026, after which the purchase-price-accounting benefit that has been supporting net interest income starts to roll off, a headwind management has already flagged explicitly.
And City National’s turnaround, while genuinely encouraging in its verified loan-growth figures, follows a period serious enough to have required a federal enforcement action and a capital infusion from the parent; a single quarter or two of improving numbers is evidence of progress, not proof the unit is fully de-risked.
None of this means RBC’s underlying earnings power has not genuinely strengthened. Canada’s largest deposit franchise, now larger still after the HSBC Canada deal, generating record capital-markets and wealth revenue in a favorable cycle, is a real and valuable thing to own. The distinction that matters for an investor is between the earnings level, which looks solid and durable, and the earnings growth rate, which this quarter’s own drivers suggest is unlikely to repeat at anything close to 25 percent once credit costs stabilize and capital markets normalize.
The scenarios in detail
The driver tree. Four variables decide where RY actually goes from here. First, the Canadian credit cycle, specifically whether provisions for credit losses keep falling (mathematically impossible forever), merely stabilize, or reverse as the mortgage renewal wall, roughly 60 percent of outstanding Canadian mortgages renewing in 2025 or 2026, works through RY’s largest-in-Canada mortgage book. Second, the Bank of Canada’s rate path: either a cut (which compresses net interest margin) or a prolonged hold through continued weak growth (which prolongs credit-quality pressure) works against the bull case; only a clean soft landing is unambiguously favorable. Third, the cyclical wallet, Capital Markets and Wealth Management, both currently posting record results that this research’s own economic analysis concludes are a favorable-cycle print, not a new run rate. Fourth, execution on the two open integration stories, HSBC Canada’s synergy realization and City National’s US turnaround. A fifth factor sits alongside these but does not drive RY’s intrinsic value: the Canadian dollar to US dollar exchange rate, which mechanically scales the US-dollar value of RY’s Canadian-dollar earnings and dividend for the NYSE-line holder this piece is written for, independent of anything RY itself does.
Bull case. Credit provisions stabilize at a genuinely low, structural level rather than merely bottoming and reversing. The Bank of Canada achieves a clean soft landing, growth reaccelerating and inflation cooling with only gentle further rate moves if any. HSBC Canada’s revenue-synergy target is fully realized on schedule and continues compounding past 2026. City National completes its turnaround into a genuine, durable US growth contributor rather than a break-even remediation project. Capital Markets and Wealth Management both sustain, not merely repeat but continue growing from, their current record levels as global capital markets stay open. Under these assumptions, earnings-per-share growth stays in the low double digits for several years before normalizing to high single digits, well above management’s own mid-single-digit guidance, and the market’s exit multiple re-rates gradually toward the roughly 20 times level cited elsewhere as this sector’s average. That combination points to a share price estimate, illustrative only, around $374 in five years, plus a growing dividend. What breaks this case: any real-sized turn in the Canadian credit cycle, since RY’s structural advantages are genuine but do not exempt it from the underlying household and business credit cycle the way a pure fee business would be.
Base case. The current cyclical tailwinds, falling provisions, a record Capital Markets quarter, strong wealth markets, fade toward a mid-single-digit run rate roughly matching management’s own guidance. The mortgage renewal wall proves genuinely milder than earlier forecasts feared, as currently characterized, without a fresh credit-quality deterioration. HSBC Canada synergies land close to plan, City National continues its loan-growth trend without a fresh setback, and the Bank of Canada muddles through with occasional holds and gentle cuts rather than a clean soft landing or a renewed tightening cycle. RY’s valuation multiple holds roughly where it sits today, around 18 times, neither re-rating up nor down. Under these assumptions, earnings-per-share growth decelerates from today’s cycle-favorable pace toward roughly 6 to 8 percent annually, pointing to an illustrative share price estimate around $275 in five years, plus dividends. What would move this either direction: a genuine credit-cycle reversal (down) or a durable re-rating as a “best-in-class compounder” gains wider market acceptance (up).
Bear case, anchored on the strongest disconfirming evidence found in this research. Provisions for credit losses stop falling and begin rising again as the mortgage renewal wall bites harder than the “gentler than feared” framing currently assumes, compounded by a Bank of Canada that cannot cleanly resolve its current two-sided position, either cutting into margin compression or holding through continued weak growth and prolonged credit stress. Capital Markets and Wealth Management both normalize down sharply off their record base as the global capital-markets cycle turns. City National’s turnaround stalls or reverses, reopening the US-execution-risk question this research could not fully close given the lack of a verified current-quarter profitability figure for the unit. RY’s currently richest-in-peer-group multiple compresses toward a more typical bank level as the market re-prices the “everything firing at once” narrative. Under these assumptions, earnings actually decline in year one before a slow, multi-year recovery to modest single-digit growth by year five, and the exit multiple de-rates toward roughly 14 to 15 times. That points to an illustrative share price estimate around $180 in five years, a real, multi-year drawdown from today’s price but one cushioned by RY’s dividend and by a capital ratio, 13.5 percent Common Equity Tier 1 against a roughly 11.5 percent regulatory floor, that does not, even in this scenario, point toward distress serious enough to threaten the dividend itself. What has to be true for this case: a genuine, multi-quarter reversal in Canadian credit quality, not merely a flattening of the current improving trend.
Catalysts and timeline. In the near term: the Bank of Canada’s July 15, 2026 rate decision; RY’s Q3 FY2026 earnings release, expected around late August 2026; and Q4 FY2026 and fiscal year-end results around late November 2026 (RBC’s fiscal year ends October 31), including any quantified update on HSBC Canada revenue-synergy realization, which the Q2 FY2026 release itself did not provide. Over a longer horizon: HSBC Canada’s synergies fully realized on management’s own fiscal year-end 2026 timeline, after which the fading purchase-price-accounting benefit becomes a real, flagged headwind; the resolution of the current mortgage renewal wave through 2025 and 2026; and however the Bank of Canada’s current weak-growth-versus-energy-inflation tension ultimately resolves over the next one to two years.
Leading indicators to watch. RY’s own provision-for-credit-losses ratio, quarter over quarter, is the single clearest, most directly RY-specific signal of whether the credit-cost tailwind is flattening or reversing. The Bank of Canada’s rate decisions and statement language, specifically whether “weak economic activity” language persists, worsens, or gives way to more confident growth language. The benchmark or House Price Index measure of Canadian home prices, not the simpler national average sale price, which is more sensitive to the mix of homes sold in a given month; the benchmark measure showed a 4.1 percent year-over-year decline as of May 2026, the more methodologically reliable signal to track. Any quantified HSBC Canada synergy-realization update in RY’s upcoming quarterly releases. City National’s disclosed loan growth and, if RBC ever breaks it out, a standalone profitability figure. RBC Capital Markets’ net income relative to Personal and Commercial Banking, since a widening gap would signal RY’s earnings mix tilting toward its more cyclical, less Canada-specific segment. And, for any US-based holder, the Canadian dollar to US dollar exchange rate itself, independent of anything RY’s underlying business does.
Companies to watch (bull / base / bear)
Royal Bank of Canada (RY). Role: the primary name, Canada’s largest bank and the richest multiple in its peer group. Bull: the deposit and lending moat, HSBC Canada synergies still landing, City National’s verified loan-growth turnaround. Base: current tailwinds fade toward management’s own mid-single-digit guidance, multiple holds flat. Bear: a genuine, multi-quarter reversal in Canadian credit quality lands while the stock still carries its richest-in-peer-group multiple, a double hit. Watch: the PCL-on-loans ratio, quarter over quarter.
Toronto-Dominion Bank (TD). Role: the closest scale peer, with the largest US retail footprint of the group. Bull: US momentum finally regaining pace post-remediation. Base: steady Canadian and US results continue at a moderate pace. Bear: the Fed-imposed US asset cap and anti-money-laundering consent order remain an overhang on growth and credibility. Watch: any update on when the US asset cap might lift.
Bank of Montreal (BMO). Role: the sharpest year-over-year improver in the group this cycle. Bull: Bank of the West integration completes and US-division ROE closes toward its 12 percent-by-2028 target, up from 8.6 percent currently. Base: continued gradual ROE improvement off a lower base. Bear: US commercial real estate exposure and integration costs weigh longer than expected. Watch: BMO’s US-segment ROE trajectory specifically.
Bank of Nova Scotia (BNS). Role: the international diversification play and the clearest turnaround story this quarter. Bull: Canadian Banking’s 53 percent earnings jump this quarter continues, and the post-reset international footprint stabilizes. Base: gradual ROE improvement toward its stated 14 percent 2027 target. Bear: the 53 percent jump is coming off an unusually depressed prior-year base and Latin American currency and political volatility resurfaces. Watch: whether Canadian Banking’s growth rate normalizes toward a more typical pace.
Canadian Imperial Bank of Commerce (CM). Role: the smallest, most nimble Big Five name, with the highest single-quarter ROE this cycle. Bull: continued ROE outperformance relative to its smaller scale. Base: steady mid-teens ROE with modest growth. Bear: less scale and diversification to absorb a Canadian-specific downturn, and it was the only major Canadian bank not to raise its dividend this quarter, worth watching as a possible signal of relatively more cautious management confidence. Watch: whether CIBC resumes dividend growth in coming quarters.
Risk controls
RY’s risks cluster into four honest categories, and a reader should size a position, if any, against all four rather than any single one in isolation. The first is cyclicality: this quarter’s 25 percent net-income growth leans heavily on a falling-credit-cost tailwind that cannot repeat indefinitely and a record capital-markets quarter that is, by definition, not a new steady state. The second is concentration: RY is close to a levered bet on the entire Canadian economy, and specifically on Canadian housing through its largest-in-market mortgage book, with the mortgage renewal wall still working through the system in 2025 and 2026. The third is valuation after a run: the stock trades near its 52-week high at the richest multiple among its Canadian peers, with sell-side consensus targets sitting modestly below the current price across every vendor checked in this research, meaning there is real room for a multiple compression even without any operational stumble. The fourth is access and currency: a US holder buying the NYSE line takes on an unhedged Canadian-dollar exposure on top of the equity risk, a factor that simply does not exist for a purely US-domiciled peer.
What would meaningfully change this thesis: a confirmed, multi-quarter reversal, not merely a flattening, in RY’s own credit-loss ratio would be the clearest signal the bear case is playing out. A Bank of Canada pivot to renewed rate cuts specifically because of deteriorating growth, rather than a stable hold, would flag margin-compression risk directly. A confirmed current-quarter loss or fresh regulatory action at City National would reopen the US-execution-risk question this research could not fully close. Conversely, two or three consecutive quarters of stabilizing, not merely falling, provisions alongside continued segment breadth, with no credit-quality deterioration, would support the bull case gaining ground over the base case described above.
Methodology, sourcing, and data-quality flags
This research drew on RBC’s own primary filings (the Q2 FY2026 Form 6-K and Report to Shareholders, independently re-pulled and cross-checked against the primary PDF text rather than taken from a summary, and the FY2025 Form 40-F), RBC’s own investor-relations materials, the Bank of Canada’s own press releases, and press and data-aggregator coverage for market pricing, valuation multiples, and peer figures. Fifty-eight distinct claims were logged to a claims ledger over the course of this research; a dedicated verification pass focused on every claim flagged unverified or disputed, independently re-pulling primary and live-market sources rather than accepting the original citations at face value.
On the full five-factor read behind the rating above: valuation is not cheap. Trailing earnings around 18 times and price-to-book around 2.4 to 2.8 times, depending on the exact date pulled, sit at the richest end of the Canadian Big Five, and four independently sourced sell-side vendors, across both Canadian- and US-dollar-denominated targets, put average price targets modestly below the current price even under a nominal Buy rating. Growth reads as genuinely mixed rather than simply strong: the headline 25 percent net-income growth is real and broad-based, but a disproportionate share traces to a falling-provisions effect with a mathematical floor, and management’s own forward guidance points to mid-single-digit net interest income growth, a much more modest pace; real underlying drivers do exist, disclosed commercial-lending share gains, Wealth Management’s asset-based fee growth, and City National’s verified loan-growth turnaround, but they are smaller and slower than the quarter’s headline suggests. Quality is the strongest and best-verified pillar: a 17.2 percent return on equity, competitive with or ahead of every Canadian peer this quarter, a 13.5 percent capital ratio comfortably above the roughly 11.5 percent regulatory floor, a diversified five-segment earnings base, and a dividend payout ratio with real headroom inside management’s own target range. Risk is real and multi-pronged: the largest single Canadian exposure to the mortgage renewal wall, a genuinely two-sided Bank of Canada rate environment, an unresolved multi-year City National track record including a 2024 federal enforcement action, and a currency-translation risk unique to NYSE-line USD holders. Momentum is positive but shows signs of being priced for continuation rather than surprise: the stock sits at or near its 52-week high after roughly 59 percent one-year market-cap growth, with a below-market beta suggesting lower relative volatility, tempered by sell-side average targets sitting below the current price across every vendor checked. Putting the five together, the read lands at Hold: a genuinely high-quality franchise that this research does not find to be mispriced to the upside, better suited to owning for the quality and the dividend than for near-term appreciation the sell side itself is not underwriting.
Data-quality flags:
- RY’s trailing price-to-earnings ratio was originally disputed between 18.52x and 16.25x across two vendors; an independent re-pull in this research reconciled it toward roughly 18x. Treat the lower figure as a likely stale or currency-mismatched snapshot.
- RY’s dividend yield was originally disputed across a narrow 2.21 percent to 2.44 percent range; an independent re-pull landed at 2.27 percent, roughly the middle of that range, consistent with normal trailing-versus-forward and pricing-date differences rather than a genuine disagreement.
- RY’s price-to-book ratio moved from 2.44x to 2.78x between two pulls taken hours apart during this research, a direct, concrete illustration of why every valuation figure in this piece is stamped point-in-time rather than treated as fixed.
- Sell-side average price targets are disputed to the exact dollar across four vendors and two currencies, but consistently sit below the current price; use the directional read, not any single precise figure.
- RY’s net interest margin is reported as 1.58 percent by press coverage of the primary filing and as a differently defined 1.73 percent “bank-only” figure by a separate data aggregator; these likely measure different things and are not a genuine contradiction.
- A City National Bank net-income figure of US$127 million for the current quarter, cited in some early research for this piece, was found during verification to be misattributed to a different, August-2025-dated quarter (the actual figure for that period was US$114 million); it has been excluded from this piece, which instead cites the independently verified current-quarter loan-growth figure of plus 9 percent year over year.
- RBC’s disclosed 28.4 percent share of small and mid-size Canadian business loans, cited from a secondary source, could not be traced to a primary RBC investor-day slide in this research, though the underlying measurement methodology was independently confirmed in RBC’s own primary investor materials; treat the exact percentage as sourced-but-not-independently-verified-to-the-decimal.
- A precise, dollar-denominated update on HSBC Canada revenue-synergy realization as of mid-2026 could not be found in RBC’s primary Q2 FY2026 release itself, despite an active, confident qualitative narrative in press and analyst commentary; the C$300 million target and “on track” framing should be read as management’s own stated goal, not an independently confirmed current progress figure.
- A precise, US$2.95 billion figure for RBC’s historical capital infusion into City National Bank remains press-tier only and was not independently re-confirmed in this research; treat it as directional color, not a precise number.
- All prices, market capitalizations, valuation multiples, and market-share figures in this piece are point-in-time as of late June through early July 2026 and move fast; RY’s dual listing (NYSE in US dollars, TSX in Canadian dollars) adds a genuine currency dimension on top of the usual point-in-time caveat.
Key sources: RBC Q2 FY2026 Form 6-K and Report to Shareholders (rbc.com investor relations, sec.gov); RBC “At a Glance Q2/2026” investor deck (rbc.com); RBC FY2025 Form 40-F (sec.gov); Bank of Canada policy rate announcements (bankofcanada.ca); stockanalysis.com; companiesmarketcap.com; wowa.ca Canadian housing market reports; tradingeconomics.com; press coverage via Reuters, American Banker, the Globe and Mail, GuruFocus, Benzinga, and Yahoo Finance.
Prepared July 2, 2026. Figures are point-in-time and will change. This is research and analysis for educational purposes, not investment advice, not a recommendation, and not a solicitation. Bank stocks carry credit, rate, and regulatory-capital risk that can move a share price fast, and RY’s dual-currency listing adds an exchange-rate dimension a US-domiciled peer does not carry. Verify all figures independently and consult a licensed financial advisor before making any decision.