
Research date: July 2, 2026 | OSINT market research on Mitsubishi UFJ Financial Group, Inc. (NYSE: MUFG), Japan’s largest bank by assets
Important disclaimer. This is OSINT-based research and educational analysis, not investment advice. I am not a financial advisor. Nothing here is a recommendation to buy or sell any security, and the scenarios below are illustrative, not price targets. Bank stocks carry credit, rate, and regulatory-capital risk that can move a share price fast, and a Japan-based ADR like this one adds currency risk and a foreign-issuer filing regime most US-only bank stocks do not carry. Market caps, prices, valuation multiples, and market-share figures are point-in-time (July 2, 2026), vendor-reported where noted, and move fast. Do your own due diligence and consult a licensed advisor.
One housekeeping note before anything else, because it changes how every dollar figure below should be read: MUFG’s NYSE-listed American Depositary Receipt represents one ordinary share each, a straightforward 1-for-1 ratio, unlike some other foreign bank ADRs that bundle several ordinary shares into one certificate. The company’s primary listing and deepest liquidity sit on the Tokyo Stock Exchange under code 8306, where the bulk of the real trading volume happens; the NYSE line is a convenient, fully fungible way for a US investor to hold the same economic stake without opening a Japanese brokerage account.
Where this stock could be in 6 months, 1 year, 3 years, and 5 years
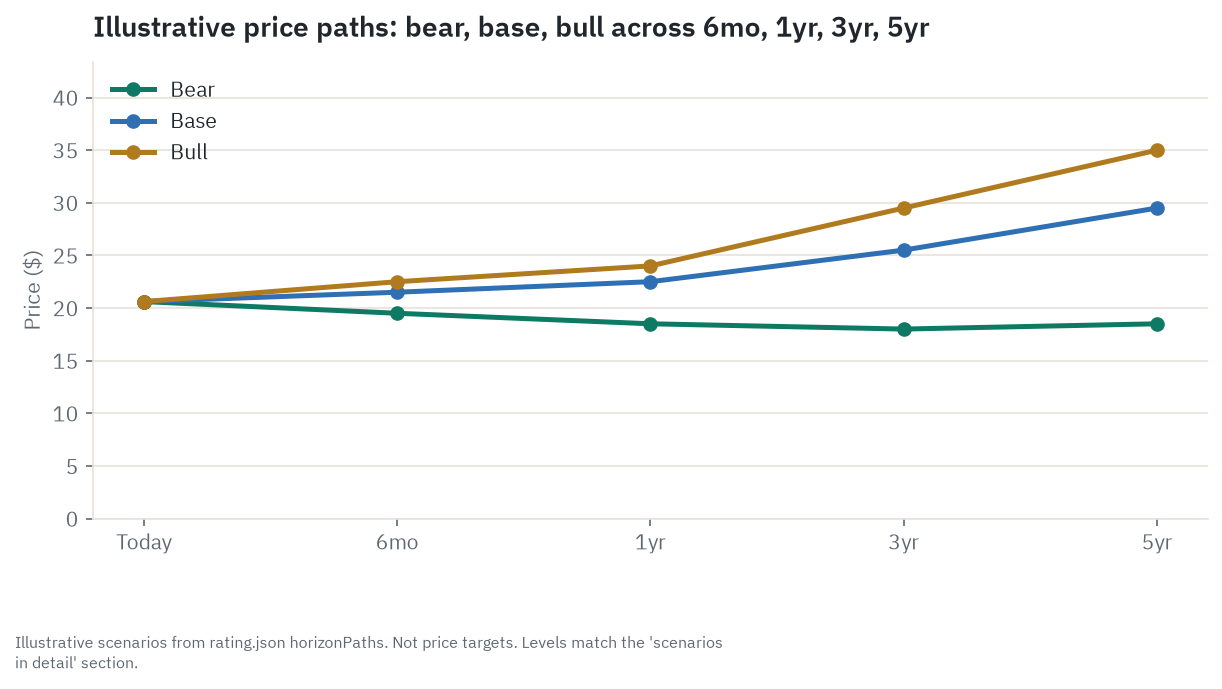
Six months. This window turns on the next Bank of Japan policy decision and MUFG’s own interim results, expected around early August 2026. The Bank of Japan just raised its policy rate a quarter point to 1.0 percent in June, the highest level since 1995, partly to guard against an energy-driven inflation scare tied to the conflict in Iran, and every further hike widens MUFG’s lending margin directly. The base case holds the stock roughly where it sits today, around $21.50, with the market waiting on the next policy signal. A clean interim print alongside continued, orderly normalization is the bull path, toward $22.50. The bear path, to about $19.50, is a hawkish shock: the same geopolitical energy-price risk that just justified the June hike tipping into something that forces the central bank to move faster than markets, or MUFG, are ready for. The single thing to watch here is the Bank of Japan’s own next policy statement.
One year. Over twelve months the dominant variable is MUFG’s full fiscal-year results, due around May 2027, measured against management’s own target of 2.7 trillion yen in profit attributable to shareholders, roughly 11 percent above the record 2.43 trillion yen just posted. Just as important, and easy to miss under a record-profit headline, is whether MUFG’s core capital ratio has stopped falling. It dropped from 14.18 percent to 12.47 percent in the same fiscal year profit hit a record, mostly a mechanical effect of Japan’s Basel III finalization rules rather than any change in loan quality, but a ratio moving the wrong direction in a strong year leaves less room to absorb a bad one. The base case, around $22.50, has MUFG roughly hitting its target while the capital ratio stabilizes. The bull case, around $24, has a beat on both counts. The bear case, around $18.50, has credit costs, which already nearly quadrupled this past year off an unusually low base, keep climbing rather than settling down, while the capital ratio keeps sliding. Watch the quarterly capital ratio print above anything else.
Three years. By this horizon the structural question starts to matter more than any single quarter: has Bank of Japan normalization run its course at a level that permanently widens MUFG’s margin, or does an overtightening cycle, layered on Japan’s own slow-growing, aging economy, choke off the tailwind before it fully compounds. The base case, around $25.50, has normalization continuing at a measured pace with credit costs settling at a modestly higher, but not alarming, new normal. The bull case, around $29.50, has the normalization prove durable with credit costs contained. The bear case, around $18, is the skeptic’s central worry: the Bank of Japan overtightens into a slowdown, credit costs keep climbing rather than leveling off, and the capital ratio comes under further pressure, forcing MUFG to slow its dividend growth or buybacks to protect its cushion. The signal to track is whether Japan’s underlying growth, not just its interest rates, is actually strengthening.
Five years. This is a durability question above all else. MUFG holds roughly 23.5 percent of Morgan Stanley, an unusual stake that lets the earnings from Wall Street’s own investment-banking and wealth-management franchise flow straight into a Japanese bank’s income statement, and by year five the question is whether that stake, and the broader rate-normalization story, have proven to be a genuinely higher, durable level of profitability, or a temporary bump that fades back toward the low returns Japanese banks earned for most of the last three decades. The base case lands near $29.50, the bull case near $35, and the bear case near $18.50, with a roughly 2.6 to 2.9 percent dividend layered on top of all three paths and not included in those price levels. The decisive test is whether Japan’s own economy, not just its central bank, has found a durably higher growth rate once the one-time rate re-rating is fully priced in.
Where the read lands today. On balance the read holds at Hold: MUFG is a genuinely improved, faster-growing Japanese megabank riding a real, once-in-a-generation rate-normalization tailwind, priced at a fair, not cheap, multiple around 1.7 times book value, with a capital ratio that just moved the wrong way in its best profit year in a generation. Get more constructive if the capital ratio stabilizes over the next two or three quarters; get more cautious if it keeps falling or if credit costs keep climbing past this past year’s already-elevated level, the combination most likely to break the thesis.
Companion tool
Jump to the interactive dashboard to sort and filter every company in this piece, or download the Excel model to flex the scenarios yourself.
TL;DR
MUFG is Japan’s largest bank by assets, and for the first time in roughly three decades its home market’s interest rates are actually rising, from a policy rate pinned near zero for most of the 2010s to 1.0 percent as of the Bank of Japan’s June 2026 hike, the highest since 1995. That single fact is doing most of the work behind a record fiscal-year profit of 2.43 trillion yen, up 30 percent, and a return on equity that climbed from 9.3 to 11.3 percent in a single year. Layered on top is something no other Japanese bank has: a roughly 23.5 percent stake in Morgan Stanley, accounted for so that a slice of Wall Street’s own trading, banking, and wealth-management profits flows directly into MUFG’s earnings, which is exactly what happened this past year as Morgan Stanley had a strong run. None of this is free. The same fiscal year that produced the record profit also saw MUFG’s core capital ratio fall by roughly a percentage and a half, mostly because Japan is phasing in tougher post-crisis capital rules, and total credit costs nearly quadrupled off an unusually low prior-year base, an early sign that higher rates eventually cost borrowers something too. MUFG’s own filings name the flip side of both tailwinds explicitly as risks: a sudden jump in Japanese government bond yields could hurt its bond portfolio, and its Morgan Stanley alliance, the very thing juicing this year’s profit, could just as easily turn into a drag if Wall Street has a bad multi-year stretch. The stock trades at roughly 1.7 times book value and a forward earnings multiple in the mid-teens, squarely in line with its global bank peers, not at either a bargain or an obvious premium, which is the crux of why this piece lands at a plain Hold rather than a stronger call in either direction.
Explore it yourself: the interactive dashboard
Open the dashboard in a full screen
What MUFG actually does
Mitsubishi UFJ Financial Group is Japan’s largest bank by assets, roughly 431.7 trillion yen (about $2.66 trillion) as of March 2026, and one of the largest financial groups in the world. Strip away the size and it does the same three things every universal bank does, at a scale few institutions anywhere can match: it gathers deposits from Japanese households and companies (and, increasingly, from customers overseas), it lends that money out and invests a large slice of it in government bonds, and it earns fees managing wealth, advising on deals, and moving money across borders for its corporate clients.
The group currently organizes itself into six reporting segments, a structure it refreshed during fiscal 2026: Retail & Digital Business, everyday consumer banking, cards, and digital services for Japanese households; Commercial Banking & Wealth Management, mid-market corporate lending paired with wealth advisory; Japanese Corporate & Investment Banking, lending, cash management, and capital-markets services for Japan’s largest companies, and the single biggest profit engine in the whole group; Global Commercial Banking, the overseas retail and commercial franchises MUFG has built or bought across Southeast Asia and the Americas; Asset Management & Investor Services, fund management and custody, MUFG’s smallest major segment by profit but one of its stickiest; and Global Corporate & Investment Banking, cross-border lending and investment banking for multinational clients, the second-biggest profit contributor after its domestic counterpart. A seventh line, Global Markets, covers trading and treasury activities and is the most cycle-sensitive piece of the group, swinging to an operating loss in fiscal 2026 even as every other segment turned a profit.
What is easy to miss from the outside is that MUFG’s brand, built on a nationwide branch network most Japanese households have banked with for generations, is not actually where the bulk of its profit comes from. Japanese Corporate & Investment Banking alone generated more operating profit in fiscal 2026, 707 billion yen, than Retail & Digital and Asset Management combined. This is, at its core, a corporate and investment bank wearing a household-name retail brand.
How the money flows
flowchart TD
    DEP["Japanese & overseas deposits<br/>near-zero-cost funding base"]
    DEP --> LEND["Domestic lending<br/>Japanese CIB + Retail and Digital<br/>largest single profit segment"]
    DEP --> SEC["JGBs and securities portfolio<br/>~9% of total assets in JGBs"]
    DEP --> GLOB["Overseas lending<br/>Global CIB + Global Commercial Banking<br/>Krungsri, Danamon, Shriram Finance"]
    LEND --> PROFIT["Group profit<br/>JPY2,427.2bn FY2026, +30.3%"]
    SEC --> PROFIT
    GLOB --> PROFIT
    WEALTH["Wealth, trust, asset management<br/>fee-based, capital-light"]
    DEP --> WEALTH
    WEALTH --> PROFIT
    MS["~23.5% Morgan Stanley stake<br/>equity-method income"]
    MS --> PROFIT
    BOJ["Bank of Japan policy rate<br/>1.0% as of June 2026"]
    BOJ -->|sets loan/deposit spread| LEND
    BOJ -->|sets bond yield & mark-to-market| SEC
Read from the top, the whole business model is one sentence: a near-free deposit base gets deployed into domestic loans, government bonds, an overseas book, and fee-earning wealth services, and every one of those channels except the fee business is directly at the mercy of a single external variable, the Bank of Japan’s policy rate. For most of the last three decades that rate sat at or below zero, which meant MUFG’s deposits cost it almost nothing but its loans and bonds also earned almost nothing, an environment that kept Japanese bank profitability structurally low no matter how well any individual bank was run. What changed, and what this whole piece is about, is that the rate has now moved to 1.0 percent, the highest since 1995, and every basis point of that move flows close to directly into MUFG’s net interest income because its deposit costs barely move at all while its loan and bond yields reprice.
Sitting apart from that domestic engine, and drawn separately in the diagram above, is MUFG’s roughly 23.5 percent stake in Morgan Stanley. Because MUFG accounts for this stake under the equity method, a slice of Morgan Stanley’s own profit, investment-banking fees, trading gains, wealth-management revenue, flows directly into MUFG’s income statement every quarter, without MUFG’s Japanese depositors or borrowers being involved at all. It is the one part of this diagram that has nothing to do with the Bank of Japan and everything to do with the health of US capital markets instead, which is exactly why it is drawn as its own separate box rather than folded into the ordinary lending flow.
The segments, one at a time
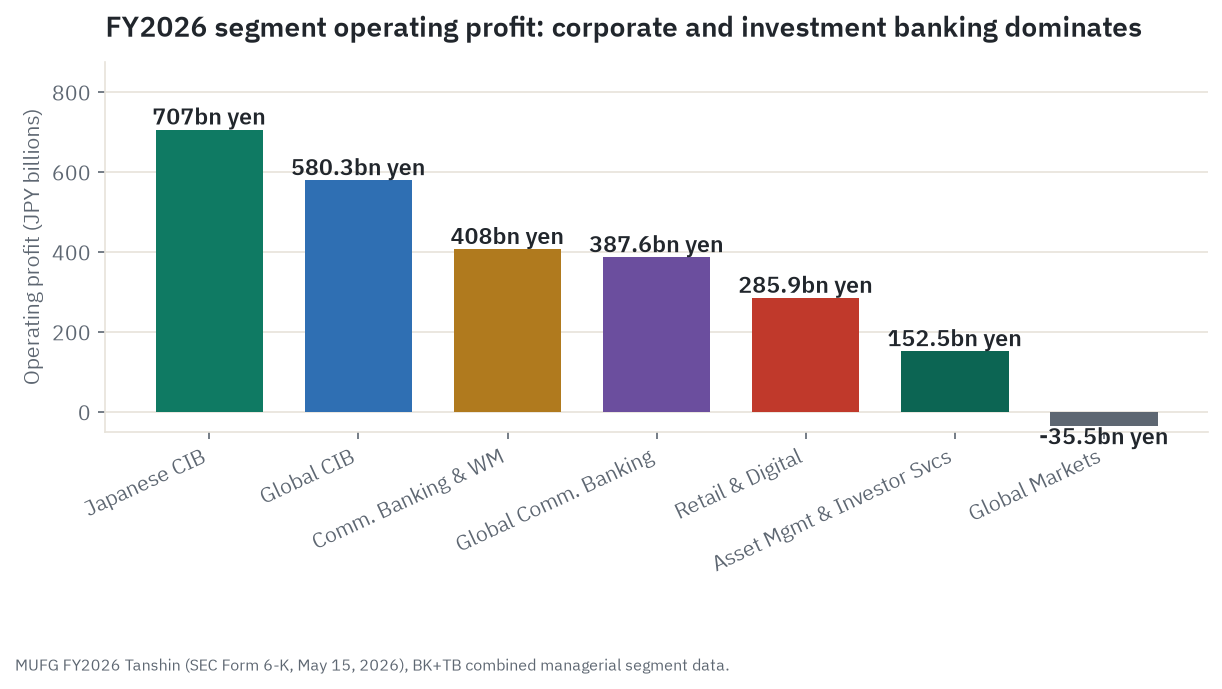
Japanese Corporate & Investment Banking, 707.0 billion yen of operating profit in fiscal 2026, the single largest segment, is MUFG’s relationship business with Japan’s largest companies: corporate lending, cash management, and the capital-markets services those companies need to raise money or manage risk. This is a slow-moving, relationship-based franchise; a company does not switch its main bank the way a household switches a credit card, which is why this segment is both MUFG’s biggest profit engine and one of its most durable.
Global Corporate & Investment Banking, 580.3 billion yen, is the international mirror of the domestic franchise above: cross-border lending, trade finance, and investment banking for multinational clients outside Japan. It is MUFG’s second-largest profit contributor and, being global rather than tied to one slow-growing economy, its most obvious growth lever, though it also carries more cross-border credit and currency risk than the purely domestic business.
Commercial Banking & Wealth Management, 408.0 billion yen, pairs mid-market corporate lending with wealth advisory for business owners and affluent individuals, a combination that captures both a lending spread and a fee stream from the same relationship.
Global Commercial Banking, 387.6 billion yen, houses MUFG’s overseas retail and commercial banking franchises built through acquisition, including Krungsri in Thailand, Bank Danamon in Indonesia, and a newer stake in Shriram Finance, an Indian retail lender. This is MUFG’s clearest emerging-markets growth bet, and it substitutes Japan’s slow-growth, low-risk profile for faster growth paired with real emerging-market credit and currency risk.
Retail & Digital Business, 285.9 billion yen, is the household-facing consumer bank most people picture when they hear the MUFG name: branches, cards, and increasingly, digital banking. It is a smaller profit contributor than the corporate franchises above, and the segment most exposed, over the long run, to Japan’s shrinking, aging population and to slow-moving fintech competition for everyday banking.
Asset Management & Investor Services, 152.5 billion yen, the smallest major segment, runs fund management and custody, a capital-light, fee-based business that does not need to hold capital against a loan the way every other segment does. It is MUFG’s stickiest revenue in a downturn, even if it is the smallest in absolute size.
Global Markets, a 35.5 billion yen operating loss in fiscal 2026, covers trading and treasury activities. A trading-desk loss in one year is not unusual for this kind of business, it is the single most volatile segment in the group by nature, but it is a reminder that not every part of MUFG benefits cleanly from a rising-rate environment.
Who wins where
MUFG does not compete against one kind of institution, it competes across several different arenas at once. In domestic Japanese corporate banking, its main rivals are the other two megabanks, Sumitomo Mitsui Financial Group (SMFG) and Mizuho Financial Group (MFG); the three effectively split Japan’s largest corporate relationships between them, an oligopoly with limits, since none of the three can reprice loans aggressively without risking losing a client to one of the other two. In global corporate and investment banking, MUFG competes against the large US and European banks, JPMorgan Chase, Citigroup, and HSBC among them, where its Japan-based balance sheet is both a funding advantage (that same near-zero-cost domestic deposit base) and a scale disadvantage against banks with much larger global wholesale franchises. In wealth and asset management, the smallest and stickiest piece of the mix, MUFG competes with dedicated wealth managers and the wealth arms of its own megabank rivals, none of which has built anything close to MUFG’s structural edge, in this specific business line, at Morgan Stanley’s scale.
That last point is really the whole story of what makes MUFG different from SMFG and MFG, its two closest domestic peers. All three are riding the same Bank of Japan normalization tailwind and the same slow-growing home market, but only MUFG owns roughly 23.5 percent of one of Wall Street’s premier investment banks and wealth managers, a genuinely unique structural feature among the three, and among global banks generally, that shows up directly in MUFG’s earnings whenever Morgan Stanley has a good year, as it just did.
Company by company: who’s who
Mitsubishi UFJ Financial Group (NYSE: MUFG; primary listing TSE: 8306), market capitalization approximately $231.3 billion as of July 2, 2026. Japan’s largest bank by assets, and the only one of the three domestic megabanks with a large, direct equity stake in a top-tier US investment bank. Bull: record profit, a rising return on equity, and a rate-normalization tailwind on the country’s largest deposit franchise, plus the Morgan Stanley kicker. Bear: a capital ratio that just fell sharply in its best profit year in a generation, a balance sheet still two-thirds tied to a slow-growing, aging home market, and a Morgan Stanley stake that cuts both ways.
Sumitomo Mitsui Financial Group (NYSE: SMFG; primary listing TSE: 8316), market capitalization approximately $155.4 billion. MUFG’s closest domestic rival in corporate banking, riding the identical Bank of Japan tailwind. Bull: the fastest-growing reported profit of the three domestic megabanks over the past year. Bear: the richest trailing earnings multiple of the group, 21.7 times, leaves the least room for further multiple expansion if the rate-normalization story stalls.
Mizuho Financial Group (NYSE: MFG; primary listing TSE: 8411), market capitalization approximately $120.6 billion. The most capital-markets-levered of the three domestic megabanks, through its Mizuho Securities arm. Bull: the cheapest forward earnings multiple of the group relative to its growth rate. Bear: sell-side consensus already sees it as essentially fully valued, with a price target sitting right at the current quote.
JPMorgan Chase & Co. (NYSE: JPM), market capitalization approximately $896.2 billion. The largest US bank by both assets and market value, the global benchmark for what a best-in-class, fully priced universal bank looks like. Bull: unmatched scale and a track record of execution through every cycle. Bear: already priced at a premium to MUFG and its Japanese peers on most multiples, despite MUFG posting comparable or faster earnings growth this past year.
HSBC Holdings plc (NYSE ADR: HSBC), market capitalization approximately $331.2 billion. The other large Asia-linked global bank investors compare against MUFG, though HSBC’s Asia exposure runs through Hong Kong and mainland China rather than Japan. Bull: a best-in-class Asian wealth franchise and a high, well-covered dividend. Bear: its own share buyback is currently paused while it rebuilds capital after buying out its Hang Seng Bank subsidiary, and its Hong Kong and China property-credit exposure is a distinct risk MUFG does not carry in the same form.
What the filings say
MUFG is a foreign private issuer and files a Form 20-F annual report plus periodic Form 6-K reports with the SEC rather than the 10-K and 10-Q that US-domiciled companies file; it reports under Japanese GAAP in its own regular results releases and separately reconciles to US GAAP later. This section draws on MUFG’s Form 6-K filed May 15, 2026, containing its Consolidated Summary Report (an interim-style earnings release Japanese companies call a “Tanshin”) for the fiscal year ended March 31, 2026, and its Form 20-F for the fiscal year ended March 31, 2025, filed July 7, 2025. MUFG’s fiscal year runs April through March, so “fiscal 2026” below means the twelve months ended March 31, 2026.
Income statement. Ordinary income rose 7.3 percent to 14.62 trillion yen and ordinary profits rose 27.7 percent to 3.41 trillion yen. Profit attributable to owners of parent, the bottom-line figure, rose 30.3 percent to a record 2.43 trillion yen, up from 1.86 trillion yen a year earlier (itself up 25.0 percent on the year before that). Basic earnings per share rose to 213.17 yen from 160.02 yen. Consolidated gross profits rose by 1.13 trillion yen to 5.94 trillion yen, which MUFG attributes to overseas-acquisition contributions, higher net interest income from rising Japanese rates and improved margins, growth in fee-based businesses, and a rebound from a bond-portfolio rebalancing loss taken the prior year. General and administrative expenses rose 339.1 billion yen to 3.57 trillion yen on growth investment, inflation, and overseas-acquisition costs.
Return on equity and profitability. Return on equity, on the JPX basis MUFG itself reports, rose from 9.29 percent to 11.34 percent, a genuinely large one-year jump for a bank this size, and consistent with a business whose core profitability had been suppressed for years by near-zero rates and is now normalizing.
Segments. See the segment-by-segment breakdown above; the figures come from the same Tanshin release, on a combined managerial basis for MUFG Bank and MUFG Trust and Banking (not the full group-consolidated segment note, which will appear in the fiscal 2026 Form 20-F once filed).
Cash flow and balance sheet. Total assets rose 18.6 trillion yen to 431.7 trillion yen, driven mainly by a 12.4 trillion yen rise in loans and bills discounted, to 133.8 trillion yen, while the securities portfolio shrank 0.4 trillion yen to 85.7 trillion yen. Total net assets rose 2.0 trillion yen to 23.7 trillion yen, and shareholders’ equity rose to 22.3 trillion yen from 20.5 trillion yen. Operating cash flow was negative 23.1 trillion yen for the year, a large swing from a roughly flat prior year; a negative operating cash flow like this is a normal feature of a bank’s cash-flow statement in a period when loan growth outpaces deposit growth, not on its own a distress signal, but it is a genuine swing worth naming rather than glossing over.
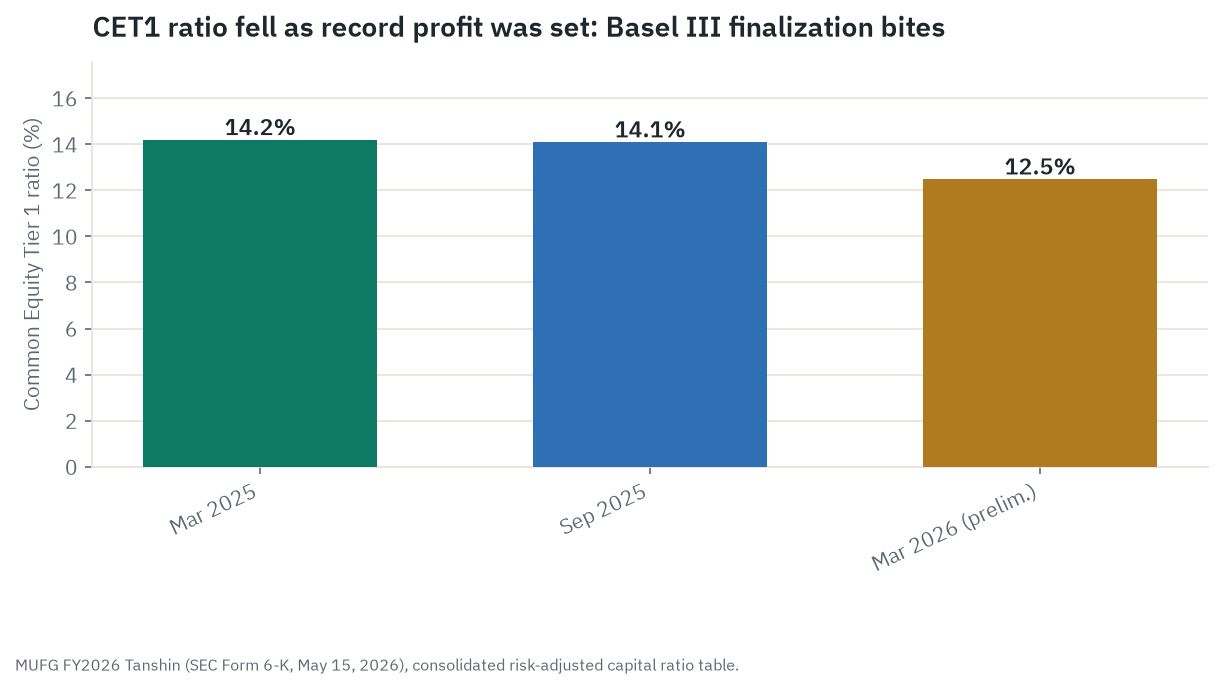
Capital ratios, and the flag that matters most. MUFG’s consolidated Common Equity Tier 1 (CET1) ratio, the core measure of a bank’s loss-absorbing cushion, fell to 12.47 percent as of March 2026 (preliminary) from 14.18 percent a year earlier and 14.08 percent at the September 2025 midpoint, a decline of roughly a percentage and a half in a single year. Tier 1 capital ratio fell to 14.95 percent from 16.65 percent, and total capital ratio to 16.85 percent from 18.83 percent. Risk-weighted assets rose from 106.9 trillion yen to 120.3 trillion yen. This is a large one-year capital-ratio decline for a globally systemically important bank, and it reflects Japan’s phase-in of finalized post-crisis Basel III capital rules, which mechanically raise risk-weighted assets, layered on top of ordinary risk-weighted-asset growth from loan growth and overseas acquisitions, including a new stake in Shriram Finance, an Indian retail lender. A CET1 ratio in the mid-12s remains comfortably above regulatory minimums, but the direction, down rather than up, is the opposite of what a reader might assume from a record-profit headline year, and it is the single biggest reason this piece does not land at a stronger rating than Hold.
Capital returns and dilution. Total shares outstanding, including treasury shares, fell from roughly 12.07 billion (March 2025) to roughly 11.87 billion (March 2026), a 200-million-share reduction consistent with a large buyback-and-cancellation program; treasury shares stood at roughly 580 million as of March 2026. MUFG paid a total dividend of 86.00 yen per share for fiscal 2026 (a 40.3 percent payout ratio), up from 64.00 yen the year before, and has set a dividend forecast of 96.00 yen per share for fiscal 2027 (a 40.1 percent payout target), continuing a roughly 40 percent payout policy.
Guidance. MUFG’s own target for the fiscal year ending March 2027 is 2.70 trillion yen of profit attributable to owners of parent, versus the 2.43 trillion yen just earned, implying roughly 11 percent further growth if achieved. MUFG deliberately calls this a “target” rather than a “forecast,” explicitly citing “various uncertainties caused by economic situation, market environments and other factors” as the reason it will not commit to a firmer number, a hedge worth taking at face value rather than reading as either a promise or an evasion.
Disclosed risk factors, in MUFG’s own words. From the Form 20-F’s risk-factors section: “Because a large portion of our assets as well as our business operations are in Japan, we may incur losses if economic conditions in Japan worsen.” As of March 2025, 64.5 percent of MUFG’s total assets were Japan-related, Japanese government and government-agency bonds made up 62.5 percent of the investment securities portfolio and 9.0 percent of total assets, Japan-based loans made up 56.8 percent of the total loan book, and Japan accounted for 26.8 percent of total interest and non-interest income. The filing separately names “the decreasing and aging demographics in Japan” among the factors that could weigh on the broader domestic economy. Separately, and just as directly: “If our strategic alliance with Morgan Stanley fails, we could suffer financial or reputational loss.” MUFG held approximately 23.5 percent of Morgan Stanley’s voting rights as of March 2025 (about 377 million common shares) plus Series C Preferred Stock with a face value of roughly $521.4 million paying a 10 percent dividend, and holds two of the seats on Morgan Stanley’s board. Because this stake is accounted for under the equity method, a share of Morgan Stanley’s own profit or loss flows directly into MUFG’s own income statement, which is exactly why MUFG’s earnings from “equity in earnings of equity-method investees” rose to 845.5 billion yen in fiscal 2026 from 596.9 billion yen, a jump the company attributes explicitly to “strong performance at Morgan Stanley.” That same mechanism runs in reverse whenever Morgan Stanley has a weak stretch. On rates specifically, the filing notes that a sudden Japanese government bond price decline (a rate spike) could hurt MUFG’s securities portfolio and funding costs, while continued Bank of Japan bond purchases or a rate cut could compress its domestic lending spread instead, a genuinely two-sided risk rather than a one-directional tailwind.
Credit costs. Total credit costs rose to 355.8 billion yen in fiscal 2026 from 108.7 billion yen the year before, an increase MUFG attributes mainly to a rebound from an unusually large prior-year reversal of overseas credit costs rather than fresh deterioration. That explanation is plausible, but a reader should not extrapolate either the very low prior-year figure or this year’s near-quadrupling as a new steady state; credit costs are, structurally, more likely to keep drifting up than down in a rate-hiking environment.
A genuine coverage gap. MUFG’s peers, Sumitomo Mitsui Financial Group and Mizuho Financial Group, were not read at this same filing-level depth for this piece; their capital ratios, segment mix, and disclosed risk factors are not independently verified here, and the peer figures used elsewhere in this article come from a market-data vendor rather than each company’s own annual report. Likewise, MUFG’s institutional and insider ownership picture, a standard analytical leg for a US-listed company, was not sourced in this pass; Japan’s disclosure regime for major shareholders and insider dealings differs from the US Form 4 and 13F system, and this is an honest gap rather than a guessed-at figure.
What the market is paying
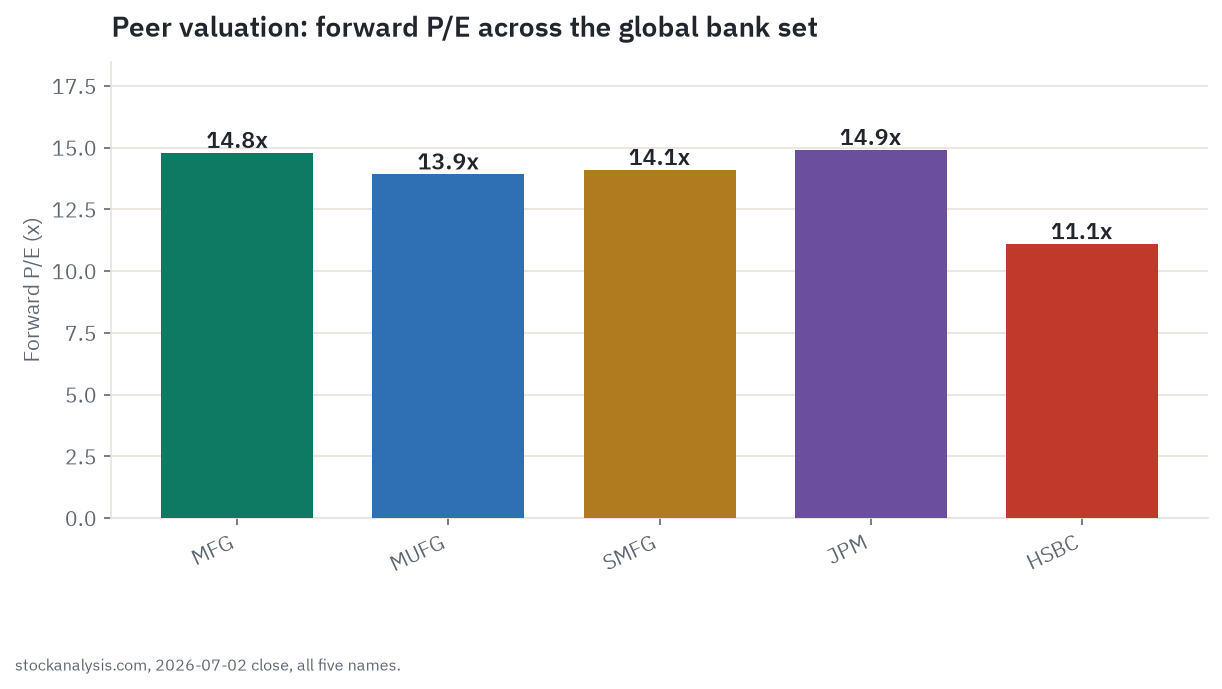
MUFG’s ADR closed at $20.61 on July 2, 2026, up 1.68 percent on the day and sitting near the top of its 52-week range of $13.19 to $21.18, roughly 56 percent above that low. Its trailing price-to-earnings ratio of 15.15 times and forward multiple of 13.91 times sit inside a tight band with its global peers: cheaper than JPMorgan’s 16.0 times trailing and 14.9 times forward, modestly cheaper than HSBC’s 15.69 times trailing (though above HSBC’s 11.09 times forward), and between its two closest domestic rivals, SMFG’s richer 21.73 times trailing and Mizuho’s near-identical 15.35 times. On a forward basis, notably, all three Japanese megabanks cluster tightly between about 14 and 15 times, suggesting the market is pricing the whole group’s rate-normalization story together rather than rewarding any one name individually, despite real differences in their reported growth rates.
Book value, the metric that actually matters for a bank, tells a more interesting story than the earnings multiple. MUFG’s own filing puts total net assets per common share at 1,973.31 yen; translated at a spot rate near 162.5 yen per dollar, that works out to roughly $12.14 per share, implying a price-to-book multiple of about 1.70 times. A market-data vendor’s independently calculated figure, $12.41 book value per share, implies a very similar 1.66 times. Either way, call it roughly 1.7 times book, a real re-rating from the levels near or below 1.0 times book that Japanese megabanks traded at for most of the deflationary 2010s, though not an extreme one against a bank posting an 11.34 percent and rising return on equity.
A genuine data-quality flag on the dividend. The market-data vendor used for this piece shows MUFG’s trailing dividend at just $0.19 per share, implying a yield of only 0.92 percent, a figure that looks stale or only partially converted from MUFG’s actual yen-denominated payout. Doing the math directly from the primary filing instead: MUFG paid a total of 86.00 yen per share for fiscal 2026, which at the same 162.5 yen-per-dollar spot rate is roughly $0.53 per share, a trailing yield closer to 2.6 percent, with a forward yield near 2.9 percent implied by the 96-yen dividend forecast for fiscal 2027. This article uses the primary-filing-derived figure throughout rather than the vendor’s number, and flags the gap explicitly as a data-quality issue with the vendor data, not a fact about MUFG’s actual payout. The same JPY-translation caveat likely applies to SMFG’s and Mizuho’s own vendor-displayed yields (0.97 percent and 1.44 percent respectively), though those were not independently re-derived for this piece.
Liquidity and positioning. Beta sits at a notably low 0.32, suggesting the stock has moved somewhat independently of broad US market swings, common for a Japan-listed ADR whose price action tracks yen moves and Bank of Japan policy more than US macro headlines. Short interest is low, 6.76 million shares, about 0.07 percent of shares outstanding, with roughly two days to cover, not a name carrying meaningful bearish positioning right now. Sell-side coverage on the NYSE ADR specifically is thin, just two analysts, with a consensus rating of Hold and an average price target of $20.12, essentially at the current price. That is a much smaller sample than the broader Tokyo-listed analyst universe covering MUFG, which was not captured in this piece and should be kept in mind before treating the two-analyst NYSE consensus as the full picture. One incremental data point worth naming: Erste Group initiated coverage of MUFG with a Buy rating around June 25, 2026, citing the Bank of Japan’s rate-normalization path as a positive driver, a modestly more bullish signal than the official two-analyst consensus.
Cross-name read. The market is pricing MUFG, SMFG, and Mizuho within a tight forward-earnings band despite quite different reported growth rates, evidence the “Japanese megabank rate-normalization” theme is being priced as a group story rather than name by name. Among the three, SMFG’s noticeably richer trailing multiple, 21.7 times versus MUFG’s 15.2 times and Mizuho’s 15.3 times, is the one figure in this comparison set that looks hardest to square with the group’s otherwise tight forward clustering, and is worth a reader’s own scrutiny before assuming all three Japanese megabanks are equally cheap.
What the crowd is saying
News flow around MUFG has, on balance, been warming. The dominant recent story is the same one driving the fundamentals: a sell-side initiation (Erste Group, Buy) framed explicitly around Bank of Japan rate normalization, alongside routine deal announcements, including MUFG leading a Japanese leasing-finance deal for the airline Viva Aerobus in late June 2026. Retail and social chatter around MUFG is genuinely thin by mega-cap standards; this is not a stock that generates the volume of retail-forum conversation a popular US name would, and that quiet is itself a real, if soft, data point about who owns this stock (large institutions, not a loud retail crowd) rather than a gap to paper over with an invented chatter figure. Search-trend and employee-sentiment data were not independently sourced for this piece, an honest limitation rather than a guess.
Where the crowd’s story and the filings diverge. The narrative currently being rewarded, a fast-growing, rate-normalization beneficiary trading among the cheaper large-cap global banks, is broadly consistent with what the numbers show. The place a reader focused only on the headline could get misled is capital: it would be easy to read “record profit, cheap-looking multiple” and miss entirely that the CET1 ratio fell roughly a percentage and a half in the very same fiscal year, a fact that lives in the filings, not in the price-cheering coverage.
No manipulation or pump-and-dump pattern was observed in this research; MUFG is a large, liquid, widely institutionally held mega-cap, a profile where that kind of risk is low to begin with.
The durability question: rates, the cycle, and what breaks it
The honest way to frame MUFG’s whole investment case is that it is a repricing story layered on top of a structurally slow-growing balance sheet, not a volume-growth story in its own right. Three decades of near-zero Japanese interest rates suppressed every Japanese bank’s profitability structurally, not cyclically, and that suppression is lifting for the first time in a generation as the Bank of Japan normalizes. MUFG, sitting on the country’s largest deposit base, captures the largest absolute yen benefit from every basis point of that normalization, and its unusual Morgan Stanley stake lets US capital-markets strength flow into its earnings on top of the domestic story. If the Bank of Japan continues normalizing even partway toward the rate levels other major central banks operate at, this margin recovery plausibly has years left to run.
The cyclical bear case is that rate normalization is not free for a bank either. It raises the mark-to-market risk on MUFG’s roughly 9 percent of total assets held in Japanese government bonds, it raises credit costs as borrowers who grew comfortable with near-zero financing costs for decades face real rates for the first time, and it has already shown up as a roughly 170-basis-point capital-ratio decline in a single year. If the Bank of Japan overtightens into a global growth scare, especially one tied to the same kind of geopolitical energy shock that partly justified its June 2026 hike, MUFG could face a fairly classic late-cycle bank combination: a flattening yield curve, rising credit costs, and a capital cushion with less room to absorb both than it had a year earlier.
The most likely outcome sits between those two extremes: continued, gradual normalization lifting MUFG’s margin for several more years, punctuated by credit costs settling at a higher, but not alarming, new normal as ultra-cheap financing conditions fade, with the capital ratio needing active management, through slower buybacks or retained earnings, to rebuild toward MUFG’s own comfort zone even as reported profit keeps growing. The likeliest failure mode is not a Japan-specific banking crisis but an external shock, a genuine energy-driven inflation spike, a sharp global slowdown, or a Morgan Stanley-specific setback, landing on a bank whose capital cushion has already thinned somewhat from where it stood a year ago.
The scenarios in detail
Every number in this section is an estimate built the same auditable way: MUFG’s book value per share, roughly $12.30 today (from the primary filing’s 1,973.31-yen-per-share figure, translated at a spot rate near 162.5 yen per dollar), compounded forward at a scenario-specific annual growth rate and multiplied by a scenario- and horizon-specific price-to-book multiple. None of this is a price target, and all of it is labeled a research signal, not advice. The dollar levels here match the lede chart at the top of this piece exactly, because both come from the same underlying model.
The driver tree
Four variables decide almost everything about where MUFG realistically goes over the next five years. The pace and durability of Bank of Japan rate normalization, since every further hike widens MUFG’s domestic lending spread directly, while a pause or reversal caps the biggest driver behind the last two fiscal years of profit growth. The capital-ratio trajectory, since whether MUFG stabilizes and rebuilds its CET1 ratio, or keeps bleeding it, shapes the per-share outcome (through the pace of dividends and buybacks) as much as the headline profit line does. Credit-cost normalization versus a genuine cycle turn, since fiscal 2026’s near-quadrupling of credit costs off a low base could settle into a modestly higher new normal, or could keep climbing into something closer to a real credit cycle. Morgan Stanley’s own performance, since it flows straight into MUFG’s earnings through the equity method and is, structurally, the single most volatile line in MUFG’s income statement in either direction.
Bull
Bank of Japan normalization continues gradually without a policy mistake; MUFG’s CET1 ratio stabilizes and begins rebuilding as risk-weighted-asset growth slows; credit costs settle back down after the fiscal 2026 spike rather than climbing further; Morgan Stanley continues performing strongly, keeping its equity-method contribution a tailwind. Book value per share compounds at close to 8 percent a year. What this implies [estimate]: book value reaching about $18.07 per share by year five, at an exit price-to-book multiple near 1.95 times (still below JPMorgan’s own historically richer book multiple), works out to $35 per share, an illustrative scenario valuation, not a price target. What breaks it: a Bank of Japan policy mistake, a Morgan Stanley-specific setback, or a Japan-specific credit event.
Base
Bank of Japan normalization continues but at a more measured pace; MUFG comes close to its fiscal 2027 profit target and continues single-digit growth after that; the CET1 ratio stabilizes near current levels rather than fully rebuilding; credit costs settle at a modestly elevated new normal. Book value compounds at about 6 percent a year. What this implies [estimate]: book value near $16.46 per share by year five at a 1.78-times multiple works out to about $29.50 per share. What would move this in either direction: a materially faster or slower Bank of Japan path than currently expected.
Bear
This is the skeptic’s case, anchored on the strongest disconfirming evidence rather than softened for the narrative. The Bank of Japan overtightens, partly in reaction to the same geopolitical energy-shock risk that partly justified its June 2026 hike, into a domestic and global slowdown. Credit costs keep rising past fiscal 2026’s already-elevated level rather than normalizing down. The CET1 ratio, already down roughly 170 basis points in a single year, comes under further pressure, forcing slower buybacks or dividend growth to protect capital. Morgan Stanley has a weak multi-year stretch, turning the equity-method line into a drag rather than a tailwind. Book value compounds at only about 3 percent a year. What this implies [estimate]: book value near $14.26 per share by year five at a compressed 1.30-times multiple, a level closer to where Japanese megabanks traded through most of the pre-normalization era, works out to $18.50 per share, a de-rate, not a solvency scenario; the dividend paid along the way cushions the total return even here. What would confirm this case early: a further CET1 decline over the next two or three quarters, or total credit costs continuing to climb past the fiscal 2026 level rather than stabilizing.
Catalysts and timeline
Near term: the Bank of Japan’s next policy meetings; MUFG’s first-quarter fiscal 2027 interim results, expected around early August 2026; any update on the capital-ratio trajectory and dividend or buyback plans. Further out: MUFG’s full fiscal 2027 results against the 2.70-trillion-yen target, due around May 2027; the point at which Basel III finalization effects fully phase in and stop mechanically pressuring the capital ratio; any material shift in Morgan Stanley’s own multi-year performance.
Leading indicators to watch
MUFG’s quarterly CET1 ratio print, stabilizing versus continuing to fall from the current 12.47 percent; total credit costs relative to the fiscal 2026 level of 355.8 billion yen; the Bank of Japan’s policy rate path and tone; Morgan Stanley’s own quarterly results, since they flow directly into MUFG’s equity-method income line; and the gap between MUFG’s price-to-book multiple and its Japanese megabank peers’, where a widening premium over SMFG and Mizuho would signal the market crediting MUFG specifically, not just the broader Japan-bank theme.
What would change the thesis
A CET1 ratio that keeps falling for two or three more quarters, rather than stabilizing, would be the strongest disconfirming evidence against the bull case, since it would force a genuine capital-versus-growth trade-off management has not had to make yet. A Bank of Japan reversal, an actual rate cut, would remove the single biggest tailwind behind the last two fiscal years of profit growth. A sustained, multi-quarter deterioration at Morgan Stanley would flip the equity-method line from tailwind to drag, the clearest single external event that could hurt MUFG without anything changing inside MUFG itself.
Companies to watch (bull / base / bear)
MUFG (MUFG). Role: the name itself. Bull: the capital ratio stabilizes, credit costs normalize, and Morgan Stanley keeps performing, validating a durable higher-return Japanese megabank. Base: the dividend and modest book growth do the work while the capital ratio stabilizes near current levels. Bear: the Bank of Japan overtightens, credit costs keep climbing, and the capital ratio comes under further pressure, pulling the multiple down toward pre-normalization levels. Watch: the quarterly CET1 print, total credit costs, and the Bank of Japan’s next policy statement.
SMFG (SMFG). Role: the richest-multiple domestic peer. Bull: continues posting the fastest reported growth of the three domestic megabanks. Base: tracks the same Bank of Japan normalization theme as MUFG, one notch pricier. Bear: the 21.7-times trailing multiple leaves the least cushion of the three if the normalization story stalls. Watch: whether its premium multiple is validated by durably faster growth or compresses toward its peers’.
Mizuho (MFG). Role: the cheapest-growth-adjusted domestic peer. Bull: the most capital-markets-levered of the three benefits most directly from higher rates and trading volumes. Base: tracks the group theme at the cheapest forward multiple. Bear: sell-side already sees it as fully valued, with a consensus target essentially at the current price. Watch: trading and capital-markets revenue trends.
JPMorgan (JPM). Role: the global scale benchmark. Bull: continues compounding off unmatched US scale and execution. Base: steady, high-quality returns at a premium price versus the Japanese names. Bear: already priced richer than MUFG on most multiples despite comparable growth this year. Watch: whether MUFG’s discount to JPM narrows or persists.
HSBC (HSBC). Role: the other Asia-linked global-bank comparison. Bull: a best-in-class Asian wealth franchise and a high dividend. Base: tracks its own distinct Hong Kong/China cycle, largely uncorrelated with MUFG’s Japan-specific story. Bear: a paused buyback and Hong Kong/China property-credit exposure MUFG does not carry in the same form. Watch: whether HSBC’s buyback resumes, a signal for how global banks generally are managing post-crisis capital rules.
Risk controls
The honest way to frame MUFG’s risk is capital direction and concentration, not fragility. This is not a bank in any danger of insolvency; a CET1 ratio in the mid-12s sits comfortably above regulatory minimums even after this past year’s decline. The risk is that a genuinely improved, record-profit business is being valued at a fair, roughly 1.7-times-book multiple as though its recent tailwinds (Bank of Japan normalization and Morgan Stanley’s strong year) are a permanent new floor rather than a favorable multi-year window that could still reverse.
The single largest concentration risk is Japan itself: 64.5 percent of assets and 56.8 percent of loans sit inside a country whose own filings name its “decreasing and aging demographics” as a structural headwind. Layered on top is a genuine single-counterparty concentration that MUFG’s own filings name explicitly as a risk factor: the Morgan Stanley alliance, large enough and structured intimately enough (equity-method accounting, board seats, joint-venture securities companies in Japan) that a bad multi-year stretch at Morgan Stanley would show up directly in MUFG’s own earnings, the same channel that just delivered a tailwind. Access risk is modest for a US reader specifically: the NYSE ADR is liquid enough to trade easily, but its sell-side coverage (two analysts) is thin next to MUFG’s much larger Tokyo-listed analyst following, so US-specific consensus figures should be read as partial, not comprehensive.
What would most clearly signal the thesis breaking down: the CET1 ratio continuing to fall for two or three more quarters rather than stabilizing; total credit costs climbing further past the fiscal 2026 level rather than normalizing; a Bank of Japan rate cut, reversing the single biggest driver of the last two years’ profit growth; or a sustained, multi-quarter deterioration at Morgan Stanley. Conversely, what would signal the bull case playing out: the CET1 ratio stabilizing and beginning to rebuild; credit costs settling at a modestly higher, contained new normal; continued orderly Bank of Japan normalization; and continued strong performance at Morgan Stanley.
Methodology, sourcing, and data-quality flags
This research draws on primary SEC filings (MUFG’s Form 6-K containing its fiscal 2026 Consolidated Summary Report, filed May 15, 2026, and its Form 20-F for fiscal 2025, filed July 7, 2025, both pulled directly from EDGAR), a market-data vendor (stockanalysis.com, used for MUFG’s and its peers’ current price, market cap, and multiples, cross-checked internally against the primary filing where a figure existed on both sides), and a central-bank policy tracker (tradingeconomics.com, reporting the Bank of Japan’s own June 2026 policy statement). Of the load-bearing claims recorded for this piece, 25 were verified directly against a primary or internally-consistent source and 2 were disputed across sources and are presented here as ranges with the safer framing explained; none were left unverified as a bare fact.
Here is the full five-factor research read behind the Hold rating, in plain terms. On valuation, MUFG’s 15.15-times trailing and 13.91-times forward earnings multiples sit comfortably inside the peer band, and its roughly 1.7-times price-to-book is a real re-rating from Japanese banks’ historic sub-1x norm, but it is not obviously stretched against an 11.34 percent and rising return on equity, and the sell-side’s own average target sits essentially at the current price. This reads as fair value, not a clear discount or premium. On growth, fiscal 2026 profit grew 30.3 percent and management’s own target implies roughly 11 percent further growth, both genuinely strong, though a meaningful share of that growth reflects rate repricing, a credit-cost base effect, and a Morgan Stanley-driven swing rather than clean organic volume growth in a demographically shrinking home market, netting to a real but not fully clean growth story. On quality, an 11.34 percent and rising return on equity, led by the largest single profit segment in Japanese Corporate & Investment Banking across a diversified six-segment mix, are genuine positives, tempered by a fiscal 2026 operating loss in Global Markets and credit costs nearly quadrupling off a low base. On risk, the capital ratio falling roughly 170 basis points in a single fiscal year, a two-thirds-Japan balance sheet sitting inside a demographically aging economy, and a Morgan Stanley stake MUFG’s own filings name as a risk in its own right are real, sourced concerns, the factor where the bear case is most concrete. On momentum, a lightly weighted, soft signal: the stock sits near the top of its 52-week range with a low beta and a recent bullish sell-side initiation, offset by an official two-analyst consensus of Hold with a target essentially at the current price.
Taken together, the read lands at Hold: a genuinely improved, faster-growing Japanese megabank riding a real rate-normalization tailwind, priced roughly in line with that improvement rather than at either a discount or a premium, with a capital ratio moving the wrong direction in its best profit year in a generation. This is a labeled research signal, not personalized investment advice. What would move it toward Buy: the CET1 ratio stabilizing over the next two or three quarters, or a cleaner read on credit-cost normalization. What would move it toward Sell: a further CET1 decline or a renewed credit-cost acceleration.
Data-quality flags:
- MUFG’s price-to-book multiple is a narrow, immaterial DISPUTED range: a market-data vendor’s figure (1.66 times) versus a figure derived directly from the primary filing (1.70 times), a gap likely explained by FX-timing and share-count-basis differences rather than a real disagreement. This piece uses “roughly 1.7 times” throughout.
- MUFG’s vendor-displayed dividend yield looks stale or wrong. The market-data vendor shows a trailing yield of just 0.92 percent; the primary-filing-derived figure, translating MUFG’s actual 86-yen fiscal 2026 dividend at the current spot rate, is closer to 2.6 percent trailing and 2.9 percent forward. This article uses the primary-filing-derived figure throughout and flags the vendor figure as a data-quality issue, not a fact about MUFG’s actual payout. The same caveat likely, but unverified here, applies to SMFG’s and Mizuho’s own vendor-displayed yields.
- Peer filing depth is a genuine, acknowledged gap. SMFG’s and Mizuho’s own capital ratios, segment mix, and disclosed risk factors were not independently read at the same filing-level depth as MUFG’s in this piece; their figures used here come from a market-data vendor rather than each company’s own annual report.
- MUFG’s institutional and insider ownership picture is not sourced in this piece. Japan’s disclosure regime for major shareholders and insider transactions differs from the US Form 4 and 13F system, and this analytical leg is an acknowledged gap rather than a guessed-at figure.
- The fiscal 2026 segment table used in this piece is MUFG Bank plus MUFG Trust and Banking combined on a managerial basis, not the full MUFG-consolidated segment note that will appear once the fiscal 2026 Form 20-F is filed; the two should track closely but are not proven identical here.
- Every forward figure in this piece, MUFG’s fiscal 2027 profit target, its fiscal 2027 dividend forecast, and every scenario level in the outlook section above, is a management target or this article’s own illustrative arithmetic, not a third-party consensus forecast and never a price target.
- All prices, market caps, multiples, and yields in this piece are point-in-time as of July 2, 2026, and move daily; anyone reading this later should treat every dollar figure as a dated snapshot, not a current quote.
Key sources: Mitsubishi UFJ Financial Group, Inc. Form 6-K containing the Consolidated Summary Report for the fiscal year ended March 31, 2026 (filed May 15, 2026, SEC EDGAR); Mitsubishi UFJ Financial Group, Inc. Form 20-F for the fiscal year ended March 31, 2025 (filed July 7, 2025, SEC EDGAR); stockanalysis.com (MUFG, SMFG, MFG, JPM, and HSBC market data, July 2, 2026); tradingeconomics.com (Bank of Japan policy rate); open.er-api.com (USD/JPY spot reference rate).
Prepared July 2, 2026. Figures are point-in-time and will change. This is research and analysis for educational purposes, not investment advice, not a recommendation, and not a solicitation. Bank stocks carry credit, rate, and regulatory-capital risk that can move fast, and a Japan-based ADR like this one adds currency risk and a foreign-issuer filing regime most US-only bank stocks do not carry. Verify all figures independently and consult a licensed financial advisor before making any decision.