
Research date: June 30, 2026 | OSINT market research on HSBC Holdings plc (NYSE: HSBC), the London-headquartered, Hong Kong-anchored global bank
Important disclaimer. This is OSINT-based research and educational analysis, not investment advice. I am not a financial advisor. Nothing here is a recommendation to buy or sell any security, and the scenarios below are illustrative, not price targets. Bank stocks carry credit, rate, and regulatory-capital risk that can move a share price fast and hard, and HSBC’s mix of Hong Kong/mainland China exposure and US-UK-China geopolitical positioning adds a layer most domestic banks do not carry. Market caps, prices, valuation multiples, and market-share figures are point-in-time (June 30, 2026), press-reported where noted, and move fast. Do your own due diligence and consult a licensed advisor.
One housekeeping note before anything else: HSBC Holdings plc trades in three places at once. The ordinary shares list primarily on the London Stock Exchange (HSBA.L) and the Hong Kong Stock Exchange (0005.HK), which is where most of the real trading volume sits. The NYSE ticker used throughout this piece, HSBC, is a sponsored American Depositary Receipt, and one ADS equals five ordinary shares. Every dollar figure below is in ADR terms unless stated otherwise. The whole-company market capitalization, roughly $326 billion as of June 30, 2026, is the entire firm across all three listings, not just the slice that trades as ADRs in New York. For a US retail investor the practical takeaway is simple: you buy this stock through the NYSE ADR under ticker HSBC in any ordinary US brokerage account, since one ADS converts to five ordinary shares, but the deeper, more liquid trading actually happens in London and Hong Kong, not New York.
Where this stock could be in 6 months, 1 year, 3 years, and 5 years
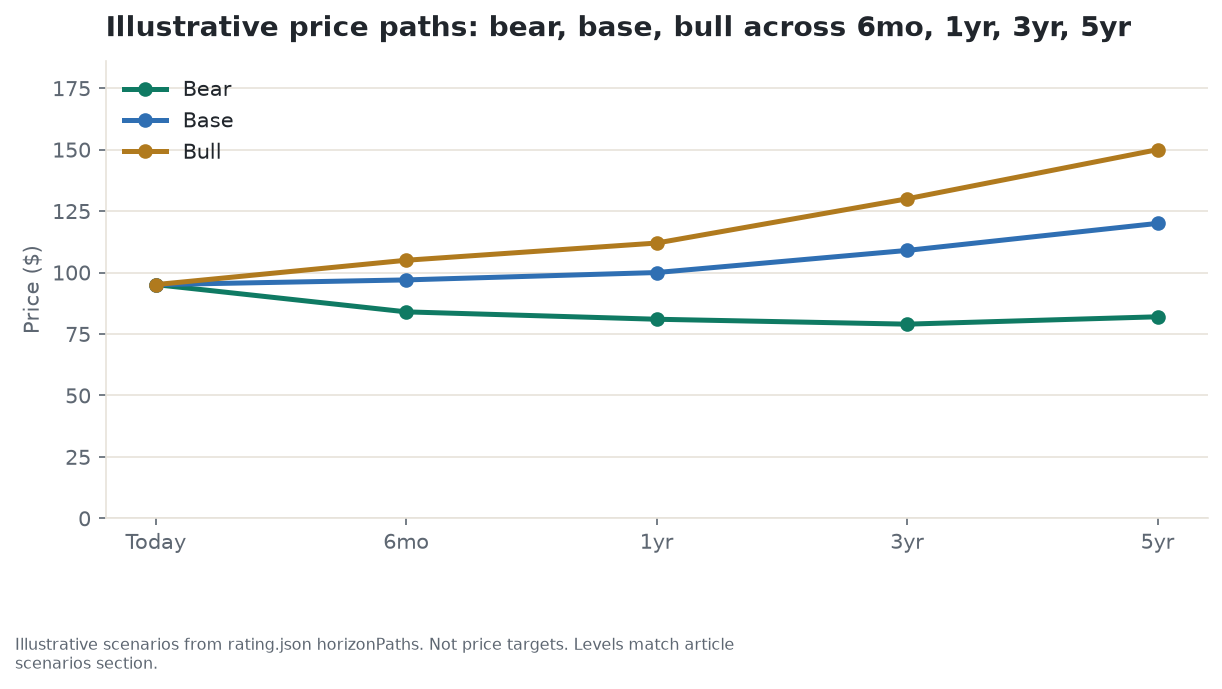
Six months. This window is decided by the next two earnings prints, not by anything structural. HSBC reports Q2 2026 in early August and Q3 2026 in late October, and the single number that matters most is the credit-loss charge against management’s own 45-basis-point guide for the year. The stock is already sitting near the top of its 52-week range of $59.92 to $96.90, with the sell side clustered in a Hold-to-Buy range and single-digit upside on paper, so the base case is roughly flat to slightly up, around $97, with the roughly 3.9 percent dividend doing most of the work. A clean beat on net interest income and wealth fees, paired with any hint of when the paused buyback restarts, is the bull path to about $105. The bear path, to about $84, is a repeat of what happened on May 5, 2026: HSBC’s Q1 results showed a credit-loss charge $400 million above the prior year, and the ADR fell roughly 5 percent in a single session even though revenue grew. The thing to watch here is simple: the quarterly expected-credit-loss number, against 45 basis points.
One year. Over twelve months the dominant variable shifts to whether HSBC’s core capital ratio has rebuilt enough for the paused share buyback to restart, set against the timing of a first US and Hong Kong rate cut and whether return on tangible equity holds near management’s 17 percent floor. The base case, around $100, has capital adequacy grinding back into range, returns holding near target, and a buyback resuming late in the year and modestly. The bull case, around $112, has the buyback back on schedule at something closer to its old pace, with returns still comfortably above 17 percent and the current valuation multiple intact. The bear case, around $81, has a first rate cut landing alongside rising credit costs, pulling returns toward the mid-teens and starting the process of the market marking the stock down to a cheaper multiple. Watch the quarterly buyback decision and the direction of the return-on-equity line.
Three years. By year three the structural pieces of the story start to matter more than any single quarter. HSBC’s interest-rate hedge, a multi-year portfolio built to smooth the swings in short-term rates, is approaching the point where its easiest reinvestment gains have already been banked and the tailwind begins to fade. The question becomes whether wealth-management fee income, which grew about 24 percent in 2025 to $9.4 billion, has scaled enough to pick up the slack. The base case, around $109, has a more fee-diversified bank holding a return in the high teens on a slightly lower valuation multiple than today. The bull case, around $130, has the wealth engine visibly carrying returns and the market rewarding that with a steady or richer multiple. The bear case, around $79, has the double hit described below already landed: a rate-cutting cycle compressing the lending margin at the same time Hong Kong and mainland China property credit losses are still rising, forcing the valuation multiple down. The signal to track is whether wealth-fee growth is outpacing the fading rate tailwind.
Five years. This is almost entirely a question about durability: is a 17-percent-plus return on tangible equity a real floor for this business, or a plateau produced by an unusually favorable few years of rates and hedge reinvestment. The base case lands near $120, the bull case near $150, and the bear case near $82, with dividends of roughly 3.9 percent a year layered on top of all three and not included in the price levels themselves. The decisive test comes once the rate-hedge tailwind is mostly gone, sometime around 2028 or 2029, and the bank has to earn its return the harder way, from deposits, fees, and disciplined lending rather than a favorable reinvestment schedule.
Where the read lands today. On balance the read holds at Hold, sitting at the top of that band and close to an upgrade: HSBC has genuinely turned into a well-run, high-returning Asia-wealth bank with a deposit franchise few competitors can match, and it pays a real dividend for the wait. But it is already priced for a lot of that improvement, close to its 52-week high, and the mechanism that supercharged the per-share story for the last three years, the buyback, is switched off while capital rebuilds. The practical way to hold this name right now is to own it for the yield, the franchise, and the option on Asia wealth compounding, without chasing it higher at the top of its range; get more constructive, toward an upgrade, if the buyback restarts alongside a real pullback in price; and get more cautious, toward a downgrade, if a rate-cutting cycle and a fresh wave of Hong Kong or China property credit losses show up together, which is the one combination most likely to break the thesis.
Companion tool
Jump to the interactive dashboard to sort and filter every company in this piece, or download the Excel model to flex the scenarios yourself.
TL;DR
HSBC has spent the last three years turning a chronically cheap, structurally messy global bank into a genuinely improved one: a four-business reorganization (Hong Kong, UK, Corporate and Institutional Banking, and International Wealth and Premier Banking), a return on tangible equity that has climbed from the mid-teens to 17.2 percent excluding one-off items in 2025 and 18.7 percent in the first quarter of 2026, an unmatched low-cost deposit and wealth franchise across Hong Kong and Asia, and roughly $8 billion a year of share buybacks that shrank the share count about 10 percent between 2023 and 2025. The market has paid up for it: the ADR has returned about 64 percent over the past year including dividends, and the stock now trades near 2.0 times tangible book value, a level that would have been unthinkable for most of the 2010s, when HSBC traded below tangible book. That is the setup, and it is also the problem. The easy re-rating money, going from a discount to roughly parity with peers, has largely been made, and consensus price targets cluster only modestly above today’s level. Meanwhile the buyback, the mechanical engine behind a chunk of that re-rating, is paused: HSBC spent about $13.7 billion buying out the Hong Kong-listed minority stake in its Hang Seng Bank subsidiary in January 2026, which pushed its core capital ratio down to the bottom of its target range, and management has said buybacks will not resume until that ratio rebuilds. The single biggest swing factor from here is whether a Fed and Hong Kong Monetary Authority rate-cutting cycle, which would compress the bank’s most profitable lending margins, arrives at the same time as a further leg of credit losses in Hong Kong and mainland China commercial real estate, where roughly $5.8 billion of exposure and $1.65 billion of already-impaired loans sit on a franchise that generates two-thirds of group profit through a single legal entity. Both risks run through the same Hong Kong engine that makes the bank so profitable in the first place, which is the crux of the bear case laid out in full below.
Terms you’ll see in this piece
A handful of banking terms carry the whole argument, so it is worth defining them once, plainly, before the details pile up. RoTE (return on tangible equity) is profit measured as a percentage of the shareholders’ money the bank actually works with; it is the single best answer to “how hard is this bank making its capital work,” and higher is better. Tangible book value, sometimes written TNAV, is the net worth of the bank after stripping out goodwill and other intangibles that could not actually be sold off in a crunch; banks are typically valued as a multiple of this figure, written P/TBV. NII (net interest income) is the spread the bank earns between what it pays depositors and what it collects on loans and investments, the core “lending” profit. CET1 is the core regulatory capital ratio, the loss-absorbing cushion regulators require every bank to hold as a percentage of its risk-weighted assets; a healthy cushion lets a bank absorb bad loans without needing a bailout. ECL (expected credit losses) and impairment describe the same idea: when the bank believes a borrower may not fully repay a loan, accounting rules require it to set aside cash against that expected loss, called a provision, and a loan in this state is described as “impaired.” That provision is a direct charge against profit, so rising impairments mean lower earnings, full stop. CRE is simply commercial real estate, meaning loans secured against office towers, retail space, and other income-producing property rather than homes.
Explore it yourself: the interactive dashboard
Open the dashboard in a full screen
What HSBC actually does
Strip away the acronyms and HSBC is one of the last banks left that genuinely straddles the West and Asia at scale. It began in 1865 as the Hongkong and Shanghai Banking Corporation, built to finance trade between China and the rest of the world, and 160 years later that is still, in essence, the job: gather deposits and manage wealth in Hong Kong and across Asia, the Middle East, and the UK, then use that base to fund loans, facilitate trade, and manage money for households and companies that need to move value across borders.
Since January 2025 the bank has organized itself into four businesses that map directly onto where the money comes from. Hong Kong is the historic core, a business segment that on its own produced 32.0 percent of the group’s profit before tax in 2025. UK is the legally separate, ring-fenced retail and commercial bank that serves British households and small businesses, the kind of “boring domestic bank” segment that regulators require HSBC to wall off from its riskier wholesale activities. Corporate and Institutional Banking, usually shortened to CIB, is the wholesale engine: trade finance, cash management, markets, and banking for multinational companies, and at 38.1 percent of group profit before tax it is actually the single largest segment by that measure, even though its business is booked globally rather than tied to one geography. International Wealth and Premier Banking, IWPB, is the newer combined global wealth business, bringing together retail wealth management, insurance, asset management, and private banking under one roof, contributing 14.6 percent of profit before tax and growing its fee income about 24 percent in 2025.
There is a second, equally important way to slice HSBC’s profit that the company discloses separately from those four business segments: by legal entity. On that cut, The Hongkong and Shanghai Banking Corporation Limited, the licensed bank that houses the bulk of HSBC’s Hong Kong and wider Asian business, generated 65.5 percent of the entire group’s profit before tax in 2025. That is a different, wider number than the 32.0 percent “Hong Kong segment” figure above, because it captures CIB and IWPB business that is booked through the Hong Kong legal entity even though it is reported under other segments. Both numbers are real and both matter, and they should not be confused with each other: one shows how the bank organizes and reports its business lines, the other shows where the actual banking license, balance sheet, and regulatory capital physically sit. However you cut it, the conclusion is the same. HSBC’s fortunes are tied overwhelmingly to Hong Kong. That concentration cuts both ways at once: Hong Kong is simultaneously HSBC’s defining moat, the single most profitable, lowest-cost-funded business the bank runs, and its defining vulnerability, because the same rate exposure and the same stressed property-credit book are stacked on top of one another inside one legal entity in one jurisdiction rather than spread across several.
The rest of the group is a mix of a large, lower-return UK retail and commercial bank, a genuinely global trade-finance and markets business, and a long tail of smaller, sub-scale operations that management has been quietly exiting. In the past two years HSBC has sold its Canada retail bank to Royal Bank of Canada, exited France retail banking and its Argentina business, sold its UK life-insurance unit to Chesnara, transferred its South Africa business to FirstRand, sold its Sri Lanka retail bank to Nations Trust Bank, and signed an agreement to sell its Indonesia retail and wealth business to a subsidiary of OCBC, with completion expected in the first half of 2027. Reviews of the Australia and Egypt retail businesses and HSBC Life Singapore are ongoing with no decision made. The pattern is consistent across every one of these moves: exit sub-scale Western and non-core Asian retail franchises, and redeploy the capital and management attention into Hong Kong, Asian wealth, and transaction banking, the businesses where HSBC actually has a structural edge.
How the money flows
flowchart TD
    TOP["Depositors and clients: about $1.8 trillion in customer deposits, FY2025"]
    TOP --> HK["Hong Kong segment: 32.0% of FY2025 group profit before tax"]
    TOP --> UK["UK ring-fenced bank: HSBC UK Bank plc"]
    TOP --> CIB["CIB: $27.6bn revenue, $11.4bn profit before tax, 38.1% of group"]
    TOP --> IWPB["IWPB: $14.5bn revenue, $9.4bn wealth fees, up 24% in 2025"]

    HK --> NII["Net interest income: $34.8bn group NII, about half of revenue"]
    UK --> NII
    CIB --> NII
    CIB --> FEE["Fee income: trade finance, FX, markets"]
    IWPB --> FEE
    IWPB --> WEALTH["Wealth and insurance: $2.1 trillion balances, over $1 trillion in Asia"]

    NII --> REV["Group revenue: $68.3bn, up 4% year on year"]
    FEE --> REV
    WEALTH --> REV

    REV --> COSTS["Costs and credit provisions, including Hong Kong CRE charge of $0.7bn"]
    COSTS --> PBT["Profit before tax: $29.9bn reported"]

    PBT --> HBAP["Legal entity view: Hongkong and Shanghai Banking Corp = 65.5% of group PBT"]
    PBT --> CET1["CET1 capital ratio: 14.0% at Q1 2026, bottom of the 14.0-14.5% target band"]
    CET1 --> REG["Regulators: Bank of England and PRA (UK), HKMA (Hong Kong), FSB G-SIB bucket 3"]
    CET1 --> RETURN["Capital return: $0.75/share FY2025 dividend; buybacks paused until CET1 rebuilds"]

    REG -.-> CET1
Read this top to bottom and the whole business model is one sentence: cheap deposits fund a spread business and a fee business, both concentrated in Hong Kong, and what is left after costs and credit losses gets rationed by a regulatory capital ratio before any of it reaches shareholders.
The raw input, at the top, is roughly $1.8 trillion of customer deposits, overwhelmingly cheap current accounts and savings balances concentrated in Hong Kong and mainland China-linked trade relationships, topped up by UK retail deposits and wealth deposits from clients across the Middle East, India, and Southeast Asia. That deposit base then splits into two channels. The bigger one, net interest income, is what HSBC earns lending that money out or investing the portion it cannot profitably lend into a multi-year hedge portfolio: $34.8 billion in 2025, or roughly half of total group revenue. The second channel is fee income earned without HSBC extending its own balance sheet at all: wealth-management and insurance fees on that $2.1 trillion of client wealth balances, trade-finance and cash-management fees on hundreds of billions of dollars of trade flows the bank facilitates each year, and markets and foreign-exchange income from being the counterparty of choice for companies moving money across the currency pairs, renminbi, Hong Kong dollar, US dollar, and sterling, that sit astride HSBC’s network.
Both channels converge into $68.3 billion of group revenue, out of which HSBC pays for the machine itself (technology, compliance, headcount, an ongoing cost-cutting program) and sets aside credit provisions for loans that sour, a genuinely live issue right now in Hong Kong commercial real estate. What survives becomes $29.9 billion of profit before tax. From there, two-thirds of it flows through a single legal entity, the Hong Kong-domiciled banking subsidiary, which is both the reason HSBC is so profitable and the reason its risk is so concentrated. Everything that comes after is gated by a single number regulators watch closely, the core capital ratio, sitting at 14.0 percent as of the first quarter of 2026, the bottom edge of management’s own 14.0-to-14.5-percent target range. That ratio is the valve. When it is comfortably inside the range, HSBC pays a dividend and buys back stock. When it gets pushed toward the floor, as it just did after HSBC spent roughly $13.7 billion buying out the minority stake in Hang Seng Bank, the dividend continues but the buyback stops until the ratio rebuilds. Understanding HSBC as an investment is mostly about understanding which parts of this diagram are durable (the Hong Kong deposit base, the wealth and trade-finance fee engine) and which parts are cyclical and can reverse quickly (the lending spread, which tracks central-bank rates, and the credit-provision line, which tracks Hong Kong and China property values).
The moat, the wealth pivot, and where the money is actually made
The clearest way to think about HSBC’s economics is to separate what it does from what happens to it. What it does, and does uniquely well, is gather deposits cheaply across Hong Kong and Asia and turn wealthy and mass-affluent households into long-term fee relationships. What happens to it, largely outside its control, is a function of central-bank interest rates and the health of Hong Kong and mainland China property markets.
Think of the deposit franchise the way you would think of a toll bridge with no competitor bridge nearby. Once a Hong Kong household or business has its payroll, savings, and daily banking relationship anchored at HSBC, the cost of switching (new account numbers, new standing instructions, a different mobile app, a different relationship manager who already knows your business) is high enough that HSBC can pay depositors less than a pure rate-taker would need to, simply because of that inertia. That is the actual moat: not a single product, but roughly $1.8 trillion of accumulated relationships that let HSBC fund its balance sheet more cheaply than most competitors can. A low-cost, sticky deposit base like this one means HSBC funds its lending cheaply, which widens the spread between what it pays depositors and what it earns on loans, the net interest margin, and that wider spread is what lifts returns; this is the deposit moat’s direct route into the bank’s profit and loss statement, not just an abstract advantage. On top of that sits a genuinely structural growth engine: HSBC’s wealth balances reached $2.1 trillion in 2025, more than $1 trillion of it booked in Asia, and wealth fee income grew 24 percent to $9.4 billion. This tracks a real, multi-decade trend, the accumulation of household wealth across China, Hong Kong, Singapore, India, and the Gulf, and it is the closest thing HSBC has to a business that is not hostage to the interest-rate cycle. The cost to serve a wealth relationship is mostly fixed (the branch and relationship-manager infrastructure already exists), while the revenue scales with the size of the client’s assets, which is why this is the highest-quality profit stream in the group.
Then there is the part of the business that behaves less like a moat and more like a weather system passing through. Net interest income, the spread HSBC earns between what it pays depositors and what it earns on loans and its hedge portfolio, is a direct, mechanical function of interest-rate policy in the US, UK, and Hong Kong, not of anything HSBC’s management does particularly well or badly. Because Hong Kong pegs its own dollar to the US dollar, the Hong Kong Monetary Authority has to broadly follow the Federal Reserve rather than set its own independent policy, which means HSBC’s most profitable lending margin, the Hong Kong one, cannot escape a US rate-cutting cycle even if Hong Kong’s own domestic economy would otherwise call for different policy. HSBC’s net interest margin actually widened slightly through 2025 and into 2026, to about 1.59 to 1.60 percent, not because the underlying business improved but because the bank’s roughly $593 billion structural hedge, a rolling portfolio designed to smooth out rate swings, is currently replacing maturing, low-yielding assets with new ones at higher yields: an average of about 2.7 percent for hedge assets maturing in 2026, rising to about 3.4 percent for 2027 and 3.7 percent for 2028. That is a genuine tailwind, and it is time-limited. HSBC itself says the benefit recedes from around 2028 into 2029, once the back book of low-yield legacy hedges has fully rolled off and new hedge placements start going in at whatever rates prevail by then. Put simply: today’s healthy lending margin is being flattered by a multi-year reinvestment schedule that was locked in during the high-rate years of 2023 through 2025, and that flattering effect has a known expiration window.
The weakest link, and the one moving in the wrong direction fastest, is credit risk in Hong Kong and mainland China commercial real estate. A property loan’s economics depend on the spread between what it earns and what it is expected to lose, and on that measure the picture has deteriorated sharply. Loans in HSBC’s Hong Kong commercial-real-estate book flagged as impaired or at increased credit risk reached 73 percent of that book by mid-2025, up from under 30 percent a year earlier, and mainland China commercial-real-estate exposure of $5.8 billion still carries $1.65 billion of already credit-impaired balances even after the exposure has shrunk from $7.3 billion the year before. Management responded by raising its 2026 credit-loss guidance to about 45 basis points of average loans, up from about 40 basis points. The mechanism here is simple and direct: once a loan is flagged as impaired, the bank must set aside a provision, a charge against profit, for the amount it now expects not to collect, and that provision comes straight out of earnings before it ever reaches return on tangible equity, which is exactly why rising impairments pull the return figure down even while revenue keeps growing. None of this means the loans are worthless. It does mean the margin on this part of the business, the part regulators and management watch most closely, has been narrowing for two years running while the deposit and wealth engines have been widening.
Layer the geography on top and a structural tension comes into view. HSBC’s entire value proposition for a century and a half has been sitting between Western capital and Asian growth, clearing US dollars while banking Chinese and Hong Kong counterparties. That position has repeatedly put HSBC in the crossfire of US-China friction, most visibly during the 2018-to-2021 Meng Wanzhou and Huawei affair, and it remains a live, structural fact of the business rather than a one-time event: US sanctions and export-control enforcement, Chinese regulatory goodwill, and Hong Kong Monetary Authority oversight all have to be satisfied simultaneously for HSBC to keep running its core profit engine, including the Hang Seng Bank privatization completed in January 2026. This is a disclosed risk factor in HSBC’s own regulatory filings, not a prediction that any particular political outcome will occur, and it should be read that way: a standing structural exposure the bank has managed for decades, not evidence of wrongdoing or an imminent event.
Who wins where
HSBC does not compete against one kind of bank, it competes against several different kinds at once, in different parts of its business.
In global wealth management and private banking, its main rivals are the other truly international private banks and wealth managers: UBS, Citi Private Bank, and Standard Chartered, plus increasingly capable regional players like DBS. HSBC’s edge here is scale and network breadth across Hong Kong, mainland China, the Gulf, and the UK simultaneously, a combination almost nobody else offers in one institution.
In trade finance and transaction banking, HSBC has ranked first in the Euromoney Trade Finance Survey for nine consecutive years, a customer-perception survey covering more than 13,000 businesses across over 100 countries, which is meaningful color on reputation and relationship depth even though it is not itself a hard market-share statistic. Its competitors here are Standard Chartered, DBS, and the large Chinese state banks (Industrial and Commercial Bank of China, Bank of China, China Construction Bank), which have their own deep relationships and, in the case of the Chinese banks, backing that HSBC as a foreign institution cannot match on mainland soil. That is a real, slow-moving substitution risk in China-linked trade corridors specifically, even if it has not shown up in the numbers yet.
In domestic UK retail and commercial banking, HSBC UK competes head to head with Lloyds, Barclays, and NatWest on largely commoditized terms: mortgages, current accounts, small-business lending. This is the least differentiated part of HSBC’s business and, not coincidentally, the segment with the lowest returns.
In pure balance-sheet scale and diversified global banking, the natural comparison is the large US banks, JPMorgan and Citigroup, both of which run bigger and (in JPMorgan’s case) more profitable franchises, but neither of which has HSBC’s concentrated Hong Kong and Asian deposit base or its trade-finance network. And in the specific “Asia-pivot bank trading at a re-rated multiple” story, the two closest comparisons are Standard Chartered, a UK-listed bank with an even more concentrated emerging-markets and Asia focus but smaller scale, and DBS Group, Singapore’s largest bank, which has quietly closed much of the profitability gap with HSBC in Asian wealth and transaction banking and now trades at the richest valuation multiple in this entire peer set.
The commodity fringe, where nobody has real pricing power, is retail and small-business deposit-taking against a backdrop of policy rates set by central banks. The genuine toll-takers are the wealth-management and trade-finance franchises, where switching costs and network depth let the leaders (HSBC, Standard Chartered, DBS, the big US banks) earn a premium that a smaller domestic-only competitor cannot.
Company by company: who’s who
HSBC Holdings plc (NYSE ADR: HSBC; primary listings HSBA.L on the LSE and 0005.HK on the HKEX), market capitalization approximately $326 billion as of July 1, 2026 (whole company, across all three listings). The dominant trade-finance and wealth franchise across Hong Kong and Asia gives HSBC a network moat that Western banks cannot easily replicate, and it still returns a meaningful share of capital to shareholders through dividends, even with the buyback paused. Bull: the largest, lowest-cost Asian deposit and wealth franchise of any global bank, with returns on tangible equity now running comfortably above 17 percent. Bear: it is exposed to Hong Kong and mainland China property credit and to US-China geopolitical friction at the same time, credit costs are rising faster than revenue right now, the buyback that helped drive the re-rating is currently paused, and the stock trades under three different tickers with no single simple US listing, a genuine access friction for American retail investors.
Standard Chartered PLC (LSE: STAN.L; thin US OTC ADR: SCBFF/SCBFY, 1 ADR = 1 ordinary share), market capitalization approximately GBP 44.4 billion, or roughly $58.8 billion at a GBP/USD rate near 1.325. The most direct pure-play read on Asia, Africa, and Middle East trade and wealth flows among UK-listed banks, with an aggressive multi-year buyback program of its own. Bull: cheaper on book value than HSBC and a purer play on the same emerging-markets and Asia thesis. Bear: Standard Chartered’s own stock has already returned somewhere between 58 and 67 percent over the past year depending on the data source, meaning much of its own re-rating has already happened too, and its US OTC ADR line is thin, with wider spreads than a US-listed common stock.
JPMorgan Chase & Co. (NYSE: JPM), market capitalization approximately $877.1 billion. The largest US bank by assets and market value, used here as the benchmark for what a best-in-class, fully priced global bank looks like. Q1 2026 net income was $16.5 billion, up 13 percent year over year, with a return on tangible common equity of 23 percent. Bull: unmatched scale, diversification, and a return profile no other bank in this set can match. Bear: it already trades at about 2.87 times tangible book value, 44 percent above its own ten-year median, priced for continued perfection with very little re-rating left to capture, just compounding.
Citigroup Inc. (NYSE: C), market capitalization approximately $238.7 billion. The US bank with the closest network overlap to HSBC, running a genuine international consumer and transaction-services footprint alongside a multi-year turnaround under CEO Jane Fraser. Q1 2026 net income was $5.8 billion, up 42 percent year over year, with return on tangible common equity of 13.1 percent, its highest markets-revenue quarter in a decade. Bull: the turnaround is showing up in the numbers and Citigroup trades at the cheapest book multiple of the US majors, about 1.41 times tangible book. Bear: it remains the return laggard among large US banks and its multi-year restructuring, including separating the Mexican Banamex business, still carries execution risk.
DBS Group Holdings Ltd (SGX: D05.SI; US OTC ADR: DBSDY), market capitalization approximately SGD 185.75 billion, or roughly $140.5 billion. Singapore’s largest bank and the best-run large bank in Southeast Asia, with record wealth-management fee income and a return on equity of 17.0 percent in the first quarter of 2026. Bull: a fortress balance sheet and genuine growth exposure to Asian wealth accumulation over the next decade. Bear: concentrated almost entirely in one country and currency, so it carries more single-market risk than HSBC’s broader footprint, and its US ADR is thin.
Barclays PLC (NYSE ADR: BCS; primary listing LSE: BARC.L), market capitalization approximately $90.7 billion. A UK universal bank with a large investment bank and US consumer-cards business, and far less Asia exposure than HSBC or Standard Chartered. Bull: investment-bank momentum and an ongoing buyback are re-rating the stock off a historically cheap UK-bank multiple. Bear: rising impairment charges show credit normalization is starting to bite, and Barclays has the least Asian growth exposure of this entire peer set.
Lloyds Banking Group plc (NYSE ADR: LYG; primary listing LSE: LLOY.L), market capitalization approximately GBP 64.4 billion, or roughly $85.4 billion. The UK’s largest purely domestic retail and commercial bank, with essentially zero Asia exposure, included here as the counterpoint to HSBC’s international model. Bull: a pure UK rate-cycle and mortgage-market recovery story with strong capital return. Bear: zero international diversification means it lives or dies entirely on UK growth and Bank of England policy, and a motor-finance compensation scheme remains a lingering tail risk.
Industrial and Commercial Bank of China Ltd (HKEX: 1398.HK) and China Construction Bank Corp (HKEX: 0939.HK), market capitalizations of roughly $292.2 billion and $395.4 billion respectively, are included here only as scale context for the state-controlled Chinese banking system HSBC operates alongside in Hong Kong and mainland China, not as direct business-model peers. Their most recent quarterly results were not independently verified in this research pass and should be treated as unconfirmed for any detailed comparison. Bull: unmatched balance-sheet scale and state backing. Bear: opaque asset quality, particularly in property-sector exposure, and essentially closed to normal US retail investors, since their US over-the-counter lines are extremely thin.
What the filings say
HSBC reports under IFRS as a foreign private issuer, filing an annual Form 20-F and periodic Form 6-Ks with the SEC rather than the 10-K and 10-Q that US domestic companies file. This section draws on the FY2025 Form 20-F Annual Report (filed February 26, 2026), the FY2025 earnings release (filed February 25, 2026), and the first-quarter 2026 earnings release (filed May 5, 2026), all pulled directly from EDGAR.
Income statement. Full-year 2025 revenue, what HSBC calls net operating income before credit losses, was $68.3 billion, up 4 percent year over year. Reported profit before tax was $29.9 billion, down $2.4 billion from 2024, almost entirely because of a $4.9 billion adverse swing in what the company calls “notable items,” one-off charges and gains that distort the year-over-year comparison. Strip those out and the picture looks very different: profit before tax excluding notable items hit a record $36.6 billion, up 7 percent, and return on tangible equity excluding notable items was 17.2 percent, up 1.6 percentage points from 2024 and above the prior “mid-teens” target management had set for 2025 through 2027. Reported profit after tax was $23.1 billion. The cost-efficiency ratio, operating expenses as a share of revenue, rose to 53.4 percent in 2025 from 50.2 percent in 2024, as operating expenses grew 10 percent to $36.4 billion, driven by $3.0 billion of one-off items (legal provisions, restructuring costs, and disposal costs) on top of planned technology investment and performance pay. Net interest margin was 1.59 percent, up 3 basis points. In the first quarter of 2026, revenue was $18.6 billion, up 6 percent year over year, reported profit before tax was $9.4 billion, essentially flat, and profit before tax excluding notable items was $10.1 billion. Reported return on tangible equity was 17.3 percent, and 18.7 percent excluding notable items, up 0.3 percentage points from a year earlier. As CEO Georges Elhedery put it on the earnings call, “each of our four businesses contributed to firm-wide revenue growth and each delivered an annualised RoTE in excess of 17%, excluding notable items.”
Segments and geography. On a constant-currency basis, the four business segments split 2025 profit before tax as follows: CIB, $27.6 billion of revenue and $11.4 billion of profit before tax, 38.1 percent of the group total; Hong Kong, $15.9 billion of revenue and $9.6 billion of profit before tax, 32.0 percent; UK, $12.9 billion of revenue and $6.7 billion of profit before tax, 22.4 percent; IWPB, $14.5 billion of revenue and $4.4 billion of profit before tax, 14.6 percent; with Corporate Centre a $2.1 billion drag, negative 7.1 percent, absorbing interest-rate and legacy items. On the separate legal-entity view HSBC discloses, The Hongkong and Shanghai Banking Corporation Limited alone generated 65.5 percent of group profit before tax in 2025, versus 24.8 percent for HSBC UK Bank plc, a small loss for HSBC Bank plc in Continental Europe, and smaller contributions from the Middle East, North America, and Mexico. That 65.5 percent legal-entity figure and the 32.0 percent Hong Kong segment figure measure different things (one is a management-reporting business line, the other is where the actual licensed bank and its balance sheet sit) and both belong in any honest picture of HSBC’s geographic concentration.
Net interest income was $34.8 billion in 2025, up $2.1 billion, or roughly half of total group revenue; on HSBC’s own preferred non-GAAP measure, “banking NII” (which strips out internal funding-cost noise), the figure was $44.1 billion, up $0.3 billion. In the first quarter of 2026, fee and other income grew faster than net interest income, up 10 percent year over year to $7.9 billion on strong wealth performance, versus 6 percent growth in banking NII to $11.3 billion, a sign the wealth-fee engine is currently the more dynamic of the two revenue streams.
Balance sheet. Total assets were $3.233 trillion at the end of 2025, rising to roughly $3.3 trillion by the end of the first quarter of 2026. Net loans to customers were $988.4 billion at year-end 2025, rising to $1.002 trillion by March 2026; customer accounts were $1.787 trillion at year-end, dipping modestly to $1.782 trillion by March on foreign-exchange effects and a reclassification of the Malta business, though on a constant-currency basis deposits were actually up $9.2 billion quarter over quarter. HSBC’s loan-to-deposit ratio of 56 percent is conservative, meaning the bank funds itself comfortably from customer deposits rather than relying on wholesale markets. The core capital ratio, CET1, was 14.9 percent at year-end 2025, flat versus 2024, then fell to 14.0 percent by the end of the first quarter of 2026, a 0.9 percentage-point drop driven mainly by the roughly 110-basis-point net negative capital impact of completing the Hang Seng Bank privatization in January 2026. Tangible net asset value per ordinary share was $9.64 at year-end 2025 and $9.46 at the end of the first quarter of 2026.
Capital returns and share count. The full-year 2025 ordinary dividend was $0.75 per share, targeting a 50 percent payout ratio, down from $0.87 per share in 2024, but that 2024 figure included a $0.21-per-share special dividend paid from the proceeds of selling HSBC’s Canadian banking business to Royal Bank of Canada. Strip that special dividend out and the underlying 2024 ordinary dividend was $0.66 per share, meaning 2025’s $0.75 is actually a genuine increase in the recurring payout, not a cut. HSBC executed $8 billion of share buybacks across three tranches during 2025 ($2.0 billion announced in February, $3.0 billion in May, and $3.0 billion in July), part of a multi-year program that helped shrink the basic share count from about 19.0 billion in 2023 to about 17.1 billion in 2025, roughly a 10 percent reduction. Management separately frames $6 billion of that spending, plus $12.9 billion of dividends, as “$18.9 billion in respect of 2025” total shareholder distributions, a framing that excludes the February tranche, which the company attributes to 2024’s results even though the cash was spent in 2025. Both the $8 billion and $6 billion figures are accurate; they are simply measuring different things, and a reader should know which one is being cited.
Critically, no new buyback was announced with the first-quarter 2026 results, and management stated explicitly it will not recommence buybacks until the core capital ratio is restored within its 14.0-to-14.5-percent target range, a decision to be reassessed every quarter. The first interim dividend for 2026, $0.10 per share, was approved on May 5, 2026, and the share count was roughly flat quarter over quarter at 17.16 billion shares, consistent with buybacks being off. Readers should note that a widely circulated report of a “$3 billion buyback announced with Q1 2026 results” refers to a different event entirely: a South China Morning Post article describing HSBC’s first-quarter 2025 results, a full year earlier. The current buyback yield is effectively zero.
Guidance. With its full-year 2025 results, management raised its medium-term return target from “mid-teens” to “17 percent or better, excluding notable items, in each year from 2026 to 2028,” alongside a target of growing revenue year over year over the same period, rising to 5 percent by 2028. It also guided to at least $45 billion of banking net interest income for 2026 and roughly 40 basis points of credit losses on average loans. With the first-quarter 2026 results, both of those guides were revised: banking net interest income guidance was raised to around $46 billion, reflecting an improved rate outlook, while credit-loss guidance was raised to around 45 basis points, reflecting the Middle East conflict that began February 28, 2026 and a UK fraud-related charge. Management reaffirmed the 17-percent-or-better return target but also explicitly flagged that a combination of stress scenarios (an oil-price spike, inflation, a GDP slowdown, higher unemployment) “could bring RoTE excluding notable items below our 17% or better target in 2026” if those risks materialize together and are not offset. The $1.5 billion annualized cost-savings target from HSBC’s organizational-simplification program is now expected to be achieved by the end of June 2026, six months ahead of the original schedule, with a further roughly $1.8 billion of costs targeted for redeployment from non-strategic activities into higher-return areas over the medium term.
Disclosed risk factors, in HSBC’s own words. From the 2025 Form 20-F risk-factors section: on macroeconomic and geopolitical risk, “economic and market conditions and geopolitical developments may adversely affect our financial condition and results,” noting that “the volatility of US trade and tariff policies remains a key source of uncertainty” and that a “broader escalation of tariffs, and a potential trade war remain a risk.” On Hong Kong and mainland China commercial real estate specifically, HSBC states it “continue[s] to closely monitor market conditions” and that “recovery is likely to take time, with liquidity and valuation pressures expected to continue.” This is not abstract language: total mainland China commercial-real-estate exposure was $5.8 billion at the end of 2025, down from $7.3 billion a year earlier, but still carrying 17.6 percent overall credit-loss coverage and 37.0 percent coverage on the specifically Hong Kong-booked portion of that book, where $1.65 billion of the total is already classified as credit-impaired. Credit-loss charges tied to this book in 2025 were $0.7 billion in Hong Kong and $0.2 billion in mainland China. On financial-crime and conduct risk, this crystallized concretely in the first quarter of 2026: a $0.4 billion credit-loss charge tied to a fraud-related securitization exposure involving a UK financial sponsor inside the CIB business, on top of $1.4 billion of legal provisions booked as a 2025 notable item.
Recent material events. HSBC completed the privatization of Hang Seng Bank on January 26, 2026, buying out roughly 36 percent of minority shareholders for approximately $13.6 to $13.7 billion (a HK$290 billion full valuation), delisting the Hong Kong-listed subsidiary the following day. The strategic logic is straightforward: as a partially owned associate, a meaningful slice of Hang Seng’s profit leaked out to minority shareholders every year, so buying in the remaining stake lets HSBC keep all of that profit itself and run the two banks as one simplified, fully consolidated operation instead of two overlapping ones. The tradeoff is just as real: that same move takes Hong Kong commercial-real-estate credit risk that used to be partly shared with outside minority shareholders and puts all of it squarely onto HSBC’s own balance sheet, consuming capital in the process, which is the direct reason the buyback is paused today. The deal cost about 110 basis points of core capital and is expected to generate roughly $0.5 billion of pre-tax revenue and cost synergies by the end of 2028, plus a further roughly $0.4 billion opportunity, against approximately $0.6 billion of expected restructuring costs. Separately, HSBC’s associate stake in Bank of Communications, a large Chinese lender, was diluted from 19.03 percent to 16.00 percent during 2025, generating a combined $2.1 billion charge (a $1.1 billion dilution loss plus a $1.0 billion impairment) booked as a 2025 notable item, a clean example of how China-linked equity holdings can hit HSBC’s results directly and all at once. The Middle East conflict that began February 28, 2026 was cited directly by management as a driver of the first-quarter 2026 credit-loss increase.
Ownership. Per HSBC’s substantial-shareholder register under Hong Kong securities law, disclosed in the 2025 Form 20-F as of December 31, 2025: BlackRock, Inc. holds the largest disclosed institutional long position, about 9.09 percent, per a filing dated July 16, 2025. Ping An Asset Management, part of Ping An Insurance Group and HSBC’s best-known activist shareholder, holds the next-largest disclosed stake, about 7.98 percent, per a filing dated May 10, 2024, the most recent notifiable filing on record for that holder. Because UK and Hong Kong disclosure rules only require a fresh filing when a shareholder crosses a reporting threshold, Ping An’s actual current stake could have moved without triggering a new notice, so 7.98 percent should be read as the last confirmed data point, not a live number. Ping An pushed publicly for HSBC to split its Asian and Western operations into two separate companies in 2022 and 2023; that proposal went to a shareholder vote at the May 2023 annual general meeting and was decisively defeated, with more than 80 percent of votes cast against it. That chapter is closed as an active corporate-governance dispute, though Ping An’s concentrated stake remains worth watching for any future disclosure. The Bank of New York Mellon Corporation holds a further 6.01 percent long position, largely custodial and lending-pool in nature rather than a directional bet.
What the market is paying
At $95.09 per ADR as of June 30, 2026, HSBC sits near the top of its 52-week range of $59.92 to $96.90, having returned roughly 64 percent including dividends over the past year and roughly 338 percent over the past five years, a figure that is more than 2.5 times the S&P 500’s own 13.4 percent annualized total return over the same five-year window. That is one of the strongest large-bank total-return stories of the period, and much of the gap between HSBC’s price-only return and its total return, an unusually wide 8-to-13 percentage points a year, comes from the dividend and from the compounding effect of a share count that shrank through buybacks. Against its bank peers, HSBC has meaningfully outrun JPMorgan on every window measured and is roughly in line with Citigroup’s own big run over the past year, ahead of Citigroup over three years, behind it over five. The stock’s beta, a measure of how much it moves relative to the broader market, sits at an unusually low 0.56 to 0.58 over five years, corroborated across three data providers; that is a genuinely counterintuitive number for a bank with heavy Hong Kong and mainland China exposure, and likely reflects its own idiosyncratic re-rating story decoupling from broad market swings during this window rather than an absence of real macro sensitivity. The most notable recent air pocket came on May 5, 2026: after the ADR closed at an all-time high of $92.16 on April 17, first-quarter results showing credit losses $400 million above the prior year sent the stock down about 5.5 percent on the London line and 4.6 percent on the Hong Kong line in a single session. It has since recovered and made new highs.
Valuation is where the real story is. HSBC’s trailing price-to-earnings ratio sits around 15.4 to 15.7 times, and its forward multiple around 10.2 to 10.9 times, both broadly in line with or slightly cheaper than JPMorgan and Citigroup on a trailing basis. But the multiple that matters most for a bank, price relative to tangible book value, is genuinely disputed across data vendors, and the resolution matters. Using HSBC’s own reported tangible net asset value per ordinary share of $9.46 as of March 31, 2026, against the implied ordinary-share price (the $95.09 ADR divided by 5), the primary-source math gives a price-to-tangible-book-value multiple of roughly 2.01 times, and a price-to-book multiple of roughly 1.87 times, the latter figure independently matched by at least one other data provider’s own stated 1.87 times price-to-book figure, which is strong corroboration. A separate vendor shows a lower figure, around 1.77 times tangible book, likely because its book-value snapshot is lagged or uses a slightly different share count. This is not a trivial rounding difference: it is the gap between describing HSBC as “still trading just above tangible book value,” the old post-financial-crisis discount story, and describing it as trading at roughly two times tangible book, a multiple that sits between Citigroup’s roughly 1.41 times and JPMorgan’s roughly 2.87 times, and one of the largest re-ratings among developed-market banks over the past several years. Read that the second way, the more reliable one on the primary-source math: HSBC is no longer “the cheap bank.” It is a bank the market now prices closer to best-in-class than to bargain-bin, which is exactly the argument the bear case leans on, laid out in full further down.
It is worth pausing on why a re-rating like this happens at all, because it is the crux of the whole HSBC story. A bank trading below tangible book value while earning a high return on tangible equity is, in effect, sitting on a machine that prints value every time it buys back its own stock: retiring shares for less than they are worth on the balance sheet immediately raises tangible book value per remaining share and lifts earnings per share too, since the same profit is now split among fewer shares. HSBC ran exactly that machine for years, spending roughly $8 billion annually shrinking its share count about 10 percent between 2023 and 2025 while trading at a discount to book. As that kept happening quarter after quarter, and as return on tangible equity climbed from the mid-teens toward 17 percent-plus, the market gradually concluded the higher returns were not a fluke, and investors became willing to pay a rising multiple of book value for each dollar of HSBC’s equity rather than demanding a discount against the risk of another crisis-era write-down. That shift in confidence, not any single event, is what carried HSBC from trading below tangible book for most of the 2010s to roughly 2.0 times tangible book today. The mechanical, share-count part of that re-rating engine is what is switched off right now while the buyback is paused, which is exactly why the easy money in this trade is largely behind it.
The dividend yield, around 3.92 to 3.94 percent trailing, with a forward estimate near 4.33 percent from at least one provider, remains genuinely attractive versus JPMorgan’s 1.83 percent and Citigroup’s 1.72 percent, and comparable to DBS Group’s roughly 4.73 percent. HSBC is still very much an income name even after its big price re-rating. What has changed, and matters for anyone extrapolating recent history forward, is the buyback yield, which sits at effectively zero right now because the program is paused (see the filings section above). Anyone modeling HSBC’s forward shareholder return off its historical buyback cadence, a meaningful driver of the per-share re-rating over the past several years through a shrinking share count, would be overstating near-term returns.
Liquidity is solid for a US audience without being deep: average daily ADR volume runs around 1.75 to 1.81 million shares, though the real liquidity in this name sits in London and Hong Kong, not New York. Short interest is very low, about 0.19 percent of float with roughly 3.5 days to cover, corroborated across two independent providers: nobody is making a meaningful bet against HSBC right now, which also means there is little short-covering fuel available to push the stock higher on a squeeze. Sell-side coverage is, frankly, a mess to summarize cleanly, because the thinly covered NYSE ADR (as few as 3 analysts at one provider, as many as 12 at another) sits alongside a much larger London-listed analyst universe of 17 or more. Pulling the range together: consensus clusters somewhere between Hold and Buy, with mean price targets in the $97-to-$102 area, modest single-digit upside from today’s $95.09, and a wide dispersion across all sources from roughly $74 on the low end to somewhere between $113 and $122 on the high end. Treat every one of those figures as opinion, not fact, and note that a widely cited older target near $63 predates most of 2026’s rally and should be disregarded. Technically, the stock is in an unbroken uptrend: its 14-day relative-strength index sits at a neutral 55.67, and price sits above its 20-day, 50-day, and 200-day moving averages, with the gap widening the further out you look, consistent with a stock that has been grinding higher steadily rather than one that just spiked.
What the crowd is saying
The news cycle around HSBC in the run-up to this research was a split narrative. On one side, the first-quarter 2026 results genuinely impressed on the numbers that matter most to a bank investor: an 18.7 percent return on tangible equity excluding notable items, 4-to-6-percent revenue growth, banking net interest income guidance raised to around $46 billion, and a cost program running ahead of schedule. On the other side, the same results missed consensus on pre-tax profit because of a $400 million fraud-related credit charge and rising expected credit losses tied to Hong Kong and China commercial-real-estate deterioration, and the bank raised its own credit-loss guidance for the year. Coverage in the days after the release was mixed to cautiously warm: institutional commentary highlighted the Asia pivot and the wealth-management outperformance (Hong Kong return on equity of 44.7 percent, IWPB at 22.7 percent in the first quarter), while also flagging the same credit-cost concerns raised above. The initial post-earnings rally faded within two to three sessions, and there was no sustained bull narrative afterward in the mainstream press.
Retail and social sentiment is, by the standards of a mega-cap stock, unusually muted. One sentiment tracker put Reddit-related chatter at a neutral 64 out of 100, and HSBC does not appear to trend meaningfully on retail-investor forums the way many US mega-caps do. The dominant retail lean, to the extent one exists, is a straightforward “high-yield value banker” dividend story rather than active, conviction-driven buying, which is consistent with the muted chatter: this looks like a stock people hold quietly for income, not one they argue about online. Employee sentiment, via Glassdoor, shows no stress signal tied to the ongoing restructuring: a 3.9-out-of-5 rating across more than 28,000 reviews, 72 percent of respondents saying they would recommend working there, with the most common complaint being work-life balance in trading, risk, and operations roles rather than anything related to the cost-cutting program itself. The Ping An breakup saga, discussed above, is treated in current commentary as a closed chapter: the shareholder resolution was defeated three years ago, and there is no live activist narrative attached to the name today. Google search interest shows a brief spike tied to results-related news around the start of 2026, with no sustained surge since, a normal attention pattern for a stock this size rather than anything viral.
The most useful thing about this sentiment picture is what it reveals about the gap between the crowd’s framing and the underlying numbers. The prevailing institutional narrative, an Asia-focused re-rating story built on record profitability and a management team that has successfully seen off activist pressure, is broadly accurate as far as it goes, but it tends to understate two things the filings make plain: first, that the headline 18.7 percent return on tangible equity depends on credit-loss assumptions that management itself just revised upward, and second, that Hong Kong commercial-real-estate credit quality has deteriorated meaningfully over the past year (recall the jump from under 30 percent to 73 percent of the book flagged as impaired or at increased risk) rather than stabilizing, even as headline earnings growth has continued. None of this is manipulation or hype. There is no evidence of coordinated retail promotion, no pump-and-dump signal, and no thin-float risk in a $326 billion mega-cap. The narrative is analyst- and institution-driven, not a grassroots retail phenomenon, and the crowd has simply not yet fully priced the credit-cost story the way it has priced the earnings-growth story. That divergence, cheap-relative-to-history re-rating story versus a credit cycle that is already turning in the bank’s most profitable region, is the single most important thing a reader should carry out of this section and into the scenarios below.
The bull case, the bear case, and what has to be true
The structural bull case: this time really is different. Four specific things support that claim. First, HSBC’s interest-rate hedge is still banking genuine multi-year reinvestment gains through at least 2028, because the back book was built at the unusually low yields of 2020-to-2022, and the schedule for rolling those old assets into new, higher-yielding ones is locked in regardless of what happens to rates from here in the near term. Second, the wealth pivot is a real, multi-year rebalancing away from rate-dependent lending income toward Asian assets-under-management-linked fees, and it is already showing up in the numbers: 24 percent wealth-fee growth in 2025 is not a one-quarter fluke. Third, the Hang Seng Bank privatization and the $1.5 billion simplification program are delivered, not promised: the cost program is running six months ahead of schedule, and Hang Seng is now fully consolidated rather than a partially owned associate. Fourth, the Federal Reserve’s mid-2026 pause, with its dot plot pushing the next rate cut out to 2027 or 2028, removes, for now, the near-term rate-cut headwind that looked like the consensus base case a year ago. Together, these support a genuine argument that HSBC’s return on tangible equity has structurally re-based higher, not just cyclically spiked.
The cyclical bear case: cyclicality has never actually been repealed for a bank. The trigger here is specific and not remote: a Hong Kong commercial-real-estate credit event serious enough to push credit-loss guidance materially above the current 45-basis-point level, landing at roughly the same moment global interest rates finally turn down hard, whether from a recession or some other shock forcing 100-to-150 basis points of Federal Reserve cuts. That combination, net interest margin compression arriving exactly when credit costs spike, is the “double hit” this piece keeps returning to, and it is not a hypothetical: HSBC’s own Hong Kong commercial-real-estate loan book already shows the credit leg underway, with the share of loans flagged impaired or at increased risk rising from under 30 percent to 73 percent in a single year. The most likely timing window, based on HSBC’s own hedge-reinvestment schedule, is late 2026 through 2027, when a larger tranche of 2026-vintage hedge assets will have rolled off and the next placements go in at whatever rate environment prevails, quite possibly a lower one if a cutting cycle has begun by then.
The most likely outcome is a split verdict, not a clean win for either side. Near-term, through 2026 and 2027, net interest income probably holds up better than a simple “rates are falling, so bank income falls” story would suggest, because the Fed and Hong Kong Monetary Authority pause is extending and the structural hedge keeps rolling into decent yields. At the same time, credit costs in Hong Kong commercial real estate keep grinding higher, and the current 45-basis-point guidance for 2026 more plausibly proves conservative than aggressive, eating into a meaningful chunk of the net-interest-income benefit. Return on tangible equity probably stays inside or modestly above the 17-percent-plus target through 2026 and 2027, but with a rising share of that return effectively “bought” by credit-loss assumptions that could still prove too optimistic, rather than by pure underlying margin strength. What happens after that, from around 2028 onward, depends almost entirely on whether the wealth-fee engine has scaled enough by then to carry the return on equity once the rate-hedge tailwind is largely spent. That is the single question this entire investment case ultimately turns on, and it will not be answered definitively for at least another year or two.
The scenarios in detail
Every number in this section is an estimate built from HSBC’s own reported tangible net asset value per ordinary share ($9.46 as of March 2026, or $47.30 per ADR at the 5-to-1 ratio), compounded forward at a scenario-specific retention rate and multiplied by a scenario-specific exit valuation multiple. None of these is a price target, and all of them are labeled research signal, not investment advice.
The driver tree
Four variables decide almost everything about where HSBC’s stock goes over the next five years, and the first three are genuinely outside management’s control.
The rate path. Roughly half of group revenue is net interest income, and the most profitable slice of it sits in Hong Kong, whose currency tracks the US dollar mechanically through a formal peg. The Federal Reserve’s mid-2026 pause, with its dot plot pointing to the next cut sometime in 2027 or 2028, is currently holding HSBC’s net interest margin at a cycle-elevated 1.59-to-1.60 percent. Layered on top is the $593 billion structural hedge, still rolling maturing low-yield assets into higher-yielding replacements through at least 2028, a tailwind HSBC itself says fades from around 2028 into 2029. The swing question: does a rate-cutting cycle arrive before the wealth-fee engine has scaled enough to hold up returns without it?
China and Hong Kong credit. Mainland China commercial-real-estate exposure of $5.8 billion carries $1.65 billion of already credit-impaired balances, and the separate Hong Kong commercial-real-estate book is under visible stress, with collateral values roughly half their 2018 peak and a large and rising share of the book flagged as impaired or at increased risk. Management has already raised 2026 credit-loss guidance to around 45 basis points, up from around 40 basis points. This risk lands on precisely the same Hong Kong entity that generates 65.5 percent of group profit before tax, which is why it is the single most important number in this whole analysis.
The capital-return switch. The roughly $8 billion a year of share buybacks that shrank HSBC’s share count about 10 percent between 2023 and 2025 is currently paused. The $13.7 billion Hang Seng Bank privatization, completed in January 2026, took a 110-basis-point day-one hit to the core capital ratio and pushed it down to 14.0 percent, the bottom of management’s 14.0-to-14.5-percent target range. Buybacks will not resume until that ratio rebuilds, a decision reassessed every quarter. The roughly 3.9 percent dividend continues regardless; the buyback yield sits at effectively zero. When, and whether, the buyback restarts is arguably the single biggest company-specific catalyst investors can watch for.
The valuation multiple, which is not an independent variable but a derived one. HSBC has genuinely re-rated from a chronic discount to tangible book value to roughly 2.0 times tangible book today, a multiple that sits between Citigroup’s roughly 1.4 times and JPMorgan’s roughly 2.9 times. Simple dividend-discount-style math (a sustained 17 percent return on tangible equity, roughly an 11 percent cost of equity, and roughly 4 percent long-run growth) justifies something close to 1.9-to-2.0 times, which means today’s multiple is fair if the underlying return proves durable, and rich if it turns out to be a cycle-elevated plateau rather than a floor. The three scenarios below differ mostly on which of those two turns out to be true.
Horizon price paths
| Horizon | Bear | Base | Bull | What dominates this window |
|---|---|---|---|---|
| Today | $95.09 | $95.09 | $95.09 | Verified reference price, June 30, 2026 |
| 6 months | $84 | $97 | $105 | Q2/Q3 earnings, the credit-loss print versus the 45-basis-point guide, Fed/HKMA tone |
| 1 year | $81 | $100 | $112 | Whether core capital rebuilds enough for the buyback to resume, versus a first rate cut and return-on-equity delivery |
| 3 years | $79 | $109 | $130 | The hedge tailwind starting to roll off; whether wealth fees have scaled enough to offset it; the Hong Kong/China credit cycle |
| 5 years | $82 | $120 | $150 | Whether the 17-percent-plus return on tangible equity proves a durable floor or a cycle-elevated plateau |
Bull scenario: the re-rating is validated, not spent
Rates stay higher for longer, with the Fed and Hong Kong Monetary Authority holding into 2027 and beyond, so the Hong Kong lending engine keeps its currently elevated spread while the hedge rolls into decent reinvestment yields. Wealth fees compound at a double-digit pace and scale enough to defend the return-on-equity floor past the 2028-to-2029 hedge roll-off. Hong Kong and China commercial-real-estate credit bottoms out and credit-loss charges normalize back toward 30-to-40 basis points. Core capital rebuilds and the buyback restarts near its old roughly $8-billion-a-year pace, resuming the per-share accretion that helped drive the initial re-rating. Under this path, return on tangible equity holds at 17 percent or better, occasionally into the high teens, revenue growth trends toward the 5 percent target by 2028, and the share count resumes shrinking. Tangible net asset value per ADR compounds at roughly 8 percent a year to around $69 by year five, and the market holds or modestly extends today’s roughly 2.0-to-2.05 times multiple on proven durability, implying an ADR around $150 by year five, plus the roughly 3.9 percent or better dividend along the way. What has to be true: the wealth-fee engine carries the return-on-equity floor before the hedge tailwind fades. What most likely breaks it: the hedge rolls off into a cutting cycle before fees are big enough, and returns settle into the mid-teens instead.
Base scenario: a good bank, fully valued, capital return normalizes
The Fed and Hong Kong Monetary Authority hold through 2026, then cut gradually starting in 2027. Net interest margin eases off its current plateau, but the hedge cushions the decline. Hong Kong and China commercial-real-estate credit losses run at or slightly above the 45-basis-point guide without blowing out into a genuine crisis. Wealth fees keep compounding at a double-digit pace. The buyback resumes sometime in 2026 or 2027, but at a more measured pace than the old cadence. Return on tangible equity lands around 16-to-17 percent. Under this path, revenue grows at a low-single-digit pace, tangible net asset value per ADR compounds at roughly 6 percent a year to around $63 by year five, and the market’s multiple drifts modestly from around 2.0 times toward around 1.9 times as the easy re-rating matures, implying an ADR around $120 by year five, a mid-to-high-single-digit annual total return once the dividend is included, most of it coming from income and book-value growth rather than further multiple expansion. What has to be true: returns stay in the mid-to-high teens and credit stays contained. What most likely breaks it: credit-loss guidance gets revised up again, or the buyback stays paused into 2027.
Bear scenario: a cycle-elevated return valued as a structural one
This is the skeptic’s case, and it deserves to be stated in full because the credibility of this entire piece rests on taking it seriously. The re-rating is largely spent: HSBC trades near 2.0 times tangible book against a chronic sub-1x-book history, sell-side consensus clusters at Hold with only single-digit upside on paper, and short interest of just 0.19 percent of float means there is essentially no short base left to squeeze and convert into forced buying, a sign this is already a crowded long rather than a contested trade. Net interest income is a rate bet dressed up as a franchise, and the Hong Kong dollar’s peg to the US dollar makes it worse, not better: because Hong Kong rates track the Federal Reserve mechanically, a Fed cutting cycle lands squarely on the single highest-margin part of the business, compressing both the deposit spread and the hedge-reinvestment yield at exactly the same time. And the hedge tailwind is timed to run out right around when it matters most: HSBC’s own maturity schedule shows the benefit fading from around 2028 into 2029, precisely the point at which the entire raised 17-percent-through-2028 target needs the wealth-fee engine to have already proven it can carry returns without rate-hedge help, something management has not yet demonstrated.
Layered on top, the China and Hong Kong commercial-real-estate credit leg is not a future risk, it is already turning: the share of HSBC’s Hong Kong commercial-real-estate book flagged as impaired or at increased credit risk jumped from under 30 percent to 73 percent in a single year through mid-2025, and Hong Kong Grade-A office collateral sits roughly half its 2018 peak value with vacancy still elevated, meaning a market bottoming at deeply depressed levels locks in losses on defaulted collateral rather than healing them. The Bank of Communications stake dilution, a combined $2.1 billion charge in 2025, is proof that China-linked equity exposure is a live, recurring drag on earnings, not a one-off. The specific bear path is a rate-cutting cycle compressing net interest margin arriving at the same time as a fresh Hong Kong commercial-real-estate default wave lifting credit losses, concentrating both shocks on the single legal entity that generates two-thirds of group profit. And the buyback, the mechanical engine behind a meaningful share of the recent re-rating, is switched off right now, with core capital sitting at the bottom of its target range after the Hang Seng Bank privatization, a deal that, worth noting, concentrates Hong Kong property credit risk onto HSBC’s own balance sheet rather than diversifying away from it. Finally, the geopolitical straddle between US and Chinese interests is genuinely unhedgeable, a structural, permanent feature of the business rather than a risk that can be diversified away, and HSBC’s largest disclosed activist shareholder, Ping An, has previously pushed to break the company up, a reminder that the bank’s own biggest holder once wanted a fundamentally different structure than the one that exists today.
Under this path, return on tangible equity prints in the 13-to-16 percent range, below the reaffirmed 17-percent-plus target management itself warned it could miss in 2026, core capital recovery stalls, and the buyback stays paused into 2027 or beyond. Tangible net asset value per ADR still compounds, but slowly, around 3 percent a year, to roughly $55 by year five, as rising credit losses eat into retained earnings. The market marks the multiple down from around 2.0 times toward roughly 1.5 times, still a premium to HSBC’s own historical range, implying an ADR in the high $70s to low $80s by years three through five, a 15-to-25 percent drawdown from today’s level, cushioned somewhat by the roughly 3.9 percent dividend. What has to be true: rates and Hong Kong property do what they are already starting to do. What most likely breaks the bear case: rates stay higher for longer and Hong Kong commercial-real-estate credit bottoms out, letting the wealth engine grow into the current multiple rather than away from it.
The numbered downside: what the specific double hit looks like
The tail scenario both the skeptic case and the underlying economics point to is precise enough to walk through step by step, using illustrative, order-of-magnitude arithmetic rather than a firm forecast.
- The rate leg. A roughly 100-basis-point Federal Reserve and Hong Kong Monetary Authority cutting cycle in 2027 lands on the Hong Kong dollar-pegged deposit engine just as the easiest hedge-reinvestment gains have already been banked. HSBC does not disclose a single headline sensitivity figure for this, so treat it qualitatively: banking net interest income could slip from the roughly $46 billion 2026 guide toward the low $40 billions as the bank’s highest-margin franchise reprices downward. This is an estimate, not a disclosed sensitivity.
- The credit leg. A fresh Hong Kong or China commercial-real-estate default wave lifts group credit losses from the roughly 45-basis-point guide toward roughly 60 basis points of average loans, which on a roughly $1 trillion loan book works out to an extra $1.5 billion or so of annual charges versus guidance. This, too, is an estimate.
- The result on returns. Together, the two legs pull return on tangible equity excluding notable items out of the 17-percent-plus target range and into roughly 13-to-15 percent, below target but well above break-even: a disappointment, not a crisis.
- The result on the multiple. A bank earning a mid-teens rather than high-teens return, with the buyback still paused and credit visibly deteriorating, no longer supports a roughly 2.0-times tangible-book multiple. A de-rate toward roughly 1.5 times on a roughly flat book value implies an ADR in the low $80s to high $70s, a 15-to-25 percent drawdown driven by a re-rating reversal, not by insolvency. The roughly 3.9 percent dividend and the 56 percent loan-to-deposit ratio cushion the downside somewhat, and while a core capital ratio of 14.0 percent is a thinner buffer than a year earlier, it remains comfortably above regulatory minimums.
This is the single scenario a long-term holder of this stock should stress-test against, precisely because both legs of it run through the same Hong Kong entity that generates roughly two-thirds of group profit.
Catalysts and timeline
Near term, watch the Q2 2026 results due in early August and Q3 2026 results due in late October, specifically the credit-loss print against the 45-basis-point guide, the banking net interest income run rate against the roughly $46 billion guide, and the quarterly return on tangible equity. Watch the quarterly buyback decision itself, the biggest company-specific catalyst on the table. Watch Federal Reserve and Hong Kong Monetary Authority policy decisions and dot-plot revisions, since any dovish shift starts the net-interest-income-compression clock, with the Hong Kong Monetary Authority following the Fed via the currency peg. Watch interim dividend announcements (a $0.10-per-share first interim was approved in May 2026, not guaranteed going forward) and any US-China tariff or sanctions headlines, plus developments in the Middle East conflict that began in February 2026, as swing factors for credit-loss guidance.
Further out, the key structural inflection point sits around 2028-to-2029, when the structural-hedge tailwind that currently props up net interest margin recedes as maturing hedges roll into new positions at whatever yields prevail then. The 2026-through-2028 window is when each year’s delivery against the 17-percent-plus return target either validates or erodes the re-rating story. The Hong Kong and China commercial-real-estate cycle bottoming, whether collateral values and vacancy rates stabilize, is a multi-quarter-to-multi-year watch. Hang Seng Bank integration synergies (targeted at $0.5 billion-plus by the end of 2028) and the completion of ongoing disposals (Indonesia to OCBC around the first half of 2027, plus Malta, Uruguay, and the Germany custody business) will continue simplifying the group and freeing up capital over the same window.
Leading indicators to watch
The quarterly credit-loss charge as a share of average loans, against the 45-basis-point guide, is the single most important number, since the credit leg of the double hit shows up here first. Hong Kong and mainland China commercial-real-estate loan migration and coverage ratios in each quarterly disclosure are the leading edge of that same line. The core capital ratio’s path back toward 14.5 percent, and the buyback decision that follows it, is the re-rating engine’s on-off switch. Banking net interest income against the roughly $46 billion guide, and the net interest margin itself, track the rate and hedge leg. Wealth-fee income growth each quarter shows whether the structural engine is still compounding fast enough to eventually replace fading net interest income. Federal Reserve and Hong Kong Monetary Authority policy and dot-plot commentary is the exogenous trigger for any net-interest-income compression. Hong Kong office and retail property price and rent indices show whether the commercial-real-estate collateral is bottoming or still falling. And the price-to-tangible-book multiple itself is a real-time vote: drifting toward 1.5 times means the market is siding with the bear case, holding near 2.0 times means it is siding with the base or bull case.
Companies to watch (bull / base / bear)
HSBC (HSBC). Role: the name itself. Bull: the buyback restarts on schedule, wealth fees keep compounding at a double-digit pace, and Hong Kong credit costs stabilize, validating the re-rating. Base: the dividend does the work while capital rebuilds slowly and returns hold in the mid-to-high teens. Bear: a rate-cutting cycle arrives alongside a fresh Hong Kong or China commercial-real-estate credit wave, pulling returns into the mid-teens and the multiple down toward 1.5 times. Watch: the quarterly credit-loss print, the buyback decision, and the Hong Kong segment return on equity.
Standard Chartered (STAN.L). Role: the purer, smaller Asia/emerging-markets proxy. Bull: continues its own aggressive buyback and closes more of the valuation gap to HSBC. Base: tracks a similar Asia-wealth and trade-finance cycle to HSBC, one notch cheaper on book value. Bear: its own stock has already re-rated sharply over the past year, so much of the “cheap alternative to HSBC” argument may already be priced in, and the thin US OTC ADR line adds an access friction. Watch: its own buyback cadence and Asia wealth-fee growth trend.
JPMorgan (JPM). Role: the best-in-class US benchmark. Bull: continues compounding off unmatched scale and diversification. Base: steady, high-quality returns at a premium price. Bear: already priced for perfection at nearly 2.9 times tangible book, well above its own ten-year median, leaving little room for multiple expansion even if execution stays excellent. Watch: regulatory capital rule changes that could affect its surcharge or balance-sheet requirements.
Citigroup (C). Role: the US turnaround story. Bull: the multi-year restructuring keeps showing up in improving returns, from a cheap starting multiple. Base: gradual, quarter-by-quarter progress on return on tangible common equity toward its own medium-term targets. Bear: remains the return laggard among large US banks, and the Banamex separation and broader simplification still carry execution risk. Watch: quarterly return-on-tangible-common-equity trend against its own 2026-through-2031 targets.
DBS Group (D05.SI). Role: the regional-premium Asia comparison. Bull: Asian wealth accumulation keeps compounding fee income at the region’s best-run bank. Base: steady, high-quality returns justify its already-rich multiple, the highest in this peer set. Bear: concentrated almost entirely in Singapore, leaving it more exposed to a single-market shock than HSBC’s broader footprint. Watch: Singapore dollar rate policy and regional wealth-fee growth.
Barclays (BCS) and Lloyds (LYG). Role: the UK domestic counterpoints. Bull for Barclays: investment-bank momentum and a buyback re-rate a historically cheap UK-bank multiple. Bull for Lloyds: a pure UK rate-cycle and mortgage recovery story with strong capital return. Bear for both: rising impairments (Barclays) and a lingering motor-finance compensation overhang (Lloyds) show UK credit normalization is underway, and neither offers HSBC’s Asia growth exposure. Watch: UK impairment trends and Bank of England rate policy.
ICBC and China Construction Bank (context only). Role: scale reference for the Chinese state-bank system HSBC operates alongside. Watch: not a direct investment comparison given unverified recent results and minimal practical US retail access, but their health is a proxy for broader mainland China credit conditions that indirectly affect HSBC’s own Hong Kong and China exposure.
Risk controls
The honest way to frame HSBC’s risk is concentration, not fragility. This is not a bank teetering on the edge of insolvency; its capital ratio sits comfortably above regulatory minimums even at the bottom of its own internal target range, and its loan-to-deposit ratio of 56 percent is conservative by global banking standards. The risk is that a genuinely improved, well-run business is currently priced, at roughly 2.0 times tangible book near the top of its 52-week range, as though its most profitable years are a permanent floor rather than a favorable multi-year window that happened to combine high rates, a locked-in hedge-reinvestment schedule, and (until recently) contained Hong Kong credit costs.
The single largest concentration risk is that two-thirds of group profit runs through one legal entity, the Hong Kong banking subsidiary, which is simultaneously the source of HSBC’s rate-sensitive lending income and the location of its most stressed credit book. A shock to either the rate environment or Hong Kong property values does not diversify away inside HSBC’s own structure; it lands on the same entity twice. The geopolitical risk (HSBC’s structural position between US and Chinese interests, and the compliance and sanctions exposure that comes with it) is a permanent, disclosed feature of the business rather than a one-off event, and it cannot be hedged away the way a rate or credit risk can be, at least partially, through the interest-rate hedge or loan-loss provisioning. The access risk is real for a US retail reader specifically: this stock trades under three tickers with genuinely different liquidity profiles, and the NYSE ADR carries thinner analyst coverage than the London-listed ordinary shares, so US-specific sell-side commentary should be read with that caveat in mind.
What would most clearly signal the thesis is breaking down: return on tangible equity excluding notable items printing below 17 percent for more than a single quarter without a clean, one-off explanation, since management itself has already flagged this could happen in 2026; credit-loss guidance getting revised upward again beyond the current 45 basis points; a Federal Reserve or Hong Kong Monetary Authority rate cut actually beginning while the hedge tailwind is simultaneously fading; the buyback staying paused into 2027; or the Hong Kong and China commercial-real-estate impaired-loan balances continuing to climb rather than stabilizing. Any of these would validate the bear case’s central point, that a cycle-elevated, rate-and-property-linked return is being valued as though it were structural, and would justify the market marking the stock down from around 2.0 times tangible book toward something closer to 1.5 times. Conversely, what would most clearly signal the bull case is playing out: wealth-fee income continuing to compound at a double-digit pace independent of interest-rate moves; Hong Kong and China commercial-real-estate credit losses peaking and rolling over, with coverage ratios stabilizing and loan migration reversing; core capital rebuilding and the buyback resuming near its historical pace; and rates staying higher for longer so the lending engine holds up while the hedge finishes rolling into decent reinvestment yields. That combination would demonstrate the 17-percent-plus return on tangible equity is a durable floor rather than a plateau, and would justify defending or extending today’s multiple.
Methodology, sourcing, and data-quality flags
This research draws on three tiers of source: primary SEC filings (HSBC’s Form 20-F Annual Report for fiscal year 2025, filed February 26, 2026; the FY2025 earnings release, Form 6-K, filed February 25, 2026; and the first-quarter 2026 earnings release, Form 6-K, filed May 5, 2026, all pulled directly from EDGAR), analyst and data-vendor sources (stockanalysis.com, finviz.com, marketbeat.com, tipranks.com, and others, used for market data and cross-checked against each other where they disagreed), and press coverage (corroborated across multiple outlets where used for anything load-bearing). Of 111 load-bearing claims reviewed for this piece, 102 were verified directly against primary filing text, 8 were disputed across sources and are presented here as ranges with the safer framing explained, and 1 (a negative claim about what HSBC does not disclose) was cut as not properly belonging in a factual claims ledger.
Here is the full five-factor research read behind the Hold rating, in plain terms. On valuation, HSBC trades at roughly 2.0 times tangible book value, full against its own chronic sub-1x-book history and near a 52-week high, with sell-side consensus offering only single-digit upside on paper. But that multiple is roughly what a sustained 17 percent return on tangible equity justifies on simple dividend-discount math, and on earnings (a forward price-to-earnings ratio around 10 times) and dividend yield (roughly 3.9 percent) the stock is not expensive against JPMorgan or Citigroup. The read nets out to fair, conditional on the return proving durable, which is exactly the open question the risk factor below addresses. On growth, management raised its return-on-tangible-equity target to 17 percent or better through 2028 and is guiding banking net interest income to around $46 billion, with the genuinely structural leg, wealth-fee income, up about 24 percent in 2025 to $9.4 billion. That is tempered by a mature, slow-growing balance sheet and a rate-hedge tailwind that fades from around 2028 into 2029, so the growth read is modestly positive rather than open-ended. On quality, a 17.2 percent return on tangible equity excluding notable items, a cost-efficiency ratio improving toward the low 50s (53.4 percent for full-year 2025, 46.8 percent in the first quarter of 2026), an unmatched low-cost roughly $1.8 trillion Asian and Hong Kong deposit franchise, and a conservative 56 percent loan-to-deposit ratio are genuine positives, offset by a reported return on equity that is still dragged down by one-off items and by credit costs that are actively rising. On risk, the concentration is the dominant fact: roughly 65.5 percent of group profit before tax runs through one Hong Kong legal entity that is simultaneously the rate bet and the credit-risk locus, sitting alongside $5.8 billion of mainland China commercial-real-estate exposure (with $1.65 billion already credit-impaired), a stressed Hong Kong commercial-real-estate book, a core capital ratio at the bottom of its target range with buybacks paused, and an unhedgeable US-China geopolitical position. This factor reads negative, and it is the main reason the overall rating is not higher. On momentum, a lightly weighted, soft signal: the stock sits near its 52-week high after a roughly 64 percent one-year total return, its moving averages are in bullish alignment, and sell-side consensus clusters Hold to Buy, but retail conviction is muted and post-earnings rallies have faded quickly, so this factor tilts mildly positive without carrying much weight in the overall read.
Taken together, the read lands at Hold, sitting at the top of that label’s range and close to an upgrade: a genuinely improved, well-run Asia-wealth bank with an excellent deposit moat and a real dividend, where the easy re-rating money has largely been made, the buyback is switched off, and the entire remaining case rests on rates staying elevated and Hong Kong and China property credit staying contained, both of which are showing early signs of turning the other way. This is a labeled research signal, not personalized investment advice, and the two most important levers that would move it are explicit: an upgrade case needs the buyback to resume, credit losses to hold at or below the 45-basis-point guide, and the 17-percent-plus return to be sustained; a downgrade case needs the double-hit described above, a rate cut landing alongside credit losses moving past roughly 50 basis points, pulling returns toward the mid-teens with the buyback still paused.
Data-quality flags:
- The price-to-tangible-book-value multiple is genuinely disputed across data vendors, and it is the single most consequential number in this piece. Using HSBC’s own reported tangible net asset value per ordinary share against the implied ordinary-share price, the primary-source calculation gives roughly 2.0 times tangible book, corroborated by at least one vendor’s independently stated price-to-book figure. A separate vendor shows a lower figure, around 1.77 times, likely reflecting a lagged book-value snapshot. This article uses the higher, primary-source-derived figure throughout, consistent with the fact-verification pass on this research.
- The share buyback is paused, not merely slowed, and this should not be extrapolated forward. HSBC has not repurchased shares since the third quarter of 2025, and management has explicitly said buybacks will not resume until the core capital ratio, currently 14.0 percent, rebuilds within its 14.0-to-14.5-percent target range, a decision reassessed quarterly. A press report describing a “$3 billion buyback announced with Q1 2026 results” refers to a different event, HSBC’s first-quarter 2025 results a year earlier, and should not be read as current.
- Two different profit-concentration figures for Hong Kong are both correct and measure different things. The “Hong Kong segment,” a management-reporting business line, generated 32.0 percent of group profit before tax in 2025. “The Hongkong and Shanghai Banking Corporation Limited,” the legal entity where the bank’s Asian business is actually licensed and booked, generated 65.5 percent of group profit before tax in the same year, because it also captures wholesale and wealth business booked in Hong Kong under the CIB and IWPB segments. Neither figure supersedes the other; they answer different questions.
- HSBC’s cost-efficiency ratio for fiscal year 2025 is 53.4 percent, not 50.2 percent, a figure that appeared in some secondary sources but is actually the prior year’s (2024) comparative figure, traced back to and confirmed against the primary filing’s current-year column.
- HSBC’s mainland China commercial-real-estate exposure is $5.8 billion, with $1.65 billion credit-impaired, figures confirmed against the primary Form 20-F Risk Review table. A separate, larger figure circulating in some secondary commentary, describing total China-related exposure closer to $19.8 billion, appears to measure a different and broader scope and should not be conflated with the specific commercial-real-estate exposure figure used throughout this piece.
- Ping An’s current shareholding in HSBC is stale. The last confirmed notifiable filing shows a roughly 7.98 percent stake as of May 2024. No more recent disclosure was found in this research pass. This article describes Ping An as HSBC’s largest disclosed activist shareholder as of its last filing, not as holding a current, precisely known stake, and frames its 2022-to-2023 push to split the company as a resolved historical episode, defeated at the May 2023 annual general meeting, rather than an active threat.
- HSBC’s total market capitalization and sell-side consensus rating are both presented as ranges rather than single figures, because data vendors disagree: market capitalization spans roughly $325.5 billion to $326.8 billion depending on provider (this piece uses approximately $326 billion), and sell-side consensus ranges from a strict Hold reading at one large provider to a Buy-leaning reading at others, with mean price targets clustering in the $97-to-$102 area and full dispersion running from roughly $74 to somewhere between $113 and $122.
- HSBC’s net-interest-income sensitivity to a specific rate move (for example, a 25- or 100-basis-point shift) is not disclosed by the company as a single headline figure. This piece describes the rate exposure qualitatively (net interest income is roughly half of group revenue, the Hong Kong engine tracks the Federal Reserve through the currency peg, and the structural-hedge tailwind is expected to recede from around 2028 into 2029) rather than inventing a precise sensitivity figure that HSBC itself does not publish.
- All prices, market caps, multiples, and yields in this piece are point-in-time as of June 30, 2026, and move daily; anyone reading this later should treat every dollar figure as a dated snapshot, not a current quote.
Key sources: HSBC Holdings plc Form 20-F Annual Report, fiscal year 2025 (filed February 26, 2026, SEC EDGAR); HSBC Holdings plc 2025 Results, Form 6-K (filed February 25, 2026, SEC EDGAR); HSBC Holdings plc first-quarter 2026 earnings release, Form 6-K (filed May 5, 2026, SEC EDGAR); stockanalysis.com; finviz.com; marketbeat.com; tipranks.com; barchart.com; totalrealreturns.com; Euromoney Trade Finance Survey 2026; JPMorgan Chase & Co. and Citigroup Inc. investor-relations disclosures; company disclosures for Standard Chartered, DBS Group, Barclays, and Lloyds Banking Group.
Prepared July 1, 2026. Figures are point-in-time and will change. This is research and analysis for educational purposes, not investment advice, not a recommendation, and not a solicitation. Bank stocks carry credit, rate, and regulatory-capital risk that can move fast, and HSBC’s Hong Kong and China exposure and its position between US and UK and Chinese regulatory regimes add a layer of risk most purely domestic banks do not carry. Verify all figures independently and consult a licensed financial advisor before making any decision.