
Research date: June 25, 2026 | OSINT market research on Oracle Corporation (ORCL, NYSE), a $439 billion enterprise technology company in the middle of a roughly $50 billion-per-year AI infrastructure buildout that has inverted its free cash flow, expanded its Remaining Performance Obligations to $638 billion, and re-rated the stock from a mature-software multiple to an AI-infrastructure multiple - before a steep correction that has brought shares back near their 52-week lows. Oracle’s fiscal year ends May 31; all “FY2026” references mean the year ending May 31, 2026.
Important disclaimer. This article is OSINT research produced for educational and informational purposes only. It is not investment advice, not a recommendation to buy or sell any security, and not personalized financial guidance. All figures are point-in-time as of June 25, 2026, and move fast - verify before acting on any number. Do your own due diligence and consult a qualified financial professional before making any investment decision.
ORCL-specific risks: AI infrastructure capital expenditure overhang (free cash flow turned sharply negative in FY2026, to approximately negative $23.7 billion); customer concentration in the Remaining Performance Obligation backlog, with analysts estimating that one counterparty - OpenAI - may account for a large portion of committed future revenue (analyst estimate; not disclosed by Oracle); hyperscaler competition risk from AWS, Azure, and Google Cloud; legacy on-premise license-support revenue that is slowly declining as customers migrate to cloud alternatives; high financial debt load (total financial debt approximately $129.5 billion at May 31, 2026); stock-based compensation and planned at-the-market equity issuance creating per-share dilution; and the uncertainty inherent in all forward scenario prices below, which are illustrative estimates derived from stated assumptions, not price targets. A securities class-action was filed February 3, 2026 in the US District Court for the District of Delaware (Kessler Topaz Meltzer & Check LLP among others, covering a class period of June 12, 2025 through December 16, 2025); the complaint alleges Oracle failed to adequately disclose its AI infrastructure borrowing needs; Oracle has not admitted any wrongdoing; the case is at an early stage with no trial, finding of liability, or settlement as of the research date; the allegations are unproven.
Where this stock could be in 6 months, 1 year, 3 years, and 5 years
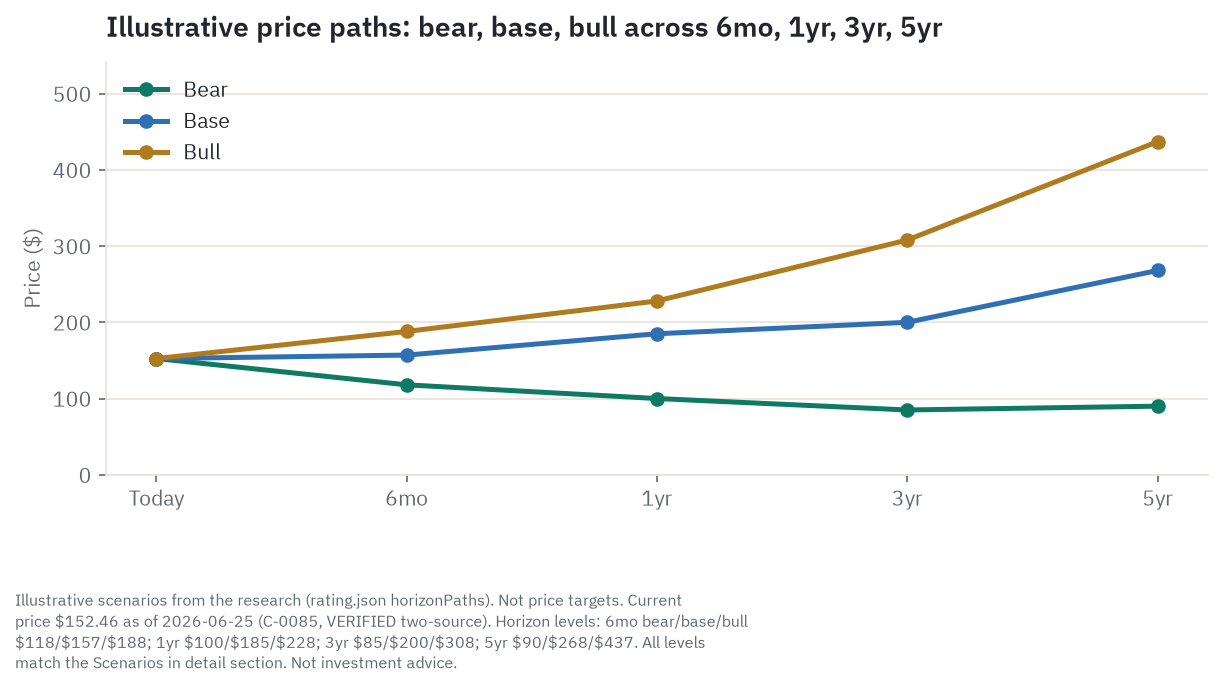
Oracle closed at $152.46 on June 25, 2026, down 53.2 percent from its all-time closing high of $325.76 on September 10, 2025, and sitting only 13.3 percent above the 52-week low of $134.57. All dollar ranges below are illustrative estimates derived from stated scenario EPS assumptions and stated exit multiples. They are not price targets.
6 months. The next six months belong almost entirely to one data point: Oracle’s Q1 FY2027 earnings (reporting in September 2026), the first quarter of a fiscal year in which management has guided roughly $90 billion in total revenue and cloud growth of 58 to 64 percent in Q1 alone. In the base case, OCI (Oracle Cloud Infrastructure, its datacenter and GPU-rental business) cloud comes in near the midpoint of that range, the market treats it as confirmation that the Stargate revenue ramp is on track, and the stock stabilizes near $157 [estimate]. The bull case near $188 [estimate] requires cloud growth above 65 percent, signaling new Stargate capacity is filling faster than feared and beginning a multiple re-rate from 19x toward 22x on the FY2027 EPS path. The bear case near $118 [estimate] materializes if cloud growth prints at 45 to 50 percent, suggesting the $70 billion in FY2027 capital expenditures is building capacity faster than demand can absorb it - and if a credit agency places Oracle on review or the $20 billion at-the-market equity program prices at a level that signals urgency. The single thing most likely to flip this horizon is the Q1 FY2027 cloud growth rate, stated as a year-over-year percentage in the September earnings release.
1 year. By mid-2027 the market will have full FY2027 results and will be pricing FY2028. The base case near $185 [estimate] assumes FY2027 revenue lands close to $87 to 90 billion, OCI sustains growth above 60 percent, and both credit agencies hold at BBB/Baa2 with a negative outlook that does not deteriorate further - allowing the market to price FY2028 non-GAAP EPS of approximately $9.75 at roughly 19x. The bull case near $228 [estimate] adds beats on both revenue and OCI margins, an early improvement in gross margin above the 32 percent management target, and a credit outlook revision to stable - shifting the EPS path toward $10.50 at 21.7x. The bear case near $100 [estimate] comes from a material FY2027 revenue miss, with OCI utilization on new Stargate capacity disappointing at 45 to 50 percent of what the RPO implied, and S&P triggering a leverage review at the 4x adjusted threshold it has warned about - compressing the EPS path toward $7.00 at a 14x distressed multiple. The single thing most likely to flip the one-year read is the credit rating: a downgrade to BB (one notch below the current BBB) would force selling by investment-grade bond mandates on Oracle’s $129.5 billion in outstanding bonds, widen spreads materially, and reprice every forward assumption.
3 years. By FY2029 the structural utilization rate on the fully built Stargate capacity becomes observable in reported quarterly results. In the base case near $200 [estimate], Oracle fills 65 to 75 percent of its expanded OCI fleet, FCF turns positive in FY2029 as capital expenditures moderate from the FY2027 peak, and FY2029 non-GAAP EPS reaches approximately $10.50 at roughly 19x [both figures are estimates]. The bull case near $308 [estimate] puts utilization at 80 to 90 percent, gross margins expanding from 32 percent toward 38 to 40 percent as fixed infrastructure costs are spread over more revenue, FCF turning positive a year early in FY2028, and FY2029 EPS near $14.00 at a 22x multiple [both estimates]. The bear case near $85 [estimate] has OpenAI renegotiating its OCI commitment by 30 to 50 percent, utilization stuck at 55 to 65 percent, credit agency downgrades widening Oracle’s financing costs, and FY2029 EPS near $7.00 at a 12x distressed multiple [both estimates]. The single thing most likely to flip the three-year horizon is whether OpenAI is paying at the roughly $60 billion annual run rate in full through 2027 to 2029 - observable in Oracle’s quarterly OCI revenue. Note: management has not publicly guided a specific calendar date for FCF inflection; the timing in these scenarios is an analytical estimate, not a company-provided forecast.
5 years. The five-year outcome determines whether Oracle becomes the AI cloud infrastructure company its management envisions or a specialized database and ERP vendor that over-invested in infrastructure and is harvesting those assets through depreciation runoff. The base case near $268 [estimate] assumes OCI matures at 65 to 70 percent average utilization, FCF is durably positive from FY2029 to FY2030, the License Support annuity holds a gross profit floor near $16 to 18 billion, and FY2031 non-GAAP EPS reaches approximately $14.00 at a 19.1x multiple [both estimates] - a path that is roughly 76 percent above today’s price but reflects real duration risk and years of negative FCF in the interim. The bull case near $437 [estimate] puts OCI at toll-road economics with 80 to 90 percent utilization, gross margins reaching 38 to 40 percent, database MultiCloud approaching $10 billion annually, and FY2031 EPS near $19.00 at a 23x software re-rating multiple [both estimates]. The bear case near $90 [estimate] has a partial OpenAI renegotiation and GPU compute commoditization leaving OCI chronically undersubscribed through 2030, with FY2031 EPS near $7.50 at a 12x distressed infrastructure multiple [both estimates]. Even in the bear scenario, the database franchise prevents a collapse below that level.
I’d call Oracle a Hold at $152.46, and the honest reason is that the investment case requires too many things to go right simultaneously while the single biggest risk - OpenAI’s financial health and willingness to honor a multi-hundred-billion-dollar commitment - sits entirely outside Oracle’s control.
Companion tool
The interactive dashboard lets you sort, filter, and compare Oracle’s key metrics against its competitive peer set across valuation, growth, quality, risk, and momentum. The Excel model is a downloadable scenario builder with adjustable EPS and multiple assumptions for each horizon.
TL;DR
Oracle posted $67.4 billion in FY2026 revenue (up 17.3 percent), with its Cloud Infrastructure (OCI) business growing 77 percent to $18.1 billion and accelerating to 93 percent growth in the fourth quarter alone. The company’s Remaining Performance Obligation - the contracted future revenue not yet recognized - hit $638 billion at fiscal year-end, up 363 percent in one year, driven primarily by the Stargate AI datacenter consortium it formed with OpenAI and SoftBank in January 2025. The first Stargate campus, a 1.2-gigawatt facility in Abilene, Texas, went live in April 2026. To build that capacity, Oracle spent $55.7 billion in capital expenditures in FY2026 against $32.0 billion in operating cash flow, producing negative free cash flow (FCF, the cash left after capital spending) of $23.7 billion. Net debt stands near $98.3 billion, with both S&P (BBB) and Moody’s (Baa2) holding negative outlooks and warning that FY2027’s planned $70 billion in net capital expenditures could push leverage toward the 4x threshold that triggers a downgrade review. The stock has fallen 53.2 percent from its September 2025 all-time closing high of $325.76 and trades near the low end of its 52-week range at $152.46, at roughly 19x management’s FY2027 non-GAAP EPS guidance of $8.05. That multiple looks inexpensive against 34 percent guided revenue growth, but meaningfully less so against negative FCF, a GAAP trailing P/E of 26x, and an EV/EBITDA (enterprise value divided by earnings before interest, taxes, depreciation, and amortization) of 17 to 19x that sits above Microsoft and Amazon despite deeply negative cash generation. The database franchise - $19.8 billion in License Support at estimated 90-plus percent gross margin - remains the structural anchor that funds the OCI bet and prevents a worse outcome even in the bear case. The read lands at Hold.
Explore it yourself: the interactive dashboard
What Oracle actually is today
Most people still picture Oracle as the database company from the 1980s and 1990s, the vendor that sold the software running the back office of every large bank, insurer, and government agency on the planet. That picture is still accurate. Oracle’s 40-year database franchise remains its largest source of gross profit and the structural reason the company exists at its current scale. What is new, and what explains the stock’s round trip from a $1 trillion market capitalization to $439 billion in less than a year, is that Oracle has bet the balance sheet on becoming the world’s third hyperscale cloud.
The two businesses in one company. Oracle operates two fundamentally different economic machines inside one corporate structure.
The first is the database-and-software annuity: perpetual Oracle Database and middleware licenses sold over decades, each generating annual maintenance fees (“License Support”) at roughly 20 to 22 percent of the original license value per year. Those fees renew at near-100 percent rates because migrating an Oracle Database installation requires rewriting application code, retesting stored procedures, and retraining staff at costs that typically exceed many years of maintenance fees. The estimated gross margin on this line is 90-plus percent. Oracle earned $19.8 billion in License Support in FY2026, and that revenue - with virtually no incremental capital required to sustain it - is what funds the rest of the story.
The second is Oracle Cloud Infrastructure (OCI), the company’s hyperscale cloud platform: datacenters full of NVIDIA GPU clusters, rented to AI companies and enterprises on multi-year contracts. OCI is growing fast (77 percent in FY2026) and is the reason Oracle signed a contract with OpenAI that press reports describe as $300 billion over five years. It is also the reason Oracle’s capital expenditures jumped from $6.9 billion in FY2024 to $55.7 billion in FY2026.
The Stargate pivot. In January 2025, Oracle joined OpenAI and SoftBank in the Stargate consortium, committing to build an estimated 7-gigawatt AI datacenter footprint across the United States. Oracle’s specific role: build and operate the physical infrastructure. OpenAI runs the AI models on top of it. The first campus - in Abilene, Texas, with about 1.2 gigawatts of OCI compute capacity - went live in April 2026. Additional sites in Michigan, Wisconsin, Wyoming, and Pennsylvania are in various stages of development. This commitment is what drove capex from $21.2 billion in FY2025 to $55.7 billion in FY2026, and Oracle has guided roughly $70 billion in net cash capex for FY2027.
Scale and structure. Total FY2026 revenue was $67.4 billion. Larry Ellison remains executive chairman and CTO; Safra Catz is CEO. Ellison owns approximately 1.16 billion shares, or about 40.3 percent of shares outstanding. Oracle is headquartered in Austin, Texas, after relocating from Redwood Shores, California, in 2020.
The one analogy that holds. Oracle is a toll-road operator that has taken out a construction loan to build a transcontinental rail network. The toll roads (the License Support annuity) generate dependable cash today. The rail bet (OCI) could earn far higher returns if AI traffic compounds over 20 years. The construction cost is staggering and the timeline to positive cash flow is measured in years, not quarters. Whether the rail traffic arrives on the schedule the construction loan assumed is the entire investment question.
How money flows through Oracle
flowchart TD
    AI["AI Customers\n(OpenAI $300B 5yr reported, Meta, NVIDIA, xAI)"]
    ENT["Enterprise SaaS Customers\n(Fusion ERP, NetSuite 43K+, Oracle Health)"]
    ONPREM["On-Prem DB Customers\n(banks, insurers, governments)"]

    OCI["OCI Cloud Infrastructure\nIaaS $18.1B FY2026, +77% YoY"]
    SAAS["Oracle Cloud Apps\nSaaS $15.9B FY2026, +11% YoY"]
    LS["License Support\n~$19.8B FY2026, ~90% gross margin est."]
    MC["Oracle DB MultiCloud\nAWS/Azure/Google, +531% YoY Q3 FY2026"]

    NVDA["NVIDIA\nGPU supply: H100/H200/Blackwell GB200"]
    AMD["AMD\n50K MI450 GPUs from Q3 FY2026"]
    DC["Datacenter Builders\nCrusoe (Abilene), Related Digital (Michigan 1GW)"]
    PWR["Power Utilities\nERCOT, gas backup 360MW, grid interconnect"]

    AI -->|multi-yr GPU cloud contracts, RPO $638B| OCI
    ENT -->|per-user subscription| SAAS
    ONPREM -->|annual maintenance ~22% of license value| LS
    ONPREM -->|migrate keeping Oracle DB| MC

    OCI -->|capex $55.7B FY2026| NVDA
    OCI -->|50K GPU procurement| AMD
    OCI -->|leases and co-development| DC
    DC -->|grid connection and power purchase| PWR
    PWR -->|binding constraint on capacity delivery| OCI

    SAAS -->|hosted on OCI| OCI
    LS -->|cash funds OCI capex| OCI
    MC -->|Oracle earns DB fees on rival clouds| OCI

    OCI -->|FCF -$23.7B FY2026| DEBT["Debt Markets\n$43B raised FY2026, BBB-rated"]
How to read this chart. Money enters the top from three sources: AI customers signing GPU-cloud contracts, enterprise customers subscribing to Oracle’s SaaS applications, and existing on-premise database customers paying annual License Support fees. All three streams eventually flow through OCI’s infrastructure. The License Support cash is what makes the capex possible; without the annuity, Oracle could not plausibly finance this buildout from the capital markets alone. The OCF-to-capex gap ($32B vs $56B in FY2026) gets filled by debt markets, which is where the credit-rating risk lives.
The four business segments: where the money actually comes from
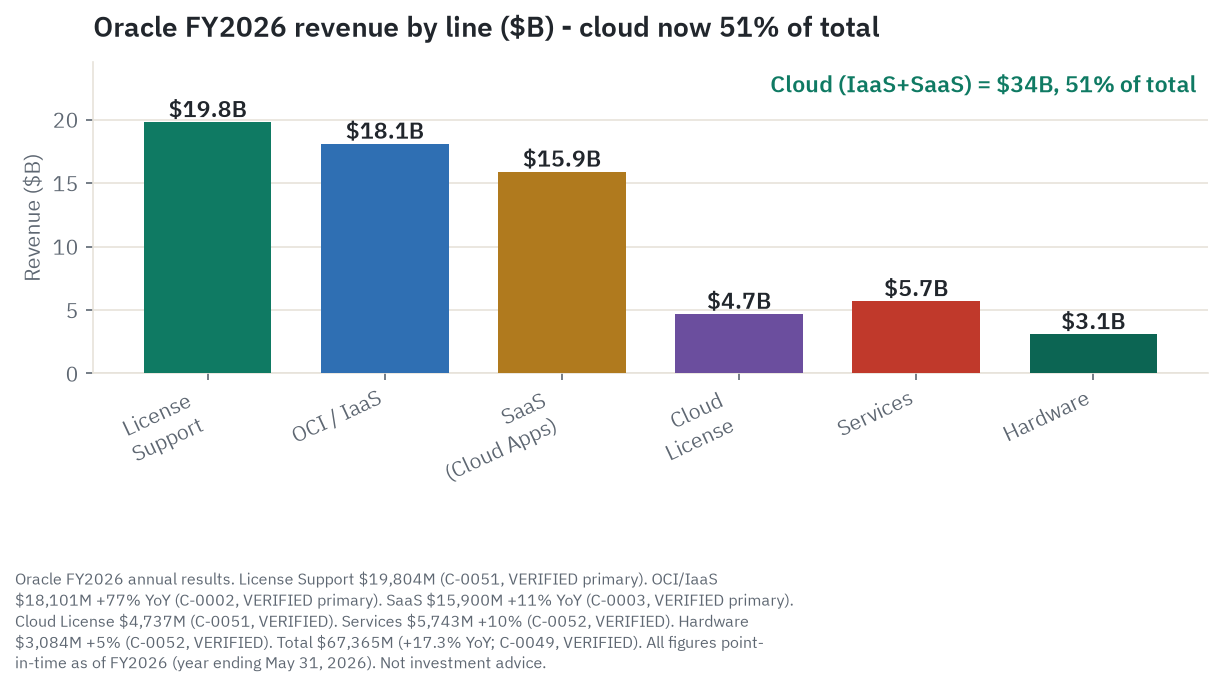
Oracle reports one operating segment for legal purposes but discloses disaggregated revenue by line. The picture below is from its FY2026 10-K and Q4 FY2026 earnings press release (8-K, June 10, 2026).
Two abbreviations appear throughout this piece. IaaS (Infrastructure as a Service) means raw rented compute, storage, and networking - the GPU clusters and related datacenter capacity Oracle sells access to by the hour or on multi-year contract. SaaS (Software as a Service) means subscription cloud applications, in Oracle’s case primarily Fusion ERP (for large enterprises), NetSuite (for mid-market companies), and Oracle Health.
| Revenue line | FY2026 | FY2025 (derived) | YoY |
|---|---|---|---|
| OCI / Cloud Infrastructure (IaaS) | $18,101M | ~$10,227M | +77% |
| Cloud Applications (SaaS) | $15,888M | ~$14,313M | +11% |
| Total cloud | $33,989M | ~$24,540M | +39% |
| License Support (software support) | $19,804M | ~$19,952M | ~flat |
| Cloud License and On-Prem License | $4,737M | ~$4,837M | -2% |
| Hardware (Exadata) | $3,084M | $2,940M | +5% |
| Services | $5,743M | $5,230M | +10% |
| Total revenue | $67,357M | $57,399M | +17.3% |
FY2026 IaaS and SaaS sub-lines are derived from stated growth percentages (+77% and +11% respectively) applied to approximate FY2025 bases; the FY2025 total is from primary sources (StockAnalysis.com sourcing the GAAP income statement); sub-line FY2025 figures are estimates pending direct verification from the FY2025 10-K.
Cloud Services and License Support. This combined segment generates nearly all of Oracle’s gross profit. License Support alone - the high-margin maintenance annuity on existing database installations - contributed an estimated $17.8 billion in gross profit in FY2026 at an estimated 90-plus percent margin (this margin is an UNVERIFIED analyst estimate; Oracle combined License Support with other cloud and software lines in FY2026 and no longer reports its gross margin separately). OCI’s $18.1 billion in revenue at a management-disclosed blended “AI capacity” gross margin of approximately 32 percent contributed roughly $5.8 billion in gross profit. That gap explains the entire strategic rationale for the buildout: OCI needs to roughly triple its current revenue before its gross profit contribution matches what License Support generates today.
Cloud License and On-Premises License. This line covers new perpetual or term software licenses for on-premise deployments. At $4.7 billion and declining modestly, it is the market signal that customers are buying fewer new on-premise Oracle licenses. Oracle wants that customer to move to a cloud subscription instead; the declining license line is part of that intentional transition, not a competitive loss.
Hardware. Exadata - Oracle’s purpose-built hardware/software system for running Oracle Database at high performance - contributed $3.1 billion in FY2026. Hardware grew 5 percent, which is modest. The strategic value of Exadata is the attached software and support annuity that follows every unit sold. Exadata X11M, the current generation, can also be deployed as Cloud@Customer: Oracle cloud in the customer’s own datacenter.
Services. The consulting, implementation, training, and support services line earned $5.7 billion at a 20.7 percent gross margin. Oracle treats this line as a necessary complement to large enterprise deals, not as a growth engine. Lower margin and competitive with large system integrators (Accenture, Deloitte, TCS) means Oracle allocates minimal incremental capital here.
OCI and the AI infrastructure buildout: Oracle’s $55 billion bet
The OCI origin story. Oracle launched the second generation of its cloud infrastructure in 2016, years behind the three hyperscalers - AWS (Amazon Web Services), Azure (Microsoft), and Google Cloud. The word “hyperscaler” describes a global datacenter platform built to serve any enterprise workload at continental scale, with the engineering depth and capital base to keep expanding capacity as demand grows. For years OCI was a distant also-ran to all three. What changed in 2023 and 2024 was a structural accident of timing: NVIDIA GPU cluster demand outran what hyperscalers could supply, and AI labs needed committed, large-cluster GPU capacity that the hyperscalers could not promise on a three-to-five-year contractual basis. Oracle’s RDMA (Remote Direct Memory Access) cluster networking - originally built for its database workloads - turned out to be unusually well-matched to AI model training.
Why RDMA matters for AI training. Training a large neural network spreads the work across thousands of GPUs simultaneously. After each computational step, every GPU must share what it learned - small packets called gradient updates - with every other GPU before the next step can proceed. On a conventional Ethernet network, those packets travel through each server’s CPU, adding latency that leaves GPUs sitting idle. RDMA bypasses the CPU entirely, writing data directly from one GPU’s memory to another’s across the fabric. The latency reduction is roughly 3-10x compared to standard Ethernet at large cluster scales. At 100,000 to 200,000 GPUs working on a single training run, that idle-time difference translates into meaningfully more training throughput per dollar spent on GPU time - which is why frontier AI labs care about it enough to choose vendors on this basis.
OCI as of mid-2026 runs 45-plus public cloud regions globally, including 9 national security cloud regions serving US government and defense. Oracle deploys H100, H200, and now Blackwell GB200 NVL72 GPU clusters, and in Q3 FY2026 it began deploying AMD MI450 Instinct GPUs (50,000 units in a new supercluster). Q4 FY2026 OCI utilization on existing installed capacity was 97.5 percent. That 97.5 percent figure deserves a precise reading: it measures how fully Oracle’s current deployed GPU fleet is occupied, not how quickly the much larger fleet arriving in FY2027 will fill. The $70 billion in new capex for FY2027 will dramatically expand the denominator - new capacity that needs new contracts to fill it. Those contracts sit in the RPO; whether they fill the new capacity at the pace implied by the backlog is the central uncertainty in the Oracle investment case.
The Stargate consortium. The Stargate joint venture, announced January 21, 2025, brought together Oracle, OpenAI, and SoftBank with a stated total committed investment of $500 billion over four years. Oracle is the primary infrastructure builder. The initial tranche of $100 billion began deploying immediately. According to press reports from multiple outlets citing sources familiar with the terms, the commercial heart of the agreement is a five-year cloud infrastructure arrangement beginning in 2027 under which OpenAI will pay Oracle approximately $60 billion per year - a total of approximately $300 billion - for 4.5 gigawatts of OCI capacity housing an estimated two million NVIDIA Blackwell-series GPUs. Oracle has separately disclosed a $30 billion cloud contract with OpenAI in a June 30, 2025 SEC filing, which predates the larger Stargate ramp. Oracle has not separately itemized the $300 billion figure as a specific line in its SEC filings; the figure originates from press reporting and should be treated as an approximate reported number, not a confirmed filing disclosure.
Other publicly named large OCI customers include Meta (which signed a new multi-year compute commitment in Q2 FY2026, described by Oracle management as large-scale), NVIDIA (using OCI for its own cloud customers), and xAI.
The capex math. Oracle’s capital expenditure trajectory from FY2024 ($6.9 billion) to FY2025 ($21.2 billion) to FY2026 ($55.7 billion gross) to FY2027 guidance (~$70 billion net Oracle cash spend, with GAAP-reported capex potentially $20 to 25 billion higher due to customer prepayments and timing differences) represents a roughly 10x increase in three years. The FY2026 capex-to-revenue ratio of 83 percent compares to roughly 28 percent for AWS (as a share of Amazon’s total revenue), 38 percent for Azure, and 33 percent for Google Cloud.
The capex buys: NVIDIA GPU servers (H100/H200/Blackwell systems at roughly $50,000 to 60,000 per GPU equivalent at volume, including chassis and networking), datacenter construction in Abilene (Texas), Saline Township (Michigan, 1 gigawatt, $7 billion project developed by Related Digital with approximately $16 billion in project financing from Blackstone - a structure that keeps much of the construction capital off Oracle’s own balance sheet while Oracle retains the revenue relationship), Wisconsin Lighthouse, Wyoming, and Pennsylvania, plus power infrastructure at each site.
GPU depreciation: the accounting choice inside the margin. Most OCI margin comparisons overlook one variable: which GPU useful-life assumption Oracle is using for depreciation. An H100 GPU server system costs roughly $50,000 to 60,000 per GPU equivalent. Under a 3-year useful life, depreciation and amortization runs approximately $17,000 to 20,000 per GPU per year. Under a 5-year life it drops to roughly $10,000 to 12,000 per year. Under a 6-year life it falls further to $8,000 to 10,000 per year.
Several major cloud providers revised their GPU useful-life assumptions from 3 years to 5 to 6 years in 2023 and 2024. That change improved their reported gross margins by roughly 4 to 7 percentage points with no change whatsoever in the actual cash cost of the hardware. Oracle has not disclosed its GPU depreciation schedule in the FY2026 10-K. If Oracle uses a 3-year schedule - a defensible conservative position given NVIDIA’s roughly 2-year major architecture cadence - its reported OCI gross margins are 4 to 7 percentage points lower than they would be under the 5 to 6-year assumption competitors use. Part of the gap between Oracle’s management-disclosed 32 percent blended OCI margin and the 14 percent actual GPU-rental margin observed in The Information’s August 2025 internal documents may therefore reflect an accounting choice, not just utilization or pricing differences.
The bull case for longer useful-life assumptions is grounded in observed secondary-market prices. Used H100 SXM5 systems still traded at $25,000 to 35,000 in mid-2026, well above their post-year-2 book value under a 3-year straight-line schedule. The economics follow what might be called a value cascade: an H100 cluster runs frontier model training in years 1-2 at premium contract rates, migrates to inference serving in years 3-4 at lower but still positive margins, and handles batch processing or fine-tuning in years 5-6. The residual market prices suggest the hardware’s useful economic life genuinely extends beyond year 2. If Oracle adopts a 5 to 6-year schedule - or if the market learns it already uses one - the accounting shift alone could improve reported OCI margins by 4 to 7 percentage points without any change in the underlying cash business.
The RPO flywheel. OCI’s GPU cloud contracts are multi-year commitments. When a customer signs, Oracle books the future-year revenue as Remaining Performance Obligation (RPO) - contracted but not yet recognized. The RPO is the metric that captured the market’s imagination in 2025 and 2026.
The competitive case for OCI. AI labs chose OCI over the hyperscalers for GPU training for several reasons: Oracle’s RDMA cluster networking delivers lower inter-GPU latency for distributed model training at very large scale (100,000 to 200,000 GPU clusters, as explained above); Oracle does not build competing foundation AI models, making it a neutral host for labs that view Microsoft’s OpenAI investment as a conflict of interest for Azure; and Oracle historically prices OCI below AWS on comparable workloads. The government sovereign cloud business - 9 national security regions with full FedRAMP compliance - provides a second, more captive revenue stream that is less sensitive to commercial AI demand cycles.
The honest competitive constraint. AWS is building Elastic Fabric Adapter (EFA) networking that closes the RDMA gap. The hyperscalers are all building GPU capacity at scale. Neoclouds - GPU-focused new cloud providers built specifically for AI workloads - add another tier of competition. CoreWeave (CRWV), the largest neocloud as of mid-2026, priced H100 clusters at roughly $6.16 per GPU-hour, well below OCI’s $10 per GPU-hour on-demand list price. AWS capacity blocks sat at roughly $3.93 per GPU-hour. The broader spot market (Lambda, RunPod, Vast.ai) offered H100 instances at $1.49 to 3.00 per GPU-hour as of mid-2026. Oracle’s OCI list pricing and its $3 to 4 per GPU-hour implied contracted rate on the Stargate commitment (an UNVERIFIED estimate derived from dividing the reported annual contract value by estimated GPU count) represent different positions on the same pricing curve - and that curve has moved sharply downward. H100 spot prices fell 64 to 75 percent from their Q4 2024 peak by early 2026. CME Group launched GPU compute futures in 2026, marking GPU compute’s formal transition from a negotiated specialty input to a commodity with a public derivatives market.
The database franchise: Autonomous DB, MultiCloud, and Exadata
Oracle Database is the backbone of enterprise transaction processing globally. The largest banks, insurers, retailers, and government agencies in the world run their core systems on Oracle. The switching cost is not merely high - it is structurally prohibitive for many organizations. Migrating an Oracle Database installation requires rewriting application code and stored procedures in Oracle’s proprietary PL/SQL language, retesting thousands of transactions, and retraining staff. For a large bank with 20 years of Oracle-specific optimizations built into its core ledger, migration risk is existential. The annual maintenance fee - even at 8 percent annual increases (Oracle has pushed roughly 8 percent annual price increases in 2024 and 2025, up from a historical 3 to 5 percent) - is rational to pay versus the cost and operational risk of migration.
License Support dynamics. Revenue held essentially flat at $19.8 billion in FY2026 (from $19.95 billion in FY2025). This flat trajectory at 8 percent pricing implies unit volume is declining at roughly 6 to 8 percent annually - meaning customers are migrating or churning at that rate, partially offset by price. That pace of unit attrition is slow enough that the gross profit base erodes gradually rather than abruptly.
The MultiCloud toll. Starting with Microsoft Azure in 2023 and expanding to AWS (now in 20 global regions) and Google Cloud, Oracle made its most strategically important defensive move in years: it deployed Oracle Database natively inside competitor clouds. Customers can run Oracle Database with sub-millisecond, private-network latency on AWS infrastructure without touching OCI. Oracle earns database subscription fees on AWS, Azure, and Google Cloud workloads, converting what would otherwise be lost License Support revenue (as customers migrate to AWS-native databases) into new cloud subscription revenue billed through Oracle. Multicloud database revenue grew 531 percent year-over-year in Q3 FY2026. Oracle targets $20 billion in multicloud database revenue within five years. This strategy also insulates Oracle against hyperscaler attempts to substitute open-source PostgreSQL: customers who want to stay on Oracle Database but run on AWS can now do so, preserving the Oracle revenue relationship.
Autonomous Database. Oracle’s Autonomous Database (ADB) is a fully managed cloud database that handles patching, tuning, and scaling automatically, built on Exadata infrastructure with Oracle AI Vector Search natively embedded. ADB is Oracle’s primary tool for convincing on-premise database customers to move to OCI and continue paying Oracle, converting License Support fees into cloud subscriptions. The cloud subscription carries lower gross margin than License Support but often higher revenue per customer.
The open-source competitive reality. PostgreSQL (free, open-source) is the fastest-growing enterprise database by developer adoption. AWS Aurora PostgreSQL, Azure Database for PostgreSQL, and Google AlloyDB offer 90-plus percent cost savings for new applications versus Oracle licensing. The 2025 StackOverflow Developer Survey found 55.6 percent of developers reporting use of PostgreSQL versus 10.6 percent for Oracle. The practical migration rate from existing Oracle installations is slow (the switching cost is real), but the direction of new application development is moving away from Oracle licensing.
Database deployment-share data from 6sense puts this in context. PostgreSQL now commands approximately 18.6 percent of database deployments by count, compared to Oracle’s approximately 9.55 percent - a significant reversal of historical rankings. Oracle dominates by revenue because its average customer is a large enterprise paying large fees; it is losing by installation count because the developer ecosystem has largely moved on to alternatives for new applications.
The MongoDB threat: greenfield attrition. PostgreSQL erodes the existing Oracle installed base slowly, one expensive migration at a time. MongoDB (MDB, approximately $2.46 billion in ARR growing about 23 percent year over year) attacks from a different angle entirely. A developer starting a new web application, mobile backend, or microservices project in 2026 rarely reaches for Oracle licensing. MongoDB’s flexible document model and its Atlas cloud service - which runs on AWS, Azure, or Google Cloud with no dependency on OCI - are the defaults for many new workloads. The competitive mechanism is distinct: MongoDB does not migrate Oracle customers; it ensures Oracle is never chosen in the first place for applications built today. As enterprises build AI agents and modern data pipelines, the probability that the data layer is Oracle decreases with each new project.
Oracle’s MultiCloud strategy partially intercepts the existing-customer erosion; it cannot prevent the greenfield loss to either PostgreSQL-based services or MongoDB Atlas. Over a 5 to 10-year horizon, the compounding of greenfield losses is the slow erosion that matters more than any individual enterprise migration.
The MultiCloud counter. Oracle DB MultiCloud (+531 percent YoY from a small base) is the most underappreciated move in Oracle’s recent history: it converts would-be License Support churners into cloud database subscribers, earns Oracle revenue on competitor clouds, and decouples the database franchise from the choice of OCI as the primary cloud. It cannot prevent the greenfield loss, but it buys time for the existing installed base to monetize longer.
Cloud applications: Fusion ERP, NetSuite, and the SaaS stack
Oracle Cloud Applications generated $15.9 billion in FY2026, up 11 percent, making it the second-largest cloud revenue line after OCI. Gross margin on this line is estimated at 75 to 83 percent (an UNVERIFIED estimate derived by backing out License Support and OCI contributions from the disclosed blended segment gross profit; Oracle does not disclose SaaS gross margin separately in FY2026).
Fusion Cloud ERP (large enterprise). Oracle Fusion Cloud ERP targets large enterprises with a bundled Financials, Supply Chain (SCM), Human Capital Management (HCM), Customer Experience (CX), and Enterprise Performance Management (EPM) stack. The quarterly run rate is approximately $1.1 billion, growing roughly 14 percent in constant currency in Q3 FY2026. The integration argument - one vendor for database, cloud, ERP, and HCM that reduces integration complexity - is Oracle’s primary competitive pitch against SAP.
SAP S/4HANA Cloud is the most direct rival, and it is growing faster. SAP’s cloud ERP revenue grew 28 to 32 percent in recent quarters (constant currency), compared to Oracle Fusion’s 14 percent. SAP’s ERP installed base is roughly four times Oracle Fusion’s by customer count (approximately 26,000 SAP ERP customers versus approximately 6,900 Fusion customers per 6sense estimates). Microsoft Dynamics 365 is also growing at 19 percent and benefits from deep Microsoft 365 and Azure integration.
Salesforce (CRM) intersects Oracle’s SaaS business primarily at the Customer Experience layer. Salesforce’s Sales Cloud and Service Cloud dominate CRM globally, and Oracle Fusion CX is a secondary option for most enterprises not already deeply embedded in Oracle’s broader stack. Salesforce’s Agentforce - its AI agent platform that automates customer-facing workflows - is a direct potential rival to Oracle’s embedded AI features in Fusion applications, and Salesforce reported Q1 FY2027 revenue of $11.1 billion (up 13 percent), growing faster than Oracle Fusion at lower margins. The integration argument (one vendor for database, cloud, and ERP) is Oracle’s counter; it holds within the existing Oracle customer base but rarely wins greenfield CRM selections away from Salesforce.
NetSuite (mid-market). NetSuite is Oracle’s mid-market cloud ERP, serving companies with roughly $5 million to $500 million in annual revenue. It has 43,000-plus customers and a quarterly run rate of approximately $1.0 to 1.1 billion, growing 14 percent in Q3 FY2026. NetSuite competes with Microsoft Dynamics 365 Business Central, Sage Intacct, and SAP Business One. It has a genuine niche as a cloud-native ERP for growing companies, and switching costs are high once a company has implemented it.
Oracle Health (the Cerner acquisition problem). In 2022, Oracle acquired Cerner, the healthcare electronic health record (EHR) company, for $28.4 billion. Three years later, Oracle Health is the largest net loser of hospital customers in the US market. KLAS Research’s 2026 EHR Market Share Report (published May 14, 2026) documented net losses of 56 hospitals and 14,676 beds in calendar 2025 alone. Three consecutive years of net customer losses have occurred since the acquisition. Approximately 30 percent of sampled Oracle Health customers say the platform is not in their long-term plans; 35 percent are considered vulnerable to attrition. Epic now commands approximately 43.7 percent of US acute care beds versus Oracle Health’s 20.4 percent, and the gap is widening. Oracle does not disclose Oracle Health revenue as a separate line; it is bundled into Cloud Applications. The acquisition cost $28.4 billion and has no measurable positive revenue inflection visible in Oracle’s published financials.
The SaaS margin structure. Where it can be estimated, Oracle’s SaaS gross margin is likely in the 75 to 83 percent range - higher than the 60 to 65 percent commonly assumed in analyst models - because Oracle hosts its SaaS on its own OCI infrastructure (no third-party cloud markup), has amortized decades of R&D, and benefits from high renewal rates. Fusion ERP and NetSuite each carry significant switching costs: implementation typically costs 2 to 5 times the annual software license and takes 12 to 24 months.
The RPO flywheel: how Oracle’s backlog converts to revenue
The Remaining Performance Obligation is Oracle’s disclosed committed future revenue from signed cloud contracts. Understanding its size, composition, and quality is essential to forming a view on Oracle’s forward revenue trajectory.
The trajectory.
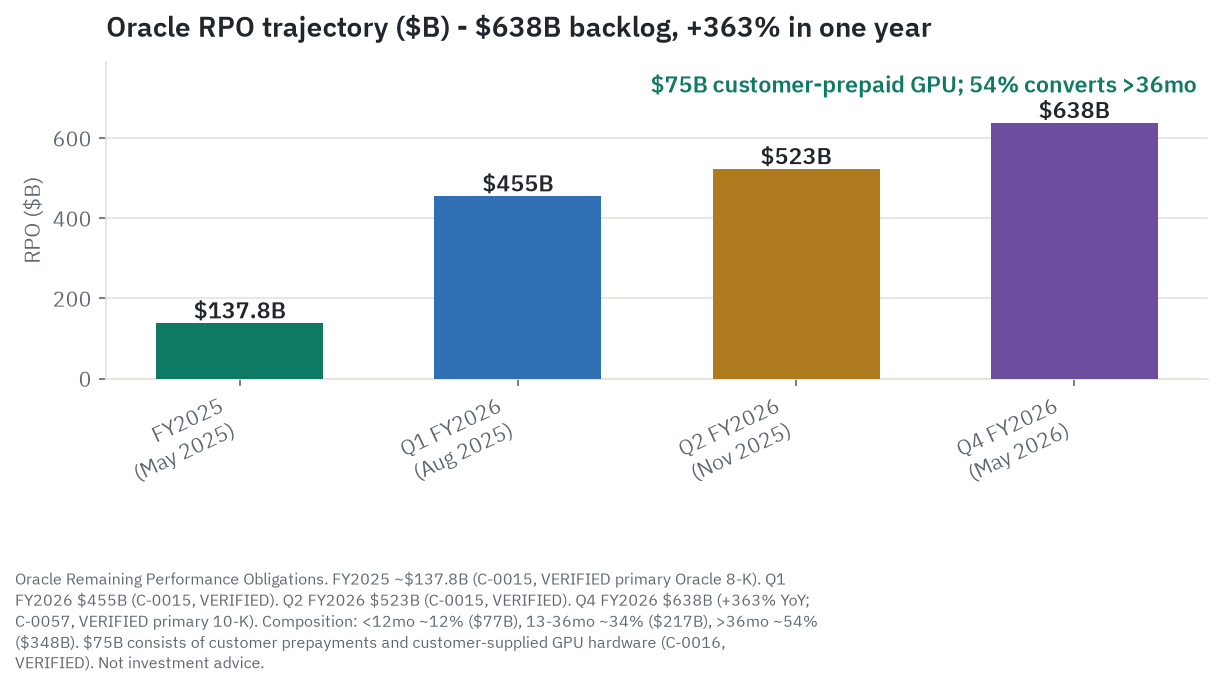
| Period | Total RPO |
|---|---|
| May 31, 2025 (FY2025) | ~$137.8B |
| Aug 31, 2025 (Q1 FY2026) | $455.0B (+$317B in one quarter) |
| Nov 30, 2025 (Q2 FY2026) | $523.0B |
| Feb 28, 2026 (Q3 FY2026) | $553.0B |
| May 31, 2026 (Q4 FY2026) | $638.0B (+363% YoY) |
The Q1 FY2026 jump of $317 billion in a single quarter - more than three times Oracle’s total annual revenue - was driven almost entirely by the Stargate/OpenAI contract.
RPO breakdown by recognition timing (May 31, 2026).
| When recognized | Amount | Share |
|---|---|---|
| Next 12 months | ~$77B | ~12% |
| Months 13 to 36 | ~$217B | ~34% |
| Beyond 36 months | ~$348B | ~54% |
With only 12 percent of the backlog due within 12 months and 54 percent beyond 36 months, the weighted-average conversion horizon is approximately 8 years at current burn rates. This is not a near-term cash flow; it is a long-dated infrastructure commitment.
Reading RPO quality. Before treating the $638 billion headline as face value, it helps to apply a simple four-part quality test. A high-quality RPO clears all four: the counterparty is creditworthy enough to actually pay; the backlog is within the seller’s delivery capacity; most of it converts to cash within 12 to 18 months; and no material cancellation clauses exist that could shrink the number before cash changes hands.
Oracle’s $638 billion passes the second test clearly. The 97.5 percent Q4 FY2026 utilization rate on existing installed capacity confirms that genuine demand is present and that Oracle can fill capacity it has already built. On the other three tests the picture is less clean. The dominant counterparty - OpenAI - carried a $38.53 billion audited net loss in its most recent available fiscal year and operates on continuous external capital raises. Speed of conversion is modest: only approximately 12 percent is recognized within 12 months. And cancellation provisions for the Stargate arrangements are not publicly disclosed. The Abilene 600 MW expansion cancellation - where Oracle and OpenAI could not agree on financing and capacity terms even within an intact framework agreement - is the reference precedent for how project-level RPO can shrink even when the overall relationship appears to hold.
The $75 billion hardware component. Per the Q4 FY2026 earnings release, $75 billion of the $638 billion RPO relates to large-scale AI contracts where customers have either prepaid Oracle for the purchase of GPUs or supplied their own hardware for Oracle to operate in OCI datacenters. This component is more analogous to a deposit or a pass-through procurement arrangement than to a committed cloud-service revenue stream with an ongoing Oracle margin. Bulls note this reduces Oracle’s capital requirement for those commitments; bears note it means that slice is not pure high-margin Oracle infrastructure service revenue.
Concentration risk. Oracle does not disclose individual customer RPO concentration. Analysts estimate that OpenAI-linked commitments may account for approximately 54 percent of the $638 billion RPO, derived by comparing the press-reported deal size to the total backlog. Oracle has not disclosed this percentage; it is an analyst estimate, not an Oracle filing figure. Moody’s Ratings separately cited “significant counterparty risk” from the OpenAI concentration in Oracle’s backlog without specifying a percentage. Moody’s characterization is primary-tier (from Oracle’s 10-K risk disclosures); the 54 percent concentration figure is analyst-tier.
The RPO-to-revenue bridge. At $67.4 billion in FY2026 revenue and $638 billion in RPO, Oracle needs multiple years to burn through the backlog. Management’s FY2027 guidance of approximately $90 billion implies it will convert roughly $22 to 23 billion of the RPO into incremental recognized revenue in FY2027. The pace of this conversion - and whether it stays in line with or diverges from the contracted schedule - is the most important financial variable in the Oracle story.
Capital allocation: the capex surge, the FCF inversion, debt, and buybacks
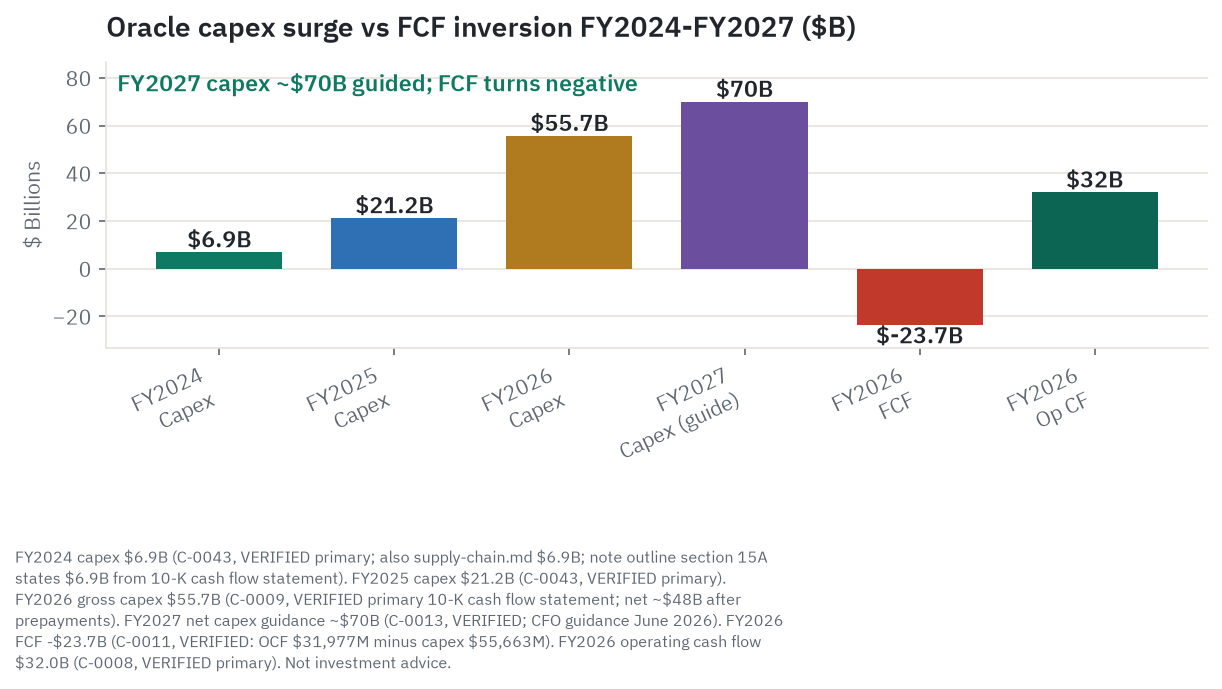
The FCF inversion. Oracle’s free cash flow (operating cash flow minus capital expenditures) was historically robust - roughly $5 to 10 billion annually, reaching $14 billion at its peak in FY2023. In FY2025 it turned roughly break-even (negative $390 million). In FY2026, with $55.7 billion in capital expenditures against $32.0 billion in operating cash flow, FCF turned to negative $23.7 billion. FY2027 is guided to be worse: $70 billion in net Oracle cash capex against an estimated $38 to 42 billion in operating cash flow implies another $28 to 32 billion in negative FCF. The strategy is intentional - Oracle is front-loading capital to build the capacity that the $638 billion RPO demands. The risk is that if AI demand slows or OpenAI’s commitments are restructured, Oracle holds tens of billions in sunk-cost infrastructure it cannot quickly monetize.
The FY2026 cash-in / cash-out picture. A simple table shows why negative FCF matters even with revenue growing 17 percent.
| FY2026 cash flow item | Amount |
|---|---|
| Operating cash flow (includes interest paid) | +$32.0B |
| Capital expenditures | -$55.7B |
| Free cash flow | -$23.7B |
| Dividends paid | -$5.8B |
| Total cash consumed before financing | ~-$29.5B |
| New debt raised | ~+$43B |
| New equity raised (mandatory convertible preferred + other) | ~+$5B |
| Net cash increase (ending $31.3B vs beginning $10.8B) | ~+$20.5B |
Oracle’s $32 billion operating cash flow is genuine and growing. After capital expenditures, dividends, and interest (which flows through operating cash), Oracle needed approximately $48 billion in external financing just to cover its obligations and build its cash balance. The $20.5 billion cash increase represents a liquidity buffer funded by bondholders and preferred shareholders, not by the operating business.
The debt load. To bridge the FCF gap, Oracle raised $43 billion in new debt and approximately $5 billion in equity in FY2026. The equity portion took the form of mandatory convertible preferred stock issued in February 2026 - part of a roughly $30 billion combined transaction that was the largest single capital markets deal in Oracle’s history. The mandatory convertible preferred converts to Oracle common shares on a fixed schedule regardless of the stock price at conversion, creating deferred dilution: the conversion is certain, only the timing is set by the contract terms rather than by Oracle’s choice. Total financial debt at May 31, 2026 was $129.5 billion at a weighted-average interest rate of 4.43 percent. Net debt (total debt minus cash) was approximately $98.3 billion. Interest expense in FY2026 was $4.6 billion, up 28.5 percent from FY2025. FY2027 plans call for approximately $40 billion more in new debt issuance plus a $20 billion at-the-market equity program.
Beyond the $129.5 billion in financial debt, Oracle’s December 2025 earnings disclosure revealed approximately $248 billion in new long-term datacenter lease commitments signed during that quarter. These are operating leases - fixed obligations to pay for datacenter space that Oracle must honor regardless of what OCI revenue does - and they sit entirely outside the financial debt figure. Combined, the fixed-commitment picture (financial debt plus signed operating leases) is substantially larger than the $129.5 billion headline suggests, and it compounds the risk if OCI utilization disappoints: Oracle keeps paying lease obligations whether the GPUs inside those facilities are running at 97 percent or 50 percent.
The credit ratings: what they mean and why they matter. S&P rates Oracle BBB on a negative outlook; Moody’s rates it Baa2 on a negative outlook. These are two agencies’ labels for the same notch: the lowest rung of investment-grade debt. One step lower - S&P BB or Moody’s Ba2 - crosses into speculative grade, commonly called junk. A “negative outlook” means a downgrade is under active consideration; historically, a negative outlook resolves in a downgrade within 24 months roughly one-third of the time. No downgrade has happened yet.
The practical consequences of a downgrade to junk would be swift and painful for both the bonds and the stock. Pension funds, insurance companies, and institutional bond mandates are legally or contractually prohibited from holding speculative-grade bonds. A one-notch cut to BB would force those holders - who collectively own a substantial portion of Oracle’s approximately $129.5 billion in outstanding bonds - to sell at whatever the market will pay, regardless of price. That forced selling pushes Oracle’s bond prices down and yields up. Junk-grade spreads typically run 300 to 400 basis points above Treasuries versus the current roughly 100 basis points for investment-grade paper. On $40 billion in new FY2027 debt, that spread difference translates into $800 million to $1.2 billion more in annual interest expense. The stock feels this too: a higher cost of capital flows into every discounted-cash-flow model, compressing the implied present value of the long-dated OCI revenue stream even if physical AI demand is unchanged. S&P widened its downgrade trigger from 3.5x to 4.0x adjusted leverage specifically to accommodate Oracle’s Stargate transition, but has stated that leverage could approach that threshold in FY2027 or FY2028 if capex stays elevated.
According to press reports citing credit market data (a press-tier secondary source, point-in-time), Oracle’s credit-default swap (CDS) spread widened to above 125 basis points during the December 2025 stock decline. Normal investment-grade CDS spreads run roughly 50 to 100 basis points; Oracle’s spread above 125 basis points implied the credit market was pricing Oracle closer to the speculative-grade boundary than its letter rating suggested. Barclays reportedly downgraded Oracle’s corporate debt to Underweight based on leverage trajectory concerns (same press-tier source). Both figures are point-in-time and should be verified against current market data before drawing conclusions.
The $20 billion at-the-market equity program. An at-the-market program works as follows: Oracle registers a pool of shares with the SEC and instructs a broker-dealer to sell them into the open market continuously over time, at whatever the market will pay that day - no investment-bank underwriter, no minimum floor price, no block-trade discount negotiated in advance. At $152.46 per share, a $20 billion program implies approximately 131 million new shares, roughly 4.6 percent additional dilution on top of the ongoing $4.8 billion annual stock-based compensation burden. Unlike a fixed-price secondary offering, an ATM dilutes holders at $130 just as readily as at $200 - there is no price below which Oracle stops selling.
The market’s negative reading of the June 23, 2026 ATM announcement was specific: if Oracle could fund the entire $70 billion FY2027 buildout from the $32 billion operating cash flow plus $40 billion in new investment-grade bonds, it would have no need to sell equity at $152 - more than 50 percent below the September 2025 all-time high. The ATM signals that debt markets alone will not fully finance the program at acceptable cost, or that Oracle is building a financial cushion against the possibility that credit conditions deteriorate further. Either interpretation is bearish at the margin.
Buybacks and dilution. Oracle has historically been one of the more aggressive buyback programs in US technology. In FY2026, buybacks collapsed to $95 million - effectively suspended - against $4.8 billion in stock-based compensation (SBC), producing net dilution of approximately 48 million shares. The diluted share count rose from 2,866 million (FY2025) to 2,914 million (FY2026). The new $20 billion ATM will add approximately 131 million new shares at current prices - a 4.6 percent additional dilution on top of the ongoing SBC burden.
The dividend and its context. Oracle pays $0.50 per share per quarter ($2.00 per year, a 1.31 percent yield at $152.46). The annual dividend cost was $5.8 billion in FY2026. Operating cash flow of $32.0 billion technically covers the dividend. Free cash flow does not. The dividend is, in practice, funded by new borrowings - Oracle is borrowing at 4.43 percent to pay income-oriented shareholders while simultaneously asking those same shareholders to absorb $20 billion in new dilution from the ATM program. Both exist at the same time: Oracle returns capital from borrowed funds while asking equity holders to contribute capital. Management has not publicly resolved this tension, and it is worth naming plainly.
The SBC gap. Non-GAAP EPS ($7.63 in FY2026, including one-time investment gains; $6.83 on an adjusted basis excluding those gains) substantially exceeds GAAP EPS ($5.83) because non-GAAP excludes $4.8 billion in SBC, $1.7 billion in acquired-intangible amortization (primarily Cerner), and $1.8 billion in restructuring charges - a total of $8.3 billion in pre-tax adjustments. These are real economic costs to shareholders. The SBC alone represents roughly $1.65 per share in annual pre-tax dilution.
Competitive position
OCI versus the hyperscalers. Oracle OCI ($18.1 billion in FY2026 IaaS revenue, growing 77 percent) is still a fraction of the three major hyperscalers. AWS generated an annualized revenue run rate near $190 billion in FY2026; Azure’s AI business alone crossed a $37 billion annualized run rate; Google Cloud grew 63 percent in Q1 2026. The case for OCI is not that it displaces these incumbents broadly - it is that for the specific workload of very large GPU training clusters (100,000 to 200,000 GPUs in a single network fabric), Oracle’s RDMA networking, the neutral-platform positioning (no competing AI model), and established relationships with frontier AI labs create a defensible niche.
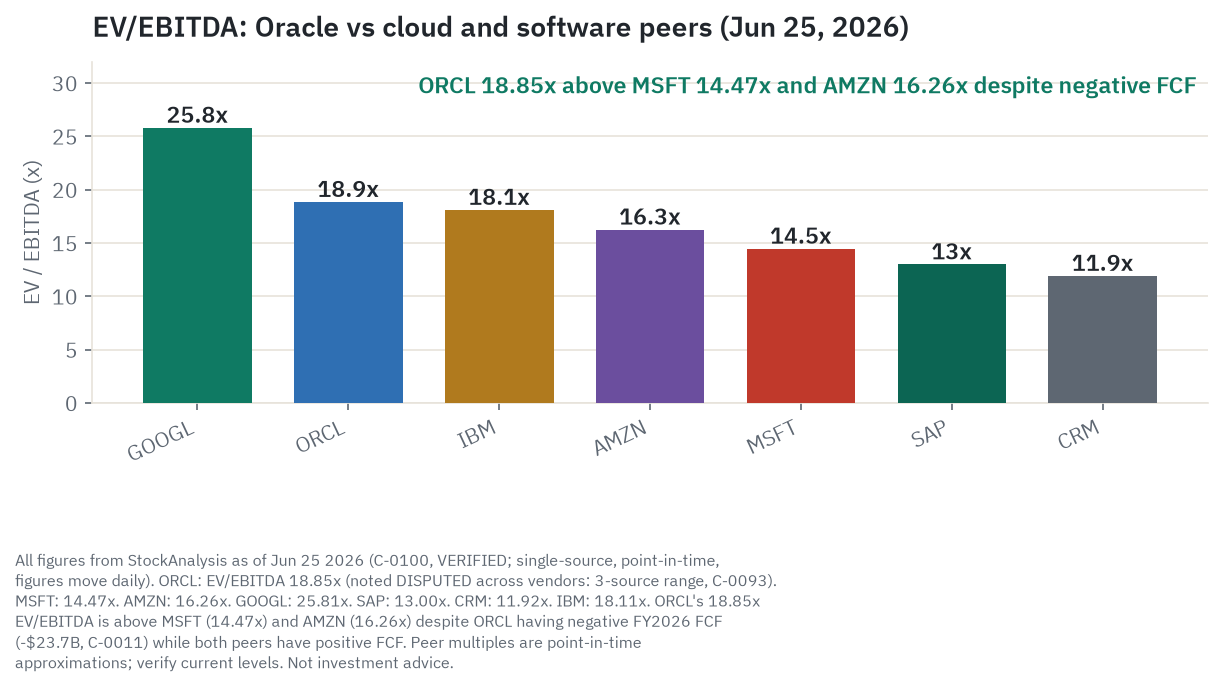
Peer valuation snapshot (June 25, 2026 close, single source - StockAnalysis; verify before acting).
| Ticker | Fwd P/E | EV/EBITDA | Market cap | Cloud/revenue growth | FCF |
|---|---|---|---|---|---|
| ORCL | ~19x | 17-19x [disputed] | $439B | OCI +77% FY2026 | -$23.7B |
| MSFT | ~19.1x | ~14.5x | $2.62T | Azure ~30%+ | positive |
| AMZN | ~27.2x | ~16.3x | $2.44T | AWS ~20%+ | positive |
| GOOGL | ~27.5x | ~25.8x | $4.19T | GCP +63% Q1 2026 | positive |
| CRM | ~10.8x* | ~11.9x | $123B | Revenue +10-13% | positive |
| SAP | ~17.8x | ~13.0x | $176B | S/4HANA Cloud +30% | positive |
| IBM | ~20.6x | ~18.1x | $243B | Software/hybrid | positive |
*CRM forward P/E is likely on a GAAP consensus basis rather than non-GAAP, making direct comparison to ORCL’s non-GAAP-based 19x imprecise - treat as directional. All peer data from StockAnalysis as of June 25, 2026 close, single-source; treat as directional. EV/EBITDA for ORCL is disputed across three methodologies (17.65x GuruFocus, 18.3x own calculation, 18.85x StockAnalysis); all three show ORCL above MSFT and AMZN.
The table’s key observation: ORCL trades in line with MSFT on forward P/E (both near 19x) despite having a materially higher revenue growth rate (34 percent guided for FY2027) and a materially worse FCF position (deeply negative vs. strongly positive). Salesforce at approximately 10.8x forward P/E and 11.9x EV/EBITDA trades at a meaningful discount to ORCL on both metrics, with positive FCF, despite growing revenue 10 to 13 percent against Oracle’s 34 percent guided growth. That gap either reflects the FCF premium the market assigns to Oracle’s growth runway, or an argument that Salesforce is cheap relative to its earnings quality. The reader decides which story to believe.
Oracle Database versus open-source. PostgreSQL competes at the greenfield level; it cannot displace the existing Oracle installed base efficiently. AWS, Azure, and Google Cloud all offer managed PostgreSQL services at 90-plus percent lower cost than Oracle licensing for new applications. AWS has been actively converting Oracle database customers to Aurora PostgreSQL since 2019. The practical result is a market that bifurcates: existing Oracle installations in large enterprises stay (switching cost too high), while new applications are built on PostgreSQL, MongoDB, or other alternatives. Oracle’s MultiCloud database strategy is its primary defense against this long-term erosion.
Oracle SaaS versus SAP and Microsoft. SAP S/4HANA Cloud is growing enterprise ERP cloud revenue at 28 to 32 percent versus Oracle Fusion’s 14 percent. Microsoft Dynamics 365 is growing 19 percent. Workday commands the cloud HCM market with better UI/UX scores in third-party surveys. Oracle’s counter-argument is integration depth (one vendor for database, cloud, ERP, and HCM) and total cost of ownership for customers already in the Oracle stack. That argument is real for existing Oracle customers. For greenfield ERP selection, it is losing to SAP and Microsoft on recent share data.
Financials from the filings
All primary figures from Oracle’s FY2026 10-K (year ended May 31, 2026) and Q4 FY2026 8-K press release (filed June 10, 2026).
Income statement summary.
| Metric | FY2026 | FY2025 | FY2024 |
|---|---|---|---|
| Total revenue | $67,357M | $57,399M | $52,961M |
| YoY growth | +17.3% | +8.4% | - |
| Gross profit | $44,336M | - | - |
| Blended gross margin | 65.8% | 70.5% | 71.4% |
| GAAP operating income | $20,606M | $17,678M | $15,353M |
| GAAP operating margin | 30.6% | 30.8% | 29.0% |
| Non-GAAP operating income | $28,926M | $24,958M | - |
| Non-GAAP operating margin | 42.9% | 43.5% | - |
| Interest expense | $4,599M | $3,578M | $3,514M |
| GAAP net income | $17,087M | $12,443M | $10,467M |
| GAAP diluted EPS | $5.83 | $4.34 | $3.71 |
| Non-GAAP diluted EPS | $7.631 | $6.026 | - |
| Non-GAAP EPS (adjusted base) | $6.83 | - | - |
The non-GAAP EPS of $7.631 includes one-time investment gains. FY2027 non-GAAP EPS guidance of $8.05 uses the adjusted base of $6.83 (excluding those gains) - a distinction that matters when computing the year-over-year growth rate in the guidance.
Gross margin compression. Blended gross margin fell 4.7 percentage points in FY2026, from 70.5 percent to 65.8 percent. The mechanism: OCI grew from approximately 18 percent to 27 percent of total revenue, and OCI’s management-disclosed “AI capacity” gross margin is approximately 32 percent versus an estimated 90-plus percent for License Support. Internal documents obtained by The Information and reported by Data Center Dynamics showed that the pure GPU-rental subset of OCI earned approximately $900 million in revenue and $125 million in gross profit in the quarter ending August 2025 - a 14 percent gross margin. Blackwell GPU rentals were at negative gross margin in that same period. The gap between 14 percent (pure GPU rental) and 32 percent (management-disclosed blended “AI capacity”) is explained by Oracle’s non-GPU OCI services (database cloud, storage, bare-metal compute) carrying estimated gross margins of 50 to 55 percent, which lifts the blended figure. Both numbers are real; neither alone tells the full story. As noted above, Oracle’s undisclosed GPU depreciation schedule adds a further layer of uncertainty to any margin comparison with peers who have adopted longer useful-life assumptions.
Cash flow and balance sheet.
| Metric | FY2026 | FY2025 | FY2024 |
|---|---|---|---|
| Operating cash flow | $31,977M | $20,820M | ~$18,500M |
| Capital expenditures | $55,663M | $21,210M | ~$8,700M |
| Free cash flow | -$23,686M | ~-$390M | ~$9,800M |
| Cash and equivalents | $31,289M | $10,786M | - |
| Total financial debt | $129,541M | $92,576M | - |
| Net debt | ~$98,252M | ~$81,790M | - |
| Net PP&E | $129,647M | $56,667M | - |
| Stockholders’ equity | $43,056M | $20,969M | - |
Net PP&E nearly doubled in one year, from $56.7 billion to $129.6 billion, reflecting the datacenter buildout. Goodwill stands at $62.3 billion, primarily from the Cerner acquisition. Stockholders’ equity turned from deeply negative (historical result of decades of buybacks exceeding retained earnings) to a positive $43.1 billion as Oracle raised $5 billion in equity and retained $17.1 billion in net income in FY2026.
Employee headcount. Oracle’s 10-K (filed approximately June 18, 2026) disclosed total employees fell from approximately 162,000 (FY2025) to approximately 141,000 (FY2026) - a reduction of approximately 21,000 employees (13 percent). The 10-K attributes this to “the adoption and deployment of AI technologies across our operations,” with a related restructuring charge of $1.838 billion in FY2026 (versus $374 million in FY2025).
FY2027 guidance (from Q4 FY2026 earnings call, June 10, 2026). Q1 FY2027 guidance: total revenue growth of 27 to 29 percent; cloud revenue growth of 58 to 64 percent; non-GAAP EPS of $1.72 to $1.76. Full FY2027 guidance: total revenue approximately $90 billion (+33.6 percent); non-GAAP EPS of $8.05; net Oracle cash capex of approximately $70 billion (GAAP-reported capex will be $20 to 25 billion higher due to customer prepayments). Financing plan: approximately $40 billion in new debt plus the $20 billion at-the-market equity program.
Market action and valuation
All data point-in-time to June 25, 2026. Prices move daily.
Price and context. ORCL closed at $152.46 on June 25, 2026, down 3.22 percent on the day. The 52-week intraday high was $345.72 (September 10, 2025, the day of Q1 FY2026 earnings when OCI growth of 77 percent and an RPO surge to $455 billion briefly propelled Oracle toward a $1 trillion market capitalization). The all-time closing high was $325.76 on that same day. The 52-week low is $134.57. At $152.46, the stock is 8.5 percent above the 52-week low and 55.9 percent below the intraday all-time high.
The first major correction came December 11, 2025, when Q2 FY2026 results included a narrow revenue miss and management disclosed a $15 billion upward revision to the capex guidance alongside approximately $248 billion in new long-term datacenter lease commitments. The stock fell 11 to 14 percent that day, erasing more than $360 billion in market capitalization. The post-earnings Q4 FY2026 drop of approximately 10.3 percent (following record results in June 2026, including the $638 billion RPO and 93 percent Q4 OCI growth) was the market’s second rejection of the thesis: even blowout numbers were not enough to reassure investors about FY2027 capex of $70 billion net and the $20 billion ATM equity program.
The re-rating in one paragraph. At Oracle’s September 2025 peak, the stock traded at an estimated 40 to 44x forward non-GAAP earnings - a multiple the market assigned when the RPO narrative dominated and the question was simply “show me the backlog.” The December 2025 capex revision and the $248 billion lease disclosure shifted the market’s frame to “show me the FCF.” The June 2026 ATM announcement and renewed focus on the OpenAI concentration completed the rotation: by June 25, 2026, the stock had repriced to approximately 19x forward earnings, back to the low end of its pre-AI historical range. The multiple has compressed by more than half in nine months, even as the underlying revenue and EPS estimates for FY2027 have not moved dramatically lower. The gap between fundamentals and price is the central tension in the Oracle investment case today.
Valuation multiples.
| Multiple | ORCL | Notes |
|---|---|---|
| GAAP trailing P/E | 26.15x | Two-source confirmed (StockAnalysis + Yahoo Finance) |
| Non-GAAP trailing P/E (ex-one-times) | ~22.3x | $152.46 / $6.83 adjusted FY2026 EPS |
| Forward P/E (FY2027 guidance) | ~18.94-18.96x | $152.46 / $8.05; two-source confirmed |
| Forward P/E (NTM blended) | ~21.7x | GuruFocus, June 22, 2026 |
| EV/EBITDA | 17-19x [disputed] | Range across three methodologies; see notes |
| PEG ratio | 0.66 | StockAnalysis, single-source, directional |
The EV/EBITDA dispute: GuruFocus gives 17.65x (TTM through Feb 2026); own calculation from FY2026 10-K data gives 18.3x; StockAnalysis gives 18.85x (including operating leases in enterprise value). Non-GAAP EBITDA (adding back SBC and restructuring) gives 14 to 15x. The specific figure used should carry the 17 to 19x range and the caveat that non-GAAP adjustments significantly change the implied multiple.
Historical context. ORCL traded at 18 to 22x forward non-GAAP P/E before the AI narrative re-rating in 2025. At the September 2025 peak, the stock reached an estimated 40 to 44x forward earnings (estimate: $325.76 closing price divided by approximately $7.50 to $8.00 consensus EPS estimate at that time; exact consensus not retrieved from primary source). At $152.46 and a ~19x forward non-GAAP P/E on FY2027 guidance, the stock has returned to the low end of its pre-AI historical range. This creates an interesting setup: inexpensive on the non-GAAP earnings framework the sell-side uses, but heavily burdened on a FCF or EV/EBITDA basis versus positive-FCF peers.
Technicals (context only). The stock sits 23.4 percent below its 20-day moving average ($199.43), 19.4 percent below its 50-day ($189.50), and 25.0 percent below its 200-day ($203.61), with all three declining (Barchart, June 25, 2026, single source, point-in-time). The 14-day RSI is 30.85, approaching but not yet in oversold territory (below 30). The 9-day ADX of 34.01 indicates a strong downtrend in force. Oversold conditions can persist for weeks in a strong downtrend; an RSI approaching 30 is context, not a signal.
Sell-side consensus. Of 42 covering analysts (StockAnalysis), 28 rate ORCL Strong Buy, 8 Buy, 5 Hold, 0 Sell, and 1 Strong Sell. The mean 12-month price target is $252.64, implying 65.7 percent upside from the June 25 close. Named analysts maintaining targets well above current levels include Jackson Ader (KeyBanc, $300 target), Brent Thill (Jefferies, $320), and Mark Moerdler (Bernstein, $325). The gap between $252 consensus and $152 current is not confidence - it is uncertainty. Analysts have anchored to a 25 to 30x non-GAAP P/E on FY2027 EPS that implies the AI story plays out; the market is pricing 19x on the same earnings. The reader should interpret the 66 percent implied upside as the premium required to believe every load-bearing assumption simultaneously.
Insider and institutional ownership. Larry Ellison owns approximately 1.16 billion shares, or 40.3 percent of shares outstanding, worth roughly $177 billion at the June 25 close. He has pledged approximately one-third of his shares (roughly 387 million shares) as collateral against personal borrowings, per the September 2025 DEF 14A proxy statement. The specific terms - including any price triggers for a margin call - are not publicly disclosed. This is a risk factor in the proxy, not a prediction of forced selling. Institutional ownership stands at approximately 41.9 percent (Vanguard, BlackRock, State Street as top holders). Short interest was 37.68 million shares (2.22 percent of the float) as of June 15, 2026 per MarketBeat, up 183 percent from the December 2024 low of approximately 13.3 million shares; at 1.2 days to cover, it is not a crowded short.
Sentiment and narrative read
The paradox of the June 10 earnings. Oracle reported record Q4 FY2026 results on June 10, 2026: OCI revenue up 93 percent, total revenue up 21 percent, non-GAAP EPS of $2.11 against $1.89 consensus (an 11.6 percent beat), and a $638 billion RPO. The stock fell roughly 10.3 percent in the following session. Three things drove the sell-off: FY2027 net capex guidance of $70 billion (above expectations), the $20 billion ATM equity program announcement (signaling equity dilution on top of $40 billion in planned new debt), and renewed focus on the OpenAI concentration in the RPO (analysts noted that cloud revenue of $9.91 billion marginally missed $9.99 billion consensus, adding a thin layer of concern). The pattern - beat on every metric except the market’s conviction on capex returns - has repeated twice in six months.
Two narratives in the market. The bull narrative circulating in financial media characterizes Oracle as the “AI infrastructure landlord”: owner of the physical datacenters running OpenAI’s models, with $638 billion in locked-in future revenue, trading at 19x FY2027 guidance after a 53 percent drawdown. Outlets including Motley Fool and 247 Wall Street have run “buy the dip” pieces in May and June 2026.
The bear narrative focuses on the balance sheet picture - deeply negative FCF, $98.3 billion in net debt, and the concentration of the RPO in a single counterparty. Social media commentary has used the phrase “balance sheet time bomb” to describe these concerns. What the factual record establishes is the concentration risk and a network of interdependent financial commitments; the Bloomberg investigation documented the web of cross-investments (OpenAI has committed large sums to Microsoft Azure, NVIDIA has invested in OpenAI, Oracle buys GPUs from NVIDIA, and OpenAI has signed the $300 billion OCI contract) as a real and verifiable fact pattern about concentrated mutual dependencies, not as evidence of fraud or financial engineering.
The private credit market registered its own concern shortly after the December 2025 stock drop. Blue Owl Capital, described in press reports as the primary financial backer for Oracle’s largest datacenter projects, withdrew from a planned approximately $10 billion datacenter-financing arrangement. Project finance lenders typically price execution and occupancy risk more precisely than public equity markets; the withdrawal was a signal that at least one sophisticated lender had revised its view of the cash-flow assumptions underpinning the OCI buildout.
The fundamental divergence. Sell-side analysts have a mean 12-month target of $252.64 (42 analysts, 33 of 42 rating Buy or Strong Buy), implying roughly 66 percent upside from $152.46. The stock has lost 53 percent of its value from the peak and sits 13 percent above its 52-week low. Either the sell-side is systematically anchored to a pre-correction thesis that the market has correctly dismissed, or the market is over-pricing the near-term FCF risk and underpricing the long-dated revenue visibility of $638 billion in committed contracts. The reader cannot resolve this from sentiment data; it requires testing the RPO conversion assumptions against the utilization and credit trajectories.
The KLAS signal on Oracle Health. One area where the market narrative has underweighted a genuine risk is Oracle Health’s customer attrition. Three consecutive years as the largest net loser of hospital customers in the US - losing 56 hospitals in calendar 2025 alone by KLAS Research’s count (analyst-tier source) - does not feature prominently in the OCI-focused bull or bear narratives. The $28.4 billion Cerner acquisition is silently failing by every available third-party metric, and the financial drag from that trajectory is not in consensus models because Oracle does not separately disclose Oracle Health financials.
Employee sentiment. Oracle’s Glassdoor overall rating is 3.5 out of 5 (from 59,948 reviews), down approximately 7 percent over the past 12 months. Only 59 percent of respondents would recommend Oracle to a friend; 55 percent have a positive business outlook. Common themes: continuous restructuring, limited career growth, and loss of unvested stock from layoffs. Time magazine published a feature on April 30, 2026 titled “Inside Oracle’s Mass Layoffs and the Workers Fighting Back.” The FY2026 restructuring charge of $1.84 billion (versus $374 million in FY2025) reflects the scale of the workforce reduction. This is context, not a financial signal - but operational stress in a 13 percent headcount reduction affecting both application and database teams is worth noting.
Governance. ISS and Glass Lewis have historically flagged Oracle’s corporate governance as below peer standards for a company of its size, citing the concentration of strategic, technical, and board oversight authority in Ellison’s concurrent role as executive chairman and chief technology officer. That dual role is unusual for a 40-year-old enterprise technology company. Major institutional holders appear to accept this structure, weighing Ellison’s aligned ownership (40.3 percent of shares) and his directional track record on the cloud strategy against the governance discount. The arrangement makes Oracle unusually dependent on one person’s judgment at a moment when the strategic bet being executed is the largest in the company’s history.
Macro context: the AI capex cycle, rates, and datacenter constraints
The AI capex supercycle and whether it holds. Oracle’s OCI buildout is embedded in a sector-wide investment wave. The four largest hyperscalers (Amazon, Microsoft, Alphabet, Meta) spent an estimated $725 billion in AI-related capital expenditures in calendar 2026, up 77 percent from approximately $410 billion in 2025. Goldman Sachs estimates cumulative spending by these four companies at $5.3 trillion from 2025 to 2030. These are companies spending from operating cash flow, not from borrowed money, and their AI services revenues are growing visibly: Azure’s AI business crossed a $37 billion annualized run rate; AWS grew 28.5 percent to a $190 billion annualized run rate; Google Cloud grew 63 percent in Q1 2026.
The structural case for sustained AI compute demand rests on three compounding forces. Inference demand (serving responses to end users of AI applications) scales with user adoption and runs continuously, unlike training, which is episodic. Agentic AI (automated, multi-step workflows executing without human prompts) generates far more compute per task than a single inference call, creating 24-hour demand that is structurally new. And “test-time compute” - the reasoning pattern in which models like OpenAI’s o-series think for extended periods before answering - uses orders of magnitude more GPU-hours per query than conventional instant-response models.
The industry is also investing at a remarkable pace relative to current AI-specific revenue. Estimates suggest approximately $8 to $10 in infrastructure spending for every $1 of current AI-dedicated revenue. The implied payback period requires revenue to grow 5 to 10x within the hardware’s useful economic life - not impossible given the trajectory of hyperscaler AI services, but a forecast rather than a fact.
The cyclical bear case is specific and has already happened once. AI algorithms are improving in efficiency at approximately 3x per year, according to Deloitte’s 2026 technology analysis. DeepSeek-V3’s innovations in late 2024 and early 2025 demonstrated comparable capability at significantly less compute than prior-generation models, triggering the initial Oracle stock correction in January 2025. Each architectural improvement of that kind reduces the compute required per training run, which could leave Oracle holding capacity that the market no longer needs at the scale originally contracted. H100 GPU spot prices have already fallen 64 to 75 percent from their Q4 2024 peak. CME Group’s 2026 launch of GPU compute futures formalized what the spot market has been signaling for months.
Physical constraints. Building 7 gigawatts of sustained AI datacenter power in the US requires solving a grid interconnection problem that currently averages 4 to 7 years for large projects in technology hub markets. Substation transformer lead times exceeded 160 weeks (more than 3 years) in 2026. The PJM grid interconnection queue (covering the mid-Atlantic and Midwest where several Oracle Stargate sites are planned) had more than 21 gigawatts of projects in engineering procurement status and 8.2 gigawatts under construction as of January 2026 - meaning Oracle’s Michigan, Wisconsin, and Pennsylvania Stargate sites are competing for grid access with dozens of other large projects. The Abilene 600 MW expansion that Oracle and OpenAI cancelled after negotiations over financing and capacity projections broke down illustrates that physical execution risk is not theoretical. Oracle separately delayed multiple other Stargate builds by a year or more due to material and labor shortages.
Interest rates and Oracle’s financing cost. The Federal Reserve held its funds rate at 3.50 to 3.75 percent at the June 17, 2026 FOMC meeting, with most officials projecting rates to remain in the 3.6 to 4.1 percent range through year-end 2026. The 10-year Treasury yield sat near 4.45 percent. Oracle’s existing debt carries a weighted-average rate of 4.43 percent; new BBB-rated issuance would cost approximately 5.45 percent at current spreads. Every incremental $40 billion in new FY2027 debt adds approximately $2.2 billion in annual interest expense at that rate (own calculation, unverified against primary source).
Policy. The EU AI Act reaches full enforcement for high-risk AI systems on August 2, 2026, with penalties up to 7 percent of global annual turnover. Oracle’s EU Sovereign Cloud (Frankfurt and Madrid) positions it as a compliant, data-sovereign alternative to US hyperscalers for European public sector and regulated-industry customers - a genuine competitive differentiation. US GPU export controls drafted in March 2026 establish a tiered system restricting advanced GPU exports to most countries; Oracle’s predominantly US-focused OCI buildout limits direct exposure, but international expansion ambitions in Asia and the Middle East face aggregate procurement caps.
The durability synthesis
The structural bull case. License Support’s gross profit of an estimated $17.8 billion annually (at roughly 90-plus percent margin - UNVERIFIED) is more durable than the bear case assumes. Large banks and government agencies with 20 years of Oracle-specific application layers will not migrate their core systems over any 3 to 5 year horizon. The 8 percent annual price increase passes through with near-100 percent renewal. This annuity is larger than OCI’s entire gross profit contribution ($5.8 billion estimated) at similar revenue scale - and it requires virtually no incremental capital. The $638 billion RPO, even if only 75 to 80 percent converts as contracted (allowing for some renegotiation), still represents approximately $480 to 510 billion in committed future revenue - roughly 7 years of current annual revenues - that provides multi-year insulation against a sudden revenue decline. Oracle DB MultiCloud (+531 percent YoY from a small base) is the most underappreciated move in Oracle’s recent history: it converts would-be License Support churners into cloud database subscribers, earns Oracle revenue on competitor clouds, and decouples the database franchise from the choice of OCI as the primary cloud.
The management team has stated a target of “high-20s” return on invested capital on the OCI buildout - roughly 28 percent, per CFO commentary on the Q4 FY2026 call. On approximately $154 billion in cumulative capex through FY2027 (FY2024 through FY2027 combined), that target implies roughly $43 billion in annual after-tax operating income. Oracle earned approximately $17 billion in after-tax operating income in FY2026. The bull case requires roughly 2.5x the current after-tax operating income - achievable if OCI revenue roughly triples from today while margins improve. That is a long path but a logically coherent one if the RPO converts on schedule.
The structural bear case. Free cash flow is deeply negative and guided to be more negative in FY2027. The bulk of the RPO depends on OpenAI honoring commitments that it has already partially scaled back (the total Stargate pledge was reduced from $1.4 trillion to $600 billion), from a company that reported a $38.53 billion net loss on $13.07 billion in revenue in its most recent available audited year. Moody’s characterized this concentration as “significant counterparty risk.” If AI demand softens or OpenAI renegotiates materially, Oracle holds hundreds of billions of dollars in GPU infrastructure with nowhere near enough alternative demand to absorb it at the utilization rates required for adequate returns. The OCI GPU rental business ran at 14 percent gross margin in the August 2025 quarter (per The Information’s internal document reporting) - not the toll-road economics the bull case describes. Gross margin compression is not complete: from 71.4 percent in FY2024 to 65.8 percent in FY2026, and estimated at 59 to 62 percent in FY2027 (an UNVERIFIED analyst estimate), the trough has not yet been reached.
The synthesis. Oracle is a transformed company executing a high-conviction bet on AI infrastructure, funded by one of the most durable software franchises in enterprise technology. The central question for any investor is whether the OCI revenue ramp proves faster than the database franchise decay timeline, and whether the capex invested earns returns above Oracle’s rising cost of capital. The RPO backlog suggests the demand is real - but the quality of that backlog (concentration in one pre-profitability counterparty, 88 percent of it beyond 12 months, $75 billion in non-standard hardware components) means the headline number deserves careful reading rather than face-value acceptance.
The scenarios in detail
Bull - OCI fills; OpenAI pays; database MultiCloud scales.
Six conditions must hold simultaneously. OCI utilization reaches 80 to 90 percent average on the full 4.5-plus gigawatt Stargate fleet. OpenAI honors approximately 90 percent of the press-reported $300 billion commitment, achievable only if OpenAI’s own revenue scales toward $40 to 50 billion by 2027 to 2028. OCI gross margins improve from 32 percent toward 38 to 40 percent as operating economies of scale kick in. The credit rating holds at BBB/Baa2 with stable outlook. FCF turns positive in FY2028 as capex moderates from the FY2027 peak toward $40 to 50 billion. License Support and MultiCloud hold above $17 billion in combined gross profit. Note: this FCF timing is an analytical estimate; management has not publicly committed to a specific FCF-inflection date.
If all six hold: FY2027 revenue hits or exceeds the $90 billion guidance; FY2028 revenue approaches $115 billion; FY2029 non-GAAP EPS reaches approximately $14.00 (estimate, C-0138). At a 22x multiple (a partial software re-rating as FCF turns durably positive), the stock reaches approximately $308 [estimate] at three years. At five years, FY2031 non-GAAP EPS reaches approximately $19.00 (estimate, C-0137) at a 23x multiple, implying a stock near approximately $437 [estimate].
The single thing most likely to break the bull case: a model efficiency breakthrough at the training cluster level (a second DeepSeek moment, this time affecting the frontier training infrastructure that the Stargate commitment depends on) that reduces the compute per capability unit by 50 percent or more, stopping new large GPU cluster orders and leaving OCI running at 60 percent of target utilization.
Base - Partial delivery; OpenAI holds but scales smaller; FCF inflects FY2029.
OCI utilization averages 65 to 75 percent on expanded Stargate capacity. OpenAI honors approximately 75 to 80 percent of the press-reported $300 billion commitment and routes some compute to AWS and Azure to diversify. Other customers (Meta, NVIDIA, xAI, sovereign AI programs) fill a portion of the gap. OCI gross margin reaches approximately 35 percent by FY2028 to FY2029, short of the management target but above the current 32 percent. FY2027 revenue lands near $87 to 90 billion (near guidance). License Support holds $18 to 19 billion through FY2029. Credit rating holds at BBB/Baa2 negative. FCF turns positive in FY2029 as capex moderates - this is an analytical estimate; management has not publicly guided to a FCF-inflection timeline.
FY2029 non-GAAP EPS reaches approximately $10.50 (estimate, C-0138) at a 19x multiple, implying a stock near approximately $200 [estimate] at three years. At five years, FY2031 non-GAAP EPS reaches approximately $14.00 (estimate, C-0137) at a 19.1x multiple, implying approximately $268 [estimate] - roughly 76 percent above today’s price but reflecting a 3 to 5 year wait for FCF inflection.
The single thing most likely to break the base case into the bear: OpenAI reducing its OCI capacity commitment by 30 to 40 percent, citing changed model training requirements or financial constraints, pushing OCI utilization into the 55 to 60 percent danger zone where margins approach zero.
Bear - OpenAI renegotiates; utilization disappoints; credit comes under pressure.
This is the skeptic’s scenario and requires only one thing to go wrong, not six. OpenAI renegotiates or reduces its press-reported $300 billion commitment by 30 to 50 percent, citing changed model training efficiency requirements, financial pressure, or a strategic shift toward routing compute to Azure (where Microsoft’s equity stake creates a competitive alignment). Oracle’s RPO falls by $100 to 150 billion in a single quarter. OCI utilization on newly built Stargate capacity runs at 55 to 65 percent, approaching the breakeven margin threshold. With FY2027 FCF projected at negative $28 to 32 billion and the planned $40 billion in new debt, Oracle’s leverage ratio pushes above S&P’s loosened 4x trigger. S&P downgrades to BBB-; Moody’s to Baa3. Investment-grade mandates sell Oracle paper; credit spreads blow out from 100 basis points to an estimated 250 to 300 basis points, adding $600 to 800 million in annual interest expense to the financing cost.
The bear probability is not the base case. Moody’s characterized the OpenAI counterparty risk scenario as below 25 percent probability. The investor syndicate backstopping OpenAI (SoftBank, Microsoft, Amazon, NVIDIA, and the April 2026 institutional investors at an $852 billion valuation) has strong incentive to prevent a visible default on the Oracle commitment. But 20 to 30 percent is not a tail risk to mention in a footnote and ignore.
FY2029 non-GAAP EPS near approximately $7.00 (estimate, C-0138) at a 12x distressed multiple implies a stock near approximately $85 [estimate] at three years. At five years, FY2031 non-GAAP EPS near approximately $7.50 (estimate, C-0137) at a 12x multiple implies approximately $90 [estimate]. The database annuity’s gross profit floor prevents the collapse below that level.
Companies to watch (bull / base / bear)
ORCL (primary). The number to watch each quarter is the OCI cloud revenue growth rate, expressed as year-over-year percentage. Above 60 percent for two consecutive quarters: the Stargate ramp is tracking the RPO. Below 40 percent for two consecutive quarters: the utilization-lag bear case is materializing. Management guided Q1 FY2027 at 58 to 64 percent cloud growth.
NVDA (NVIDIA). Oracle is one of NVIDIA’s largest GPU customers, committed to approximately $40 billion in GPU procurement (press reports; unconfirmed in a primary filing with that specific figure). NVIDIA’s quarterly datacenter revenue (reported separately) is the clearest leading indicator for whether AI training cluster demand is accelerating or plateauing. In the bull case for OCI, NVIDIA’s datacenter revenue is simultaneously accelerating. In the bear case, NVIDIA datacenter growth decelerates, signaling that the AI training capex cycle is turning. Internal coverage of NVIDIA’s supply chain dynamics is available in prior research on NVIDIA.
MSFT (Microsoft/Azure). The cooperative-competitive dynamic here is complex. Oracle Database@Azure is a partnership that generates database subscription revenue for Oracle on Microsoft’s cloud. But Azure’s AI business ($37 billion annualized) competes directly with OCI for AI training workloads, and Microsoft’s $13 billion-plus equity investment in OpenAI gives it a structural incentive to route OpenAI’s compute spending toward Azure. Monitor Azure’s AI revenue growth rate as a direct proxy for the share of AI workloads flowing to Microsoft versus Oracle.
AMZN (Amazon/AWS). AWS Aurora PostgreSQL and its managed database services are the primary long-term threat to Oracle’s License Support base. Watch for announcements of major enterprise Oracle database customers migrating to AWS-native databases - each public migration announcement signals the erosion rate is above what Oracle’s MultiCloud strategy can offset. AWS’s H100 capacity block pricing ($3.93/GPU-hour) sets a visible floor for what OCI faces in contract renewals.
SAP. SAP S/4HANA Cloud growing at 28 to 32 percent versus Oracle Fusion ERP at 14 percent is the clearest observable signal of the ERP competitive landscape. If SAP sustains or accelerates that growth-rate differential in 2026 and 2027, Oracle’s SaaS business is losing, not coexisting. SAP’s quarterly cloud revenue growth rate is the proxy metric.
CRM (Salesforce). Salesforce’s Agentforce AI platform is a direct potential rival to Oracle’s embedded AI in Fusion applications. If Agentforce gains traction in enterprise automation workflows, it could stall Fusion CX adoption among new customers and put pressure on Oracle’s cross-sell pitch within existing ERP deployments. Monitor Salesforce’s “paid Agentforce customers” metric as a signal of enterprise AI-agent adoption.
WDAY (Workday). Oracle Fusion HCM’s primary rival. Workday’s net revenue retention rate and new logo wins are the most direct signal of whether Oracle is defending its HCM installed base or losing enterprise HR customers.
SNOW (Snowflake). The data warehouse competitor to Oracle’s data management stack. Snowflake trades at 107x forward earnings on an unprofitable basis, but its growth and customer expansion rates signal market preference for open-data, cloud-native data architectures. A meaningful Snowflake deceleration would be a mild positive for Oracle’s integrated stack pitch.
MDB (MongoDB). The greenfield database threat. MongoDB’s Atlas cloud service is the default choice for many new application workloads that would previously have been Oracle candidates. Watch ARR growth (currently approximately $2.46 billion growing about 23 percent) as a measure of how fast the developer ecosystem is selecting cloud-native document databases over relational alternatives.
CoreWeave (CRWV). The largest neocloud and a pure-play GPU cloud provider. CoreWeave’s stock has fallen approximately 45 percent from its IPO-month peak. If CoreWeave continues to struggle to sustain its premium valuation despite genuine GPU-cloud revenue growth, it signals that the market is repricing pure-play GPU cloud risk - which is directly relevant to how OCI’s GPU-cloud economics should be valued.
Databricks (private, IPO expected late 2026). The leading data lakehouse vendor, valued at approximately $134 billion in December 2025 with ARR near $5.4 billion growing 65 percent. Databricks competes with Oracle’s analytics and data management stack by running on top of hyperscaler infrastructure rather than requiring OCI. If Databricks IPOs at a high multiple, it validates the open-architecture data premium and indirectly pressures Oracle’s integrated-stack valuation argument.
Nebius Group (NBIS). A European-origin neocloud recently added to the Nasdaq-100, valued near $65 to 72 billion. Nebius is primarily a market-sentiment data point for GPU cloud infrastructure valuations: if neoclouds at a fraction of OCI’s capacity are valued at $65 to 72 billion, the market is applying a significant premium to GPU cloud assets that OCI’s consolidated multiple does not fully reflect.
Risk controls
Each risk below is Oracle-specific and quantified where the data supports it.
Capex and FCF risk. At negative $23.7 billion FCF in FY2026 and a guided negative $28 to 32 billion in FY2027, Oracle carries more duration risk per dollar invested than any prior period in its history. If AI demand slows in FY2027, Oracle holds tens of billions in GPU clusters that cannot be quickly re-purposed. The watch signal: OCI year-over-year growth rate below 40 percent for two consecutive quarters.
Stargate and OpenAI concentration. Analysts estimate OpenAI-linked commitments may account for approximately 54 percent of Oracle’s $638 billion RPO (an analyst estimate; not an Oracle-disclosed figure). OpenAI’s own financials show $13.07 billion in FY2025 revenue against a $20.92 billion operating loss; its total Stargate infrastructure commitment was already cut from $1.4 trillion to $600 billion. Monitor OpenAI’s fundraising trajectory and any change in the operational relationship (additional Stargate project cancellations, disclosed scope reductions, routing of workloads to Azure). The Abilene 600 MW cancellation is the reference precedent for what a partial renegotiation looks like.
License Support decay. If AWS or Azure accelerates conversion of Oracle database customers to open-source managed services, the high-margin annuity that funds the capex shrinks faster than cloud revenue can offset. Monitor Oracle’s License Support revenue year-over-year each quarter. A shift from flat-to-slightly-declining to a clear negative print (down 5 percent or more YoY) would signal the erosion rate is accelerating.
Credit and leverage. S&P’s loosened 4x adjusted leverage trigger could be approached in FY2027 to FY2028. A downgrade to sub-investment-grade (BB or lower) forces selling by IG bond mandates on $129.5 billion in outstanding bonds, widens Oracle’s borrowing cost, and raises the cost of the planned $40 billion FY2027 issuance at exactly the wrong moment. The approximately $248 billion in additional operating lease commitments compounds the fixed-cost exposure. Monitor: S&P and Moody’s quarterly reviews; Oracle’s reported leverage on earnings calls.
Competitive displacement in SaaS. If SAP or Microsoft wins materially more large-enterprise ERP contracts in 2026 to 2028, Oracle Fusion’s 14 percent growth rate compresses toward low single digits. The SaaS business is not an existential risk at any plausible near-term competition rate, but it removes an important cushion.
Cerner integration risk. The $28.4 billion Oracle Health acquisition has failed by every available third-party customer satisfaction metric (KLAS 2026). Three consecutive years of net hospital losses, 30 percent of customers not planning to remain long-term, and no visible revenue inflection in Oracle’s financials four years post-acquisition suggest the acquisition thesis has not been validated. Monitor: KLAS annual market share report (published annually in Q2); any Oracle Health revenue disclosure.
GPU supply and NVIDIA relationship. Oracle’s OCI build depends on NVIDIA GPU supply allocation. NVIDIA also prioritizes AWS, Azure, and Google Cloud, which buy in greater absolute volume. If NVIDIA allocates GPU supply away from Oracle in a tight-supply quarter, Oracle’s capacity build slips. Monitor: NVIDIA quarterly datacenter revenue and any management commentary on allocation priorities.
Ellison pledged shares. Larry Ellison has pledged approximately one-third of his shares (roughly 387 million shares) as collateral against personal borrowings, per the September 2025 DEF 14A proxy. The specific price trigger terms are not publicly disclosed. The stock is currently 13.3 percent above the 52-week low of $134.57. At or near that low, margin-call mechanics on pledged shares could create forced selling pressure equivalent to roughly 22.6 percent of the public float - a tail risk, not a prediction.
Regulatory. The February 2026 securities class-action (pending, unproven allegations; Oracle has not admitted any wrongdoing) creates a contingent liability not in consensus forecasts. The FTC and DOJ antitrust attention to Oracle’s database pricing power and the Stargate cross-investment web are a headline risk. EU AI Act enforcement from August 2, 2026 adds compliance costs for OCI European operations.
Methodology, sourcing, and data-quality flags
The rules-based rating below is generated from publicly available financial data as of 2026-06-25. It is a research signal, not a recommendation to buy or sell.
Valuation. Oracle’s forward non-GAAP P/E of approximately 19x on FY2027 management guidance of $8.05 (C-0061, VERIFIED, two sources: StockAnalysis 18.96x and Yahoo Finance 18.87x) sits at the low end of Oracle’s pre-AI historical range of 18 to 22x forward non-GAAP earnings - matching Microsoft’s current multiple (19.1x) despite a materially higher revenue growth rate. The PEG ratio of 0.66 (C-0094, StockAnalysis, single source, directional) looks inexpensive against guided 34 percent revenue growth. The offsetting considerations are real: GAAP trailing P/E is 26.15x (C-0092, VERIFIED, two sources) on a company with negative $23.7 billion FCF (C-0011, VERIFIED); EV/EBITDA of 17 to 19x (C-0093, DISPUTED across three methodologies) is above Microsoft (14.5x), Amazon (16.3x), and SAP (13.0x), all of which carry positive FCF; and the $8.3 billion in pre-tax non-GAAP addbacks (SBC $4.8B + amortization $1.7B + restructuring $1.8B; C-0054, VERIFIED) are real economic costs to shareholders. Valuation is fair on the non-GAAP framework the market uses; not cheap on a cash-generation or EV/EBITDA basis versus positive-FCF peers.
Growth. FY2026 total revenue grew 17.3 percent to $67.4 billion (C-0049, VERIFIED, primary). OCI grew 77 percent to $18.1 billion (C-0002, VERIFIED) and accelerated to 93 percent in Q4 (C-0050, VERIFIED). Management guided FY2027 at approximately $90 billion plus 34 percent growth and $8.05 non-GAAP EPS (C-0061, VERIFIED). The $638 billion RPO (C-0015, VERIFIED, primary 8-K) provides multi-year revenue visibility. Oracle DB MultiCloud grew 531 percent YoY in Q3 FY2026 (C-0035, VERIFIED). Hyperscaler AI capex of $725 billion in CY2026 (C-0101, VERIFIED) supports structural demand runway. Against: Oracle Health net losses of 56 hospitals in calendar 2025 (C-0083, analyst tier - KLAS Research); SAP S/4HANA Cloud growing 28 to 32 percent versus Oracle Fusion’s 14 percent; software license declining 2 percent YoY. The OCI trajectory dominates the growth picture by a wide margin, producing the strongest single factor score.
Quality. License Support at $19.8 billion and an estimated 90-plus percent gross margin (UNVERIFIED; C-0032) generates roughly $17.8 billion in annual gross profit - the structural quality anchor. GAAP operating margin was stable at 30.6 percent in FY2026, 30.8 percent in FY2025, and 29.0 percent in FY2024 (C-0053, VERIFIED, primary 10-K), with stability maintained by cutting SG&A 3 percent YoY and holding R&D growth below revenue growth. SBC at 7.1 percent of revenue (C-0129, VERIFIED) is below pure-play SaaS peers. Against: FCF fell from approximately positive $9.8 billion (FY2024) to negative $23.7 billion (FY2026) (C-0011, VERIFIED) - a $33.5 billion deterioration in two years; net debt stands at $98.3 billion at 3.3x net debt to GAAP EBITDA (C-0058, VERIFIED); S&P BBB negative and Moody’s Baa2 negative both flag trajectory concern (C-0059, VERIFIED, primary S&P action); interest expense grew 28.5 percent to $4.6 billion (C-0059, VERIFIED); and the dividend is effectively funded by new borrowings rather than FCF. The License Support franchise is high-quality; the balance sheet and cash flow are not.
Risk. Several concurrent severe risk factors are simultaneously active. Moody’s named “significant counterparty risk” from OpenAI concentration (C-0059, VERIFIED, primary). A securities class-action was filed February 3, 2026 (C-0113, pending, unproven allegations; Oracle has not admitted any wrongdoing). S&P’s 4x adjusted leverage trigger could be approached in FY2027 to FY2028 as $40 billion in new debt is planned (C-0061, VERIFIED); a downgrade below investment-grade would force selling by IG mandates across $129.5 billion in bonds. H100 GPU spot prices have fallen 64 to 75 percent from peak (C-0105, VERIFIED), compressing contract renewal economics. Oracle Health lost 56 hospitals in calendar 2025 (C-0083, analyst tier). Larry Ellison has pledged approximately one-third of his shares as collateral (C-0098, VERIFIED, primary proxy); trigger terms are not publicly disclosed. The $20 billion ATM program adds approximately 4.6 percent dilution (C-0061, VERIFIED). Multiple severe risk factors operating simultaneously produce the most negative factor assessment in the read.
Momentum. The stock declined 53.2 percent from the September 10, 2025 all-time closing high of $325.76 to $152.46 on June 25, 2026 (C-0088, VERIFIED, two sources). The stock sits 8.5 percent above the 52-week low (C-0088, VERIFIED) and well below its 20-day ($199), 50-day ($190), and 200-day ($204) moving averages (C-0099, Barchart, single source, point-in-time), all of which are declining. The 9-day ADX of 34.01 signals a strong downtrend in force. Short interest rose 183 percent from the December 2024 low (C-0097, MarketBeat press-tier). The Q4 FY2026 record results produced a roughly 10.3 percent post-earnings stock decline (C-0107, VERIFIED) - a negative signal that the market does not yet price the capex as productive. Partially offsetting: 36 of 42 covering analysts rate Buy or Strong Buy (C-0096, VERIFIED) with a consensus mean target of $252.64 (C-0096, VERIFIED), representing a substantial floor of institutional demand at lower prices. Momentum is negative; the sell-side positioning provides partial offset.
The overall lean. Growth is genuinely strong and the database franchise is genuinely durable. The combination of severe risk factors (OpenAI concentration, credit trajectory, FCF inversion), mixed quality (fortress annuity offset by deeply negative FCF and rising financial debt), a strong downtrend, and a valuation that is fair rather than cheap produces a balanced read. On balance, the lean is Hold.
Data-quality flags for this article.
- Stock price $152.46 and market cap $439.16 billion: point-in-time as of June 25, 2026 (C-0085, C-0086, VERIFIED, two sources each). Move daily.
- FY2026 revenue, capex, FCF, and operating cash flow: from Oracle’s FY2026 10-K and Q4 FY2026 8-K (primary tier, VERIFIED).
- RPO $638 billion: from Oracle’s Q4 FY2026 8-K (primary tier, VERIFIED, C-0015).
- RPO composition by recognition period: from Oracle’s Q4 FY2026 8-K (primary tier, VERIFIED).
- License Support gross margin ~90%+: UNVERIFIED analyst estimate (C-0032); Oracle did not separately disclose License Support gross margin in FY2026.
- Blended SaaS gross margin ~75-83%: UNVERIFIED derived estimate (C-0132).
- OCI contracted price ~$3-4/GPU-hour: UNVERIFIED estimate (C-0133), derived from dividing reported annual deal value by estimated GPU count.
- FY2027-FY2028 blended gross margin estimates ~59-62%/~57-60%: UNVERIFIED analyst estimates (C-0135).
- License Support gross profit crossover with OCI at approximately $56-59 billion OCI revenue: UNVERIFIED derived estimate (C-0136).
- OpenAI ~54% of RPO: ANALYST ESTIMATE, not Oracle-disclosed (C-0110); Moody’s separately cited “significant counterparty risk” from concentration without specifying a percentage.
- $300 billion OpenAI-Oracle contract value: from press reports citing sources familiar with the terms; Oracle has not separately disclosed this figure in its SEC filings; treat as an approximate reported number (C-0017, press-tier, VERIFIED).
- CDS spread greater than 125 basis points and Barclays Underweight downgrade: from press reports citing credit market data (C-0116, press-tier secondary source); point-in-time, verify current levels before drawing conclusions. Normal investment-grade CDS spreads run approximately 50 to 100 basis points; Oracle’s spread above 125 basis points at the December 2025 trough placed it near the speculative-grade boundary by credit market pricing.
- ~$248 billion in new long-term datacenter lease commitments disclosed December 2025: from press reporting of Oracle’s Q2 FY2026 earnings disclosure; press-tier, verify against the Q2 FY2026 10-Q footnotes before use in financial models.
- Blue Owl Capital ~$10 billion datacenter-deal withdrawal: press-tier, single source characterization; point-in-time.
- MongoDB ARR approximately $2.46 billion growing ~23%: from MongoDB FY2026 results (C-0076, press-tier, directional).
- PostgreSQL ~18.6% vs Oracle ~9.55% deployment share: from 6sense data as reported in The Register, April 2026 (C-0082, press-tier, directional); by revenue share Oracle remains in the top tier.
- GPU spot pricing comparisons: spot market data is highly volatile; figures cited are point-in-time and may differ materially from current rates.
- GPU useful-life depreciation schedule (3-year vs 5-6 year): Oracle has not disclosed its assumption; 4-7pp margin impact is sourced to micro.md research cluster (C-0130, press-tier from The Information).
- Forward scenario EPS and price estimates (all [estimate] labels in text): own scenario arithmetic anchored on Oracle management FY2027 guidance of $8.05 non-GAAP EPS (C-0061, VERIFIED); not sourced from external analyst models; labeled “estimate” throughout. None is a price target.
- EV/EBITDA: DISPUTED (17.65x, 18.3x, and 18.85x across three methodologies; see market.md for detail).
- FY2025 IaaS and SaaS sub-line revenues: derived from stated percentage growth rates, pending direct verification from FY2025 10-K.
- FY2024 capex exact figure: multiple sources cite slightly different numbers; the $6.9 billion figure is from the outline; $8.7 billion appears in other sources; discrepancy may reflect inclusion/exclusion of capitalized leases.
- FCF-inflection timing (FY2028 bull / FY2029 base): analytical estimate only; Oracle management has not publicly guided to a specific FCF-inflection date.
- All fiscal-year data uses Oracle’s May 31 fiscal year-end; comparisons to calendar-year peers require date alignment.
Primary sources. Oracle FY2026 10-K (year ending May 31, 2026), Q4 FY2026 8-K earnings press release (June 10, 2026), Q3 FY2026 10-Q, Q1 FY2026 10-Q, February 2026 Form FWP (debt offering), September 2025 DEF 14A (proxy; Ellison share pledge). All SEC filings accessed via EDGAR (CIK 0001341439).
Analyst-tier sources. KLAS Research 2026 EHR Market Share Report (Oracle Health customer data); Deloitte 2026 Technology Outlook (AI compute efficiency); Goldman Sachs AI capex estimates; StockAnalysis.com and GuruFocus (valuation multiples, peer comparison); 6sense database deployment share data.
Press-tier sources. Oracle investor relations press releases; The Information (OCI GPU margin internal documents, reported by Data Center Dynamics); Bloomberg (AI deal web documentation); WSJ; Reuters; CNBC; Motley Fool; MarketBeat (short interest); Barchart (technical data); IntuitionLabs (GPU pricing comparison); The Register (database deployment share analysis).
This article reflects publicly available information as of 2026-06-25 and is not investment advice. The rating shown is a rules-based research signal generated from disclosed financials and public OSINT; it is not a recommendation to buy, sell, or hold ORCL or any other security.