
Research date: June 25, 2026 | OSINT market research on Arm Holdings plc (ARM, Nasdaq ADS), the processor architecture licensor whose IP sits inside more than 90 percent of smartphone chips and a fast-growing share of hyperscaler datacenter CPUs; majority-owned by SoftBank Group; fiscal year ends March 31 (FY2026 = April 2025 - March 2026)
Important disclaimer. This is independent OSINT (open-source intelligence) research compiled for educational and informational purposes only. It is not investment advice, not a recommendation or solicitation to buy, sell, or hold any security, and not a statement that any security is suitable for you. The author is not a financial advisor and has no fiduciary relationship with any reader. Arm Holdings carries specific risks that go beyond ordinary semiconductor exposure: SoftBank Group controls approximately 87 percent of the shares and could direct the company’s strategy in ways that benefit SoftBank at the expense of minority ADS holders; approximately 16 percent of revenue flows through Arm China, an entity Arm does not control and cannot fully audit; Bloomberg and Tom’s Hardware reported in May 2026 that the US FTC opened an early-stage antitrust investigation into the AGI CPU launch - no formal complaint has been filed; the Qualcomm counter-suit outcome is unconfirmed as of this writing; the stock trades at roughly 160 times forward non-GAAP earnings; and RISC-V is a real long-range structural threat to the royalty model. All of these risks are material and two-sided. The rules-based rating below is a research signal, not a directive. All figures are point-in-time (as of June 25, 2026 unless otherwise stamped) and move fast - prices, market caps, multiples, and legal status may be stale within hours of publication. Any bull / base / bear scenarios and illustrative valuations are arithmetic on stated assumptions, not price targets, predictions, or guarantees. Do your own due diligence and consult a licensed professional before making any financial decision.
Where this stock could be in 6 months, 1 year, 3 years, and 5 years
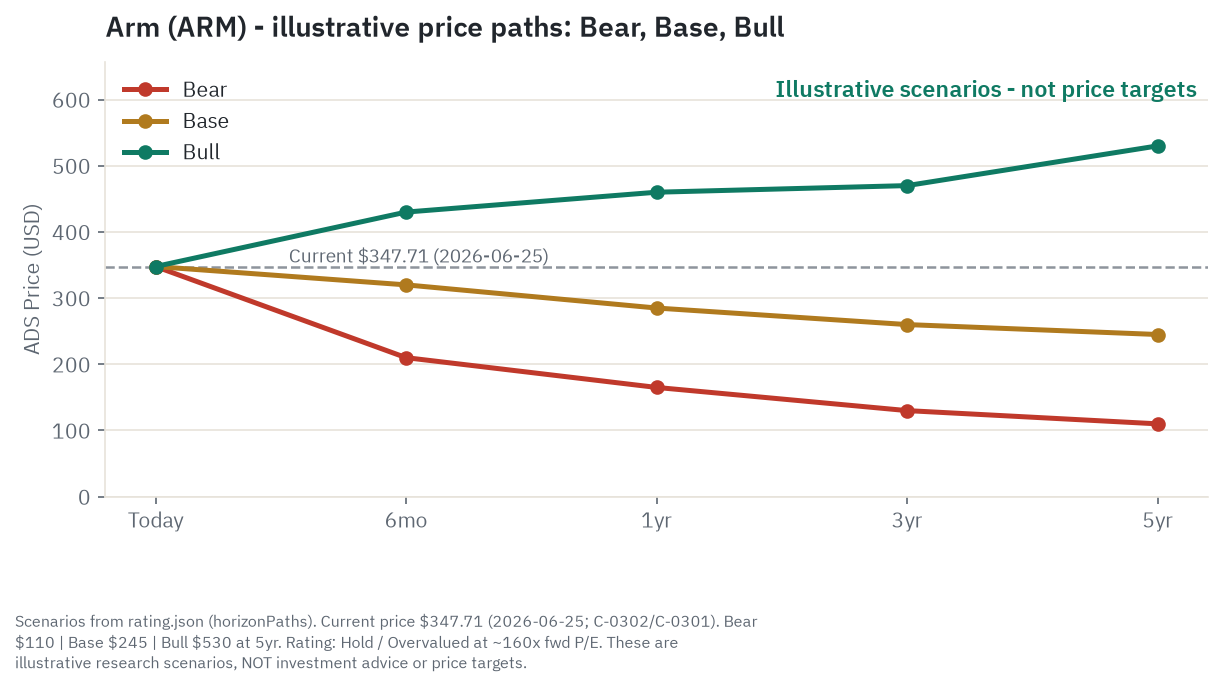
Arm Holdings ADS closed at $347.71 on June 25, 2026, giving the company a market capitalization of roughly $370 billion (price and cap are point-in-time; figures move daily). The stock is up about 205 percent year to date from a base near $108-109 in late 2025, reached a disputed 52-week high somewhere in the $428-$453 range, and was trading lower intraday on June 26 as this research was compiled. The cone of outcomes below is wider than for almost any other large-cap name in this series - because at 160 times forward earnings, the multiple, not the business, is the binding variable for every horizon. Each range is arithmetic on stated assumptions and carries no guarantee.
6 months. The outcome at this horizon sits almost entirely on one data point: the Q1 FY2027 earnings release, scheduled for July 29, 2026. Q4 FY2026 royalty revenue grew only 11 percent year over year, the weakest reading in the fiscal year and a deceleration from Q3’s 27 percent. If Q1 royalties re-accelerate to 20 percent or above, the v9 and CSS rate-uplift thesis is confirmed and the stock likely recovers toward the $400-$430 range [bull estimate]. If Q1 prints in the 12-18 percent range, the stock consolidates below current levels, in the $300-$320 range [base estimate]. If Q1 comes in at or below 11 percent, the Goldman Sachs and New Street Research bear arguments gain traction, the multiple compresses sharply from 160 times toward 100 times, and the stock falls toward $200-$210 [bear estimate]. The single thing most likely to flip this window: the royalty growth number printed July 29.
1 year. The twelve-month window adds a second variable: AI capex guidance from Amazon, Microsoft, Alphabet, and Meta in their October and November 2026 earnings calls. ARM at 160 times forward earnings is priced on perpetual high growth; a capex guidance cut by two or more of the major hyperscalers would reprice the multiple before any actual royalty line impact arrives. The FTC probe status is a secondary variable - a formal complaint would compress the CSS royalty rate premium that drives the bull case. In the base, the stock sits near $285 as a 160 times multiple drifts toward roughly 102 times on rising but not accelerating forward earnings [base estimate]. The bull reaches $460 on 20-percent-plus royalty growth and AGI CPU pipeline expansion [bull estimate]. The bear reaches $165 as AI capex guidance softens and the FTC probe escalates, with the Goldman $150 target forming the floor of the debate [bear estimate].
3 years. Structural drivers begin to dominate by mid-2029. The AGI CPU is either generating meaningful revenue by then - management guided first material sales in FY2028 - or it is not. The royalty rate mix-shift (Armv8 to Armv9 to CSS) is either tracking management’s 20 percent CAGR target or it has settled lower. In the bull, AGI CPU reaches $3-4 billion in annual revenue and the royalty CAGR holds at 20 percent, for earnings per share near $5.90 at an 80 times exit multiple - giving roughly $470 [bull estimate]. In the base, partial AGI CPU delivery ($2 billion annual) and 17 percent royalty CAGR produce EPS near $4.00 at 65 times for a $260 stock [base estimate]. In the bear, an FTC remedy caps CSS royalty rates and the AGI CPU stalls, royalty CAGR settles to 12 percent, and at 50 times on $2.63 EPS the stock reaches $130 [bear estimate].
5 years. The five-year horizon is the clearest expression of what an entry at 160 times forward earnings actually costs you in return. In the bull, near-management-target execution - roughly $22 billion in combined IP/CSS and AGI CPU revenue - produces EPS near $7.80; at a 68 times exit multiple the stock reaches $530 [bull estimate], a 9 percent annualized gain from today. The skeptic correctly notes that a 9 percent annualized return barely compensates for the risk of holding a 160 times multiple stock for five years. In the base, partial AGI CPU delivery and 17 percent royalty CAGR produce EPS near $4.97; at 49 times the stock reaches $245 [base estimate], roughly a 7 percent annualized loss from today. In the bear, AGI CPU falls short and royalty CAGR settles to 12 percent; at 35 times on $3.11 EPS the stock reaches $110 [bear estimate], a 21 percent annualized loss. In all three scenarios, five-year returns from a $347.71 entry are poor - not because the business fails, but because the entry price forecloses the return.
Where the read lands today. I keep landing on Hold, and it has nothing to do with the company and everything to do with the price. This is an A-plus business - near-monopoly architecture, 97.5 percent gross margins, a royalty annuity that compounds for decades, and a genuine structural shift in its favor as AI infrastructure spending tilts toward Arm-based CPUs. At 160 times forward earnings, the stock is priced for all of that to continue without interruption for the better part of a decade. The math barely works even in the bull scenario. That is not a business verdict; it is a price verdict.
Companion tool
Jump to the interactive dashboard to explore the 16-company ecosystem table, the rating panel, and the four-horizon scenario breakdown. Download the Excel model to adjust the royalty-driver assumptions - the Royalty Driver sheet has yellow-highlighted cells for chips shipped, ASP, and rate percent so you can run your own numbers.
TL;DR
Arm Holdings licenses the instruction-set architecture that sits inside more than 90 percent of smartphone chips and, as of FY2026, roughly 50 percent of hyperscaler CPU compute capacity. It collects two revenue streams from those chips: an upfront license fee when a chip designer signs on, and a per-chip royalty annuity that flows for the entire production life of the design - sometimes 15-20 years in automotive. In FY2026 (year ended March 2026), Arm generated $4.92 billion in total revenue, up 23 percent year over year, split roughly 53 percent royalty ($2.61 billion) and 47 percent license ($2.31 billion), at a GAAP gross margin of 97.5 percent - the highest of any substantial public semiconductor company. The bull thesis rests on a specific mechanism: as the installed base migrates from Armv8 architecture to Armv9 (which analysts estimate carries roughly twice the royalty rate) and then to Arm’s Compute Subsystems (CSS, which analysts estimate carries roughly twice the Armv9 rate), royalty revenue grows faster than unit volumes with no additional chips shipped. Arm’s share of hyperscaler CPU compute grew from 9 percent in FY2022 to roughly 50 percent in FY2026, and datacenter royalties more than doubled year over year in both Q3 and Q4 FY2026. Management’s aspirational targets, disclosed in the May 2026 investor presentation, call for $10 billion in IP and CSS licensing revenue and $15 billion in revenue from the new AGI CPU chip business by FY2031, producing more than $9 in non-GAAP EPS. The problem is the price. At $347.71 per ADS and a market cap of roughly $370 billion (June 25, 2026), the stock trades at roughly 160 times forward non-GAAP earnings - one of the highest multiples in large-cap technology. The consensus mean analyst price target on most aggregators sits 11-20 percent below the current spot. Even in the bull scenario, five-year returns from this entry price barely reach 9 percent annualized. The overall read is Hold, driven by a clear growth case, elite business quality, and a valuation that forecloses most of the return even if execution is clean.
Explore it yourself: the interactive dashboard
Open the dashboard full screen
What Arm Holdings actually is
Arm Holdings plc is not a chip company. It designs no products for sale, operates no factory, and ships no devices. Instead, it maintains the instruction-set architecture (ISA) that tells a chip how to process instructions - the grammar of computing - and licenses that grammar to chip designers who then build their own silicon on top of it.
The ISA is called the Arm architecture. Think of it like a musical notation system: Arm writes the rules for how notes (instructions) are written and read, and every composer (chip designer) who wants to write music that a Arm-compatible orchestra (processor) can perform must hold a license from Arm. The orchestra is the physical chip. The licensee is the chip designer - Apple, Qualcomm, MediaTek, Nvidia. Arm sits above all of them, collecting a toll on every performance.
Three types of license govern the relationship. An Architecture License Agreement (ALA) grants the holder the right to design a completely custom microarchitecture that is compatible with the Arm ISA - the licensee can build their own “orchestra” from scratch as long as it reads the same notation. Apple, Qualcomm (via its Nuvia acquisition), and a handful of hyperscalers hold ALAs; they pay higher upfront fees and, typically, lower per-chip royalty rates. A Technology License Agreement (TLA) is narrower: the licensee licenses Arm’s own pre-designed CPU core blueprints (Cortex-A for mobile and application processors, Cortex-M for microcontrollers, and Neoverse, Arm’s server and datacenter CPU IP product family, the datacenter equivalent of its mobile Cortex-A line) and integrates them. MediaTek, Samsung System LSI, and most automotive chip vendors hold TLAs; they pay per core design and a per-chip royalty. A Compute Subsystem (CSS) license goes further still: it bundles a full pre-integrated CPU complex - cores, cache, interconnect, memory controller - into a ready-to-tape-out block. CSS commands the highest royalty rates in the portfolio. The Arm Total Access (ATA) subscription bundles all current and future IP into an annual flat fee, converting the licensing model from lumpy per-deal to ratable subscription revenue.
Arm Holdings plc is incorporated in the United Kingdom and listed on Nasdaq as American Depositary Shares (ADS), each representing one ordinary share. SoftBank Group Corp holds approximately 86.72 percent of the shares (922.73 million of roughly 1,064 million), through an entity called Kronos II LLC. The public float is roughly 142.6 million ADS, about 13.3 percent of total shares. Arm is a “controlled company” under Nasdaq listing rules - SoftBank controls every major shareholder vote - and a foreign private issuer, which means it files a 20-F (not a 10-K) for its annual report and 6-K forms for interim results, rather than the 10-Q that US domestic companies file. The fiscal year ends March 31: FY2026 covers April 1, 2025 through March 31, 2026.
How money flows through Arm’s business
flowchart TD
    SM["Smartphones - global SoC market ~$52B 2025"]
    DC["Datacenter and AI - Cloud AI TAM ~$330B 2026"]
    AU["Automotive and IoT - design-win royalty ramp FY2026-FY2029"]

    SM --> LIC
    DC --> LIC
    AU --> LIC

    LIC["SoC Designers - the licensees\nApple ALA, Qualcomm TLA, MediaTek TLA\nNvidia Grace, AWS Graviton, Google Axion, Microsoft Cobalt"]

    LIC -->|"Upfront license fee: ALA, TLA, or ATA subscription"| ARM

    LIC --> FAB["Foundries - commodity, no Arm revenue\nTSMC, Samsung Foundry, SMIC"]

    FAB --> OEM["OEMs and Hyperscalers\nApple, Amazon, Meta, Microsoft, Samsung, Dell"]

    OEM -->|"Per-chip royalty on every unit shipped\nv8 ~2.5-3.5 pct ASP, v9 ~5 pct ASP, CSS ~10 pct ASP"| ARM

    ARM["ARM Holdings - ISA architecture toll-taker\n$4.92B FY2026 revenue: 53 pct royalty, 47 pct license\n350B+ chips shipped cumulatively"]

    ARM --> RD["R and D reinvestment\nArmv9, CSS, AGI CPU"]

    ARMCN["Arm China JV - ~16 pct of ARM FY2026 revenue\nArm ~48 pct stake, Chinese investors control board\ngeopolitical and RISC-V erosion risk"]
    ARMCN -->|"Sub-license royalties to ARM"| ARM

    RISCV["RISC-V - free open ISA\n~25 pct China AI/IoT 2025\nlong-run structural ISA threat"]
    RISCV -.->|"IoT and China erosion"| LIC

    FTC["FTC Antitrust Probe May 2026\nAGI CPU competing with licensees\nchokepoint: ISA access vs silicon sales"]
    FTC -.->|"governance and structural risk"| ARM
The chart above captures the full architecture-toll structure. End-market demand - smartphone buyers, hyperscaler capital spending, automotive production schedules - originates on the left. It flows to chip designers (the licensee layer), who pay Arm an upfront license fee before a single chip is manufactured. The chip then goes to a foundry (TSMC for most premium Arm-based chips; Samsung Foundry for others; SMIC for Chinese domestic production at older nodes). Arm has no direct relationship with the foundry and earns nothing from wafer starts. The royalty clock starts when the chip ships to an OEM or a hyperscaler - and it ticks for the entire production life of that chip design. In automotive, that can run 15-20 years.
Two chokepoints interrupt the otherwise clean toll model. Arm China (the Anba Technology joint venture, where Arm holds roughly 47 percent but Chinese investors control the board) routes approximately 16 percent of FY2026 revenue through a structure Arm cannot fully audit or compel. And an early-stage FTC probe - reportedly opened in May 2026 according to Bloomberg and Tom’s Hardware - examines whether Arm’s March 2026 AGI CPU launch is restricting ISA access to competitors while selling competing silicon. No formal complaint has been filed.
The two revenue engines: upfront licenses and the royalty annuity
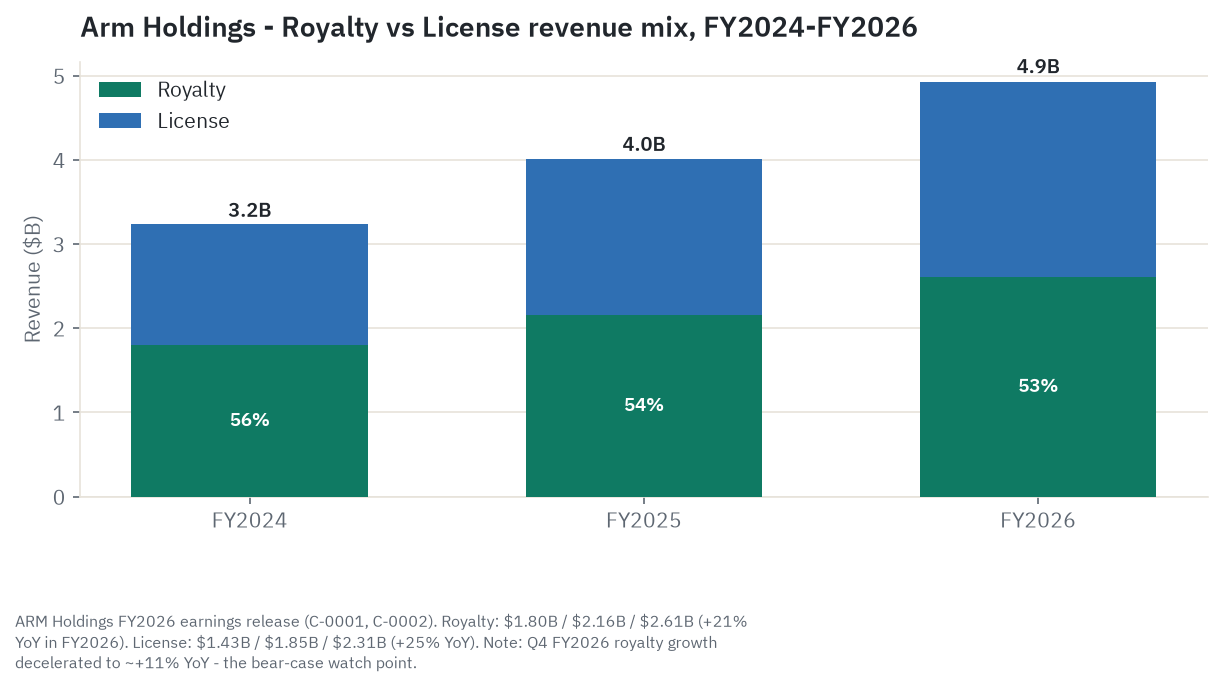
Arm’s income statement has two fundamentally different revenue lines, and understanding the difference is the prerequisite for any valuation discussion.
License revenue is the leading indicator. When a chip designer signs an ALA, TLA, or ATA agreement, Arm collects an upfront payment or a ratable subscription fee. License revenue was $2.31 billion in FY2026, up 25 percent year over year. It is lumpy - large multi-year contracts can land any quarter - and it is early in the causal chain. A license signed today for a new server CPU design will not generate volume royalties until that chip reaches production, typically three to seven years later.
Royalty revenue is the lagging annuity. Arm receives a royalty for every chip shipped by a licensee using Arm IP. The royalty is reported on a one-quarter lag (licensees self-report chip shipments and pay in the following quarter). Royalty revenue was $2.61 billion in FY2026, up 21 percent year over year, and represents 53 percent of total revenue. This line is the structural core: each percentage point of the royalty base that converts from Armv8 to Armv9 or to CSS generates more dollars without a single additional chip shipped. Royalties from a licensed design continue flowing for the entire production life of that design - Arm has described automotive chip royalties running 15-20 years from a single license event.
The chart above shows the three-year progression: total revenue grew from $3.23 billion in FY2024 to $4.92 billion in FY2026, the third consecutive year above 20 percent growth. But the Q4 FY2026 quarterly detail is the number the bear case rests on. In Q4 (January-March 2026), royalty revenue was $671 million - up only 11 percent year over year, against 27 percent in Q3 and 21 percent in Q2. License revenue in Q4 hit a record $819 million (up 29 percent), so the headline Q4 number of $1.49 billion (up 20 percent) looked fine. Beneath it, the royalty deceleration from Q3’s 27 percent to Q4’s 11 percent at the exact moment management was announcing the most ambitious long-range targets in company history is the most load-bearing data point in the entire bear case. Q1 FY2027 results on July 29, 2026 will tell us whether Q4 was a smartphone-cycle anomaly or the leading edge of structural deceleration.
Two forward indicators matter for future royalty revenue. Annualized Contract Value (ACV), the annual run-rate dollar value of all signed subscription and licensing commitments, grew 22 percent to $1.66 billion in Q4 FY2026 - strong. Remaining Performance Obligations (RPO) - the contracted but not-yet-recognized license and subscription backlog - fell 7 percent year over year to $2.07 billion at March 31, 2026. Management attributed this to faster revenue conversion, not contract cancellations. The bears read it differently: if the royalty annuity is accelerating as presented, the backlog filling the future royalty pipeline should be growing, not shrinking. At FY2026 license run-rate of $2.31 billion per year, $2.07 billion of RPO represents only about 11 months of coverage.
There were 56 ATA subscribers at Q4 FY2026 (up from 50 at Q4 FY2025), covering more than half of Arm’s top 30 customers. ATA converts the licensing relationship from transactional to recurring, improving revenue visibility but also deferring some of the large upfront payments that made historical license revenue lumpy.
The royalty-rate growth levers: Armv9 and Compute Subsystems
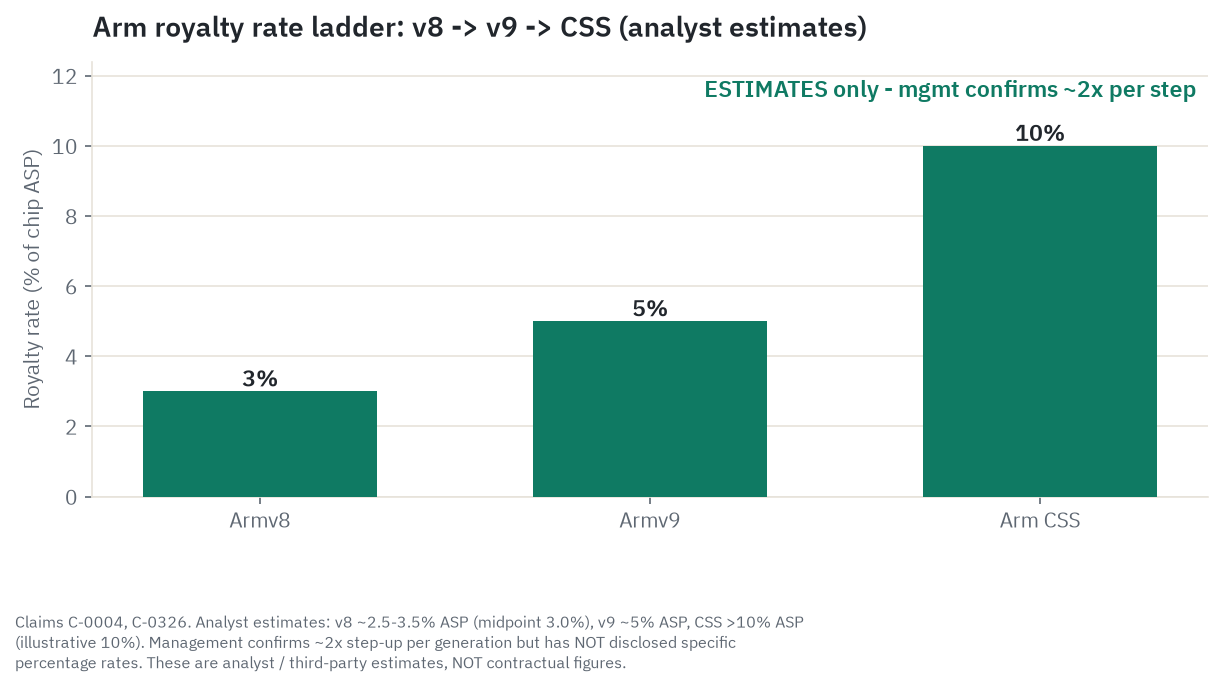
The chart above shows the rate ladder that is the central mechanism in the bull case. A brief note on sourcing: management has confirmed in the May 2026 investor presentation that Armv9 carries “roughly 2x” the per-chip royalty rate of Armv8, and that CSS carries “roughly 2x” the Armv9 rate. The specific percentages - approximately 2.5-3.5 percent of chip ASP for v8, approximately 5 percent for v9, approximately 10 percent for CSS - are analyst estimates from industry sources including EE Times; they are not contractual figures disclosed by Arm. Management confirms the ratios; the specific numbers should be read as the market’s working assumptions, not as Arm’s own disclosures.
Why does this matter so much? The royalty rate is applied to the chip’s average selling price (ASP), so the absolute dollar per chip scales with both the rate and the chip’s value. A $30 premium smartphone SoC on an Armv9 license at an estimated 5 percent generates roughly $1.50 per chip. A $600 datacenter server CPU on a CSS license at an estimated 10 percent generates roughly $60 per chip - about 40 times the royalty from the smartphone despite only 20 times the chip price. Every CSS server CPU shipped is worth as many royalty dollars to Arm as approximately 40 premium smartphone SoCs. That arithmetic is why the datacenter mix-shift is the most important structural story in Arm’s royalty economics, not a narrative.
Armv9 exceeded 50 percent of Arm’s royalty revenue during FY2026, up from above 30 percent in Q4 FY2025, according to management commentary. Because each v9 chip generates roughly twice the royalty of a v8 chip at the same ASP, v9’s share of royalty revenue runs well ahead of its share of shipped units. The exact FY2026 year-end v9 percentage was not disclosed in available filings; management commentary indicates it crossed 50 percent, a figure treated here as press-tier reporting rather than a directly line-itemed filing figure.
CSS adoption is newer and smaller but moving quickly. As of Q2 FY2026 (September 2025), 19 CSS licenses had been signed across 11 distinct companies, with 5 actively shipping CSS-based chips commercially. By Q4 FY2026, 2 additional CSS licenses were signed for smartphone and tablet chips. The Neoverse CSS (the server-grade version) had shipped over 1 billion cores by Q2 FY2026.
The mix-shift math is straightforward once you accept these rate assumptions. As v8 chips in the royalty base are replaced by v9 chips, and v9 chips are supplemented by CSS chips in the highest-ASP markets, the royalty dollar per unit shipped rises independently of total unit count. This is the structural compounding engine that management believes will sustain a 20 percent royalty CAGR from FY2026 to FY2031 - against 14 percent actual from FY2022 to FY2026.
End markets: smartphones, datacenter, automotive, and IoT
Arm does not publish a clean four-way end-market revenue breakdown in its filings. The 20-F for FY2026 states that mobile application processors represented 43 percent of royalty revenue. The remaining 57 percent spans datacenter and cloud, automotive, IoT and embedded, and other - with no further official split. The discussion below draws on management commentary and third-party analyst estimates where noted.
Smartphones. Mobile application processors at 43 percent of royalty revenue still represent the single largest end-market even as datacenter share grows. Global smartphone shipments in CY2026 are forecast by IDC and Counterpoint Research to fall roughly 13.9 percent year over year to approximately 1.08-1.09 billion units - the steepest annual contraction on record (IDC and Counterpoint Research, press-tier estimates). The driver is not a demand recession but a supply squeeze: HBM memory demand from hyperscalers building AI infrastructure has redirected wafer capacity away from smartphone DRAM, pushing smartphone average selling prices to a record roughly $523 in 2026 (Counterpoint Research estimate). That creates a partial natural hedge for Arm: the royalty is a percentage of chip ASP, not a flat per-unit fee. A 14 percent unit decline combined with a 14 percent ASP rise leaves the royalty base roughly flat in dollar terms before any mix-shift benefit. Layering the v8-to-v9 conversion on top means smartphone royalties are more likely to grow modestly than to decline in FY2027, despite the worst unit environment on record. The scenario that genuinely stresses smartphone royalties is lower units combined with lower ASPs - a broad consumer recession that Arm’s current data does not show.
Datacenter and AI. This is the growth engine. Datacenter royalties more than doubled year over year in both Q3 and Q4 FY2026, according to management. Arm’s share of CPU compute among top hyperscalers grew from roughly 9 percent in FY2022 to roughly 20 percent in FY2025 to approximately 50 percent in FY2026, as disclosed in the Q4 FY2026 earnings call and at Computex 2026 (these figures reflect Arm’s own management characterization of “hyperscaler CPU compute”). A separate industry figure - that Arm now accounts for more than 45 percent of global datacenter CPU market revenue as of H1 2026 (IDC estimate) - covers a different and broader denominator than the hyperscaler-specific figure; the two are not interchangeable.
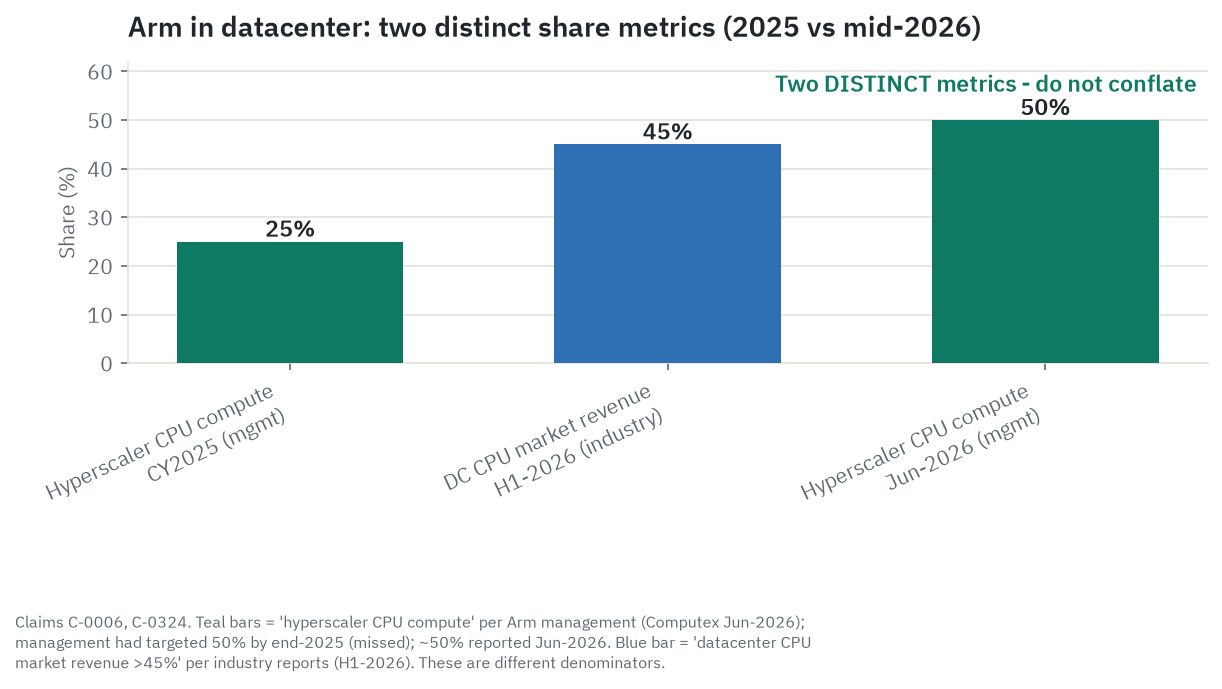
The chart above makes the distinction explicit. The teal bars track what Arm management describes as their share of “hyperscaler CPU compute” - the fraction of compute workloads at the four major cloud providers running on Arm-based CPUs. The blue bar represents the broader datacenter CPU market revenue share (IDC, H1 2026). Different denominators, different numbers - both directionally compelling, but not the same claim.
The hyperscalers driving this share gain have all publicly committed: AWS Graviton5 (Arm Neoverse V3, 192 cores, ALA and CSS licensee) reached general availability in June 2026, with over 50 percent of new AWS CPU capacity added in the past two years being Graviton-based. Microsoft Cobalt 100 (Neoverse CSS V3) is in Azure, delivering up to 40 percent better performance per watt versus prior x86 configurations. Google Axion (Neoverse V3, CSS licensee) claims 30 percent better performance than competing Arm instances and 60 percent better energy efficiency versus x86. Nvidia Grace (Neoverse V2, CSS) - the CPU pairing in the Grace-Blackwell GB200 AI superchip - carries an estimated 3.6 million unit order backlog.
Automotive. Arm has grown its automotive compute share from roughly 36 percent to roughly 44 percent between FY2022 and FY2026 (management figure). The automotive royalty is structurally attractive: automotive SoC ASPs run $100-200 per chip, generating $3.50-$7.00 per chip at estimated v8 and early v9 royalty rates - several times the smartphone royalty. The lag is long: design wins from FY2016-FY2022 are only now entering volume royalty phase, because automotive qualification cycles span five to seven years. Renesas, NXP, Qualcomm’s Snapdragon Digital Chassis, and STMicro all ship Arm-based ADAS and infotainment silicon. Royalties from this segment are slow to grow but extremely durable once established.
IoT and embedded. The Cortex-M series microcontrollers are in billions of devices: industrial sensors, smart speakers, wearables, home appliances. Royalty rates here are very low - an estimated 1.5 percent on chips that may cost $0.50-$2.00 each, producing perhaps $0.01-$0.03 per chip. Volume is enormous, but the dollar contribution per unit is negligible. The strategic importance of IoT is breadth and developer familiarity rather than near-term royalty dollars. It is also the segment most exposed to RISC-V substitution in the near term - see the competitive section.
Arm China: the separately-controlled revenue stream
Approximately 16 percent of Arm’s FY2026 revenue - roughly $787 million - flows through Arm Technology (China) Co. Limited, known as Arm China or Anba Technology. This is a separately incorporated joint venture established in 2018. Arm Limited holds approximately 48 percent; Chinese investors hold approximately 52 percent and control the governance.
The FY2026 20-F contains the disclosure that matters most here: “Neither we nor SoftBank Group control the operations of Arm China, which operates independently of us.” That single sentence is the most important risk disclosure in the filing. Arm cannot compel Arm China to provide standard audit documentation, cannot direct its business decisions, and cannot guarantee that the terms under which it sublicenses Arm IP to Chinese chip companies will remain favorable. Chinese chip companies - HiSilicon (Huawei’s chip unit), UNISOC, Alibaba T-Head, Biren - license through Arm China under an IP License Agreement (IPLA), not directly from Arm Limited. If that IPLA relationship deteriorated, Arm would lose access to the Chinese market with no alternate channel to replace it.
The revenue trajectory here is telling. Arm China accounted for roughly 21 percent of total revenue in FY2024, 17 percent in FY2025, and 16 percent in FY2026 - declining as a share while absolute dollars still grew. Two forces are driving the share down. First, RISC-V substitution is accelerating in China’s IoT and AI accelerator segments: industry estimates (treated here as directional, not precisely measured figures) suggest RISC-V had reached roughly 25 percent penetration in China’s specialized AI and IoT chip sectors by late 2025, and in March 2025 eight Chinese government bodies - including the Ministry of Industry and Information Technology - issued guidelines mandating RISC-V adoption for critical infrastructure IoT chips by 2027. Second, US export control measures targeting advanced semiconductor IP could limit which Arm IP Arm China can sublicense to Chinese companies, even if no specific Arm restriction has been imposed as of this writing.
The dual squeeze - RISC-V substitution eroding demand from the inside while export control risk threatens supply from the outside - means Arm China’s revenue share will likely continue declining. The bear-case assumption in the scenario section is that Arm China revenue falls from roughly $787 million in FY2026 to roughly $400-500 million by FY2031 under moderate RISC-V progression; a more severe scenario would involve US export controls directly restricting the IPLA channel.
Company by company: who builds on Arm IP
Arm’s commercial success depends entirely on the decisions of its licensees. Understanding the 16-company ecosystem in this research is the key to reading the royalty trajectory.
Apple Inc (AAPL, Nasdaq, ~$4.3 trillion market cap, June 25, 2026). Apple is almost certainly Arm’s largest single royalty contributor by dollar amount - neither company discloses terms. Apple holds a perpetual ALA and designs its own microarchitecture (the Firestorm/Everest/Blizzard lineage, now A18 and M4-series) from scratch. Every iPhone and Mac shipped is an Arm royalty event. The ALA terms are fixed; Arm cannot retroactively renegotiate what Apple pays per chip generation. Apple is the anchor of the royalty base and a structural bull signal - it will not abandon the Arm ISA in any near-term horizon. But it is also the constraint on Arm’s pricing power: no rate escalation leverage exists on the world’s most profitable consumer electronics company.
Qualcomm Incorporated (QCOM, Nasdaq, ~$215 billion, June 25, 2026). The most commercially important and legally complicated Arm licensee. Qualcomm holds both an ALA (acquired via the Nuvia acquisition in 2021, which brought the custom Oryon CPU microarchitecture) and legacy TLA licenses. Qualcomm is Arm’s largest identified single customer, at roughly 9 percent of revenue. See the dedicated litigation section below for the complete story. The short version: Arm sued Qualcomm, Qualcomm won, and the counter-suit outcome matters significantly to both the FTC investigation narrative and future ALA licensing dynamics.
MediaTek Inc (2454.TW, TWSE primary; OTC: MDTKF thin, ~$216 billion, June 25, 2026). The second-largest smartphone SoC vendor globally by volume, dominant in Chinese Android OEMs. MediaTek holds a TLA and licenses ready-made Cortex-A cores. The Dimensity 9000-series and 9400 are Armv9-based, making MediaTek a key driver of per-chip royalty rate uplift at volume. TLA holders like MediaTek pay higher per-chip royalties than ALA holders - they are the clearest beneficiaries of the v9 mix shift, and the most directly exposed licensees to any Arm royalty escalation. Note: primary listing is on TWSE; the OTC ADR MDTKF is thin and illiquid for US retail investors.
Samsung Electronics (005930.KS, KRX primary; OTC: SSNLF thin, ~$1.45 trillion, June 25, 2026). TLA licensee for Exynos SoCs. Samsung is both a downstream licensee and a foundry manufacturing Arm-designed chips for others - a unique dual role. The Exynos 2400 (Armv9) powers Galaxy S24 in most markets outside North America. Exynos has historically underperformed Qualcomm Snapdragon on performance-per-watt, which constrains how much Samsung can grow Exynos market share. Note: primary listing is KRX; OTC SSNLF has thin liquidity and carries currency risk.
Alphabet / Google (GOOGL/GOOG, Nasdaq, ~$4.16 trillion, June 25, 2026). Holds both an ALA (for Tensor mobile SoCs in Pixel phones) and a CSS license (Axion datacenter CPU uses Neoverse V3). Google committed $80 billion in equity issuance to fund AI compute infrastructure in June 2026. Alphabet’s small strategic stake in Arm shares (0.18 percent) is a noteworthy signal - a hyperscaler that uses Arm CSS for its own datacenter CPUs chose to own stock in its own IP supplier. Axion’s deployment into Google Cloud Platform displaces Intel Xeon in cloud-native workloads.
Nvidia Corporation (NVDA, Nasdaq, ~$4.88 trillion, June 24, 2026 approx). An ALA holder. Nvidia’s Grace CPU (Neoverse V2-based CSS) made it one of the key drivers of Arm’s datacenter royalty acceleration in FY2025-FY2026 through the Grace-Blackwell GB200 platform. Every GB200 NVL72 AI rack pairs an Arm Grace CPU with Blackwell GPUs - with an estimated 3.6 million unit backlog, Grace-Blackwell is a major current royalty source. The forward concern: Vera (announced at GTC Taipei in May 2026, part of the Vera Rubin platform launching in fall 2026) uses custom-designed Olympus CPU cores that are Armv9.2 ISA-compatible but are NOT based on Arm’s Neoverse CSS IP. As Vera replaces Grace-Blackwell in Nvidia’s AI server roadmap from FY2027-FY2028 onward, the CSS royalty from Nvidia’s platform steps down to a lower ALA rate. This is a concrete royalty rate headwind not priced into most near-term models. For detailed analysis see our NVDA deep dive.
AWS / Amazon (AMZN, Nasdaq, ~$2.52 trillion, June 24, 2026 approx). ALA and CSS licensee. AWS Graviton5 (Arm Neoverse V3, 192 cores) reached general availability in June 2026. Over 50 percent of all new AWS CPU capacity added in the past two years was Graviton-based. AWS custom silicon has crossed a $20 billion annual revenue run rate - it is the single largest deployer of Arm-based server CPUs globally. The Graviton production ramp is a multi-year locked-in capex commitment.
Microsoft (MSFT, Nasdaq, ~$2.62 trillion, June 26, 2026 approx). CSS licensee. Cobalt 100 and Cobalt 200 (Neoverse CSS V3) are in Azure, delivering claimed 40 percent better performance per watt than prior x86 configurations. One of three hyperscalers driving Arm’s server royalty ramp.
Ampere Computing (private; acquired by SoftBank for $6.5 billion in November 2025). Pure-play Arm server CPU vendor (AmpereOne, 192-core AmpereOne A3). The SoftBank acquisition creates a structural complexity: SoftBank now owns both the architectural licensor (Arm Holdings) and one of its licensee-competitors in server CPUs. Arm’s own AGI CPU launch directly cannibalizes Ampere’s TAM. How Arm prices CSS licenses to its corporate sibling versus competing hyperscalers is a related-party governance question that ADS minority holders cannot independently verify.
Marvell Technology (MRVL, Nasdaq, ~$246 billion, June 25, 2026). TLA and CSS licensee for OCTEON network processors and ThunderX/Altra server CPUs. With Broadcom, Marvell controls roughly 95 percent of the custom AI ASIC co-design market - all of Marvell’s server and network processors are Arm-based. Marvell now faces Arm’s own AGI CPU as a direct competitor in the server CPU space it has been building.
Intel Corporation (INTC, Nasdaq, ~$668 billion, June 25, 2026; up roughly 253 percent YTD as of that date). Not an Arm licensee for server CPUs; the structural rival. Arm-based server CPUs - Graviton, Cobalt, Axion, Grace - now capture more than 45 percent of hyperscaler datacenter CPU revenue (IDC estimate, H1 2026). Intel Xeon holds the remainder of the x86 server market in enterprise and legacy cloud. Intel’s 2026 stock rally reflects US CHIPS Act support and AI demand recovery, not a server market share recovery. See our INTC deep dive for the full picture.
Advanced Micro Devices (AMD, Nasdaq, ~$854 billion, June 25, 2026; up roughly 327 percent year over year). AMD and Arm are both taking hyperscaler market share from Intel, but they now compete for the same server sockets. AMD EPYC Turin achieved 46.2 percent of x86 server CPU revenue in Q1 2026. The real question is whether Arm’s 50-percent-plus hyperscaler compute share comes primarily at Intel’s expense or increasingly at AMD’s. See our AMD analysis for the server CPU competition picture.
Broadcom (AVGO, Nasdaq, ~$1.82 trillion, June 25, 2026). Arm TLA licensee for networking embedded processors; partner on custom AI ASIC co-designs for Google and Meta. Broadcom and Marvell together control the custom ASIC co-design market. Arm’s own-chip ambitions are a long-range tension with Broadcom’s ASIC business. See our AVGO coverage.
SiFive (private; $3.65 billion post-money valuation, April 2026 Series G). The leading commercial RISC-V IP vendor and the primary structural alternative to Arm’s licensing model. $400 million Series G backed by Nvidia, Apollo Global Management, and T. Rowe Price. IP is in 500-plus chip designs; more than 10 billion RISC-V cores shipped cumulatively (overwhelmingly microcontrollers and embedded, not server or mobile CPUs). Nvidia’s participation is strategically notable - it is hedging against Arm’s own-chip ambitions. Not publicly traded.
RISC-V International. Not an investable company - a nonprofit standards body (Switzerland) that maintains the free, open ISA specification. The 4,000-plus member companies include Qualcomm, Nvidia, Google, Meta, and Alibaba. The existential long-range threat to Arm’s pricing power. Qualcomm’s acquisition of Ventana Micro (December 2025) and its reported advanced talks to acquire Tenstorrent for roughly $8-10 billion (June 2026) are the most visible signals of major licensees building RISC-V escape options.
SoftBank Group (9984.T, TSE primary; OTC ADR: SFTBY thin). The controlling parent at 86.72 percent. SoftBank has not sold a single Arm share since the September 2023 IPO. The financial overhang is structural: SoftBank reportedly drew $8.5 billion against a $20 billion margin loan facility collateralized by Arm shares (reported as of December 2025). At $347.71 per ADS the collateral value is far above any plausible margin call, but the structural risk of a future secondary offering into a 13.3 percent public float is permanent. SoftBank now also owns Ampere Computing and is deeply aligned with the Stargate AI infrastructure program - its incentives are broadly aligned with Arm’s success.
Financials from the filings
All figures in this section are from the FY2026 20-F, the Q4 FY2026 6-K filed May 6, 2026, and prior-year 6-Ks. Arm files as a foreign private issuer; the annual report is a 20-F (not a 10-K) and interim results are 6-K forms.
Revenue. Three consecutive years of 20-percent-plus growth: FY2024 $3.23 billion (+21 percent), FY2025 $4.01 billion (+24 percent), FY2026 $4.92 billion (+23 percent). License revenue grew faster than royalty in FY2026 (25 percent vs 21 percent), reflecting large CSS and ATA contract signings. The full-year FY2026 quarterly progression: Q1 approximately $1.05 billion, Q2 $1.14 billion, Q3 approximately $1.24 billion, Q4 $1.49 billion. Japan revenue jumped from $296 million in FY2025 to $825 million in FY2026, likely reflecting a major licensing agreement with SoftBank-related entities or large Japanese semiconductor companies.
Margins. The GAAP gross margin of 97.5 percent in FY2026 (non-GAAP 98.2 percent) is the highest of any substantial public semiconductor company. The royalty line carries near-zero cost of goods - there is no silicon, no assembly, no test cost; the entire royalty dollar flows to gross profit. The GAAP operating margin was 18.3 percent, the non-GAAP operating margin 43.0 percent. The 24.7 percentage-point gap between the two is driven primarily by $1.052 billion in stock-based compensation (SBC). SBC in FY2026 exceeded GAAP net income of $904 million - a fact that matters when evaluating any valuation multiple. The non-GAAP operating margin is the more economically meaningful measure for royalty investors, but the $1 billion-per-year SBC is real dilution that must be factored into any per-share return calculation.
EPS. GAAP diluted EPS of $0.85 in FY2026; non-GAAP diluted EPS of $1.77. The $0.92 gap per share reflects the SBC charge. Non-GAAP EPS grew only 8.6 percent (from $1.63 in FY2025 to $1.77 in FY2026) despite 23 percent revenue growth - because R&D spend is being deliberately consumed to build the AGI CPU program. This is a deliberate trade: investing 38.8 percent of revenue in non-GAAP R&D to build a new silicon business at the cost of near-term EPS growth.
Cash flow and balance sheet. FY2026 operating cash flow was $1.524 billion, recovering sharply from FY2025’s $397 million (which was depressed by one-time payroll tax payments related to IPO-era RSU vesting). FY2026 capex of $545 million is elevated versus FY2024’s $92 million, reflecting AGI CPU chip development infrastructure. Non-GAAP FCF was $882 million in FY2026. The balance sheet is clean: approximately $2.75 billion in cash, approximately $850 million in short-term investments, total liquid assets of roughly $3.6 billion. Long-term financial debt is essentially zero; what D/E ratios appear in some data feeds likely reflect operating lease liabilities under ASC 842, not bond or bank debt. Arm pays no dividend and has no buyback program.
Customer concentration. Revenue is heavily concentrated: the FY2026 20-F discloses that Arm’s top five customers accounted for approximately 56 percent of total revenue. Qualcomm alone is roughly 9 percent, and Arm China routes roughly 16 percent. That concentration cuts both ways - it reflects deep entrenchment with the most important chip designers in the world, but it also means the loss or renegotiation of any single top-five relationship would be financially material.
Share count and SoftBank structure. Roughly 1,064 million basic ordinary shares outstanding at March 31, 2026. SoftBank holds 922.73 million (86.72 percent) via Kronos II LLC. Public float: approximately 142.6 million ADS. The thin float amplifies both upward and downward price moves - approximately 8.9 percent of the float turns over each trading day at recent volume levels.
Guidance. Management guided Q1 FY2027 (April-June 2026) revenue of $1.26 billion plus or minus $50 million, implying approximately 20 percent year-over-year growth from Q1 FY2026. Non-GAAP EPS guided at $0.40 plus or minus $0.04. Management withheld full-year FY2027 guidance. The figure of approximately $10 billion for full-year FY2027 revenue that appears in some sources appears to be an analyst extrapolation of the Q1 guidance run rate, not a management-issued full-year target - readers should treat any $10 billion FY2027 figure as analyst-tier rather than as disclosed guidance.
Long-term targets. In the May 6, 2026 investor presentation (filed as a 6-K exhibit), management disclosed the following as aspirational targets for FY2031: IP and CSS licensing business at $10 billion revenue with greater than 65 percent non-GAAP operating margin; AGI CPU chip business at $15 billion revenue with greater than 30 percent non-GAAP operating margin; combined greater than $9 non-GAAP EPS; royalty CAGR of approximately 20 percent from FY2026 to FY2031. These are Arm’s own long-range aspirational targets, not analyst-endorsed forecasts or commitments. They carry significant uncertainty over a five-year horizon.
The AGI CPU. Arm launched its first production silicon in 35 years on March 24, 2026 - a 136-core datacenter processor co-developed with Meta. Management disclosed more than $2 billion in customer demand for the AGI CPU across FY2027 and FY2028, with orders having doubled since launch. Named customers in the FY2027-FY2028 pipeline include Meta (lead development partner), OpenAI, Oracle, ByteDance, Cerebras, Cloudflare, SAP, and SK Telecom. First meaningful revenue is expected in FY2028. The economics here are fundamentally different from the IP business. Management’s FY2031 target for the AGI CPU chip business is a non-GAAP operating margin of more than 30 percent (CFO Jason Child’s disclosure), not a 30 percent gross margin. The estimated gross margin on the chip itself is roughly 50-55 percent - a physical-silicon margin far below the IP business’s 97.5 percent because the chip carries real wafer, packaging, assembly, and test costs. That chip gross margin is what produces the roughly 72 percent blended corporate gross margin at the FY2031 target mix: approximately $10 billion of IP revenue at 97.5 percent plus approximately $15 billion of chip revenue at roughly 55 percent yields about $18 billion of gross profit on $25 billion of revenue, or roughly 72 percent blended - down sharply from the current 97.5 percent.
Market action and valuation: pricing a perpetual royalty machine
All price and market-cap figures below are stamped June 25-26, 2026. They move daily.
The price. Arm ADS closed at $347.71 on June 25, 2026, giving a market capitalization of roughly $370 billion. Intraday on June 26 the stock was trading near $330-$332, down roughly 4-5 percent, as this research was compiled. The stock reached a 52-week high somewhere in the $428-$453 range (disputed across sources, reflecting different closing-price versus intraday-high conventions). The 52-week low is $100.02. YTD 2026 gain from the year-start level near $108-109: approximately 205 percent. The stock IPO’d in September 2023 at $51 per ADS; from that price, the gain is roughly 582 percent at the June 25 close.
The multiple. Forward non-GAAP P/E of approximately 159-160 times (corroborated by two sources: StockAnalysis.com and GuruFocus, as of June 25-26; a third source cited 189.89 times, which is disputed). Trailing GAAP P/E approximately 393 times. Price-to-sales trailing 72 times. The GAAP multiple is not a useful day-to-day comparison given SBC; the market is transacting on the forward non-GAAP P/E of roughly 160 times. The PEG ratio - forward P/E divided by consensus FY2027 non-GAAP EPS growth of approximately 18 percent - is roughly 8.9 times. A PEG of 1 times is the naive “fair value” threshold; 8.9 times is among the most stretched readings in large-cap technology.
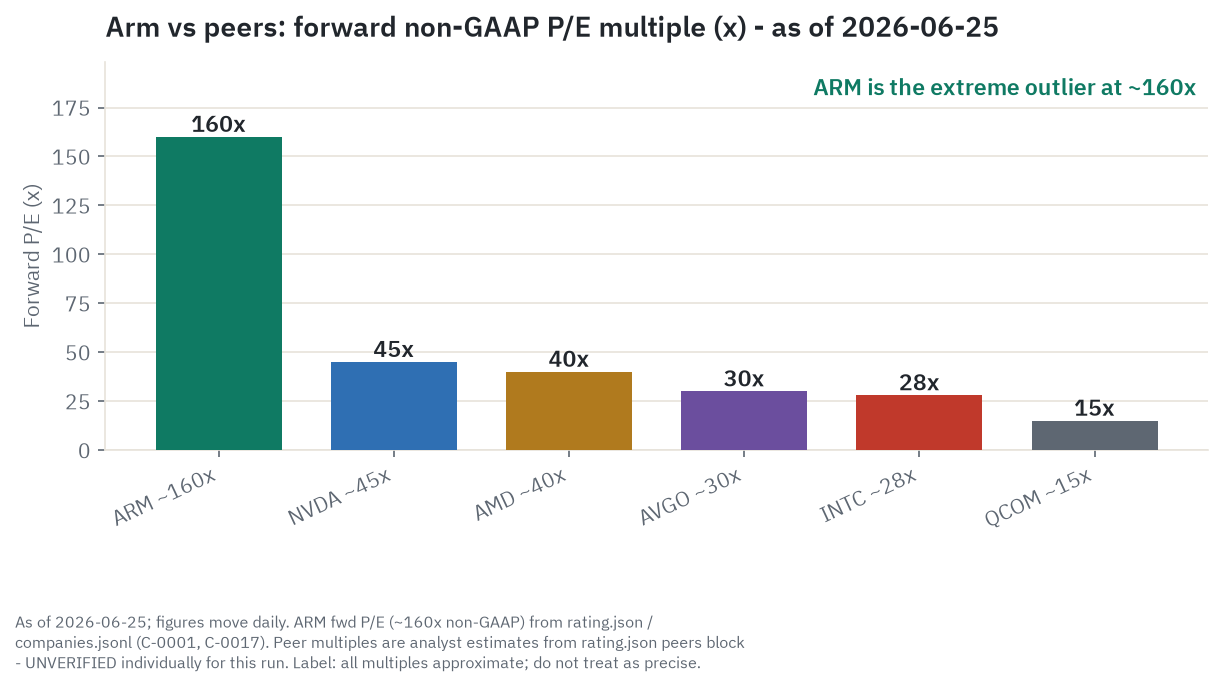
The chart above tells the essential valuation story. Arm is not moderately expensive relative to peers; it is in a different category. Qualcomm, the largest identified Arm licensee, trades at roughly 14-16 times forward earnings - approximately one-tenth the Arm multiple. Synopsys and Cadence, the EDA tool providers with royalty-model characteristics, trade at 35-50 times forward earnings. Arm at 160 times sits above every reasonable semiconductor or IP comparable by a factor of three or more. The market is paying for the full package: the royalty annuity quality, the rate-uplift mechanism, the datacenter optionality, and the AGI CPU free-call option - all at once, without discounting for any of the execution risk.
What does 160 times forward P/E actually mean in return terms? At $347.71 per ADS and consensus FY2027 non-GAAP EPS of approximately $2.08, the stock needs to reach $564 by FY2031 - a 5.1 percent annualized return from today’s entry - if management hits its own $9 EPS target and the market pays a 50 times exit multiple. At a 40 times exit multiple (still a premium to semiconductor peers) on $9 EPS, the stock reaches $360 - a 0.6 percent annualized return over five years. The entry price forecloses most of the return even in the bull scenario. This arithmetic is not contested by thoughtful bulls; it is why Bank of America carries a $460 price target while declining to issue a Buy rating.
The sell-side. Consensus rating is Moderate Buy / Buy across major aggregators, based on 40 analysts post-FY2026 earnings. Rating distribution: 20 Strong Buy, 7 Buy, 11 Hold, 0 Sell, 2 Strong Sell. The structural anomaly: the consensus mean analyst price target is BELOW the current trading price on most aggregators ($279.83 on MarketBeat, $295.95 on StockAnalysis, approximately at spot on TipRanks). A stock with a Buy-rated coverage universe whose mean target implies downside is unusual and signals the stock has outrun analyst models faster than target revisions have caught up.
Target range: $150 (Goldman Sachs, Sell rating, formal; thesis: limited real AI-cycle revenue at a valuation that is hard to defend) to $500 (Mizuho and Bernstein, both citing AGI CPU platform and hyperscaler partnerships). A $350 spread on a $330-348 stock is not analyst noise; it is genuine disagreement about whether the AGI CPU will deliver $15 billion by FY2031 or will be constrained by the FTC probe and customer-conflict dynamics. For a retail investor, that target dispersion should be read as a signal that conviction in either direction is speculative.
Technical context. 50-day moving average: $285.26 (stock approximately 17 percent above). 200-day moving average: $173.47 (stock approximately 92 percent above - an extended reading). Short interest as of June 15, 2026: 16.37 million shares, down 11.6 percent from May 29, equal to roughly 11.5 percent of the float and 1.3 days to cover. Bears have been covering into the rally, not pressing. 30-day implied volatility approximately 99.4 percent (AlphaQuery, June 25, 2026). Beta approximately 3.78 (StockAnalysis.com). This is among the most volatile large-cap technology names globally.
Sentiment and narrative: the AI CPU story
The public narrative around Arm has undergone a near-complete rebranding since the September 2023 IPO. The original framing - “the company that licenses IP inside every smartphone chip” - has been almost entirely displaced by a new one: “the architecture under all of AI compute.”
The catalyst for the shift was the Q4 FY2026 earnings call and investor day on May 6, 2026, where management delivered three items simultaneously: hyperscaler CPU compute share at approximately 50 percent (up from 9 percent in FY2022); a $15 billion AGI CPU revenue target for FY2031, with Meta as lead development partner and OpenAI, Cloudflare, SAP, and SK Telecom as committed customers; and more than $2 billion in already-contracted AGI CPU customer demand for FY2027-FY2028. This combination sent the stock from approximately $220-240 to an all-time closing high of $411.83 on June 3, 2026 (press-tier figure).
The retail framing is “the tollbooth”: buy Arm because every chip shipped anywhere using the Arm architecture sends Arm a check, and all of AI infrastructure runs on Arm chips. That framing is directionally correct for the royalty model, but it conflates the business strength with the entry price. The IPO at $51 per ADS was a fair price for the tollbooth. At $347.71 the market is paying roughly seven times that for the same tollbooth, plus an unproven chip business.
The tone cooled sharply from June 18 onward. New Street Research downgraded from Buy to Neutral on June 18, 2026, citing a trailing GAAP P/E above 480 times as unsustainable at any near-term execution scenario. On June 23, 2026, Arm fell 9.24 percent in a single session - the trigger was a South Korea-led global chip-sector rout, but the underlying vulnerability was the stretched valuation combined with consistent executive insider selling. Net selling at $226-$415 per share by multiple executives in May and June 2026 is not a manipulation signal - concentrated post-lock-up diversification is expected - but it is a neutral data point, not a bullish one.
The structural narrative divergence between price action and fundamental filings has three specific expressions. First, the RPO fell 7 percent - a concrete weakening of the forward-indicator signal. Second, the consensus mean target is below spot despite a Buy-rated coverage universe - a condition that typically either self-corrects via target upgrades or self-corrects via the price falling back toward the models. Third, the FTC probe and the AGI CPU launch simultaneously undercut the “neutral platform” moat framing that is central to the bull case: once Arm is a direct chip competitor to Qualcomm, Marvell, and Ampere, the “architectural Switzerland” narrative is no longer accurate, and the market has not fully repriced what that means for licensing relationships.
The Qualcomm litigation aftermath and the customer-conflict fault line
The Arm-Qualcomm legal dispute is the most important licensing precedent of the decade for IP royalty companies - and understanding it precisely matters.
What happened. In 2021, Qualcomm acquired Nuvia, a chip design startup that held an Architecture License Agreement with Arm. Arm sued Qualcomm, arguing that Nuvia’s ALA terminated upon acquisition and that Qualcomm needed to sign a new license - presumably at higher rates - for the custom CPU cores Nuvia had designed (the cores that became the Oryon CPU in Snapdragon X Elite and Snapdragon 8 Elite). Qualcomm argued that its own existing ALA covered Nuvia’s Arm-compatible cores.
The verdict. A Delaware jury delivered its verdict in December 2024, finding that Qualcomm had not breached the Nuvia Architecture License Agreement. One count deadlocked; the court subsequently dismissed it in post-trial proceedings. The district court issued a full and final judgment for Qualcomm in early October 2025. Arm has stated it intends to appeal.
The commercial signal from this outcome is significant: ALA holders are legally protected against forced re-licensing at higher rates when they acquire companies with Arm-compatible designs. Arm cannot use acquisition events to push ALA customers into renegotiated, higher-rate terms. The rate-uplift thesis applies most cleanly to TLA holders upgrading to v9 Cortex cores - not to the ALA-holding hyperscalers and Apple who pay the highest absolute royalty dollars but whose rates were set at ALA signing.
The counter-suit. Qualcomm filed its own counter-suit against Arm in January 2025, alleging that Arm withheld technical deliverables - IP documentation and engineering support for the Oryon/Nuvia-based custom cores - and engaged in anti-competitive behavior by attempting to use the litigation to push Qualcomm toward more expensive CSS licenses rather than its existing ALA. The counter-suit had a trial reportedly scheduled for March 2026. The outcome of that trial is not confirmed in public disclosures available as of this writing. If Qualcomm prevailed in the counter-suit, the evidentiary record - particularly any finding that Arm withheld deliverables or engaged in anti-competitive conduct - would be directly available to the FTC antitrust investigation as supporting evidence.
The AGI CPU customer-conflict fault line. The March 2026 AGI CPU launch ended Arm’s 35-year posture as a neutral licensor. Arm now simultaneously holds the ISA license that Qualcomm, Marvell, and Ampere need for their server chip designs - and sells a 136-core server chip that competes directly with Qualcomm’s server CPU ambitions, Marvell’s ThunderX/Altra, and Ampere’s AmpereOne. This is not a theoretical future tension; it is the commercial dynamic that Bloomberg and Tom’s Hardware reported triggered the FTC probe in May 2026.
The probe is early-stage - no formal complaint has been filed as of this writing, and the FTC typically takes 12-24 months or more to progress from investigation to formal complaint. South Korea’s competition regulator has reportedly also begun an early-stage look at the same neutral-licensor-versus-own-silicon question, per press reporting; like the FTC matter, it is an inquiry, not a finding. A behavioral remedy, if it came, could take the form of open licensing terms or rate caps on CSS datacenter royalties. That would directly compress the highest-rate product in Arm’s portfolio - the precise product line that drives the bull case’s royalty rate acceleration thesis.
What to watch. The Qualcomm counter-suit outcome (unconfirmed as of June 26, 2026) and FTC probe status are the two most consequential pending events for this thesis. A Qualcomm win in the counter-suit combined with an FTC formal complaint - even a civil investigative demand - would be the clearest near-term bear catalyst. An FTC closure without remedy would remove this risk overhang and likely trigger a material re-rating of the CSS royalty premium.
Macro context: smartphone cycle, AI capex, and rate sensitivity
Smartphone cycle. Global smartphone shipments are forecast to fall roughly 13.9 percent in CY2026 to approximately 1.08-1.09 billion units (IDC and Counterpoint Research, press-tier estimates). The worst annual contraction on record, driven not by demand destruction but by HBM memory supply redirection toward AI infrastructure. As described above, the high-ASP concentration paradox means this cycle is less damaging to Arm’s royalty dollar base than the headline unit number suggests - but it is real pressure on the 43 percent of royalty revenue that flows from mobile application processors.
AI capex wave. The four major hyperscalers - Amazon, Microsoft, Alphabet, and Meta - are collectively guiding approximately $690-725 billion in CY2026 capital expenditure, up roughly 77 percent from approximately $410 billion in CY2025 (analyst aggregations, press-reported). Goldman Sachs and other research houses project CY2027 hyperscaler capex exceeding $900 billion. For Arm, this is both the near-term royalty accelerant (CSS chips from already-contracted designs are ramping right now) and the forward risk (if hyperscalers reduce CY2027 capex guidance, the multiple compresses before the royalty line slows). The license-to-royalty lag provides partial insulation: CSS royalties from chips currently in production ramp continue regardless of future capex guidance changes. What slows are NEW platform investments - the next-generation Graviton, the Cobalt 200 successor, the Axion 2 - whose licenses and design work would translate to royalties in FY2029-FY2031.
The Sequoia $600 billion AI revenue gap thesis identifies a structural risk in this timing: current AI product revenues from hyperscalers fall far short of the revenue needed to justify the infrastructure spend at standard gross margin requirements. If the commercial ROI on AI spending fails to materialize at the pace hyperscalers are betting on, a capex digestion period in 2027-2028 would reprice Arm’s multiple before affecting the royalty line. Historical analogies - the 2001 telecom capex collapse, the 2015-2016 shale drilling bust - show this pattern: long-term demand proves out, but the near-term over-investment creates a multi-year digestion period that is severe for suppliers with high multiples.
Rate sensitivity. At 160 times forward non-GAAP P/E, Arm is the longest-duration large-cap equity in the semiconductor universe. Most of its implied value resides in terminal cash flows a decade or more out. The 10-year US Treasury yield stood at 4.40 percent on June 25, 2026 (Federal Open Market Committee held the federal funds rate at 3.50-3.75 percent at its June 17 meeting). Each 100 basis points of additional yield in the risk-free rate, holding business fundamentals constant, compresses a DCF-implied fair value for a company like Arm by roughly 15-25 percent - depending on terminal growth assumptions - with no change in royalty revenue. At 160 times, the multiple leaves very little room to absorb a rate re-acceleration. A 10-year Treasury yield sustained above 4.75-5.0 percent would be the independent rate-compression trigger for the stock, independent of any fundamental royalty development.
Competitive map: RISC-V, x86, and the in-house design threat
Three competitive forces bear on Arm’s royalty model. None is imminent in the premium markets; all are real over a multi-year horizon.
RISC-V. The open instruction-set architecture is royalty-free. Any chip designer can implement RISC-V without paying anyone a license fee. The software ecosystem barrier - Arm64 has 22 million-plus developers, decades of Linux kernel optimization, a full Android Application Binary Interface, and mature GCC/LLVM toolchains - is the reason RISC-V is not yet a near-term threat in smartphones and datacenter CPUs. Building software ecosystem parity in those markets would take years of coordinated industry effort.
Where RISC-V is already present: China. Industry estimates (treated as directional, from press sources) suggest RISC-V had reached roughly 25 percent penetration in China’s specialized AI and IoT chip sectors by late 2025. The Chinese government’s March 2025 eight-agency mandate requiring RISC-V for new IoT critical infrastructure by 2027 is not a theoretical future policy - it is law, with tax incentives attached. Alibaba’s T-Head XuanTie C930, launched in early 2025, is the first commercially available server-grade 64-bit multi-core RISC-V processor, moving the threat from embedded toward data center in China. The Arm China revenue share decline from 21 percent in FY2024 to 16 percent in FY2026 is the financial fingerprint of RISC-V substitution already in progress.
Qualcomm’s RISC-V moves are the most important non-China signal. Qualcomm acquired Ventana Micro Systems (RISC-V server CPU designer) in December 2025. Qualcomm is in reported advanced talks to acquire Tenstorrent for approximately $8-10 billion (as of June 2026) - a full-stack RISC-V CPU and AI accelerator company led by industry veteran Jim Keller. These are RISC-V option purchases: they do not represent an immediate commitment to replace Arm, but they create an alternative architecture path that Qualcomm could accelerate if Arm’s licensing behavior becomes sufficiently hostile or expensive. A closed Tenstorrent acquisition would be the clearest directional signal that the largest identified Arm licensee is building a primary alternative, not just a hedge.
x86. Intel and AMD compete with Arm-based server CPUs for hyperscaler and enterprise CPU sockets. The ARM server share gain from 9 percent to 50 percent of hyperscaler compute has come overwhelmingly from Intel Xeon displacement, with AMD EPYC growing share simultaneously. The key question is whether future Arm hyperscaler share gains come at AMD’s expense - which would make AMD and Arm structural competitors for the same sockets - or remain primarily at Intel’s expense. AMD EPYC Turin held 46.2 percent of x86 server CPU revenue in Q1 2026 and is not yet being displaced by Arm at scale outside hyperscaler cloud-native workloads. Enterprise (non-hyperscaler) server purchases still favor x86 heavily. For context on how ASML’s monopoly on leading-edge lithography connects to this server transition, see our ASML analysis. For Intel’s position in detail, see our INTC coverage.
In-house ISA design. The theoretical nuclear scenario is a major hyperscaler or chipmaker deciding to design a wholly proprietary ISA, incompatible with Arm, for a major product line. Apple’s path - designing custom microarchitecture within the Arm ISA under an ALA - is the closest real-world analog. Apple is deeply entrenched in the Arm ISA through billions of lines of iOS code, macOS dependencies, and the developer ecosystem; switching away from the ISA entirely would be a decade-long project with no precedent.
Durability: the software moat and what could erode it
The structural moat in Arm’s business is not the chip designs; it is the software ecosystem. A licensee who stops paying Arm royalties loses access to future Arm IP, but the chips already designed keep shipping - and those chips, to be replaced, need an entire software stack to be ported. Every major Android application, every Linux server binary, every iOS application, and the majority of embedded firmware worldwide is compiled for the Arm instruction set. The 22 million-plus Arm developers Arm publishes as its ecosystem figure represent the accumulated investment that makes ISA migration for any volume player an expensive, multi-year project.
This is why RISC-V is a 7-10 year threat in smartphones and servers outside China, not a near-term one. The software gap is real, deep, and defended by network effects that grow with every new Arm-compatible application written. The automotive royalty annuity illustrates the durability at its clearest: a chip licensed in 2018 for a vehicle ADAS system generates royalties for the entire production life of that vehicle platform, which could run to 2035 or beyond. The 350-plus billion cumulative chips Arm has shipped each add another layer to the annuity base.
What durability does NOT mean, at a 160 times multiple: a durable business is not the same thing as a safe investment. The royalty annuity is worth owning. The question - the entire question - is at what price. At 160 times forward earnings, the stock is not primarily a claim on a durable royalty annuity; it is a claim on the terminal multiple applied to that annuity in five to ten years. If the exit multiple compresses from 160 times to 60 times - still a premium to any historical semiconductor IP comparable - the stock falls 63 percent with no revenue decline. Business durability and valuation safety are separate concepts.
The two-edged dynamic in the CSS and AGI CPU strategy: moving to higher-rate products (CSS at an estimated 10 percent of chip ASP) grows royalty revenue per chip. But building a competing chip (the AGI CPU) risks pushing TLA and ALA licensees toward RISC-V for future designs - trading a 97.5 percent gross margin royalty annuity for a chip business whose gross margin is an estimated 50-55 percent (the management FY2031 target of more than 30 percent is an operating margin, not a gross margin). Whether that trade is rational depends on whether AGI CPU scales faster than royalty erosion from customer defection. At FY2031, the math only works if AGI CPU gets to at least $12-15 billion. Below $5 billion, the gross margin dilution is incurred without compensating revenue scale, and the blended corporate economics deteriorate.
The scenarios in detail: bull, base, and bear across four horizons
The four dollar ranges in the lede chart are derived mechanically from the scenario assumptions below. All EPS figures and exit multiples are estimates. None of these is a price target. The bull/base/bear dollar levels here match the lede chart exactly.
Bull - management targets broadly achieved
What has to be true: Q1 FY2027 royalty re-accelerates to 20 percent or above, confirming v9 and CSS rate uplift is outrunning the smartphone unit headwind. The FTC probe closes without a behavioral remedy. Hyperscalers sustain $700 billion-plus in annual capex through FY2028 without a digestion pause. The AGI CPU attracts more than three hyperscaler commitments beyond the initial Meta/OpenAI/Oracle/ByteDance pipeline. Arm China stabilizes near $500-600 million (RISC-V erodes slowly, not abruptly). Qualcomm does not announce a RISC-V primary architecture for any major product line.
Six months: royalty re-accelerates to 20 percent or above in Q1 FY2027, EPS estimates revised toward $2.45, multiple expands slightly toward 176 times. Illustrative level: $430 [bull estimate].
One year: royalty CAGR confirmed at 20 percent, AGI CPU pipeline expands beyond $2 billion committed, FY2028 forward EPS approaches $3.20 at 144 times. Illustrative level: $460 [bull estimate].
Three years: AGI CPU at $3-4 billion annual revenue, royalty CAGR 20 percent, FY2029 non-GAAP EPS near $5.90 at an 80 times exit multiple. Illustrative level: $470 [bull estimate].
Five years: near-management-target execution - approximately $10 billion IP/CSS plus approximately $12 billion AGI CPU equals approximately $22 billion total revenue, FY2031 non-GAAP EPS near $7.80 at 68 times. Illustrative level: $530 [bull estimate]. Annualized return from $347.71: roughly 9 percent. The most important bull-breaker: an FTC behavioral remedy capping CSS royalty rates would negate the rate-acceleration thesis in the highest-value market without any business failure.
Base - royalty compounds, AGI CPU partially delivers, multiple drifts lower
What has to be true: Q1 FY2027 royalty prints 12-18 percent YoY (no further deceleration). Hyperscaler capex guidance holds through 2027. FTC probe resolves without a formal complaint with behavioral remedies. AGI CPU attracts three to four major customers beyond the initial commitments.
Six months: royalty prints 12-18 percent, multiple drifts from 160 times toward 154 times. Illustrative level: $320 [base estimate].
One year: royalty CAGR 17 percent confirmed, FY2028 forward EPS near $2.80 at 102 times. Illustrative level: $285 [base estimate].
Three years: AGI CPU at $2 billion annual revenue, royalty CAGR 17 percent, FY2029 non-GAAP EPS near $4.00 at 65 times. Illustrative level: $260 [base estimate].
Five years: approximately $9.5 billion IP/CSS plus approximately $5 billion AGI CPU equals approximately $14.5 billion total revenue. FY2031 non-GAAP EPS near $4.97 at 49 times. Illustrative level: $245 [base estimate]. Annualized return from $347.71: roughly negative 7 percent - the clearest arithmetic expression of “priced for perfection at entry.” What most likely breaks the base toward bear: hyperscaler capex guidance reduction from two or more of the four majors.
Bear - the skeptic’s case
The skeptic’s strongest points, in order of weight: the valuation math does not close even on management’s own targets; the own-chip customer conflict structurally undermines the neutral-licensor moat; a regulatory remedy or licensee defection signal could arrive before the AGI CPU scale story validates; and the Q4 FY2026 royalty deceleration to 11 percent may be the leading edge of a structural trend, not a one-quarter anomaly.
What has to be true: Q1 FY2027 royalty prints at or below 11 percent YoY - deceleration confirms rather than reverts. The FTC probe escalates to a formal complaint with a behavioral remedy capping CSS royalty pricing. Qualcomm closes the Tenstorrent acquisition and announces a RISC-V roadmap for server products. AI capex guidance is cut by two or more hyperscalers in late 2026. Arm China revenue declines accelerate below 14 percent of total revenue.
Six months: royalty at or below 11 percent, Goldman and New Street thesis gains traction, multiple compresses from 160 times toward 100 times on FY2027 EPS near $2.08. Illustrative level: $210 [bear estimate].
One year: royalty deceleration confirmed, FTC escalates, AI capex guidance cut, FY2028 forward EPS near $2.50 at 66 times. Illustrative level: $165 [bear estimate].
Three years: AGI CPU negligible (FTC remedy and customer conflict stall program), royalty CAGR settled at 12 percent, FY2029 EPS near $2.63 at 50 times. Illustrative level: $130 [bear estimate].
Five years: approximately $8 billion IP/CSS plus approximately $1.5 billion AGI CPU equals approximately $9.5 billion total revenue. FY2031 EPS near $3.11 at 35 times. Illustrative level: $110 [bear estimate]. The stock at $110 still trades at 35 times a high-quality royalty annuity with an intact ISA moat - the 97.5 percent gross margin business retains a residual quality premium even in the bear case. Annualized loss from $347.71: roughly 21 percent. What most likely breaks the bear: Q1 FY2027 royalty re-accelerates to 18-20 percent or above.
The scenario-flip signal to watch. Q1 FY2027 royalty revenue year-over-year growth rate, reported July 29, 2026, after market close. Above 20 percent validates the bull. At or below 11 percent (Q4 FY2026 level) confirms deceleration and validates the bear. Anywhere in between keeps the debate open.
Companies to watch (bull / base / bear)
These are the names whose earnings, design disclosures, or business decisions will signal which scenario is playing out.
Qualcomm (QCOM) - all scenarios. The most important signal name in this entire ecosystem. Q1 FY2027 Snapdragon royalty trends give direct visibility into premium smartphone royalty health. The Tenstorrent deal: if it closes, Qualcomm has committed roughly $10 billion to a RISC-V alternative, signaling the customer-conflict thesis is credible. The counter-suit outcome (unconfirmed): a Qualcomm win feeds the FTC investigation’s evidentiary record. The signal direction: RISC-V acquisition closed = bear; litigation resolved in Arm’s favor = bull.
MediaTek (2454.TW) - base and bull signals. The highest-volume Armv9 licensee. Dimensity 9400 Armv9 penetration in Chinese Android mid-range tells you whether v9 is ramping at the rate the mix-shift thesis requires. A MediaTek RISC-V product announcement for future designs would be an early bear warning from the volume licensee most sensitive to royalty rates.
Apple (AAPL) - royalty floor stability. iPhone sales volumes determine the floor beneath Arm’s entire royalty model. Any AAPL unit guidance cut feeds through to smartphone royalty sentiment, even though Apple’s ALA rate is fixed. Conversely, iPhone share gains in premium markets reinforce the high-ASP, high-v9-rate base.
Nvidia (NVDA) - datacenter royalty trajectory. Watch the Vera Rubin platform ramp closely. Vera uses Olympus cores (ALA-compatible, not Neoverse CSS); as it replaces Grace-Blackwell in Nvidia’s main AI server platform from FY2027-FY2028, the CSS royalty from the Nvidia stack steps down to an ALA rate. How quickly Vera scales relative to Grace-Blackwell’s sunset sets the near-term datacenter royalty ceiling. See our NVDA deep dive.
AWS Graviton ramp (AMZN) and Microsoft Cobalt (MSFT) - datacenter bull signals. Any public disclosure of Graviton5 deployment scale or Cobalt 200 deployment scale, or the announcement of their next-generation successors, directly validates the CSS royalty trajectory.
Ampere Computing (private, SoftBank subsidiary) - customer-conflict canary. If Ampere adopts RISC-V for next-generation products - a possibility given its position as a corporate sibling to Arm’s own AGI CPU competitor - it would signal that even SoftBank’s own portfolio companies are hedging the ISA. If Ampere doubles down on Arm CSS, the customer-conflict thesis is less credible.
SiFive (private) - RISC-V ecosystem velocity. Watch for any commitment by a major non-China hyperscaler to SiFive IP for server or mobile workloads. No such commitment has been disclosed as of this writing; its presence would be a structural bear signal for the ISA moat.
Hyperscaler earnings (October-November 2026 Q3 cycle) - multiple trigger. Any reduction in CY2027 capex guidance by two or more of Amazon, Microsoft, Alphabet, and Meta triggers the AI capex digestion narrative and reprices Arm’s multiple before the royalty line moves.
Risk controls
Position sizing at a 160 times forward P/E multiple requires explicit acknowledgment that the multiple can compress 30-50 percent with no fundamental deterioration in the royalty business. A 30 percent compression from 160 times to 112 times - still a significant premium to any semiconductor IP peer - cuts the stock price roughly 30 percent. At this entry multiple, the sizing should reflect that risk explicitly.
The SoftBank overhang. A secondary offering of even 5 percent of SoftBank’s position (approximately 46 million shares) into a float of 142.6 million ADS would represent roughly 3 trading days of average float supply. At $347.71 that would be approximately $16 billion of supply - not impossible to absorb, but the thin-float dynamics mean large supply events reprice sharply. SoftBank has not sold since the September 2023 IPO; the risk is structural and permanent, not signaled by current behavior.
The July 29 earnings event. With 30-day implied volatility at approximately 99 percent, options pricing implies a potential move of roughly 15-20 percent on the Q1 FY2027 earnings release. For position holders, the earnings date is the scenario-flip catalyst. Appropriate hedging strategies include put spreads, collars, or simply reducing exposure into the event if the position size exceeds conviction in the base case.
The FTC probe timeline. Antitrust investigations are not predictable. The FTC does not publish its investigation calendar. A Civil Investigative Demand (subpoena stage) or a formal complaint could arrive any quarter. The article will flag any FTC status update as a primary near-term risk event.
Rate duration risk. If the 10-year US Treasury yield is sustained above 4.75-5.0 percent through a rate re-acceleration, Arm’s 160 times multiple is one of the most rate-sensitive large-cap exposures in the market. A 100 basis point move in the 10-year compresses a DCF-implied fair value for a long-duration growth stock by roughly 15-25 percent with no change in royalties.
Arm China governance tail. A deterioration in the IPLA relationship or an expansion of US export controls to cover Arm ISA licensing to Chinese entities could remove approximately 16 percent of revenue with no short-term substitute channel. This is a binary-style tail risk, not a gradual one.
Methodology, sourcing, and data-quality flags
Sources and tiers. This research draws on primary-tier filings (the FY2026 20-F, the Q4 FY2026 6-K filed May 6, 2026, and prior-year 6-Ks), press-tier sources (Qualcomm IR press releases, Bloomberg, Tom’s Hardware, The Motley Fool, StockAnalysis.com, 247wallst.com, GuruFocus, stocktitan, TIKR), and analyst-tier estimates (EE Times royalty rate estimates; IDC market share figures; peer multiple approximations). All load-bearing figures are recorded in claims.jsonl with source URL and tier; this section summarizes the key data-quality flags.
Primary data-quality flags.
The FY2026 royalty and license figures are confirmed from the Q4 FY2026 6-K exhibit. FY2025 royalty ($2,159 million) and license ($1,848 million) splits are back-calculated from FY2026 disclosed growth rates (21 percent and 25 percent respectively), cross-checked against Q4 FY2025 quarterly totals for consistency.
The Japan revenue jump from $296 million (FY2025) to $825 million (FY2026) is taken from the geographic revenue table in the 20-F. The attribution to a SoftBank-related or large Japanese licensing agreement is inference, not a disclosed fact; the related-party detail should be verified against the 20-F related-party-transactions note before this is presented as more than a geographic-table observation.
The Armv9 share of royalty revenue “crossing 50 percent” is management commentary from the Q4 FY2026 earnings call, not a line-itemed filing figure - treat as press tier.
Royalty rate percentages (v8 approximately 2.5-3.5 percent of chip ASP, v9 approximately 5 percent, CSS approximately 10 percent) are analyst estimates (EE Times and industry sources). Management confirms only the approximately 2x per-step ratios. Do not read these percentages as contractual figures.
The market cap figure of approximately $370 billion reflects the June 25, 2026 closing price of $347.71. Capital.com cited approximately $383 billion on June 24; StockAnalysis.com showed approximately $355 billion on June 26 (reflecting the subsequent selloff). The research-date figure is approximately $370 billion.
The 52-week high is disputed across sources at $427.99 to $452.70 - reflecting closing-price versus intraday-high conventions. The $100.02 52-week low is corroborated. The EV/EBITDA is disputed across three sources at 176 times to 330 times and is omitted from valuation analysis given the spread.
Analyst mean price targets are disputed across aggregators at $238-$334 depending on timeliness of updates. The StockAnalysis.com figure of $295.95 (40 analysts) is used as the reference.
The FTC probe is reported by Bloomberg and Tom’s Hardware as of May 2026. No FTC press release or formal complaint has been identified. Frame as early-stage probe, not as a confirmed regulatory action.
The Qualcomm counter-suit trial outcome (March 2026) is unconfirmed in public sources as of June 26, 2026 - a material research hole that should be closed before publication if possible.
Peer forward P/E multiples (NVDA approximately 45 times, AMD approximately 40 times, AVGO approximately 30 times, INTC approximately 28 times, QCOM approximately 15 times) are analyst estimates from the rating process and were not individually verified in this research run. They carry the same directional accuracy as published target consensus but may be stale.
The RISC-V “approximately 25 percent penetration in China’s AI and IoT chip sectors” is from industry press (Digitimes, Adafruit blog citing analysis) and is directional rather than precisely measured. The trend is confirmed by Arm’s own filing data showing Arm China revenue share falling from 21 percent to 16 percent over two years.
Five-factor read - plain prose.
Valuation. This is the binding constraint on the entire investment case. At roughly 160 times forward non-GAAP P/E, 72 times trailing price-to-sales, and a PEG near 8.9 times, the stock carries one of the highest multiples in large-cap technology. The consensus mean analyst target on most aggregators sits 11-20 percent below the current spot despite a predominantly Buy-rated coverage universe - an unusual condition that signals the stock has outrun analyst models. Goldman Sachs carries a formal Sell rating at $150. New Street Research downgraded to Neutral on June 18. Even in the bull scenario, five-year annualized returns from today’s entry barely reach 9 percent. The valuation picture argues clearly against the buy case at this price.
Growth. Three consecutive years of 20-plus percent revenue growth (FY2024 plus 21 percent, FY2025 plus 24 percent, FY2026 plus 23 percent) is confirmed by primary filings. ACV grew 22 percent to $1.66 billion in FY2026, 56 ATA licensees are active, datacenter royalties more than doubled year over year in Q3 and Q4, and the AGI CPU has more than $2 billion in contracted customer demand for FY2027-FY2028. The growth case is the strongest factor here and argues in the buy direction - it is genuine, verified, and driven by a mechanism (rate uplift plus datacenter mix shift) that can sustain above-market growth rates for several years.
Quality. A 97.5 percent GAAP gross margin, $3.6 billion in liquid assets, essentially zero financial debt, and an ISA moat backed by 22 million-plus developers and 40 years of toolchain investment make this one of the highest-quality unit-economic positions in the semiconductor stack. The annuity structure means FY2015 licenses are still generating FY2025 royalties. Offsetting: stock-based compensation of $1.052 billion per year exceeds GAAP net income; Arm China is uncontrolled and unaudited at $787 million revenue; the AGI CPU will dilute blended gross margin from 97.5 percent toward 72 percent at FY2031 targets; and the SoftBank controlled-company structure concentrates governance risk. Quality is elite but not unblemished - the picture is mildly positive.
Risk. The risk picture is elevated across several independent dimensions simultaneously. SoftBank’s 86.72 percent stake (with a reported $8.5 billion margin loan drawn against Arm shares as of late 2025) creates a tail risk of forced secondary supply into a thin float. Arm China’s $787 million revenue stream is governed outside Arm’s control and subject to both RISC-V substitution mandate and US export control escalation risk. The FTC probe targets the precise product (CSS datacenter royalties) that drives the bull case. The Qualcomm counter-suit is unresolved. Nvidia Vera’s shift to custom Olympus cores removes the CSS royalty from Nvidia’s next-generation AI platform. The beta of approximately 3.78 and 30-day implied volatility of approximately 99 percent amplify all of the above. The risk picture argues against the buy case.
Momentum and sentiment. YTD gain of approximately 205 percent is a strong momentum reading. Short interest has declined (bears covering into the rally). Against that: the stock pulled back more than 20 percent from its all-time high; it fell 9.24 percent in a single June 23 session; insider selling at $226-$416 per share through May-June 2026 is a neutral-to-negative signal; RPO fell 7 percent year over year; and the consensus mean target remains below spot on most aggregators. Momentum is positive over the full YTD window but decelerating at the near-term horizon. The factor reads neutral.
Overall lean. The growth case and business quality argue in one direction; the valuation and risk picture argue in the opposite. Valuation is the binding constraint because even the bull scenario barely returns 10 percent annually from a $347.71 entry, and the risk is materially two-sided. On balance, the read lands at Hold.
The figures in this article are OSINT research compiled as of June 25, 2026. Price, market cap, and multiples are point-in-time and will be stale by the time you read this. This article is not investment advice, not a recommendation to buy or sell, and no part of it should be construed as a price target or guarantee of any outcome. Arm Holdings plc (ARM) involves specific risks: SoftBank’s controlling stake, Arm China governance opacity, FTC investigation (no formal complaint filed), Qualcomm counter-suit (outcome unconfirmed), RISC-V competitive substitution, and an extreme forward multiple. Do your own due diligence and consult a licensed financial professional before making any financial decision.