
Research date: June 29, 2026. All prices, market capitalizations, and filed figures cited here are as of that date. They move. This is a structured research read on Costco Wholesale Corporation (Nasdaq: COST), its membership-fee model, the premium multiple the stock carries, and a five-year outlook across bull, base, and bear scenarios.
Important disclaimer. This article is OSINT research compiled from public filings, verified market data, and open-source intelligence, for informational purposes only. Nothing here is a recommendation to buy, sell, or hold any security. Past performance does not predict future results. All scenario prices and horizon figures are illustrative estimates, not price targets. Costco trades at a premium multiple that can compress sharply on no operational news, so a wonderful business can still be a poor investment at the wrong entry price. The China trademark dispute and the member tariff-billing class actions referenced below are pending matters with no determined outcome, and the membership, renewal, and valuation figures are point-in-time and change fast. Consult a qualified financial adviser before making any investment decision.
Where this stock could be in 6 months, 1 year, 3 years, and 5 years
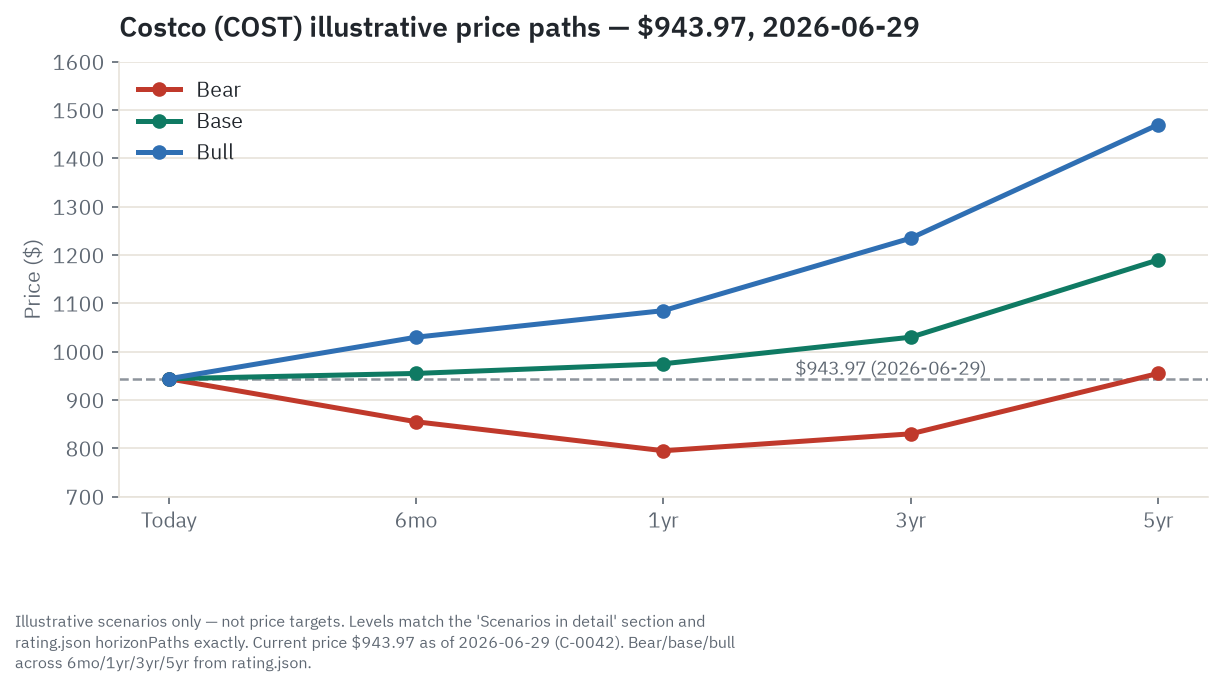
The next six months are about the cycle, not the structure. Costco reports comparable sales every month in an 8-K (comparable, or “same-warehouse,” sales count only warehouses open at least a year and strip out the contribution of new openings, so they isolate underlying demand), and the Q1 FY2027 holiday print lands in December 2026 - those are the dated catalysts, set against a Federal Reserve that is not cutting and where nine of nineteen policymakers favored a hike in 2026. The base case has the stock roughly flat near $955, holding around 44 times next-twelve-month earnings of about $21.70 as comps moderate from the post-fee-hike sugar high toward the mid-single digits. The bull at $1,030 needs holiday traffic and the fast-growing international segment to reaccelerate and fee-increase chatter to build. The bear at $855 is a soft or gas-distorted print drawing the same “beat and the stock falls” reaction the May 28 quarter got. The single thing most likely to flip this horizon is whether good news can move the stock up at all, or whether perfection is already in the price.
One year out is the de-rate window, and it is the heart of the whole read. The base at $975 is modestly higher, roughly +3 percent: about 10 to 11 percent earnings growth on about $22.50 of FY2027 EPS, with the multiple holding near 43 times rather than expanding. The bull at $1,085 lines up almost exactly with the $1,083 sell-side mean target and assumes double-digit fee growth carries the stock at a held multiple. The bear at $795 is a roughly 16 percent reversion toward the stock’s own 10-year median multiple zone, near the $769 Sell case Roth Capital published in December 2025, and with short interest under 2 percent there is no short-covering bid waiting to cushion a break. The flip here is the path of the 10-year Treasury yield set against the earnings yield, which is just earnings divided by price, the inverse of the P/E. At about 48 times earnings Costco yields only about 2.1 percent, and when safe Treasuries pay 4.4 to 4.6 percent, that gap is what pressures a rich multiple to compress.
Three years out the structural drivers start to show. The base at $1,030 is roughly flat to modestly higher: about 35 percent cumulative EPS growth toward $27 fights a multiple normalizing toward the 38-times median. The bull at $1,235 needs the next membership fee increase (the historical cadence points to 2029 or 2030), Executive-tier upgrades, and international whitespace to push earnings growth into the mid-teens while the premium holds. The bear at $830 is dead money to down, the priced-for-perfection trap, as the China-optionality premium gets questioned and the multiple reverts toward a Walmart-minus level even on a clean operating record. The flip is whether the fee increase lands on schedule and renewal holds through it.
The five-year view is the durability question in its purest form. The base at $1,190, about 26 percent above today, puts $33 of EPS on a 36-times multiple: real compounding, but a meaningful give-back from 43.5 times that holds the annual total return to mid-single digits with the dividend. The bull at $1,470 has warehouse expansion, the 2029-2030 fee hike, China renewal maturing toward Japan and Korea levels, and retail-media optionality all compounding at a sustained premium. The bear at $955 is essentially flat, roughly zero to one percent a year before the dividend, the definition of a great business bought at the wrong price; the hard tail, on a recession layered with multiple compression, sits near $460 to $490. The flip over five years is whether the roughly 125 percent valuation premium to BJ’s and 36 percent premium to Walmart proves durable or mean-reverts.
Where the read lands today. On balance the read is a Hold. Costco is a genuinely best-in-class membership-annuity compounder, with worldwide renewal near 90 percent, double-digit fee growth, a net-cash balance sheet, and a low-price flywheel that Sam’s Club has not broken in 43 years of trying. The problem is the price, not the business: at about 48 times trailing earnings, roughly 28 percent above its own 10-year median, the multiple already pays for a flawless decade, which means the stock can be near-dead money if that multiple simply reverts even while the company executes perfectly. The single thing most likely to change this read is the multiple itself: a reset toward the 38-times median on an unchanged business would move the lean toward Buy, while a renewal break below 88 percent worldwide would push it toward Sell.
Companion tool
Jump to the interactive dashboard to sort and filter Costco against its seven-name competitive set, or download the Excel model to flex the EPS and multiple assumptions behind each horizon yourself.
TL;DR
Costco earned $10.383 billion in operating income in FY2025, and the popular shorthand that “the membership fee is basically all the profit” is wrong on the current numbers. Membership fee income was $5.323 billion, about 51 percent of operating income; the merchandise operation, net of all SG&A, contributed the other $5.060 billion, about 49 percent. So this is two profit engines, not one: a near-100-percent-margin annual fee paid by 81 million households that renew at 92.3 percent in the US and Canada, bolted to a $270 billion merchandise machine run at a deliberately thin 1.86 percent net margin so the savings stay real enough to justify renewing. That second engine is the catch in the valuation. Half the operating income is a capped, cyclical, tariff-exposed retail margin, and yet the whole company trades at about 48 times trailing and 43.5 times forward earnings, roughly 28 percent above its own 10-year median of 37.6 times, on a business growing earnings 10 to 13 percent a year. The math is a price-to-earnings-growth ratio north of three. The stock has already started to feel it: it returned about -3.94 percent over the trailing year while the S&P 500 rose almost 22 percent, and it sits below both its 50-day and 200-day moving averages. The single biggest risk is not an earnings miss. It is a multiple that reverts toward its own median while earnings keep growing, which can leave a flawless five years roughly flat. That is why this reads as a Hold: the quality is real, and the price has already paid for it.
Explore it yourself: the interactive dashboard
Open the dashboard in a full screen
The dashboard carries Costco plus its seven-name orbit (WMT, BJ, AMZN, TGT, KR, DG, DLTR), sortable by valuation, scale, and role, with each name’s bull and bear flag attached.
A toll bridge with a warehouse bolted to the far side
The clearest way to picture Costco is as a toll bridge that happens to have a very cheap store on the other side. You cannot shop without paying the annual toll first: no card, no entry, no purchase. Once you have paid, everything on the far side is sold at close to cost, on purpose, because the cheapness is what makes you renew the toll next year. The store does not exist to make money on what it sells. It exists to make the toll worth paying.
That structure produces two distinct money flows, and getting their relative size right is the single most important thing in this entire piece. The first flow is the membership fee. About 81 million paid households (81.0 million at the FY2025 year-end, 82.9 million by the May 2026 quarter) each pay $65 a year for a Gold Star card or $130 for an Executive card, up front, before they buy a single item. That fee costs Costco almost nothing to collect: there is no cost of goods against it and minimal incremental servicing cost, so it falls to operating income at close to a 100 percent margin. In FY2025 it generated $5.323 billion, the first time the line crossed $5 billion, up 10.3 percent year over year.
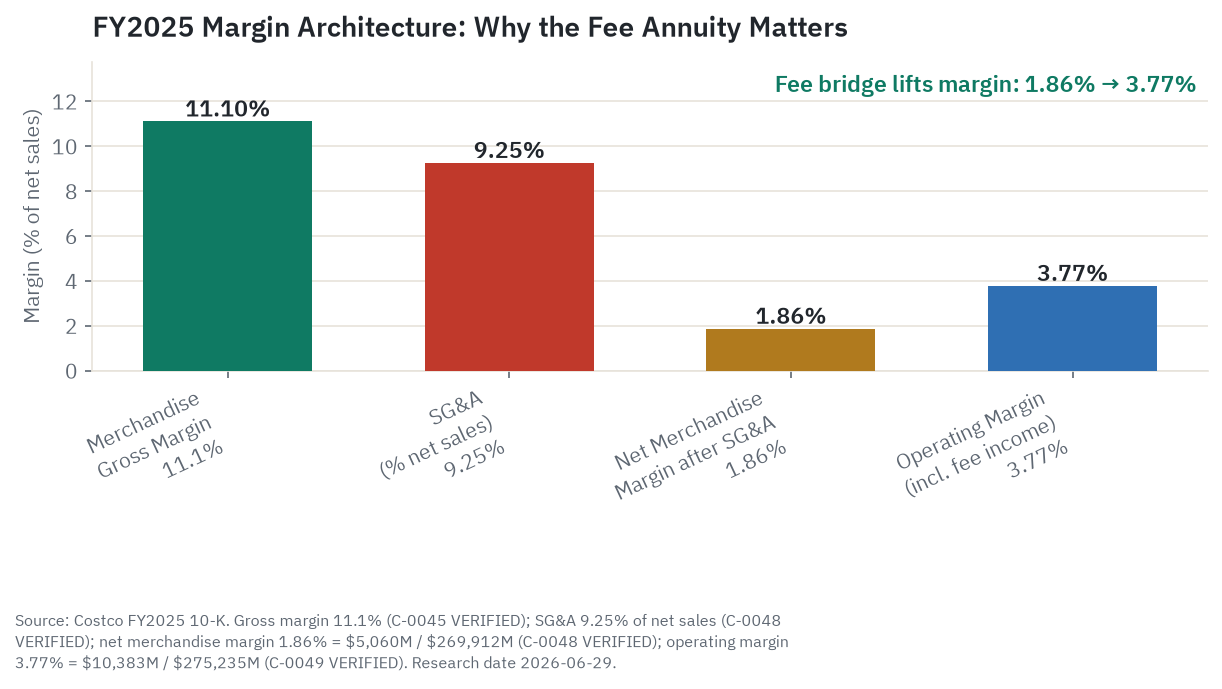
The second flow is the merchandise itself: $269.912 billion in net sales in FY2025. Here Costco does the opposite of a normal retailer. It caps its markup at 14 percent on branded goods (15 percent on its own Kirkland Signature line) and runs a blended merchandise gross margin of 11.1 percent, far below the 25-to-30 percent a supermarket earns or the 40-plus percent of specialty retail. After SG&A of $24.966 billion (9.25 percent of net sales), the merchandise operation nets about 1.86 percent. On $270 billion of sales, that thin slice is still $5.060 billion of operating income.
Here is the fact to hold onto, because a lot of careless commentary gets it wrong. Those two engines are close to the same size. Fee income is 51.3 percent of operating income; merchandise net of SG&A is 48.7 percent. The often-repeated claim that “merchandise earns roughly zero and the fee is nearly all the profit” was closer to true a few years ago (in FY2022 the fee was about 62 percent of operating income), but merchandise margin has expanded since, and on FY2025 numbers the two halves contribute almost equally. The 1.86 percent net merchandise margin and the $5.060 billion merchandise contribution are the same fact expressed two ways, not a contradiction: a very thin margin on a very large sales base produces a profit pool nearly as big as the fee.
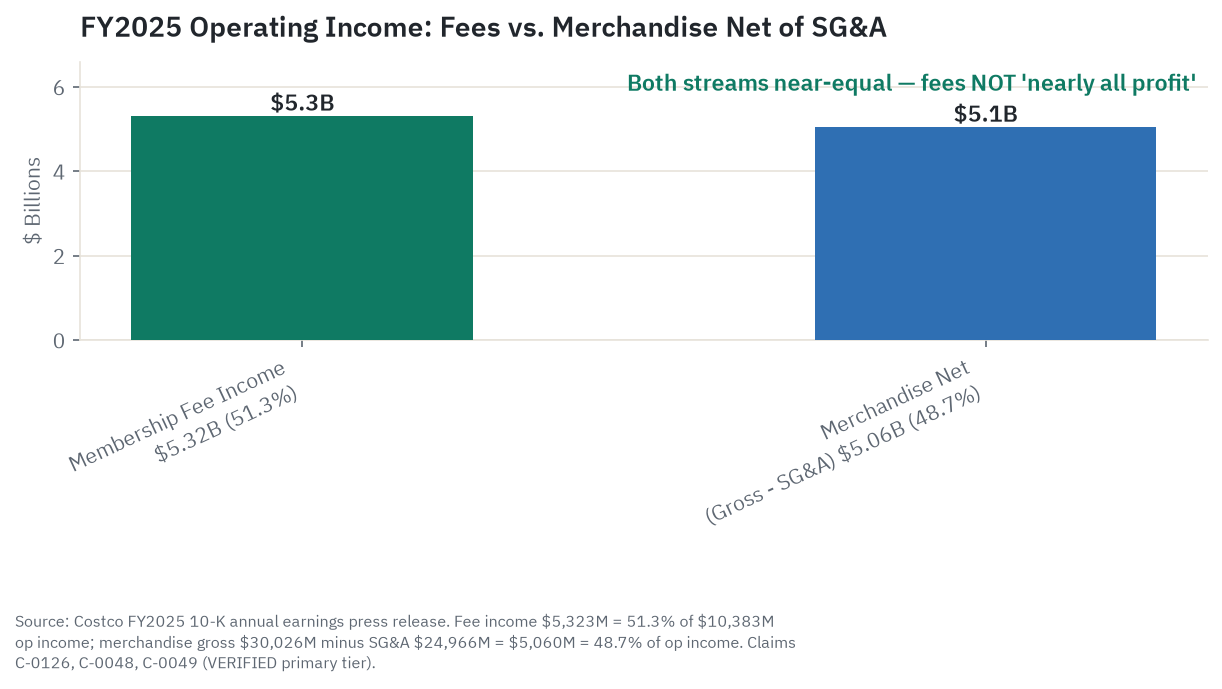
Why does this distinction matter so much for the stock? Because the bull case for paying 48 times earnings rests on the word “annuity.” A near-100-percent-margin, recurring, low-churn fee stream deserves something like a subscription multiple. But that logic only cleanly applies to about half the profit. The other half is a capped, cyclical, tariff-exposed retail margin that behaves nothing like a subscription. So the premium has to be argued on the roughly 51 percent that genuinely is annuity-like, not on a fictional 100 percent. That single correction is what turns “obviously justified” into “debatable,” and it is the spine of the bear case later in this piece.
How the money flows
flowchart TD
    MEM["Members: 81.0M paid (FY2025), $65-$130/yr fee\nRenew at 92.3% US/Canada"]
    FEE["Annual Fee Income\n$5.3B FY2025, near-100% margin\nChokepoint: only path to shop"]
    WH["Warehouse Floor\n914 locations, 11.1% merch gross\nMembership gate: no card, no shopper"]
    OI["Operating Income\n$10.4B FY2025"]
    GAS["Gas Stations\n~$27B, near-zero margin\nTraffic driver, pulls trips"]
    KS["Kirkland Signature\n~$90B, ~33% of sales\nPrivate-label lever disciplines suppliers"]
    SUPP["Suppliers\n~4,000 SKUs; ~$60M revenue/SKU\nHigh buying power vs mass retail"]
    DEPOT["Cross-dock Depots\n24 US facilities\nZero overnight storage"]
    FLOAT["Negative cash-conversion float\n13x inventory turns; CCC ~-2 days\nSuppliers finance Costco's stock"]

    MEM -->|annual membership fee| FEE
    FEE -->|"~51% of total operating income"| OI
    MEM -->|"$269.9B merchandise spend"| WH
    WH -->|"$30B gross profit minus $25B SG&A = ~$5B"| OI
    MEM -->|gas fill-up visit| GAS
    GAS -.->|traffic flywheel back to warehouse| MEM
    KS -->|private-label threat holds brand prices down| SUPP
    SUPP -->|bulk contracts at scale pricing| DEPOT
    DEPOT -->|just-in-time cross-dock replenishment| WH
    WH -->|fast turns, pay suppliers after goods sell| FLOAT
    FLOAT -->|supplier float reduces working-capital need| OI
Read the diagram top to bottom and the model becomes obvious. The membership card is the chokepoint: it is the only way onto the warehouse floor, and it converts directly into the fee line that supplies about half of operating income at near-100-percent margin. The merchandise spend funnels through a deliberately narrow door of roughly 4,000 active SKUs. A typical supermarket stocks 30,000 or more. Because Costco’s entire volume concentrates through 4,000 items, each one generates on the order of $60 million in annual warehouse revenue, roughly ten times the per-item volume at a broad-assortment mass retailer, and that concentration is what gives Costco’s buyers their pricing power: a supplier is competing for one of fewer than 4,000 slots, not one of hundreds of thousands.
Two side loops make the machine turn cheaper than it looks. Gas stations move about $27 billion of fuel a year at near-zero margin; they are not a profit center, they are a reason to drive to the warehouse twice a month. And the working-capital loop runs in Costco’s favor. It helps that goods move through about two dozen US cross-dock depots rather than into storage: pallets are received, sorted, and reshipped to warehouses the same day with no overnight warehousing step, which keeps inventory moving and is part of why turns are so fast. Inventory turns 13.24 times a year, roughly every 28 days, and the cash conversion cycle runs around negative two days. In plain terms, members pay at the register before suppliers’ invoices come due, so suppliers are effectively financing Costco’s inventory for free. That float funds new warehouse openings without the capital drag that would otherwise constrain growth, and it is why a business with a 1.86 percent merchandise margin still throws off $7.837 billion of free cash flow.
The membership engine: fees, renewals, and the flywheel
The fee stream is the highest-quality part of Costco, and it compounds three ways without needing margin expansion. First, member count: 81.0 million paid households at the FY2025 year-end, growing to 82.9 million by the May 2026 quarter, with total cardholders including add-ons reaching 149 million. Second, tier mix: Executive members (the $130 tier, which returns a 2 percent reward capped at $1,250 a year) were 38.7 million at year-end, about 47.8 percent of paid members, and they drove 73.6 percent of worldwide net sales. Executive membership is growing around 9 to 10 percent a year, more than double the roughly 4 percent growth in total paid members, which means existing members are trading up faster than new ones are joining. Each upgrade adds high-margin fee income and pulls up the member’s average basket, because the 2 percent reward only pays off if you spend more.
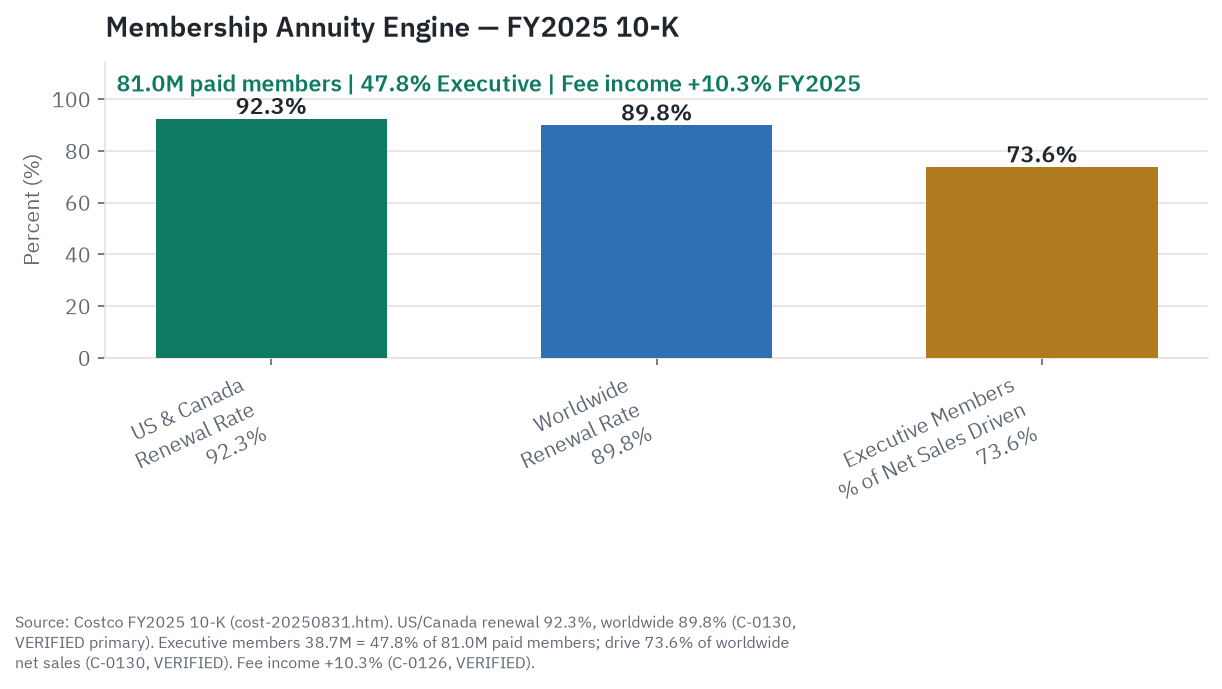
The third lever is the periodic fee increase, and it is the highest-certainty growth event in the entire model. Costco raised fees in September 2024 for the first time in seven years, taking Gold Star from $60 to $65 and Executive from $120 to $130, both up 8.3 percent, across roughly 52 million affected memberships. The renewal rate barely flinched: US and Canada slipped about 10 basis points to 92.2 percent and then stabilized, worldwide held near 89.8 percent. The historical cadence (increases in 2000, 2006, 2011, 2017, and 2024) averages about five and a half years, which points to the next one around 2029 or 2030. A similar raise on a larger member base would add an estimated $400 million to $500 million in annual operating income at close to 100 percent flow-through. That is not a forecast of accelerating growth; it is a near-certain, datable step-up that the model has delivered five times in 24 years.
Renewal is the number to watch above all others. It is the spine of the annuity. The worldwide rate has held near 90 percent through a fee increase, through COVID, and, by management’s account, through prior recessions, because in a downturn the value of cheap staples and discounted gas rises rather than falls. A renewal rate that fell below 88 percent worldwide would be a genuine structural warning, and it has never happened. The flywheel underneath it is simple and self-reinforcing: low prices attract and retain members, the resulting volume gives Costco supplier pricing power, that power keeps prices low, and low prices keep members renewing. No single stage needs to earn a normal retail margin for the loop to work.
The merchandise model: SKU curation, Kirkland, and the treasure hunt
The narrow door of roughly 4,000 SKUs is the engine of the whole merchandise operation. Fewer items means more volume per item, more volume per item means more supplier competition for the slot, and more competition means lower cost. It also means Costco’s buyers manage a handful of high-velocity winners rather than a long tail of slow movers, which is why inventory turns 13.24 times a year against roughly 9 times at Walmart, 6 times at Target, and 4 to 5 times at Kroger. Part of the assortment rotates constantly (the “treasure hunt” of limited-time and seasonal items that are gone when they are gone), which manufactures urgency and trip frequency without a marketing budget.
Kirkland Signature is the lever inside the lever. At roughly $90 billion in FY2025 sales, about a third of total merchandise revenue, Kirkland is by volume one of the largest consumer brands on earth. It does three jobs at once. It earns a slightly better margin (a 15 percent markup cap versus 14 percent on branded goods, on a cost base Costco controls). It disciplines every national-brand supplier, because the credible threat to replace a brand with a Kirkland alternative caps what that brand can charge across the whole assortment; Costco has done exactly that in coffee, batteries, spirits, and dozens of other categories. And it builds switching cost: a member who relies on Kirkland olive oil or Kirkland rotisserie chicken cannot buy them anywhere else, which quietly supports the renewal rate. CFO Gary Millerchip has said Kirkland grows faster than the overall business and adds a tailwind to margin.
The thing the merchandise margin cannot do is absorb a shock. At 1.86 percent net, there is almost no buffer. SG&A at 9.25 percent of net sales is already one of the lowest ratios in retail, against an industry median near 27 percent, and Costco gets there not by underpaying staff (top-of-scale hourly pay reached $31.90 in 2026, with employee turnover after the first year around 6 percent against a retail norm of 60 to 70 percent) but by running no real advertising, low shrink, and very high sales per labor hour. There is little fat left to cut if costs rise. Which is exactly why tariffs, covered below, land harder on Costco’s merchandise half than on a conventional retailer that can simply raise prices.
What the filings say
Costco’s fiscal year ends the Sunday nearest August 31; FY2025 ended August 31, 2025. The income statement shows a business accelerating, not maturing. Net sales rose 8.1 percent to $269.912 billion (gasoline price deflation alone cut reported sales by $2.329 billion, about 93 basis points, so the underlying figure was stronger). Membership fee income rose 10.3 percent to $5.323 billion. Total revenue was $275.235 billion. Merchandise gross profit was $30.026 billion, or 11.12 percent of net sales, up 20 basis points year over year. Operating income was $10.383 billion, a margin of 3.77 percent of total revenue and a multi-year high. Net income was $8.099 billion and diluted EPS was $18.21, both up 9.9 percent. The effective tax rate was 25.1 percent.
The current year is running hotter. Through the first three quarters of FY2026 (the 36 weeks ended May 10, 2026), net sales grew 9.6 percent to $203.374 billion and diluted EPS grew 13.6 percent to $14.01. The third quarter alone (ended May 10, 2026) showed net sales up 11.6 percent to $69.154 billion, membership fees up 10.7 percent to $1.373 billion, and EPS up 15.2 percent to $4.93. Adjusted comparable sales, stripping out gas and currency, ran about 6.6 percent. On a trailing-twelve-month basis through that quarter, diluted EPS is roughly $19.88. The most recent monthly data point, the four weeks ended May 31, 2026, showed net sales up 14.5 percent to $24.010 billion and total comps up 12.5 percent reported but 8.0 percent adjusted; the gap between those two numbers is gas-price inflation reversing the prior year’s headwind, and it is exactly why the adjusted comp is the cleaner demand read.
The cash flow and balance sheet are a fortress. FY2025 operating cash flow was $13.335 billion, capital expenditure was $5.498 billion, and free cash flow was $7.837 billion, up 18.2 percent. The balance sheet at year-end carried $15.284 billion in cash and short-term investments against $5.713 billion of long-term debt, a net cash position of about $9.571 billion. By the May 2026 quarter cash had built to $18.946 billion, which is fueling speculation about another special dividend. There is no covenant risk and no maturity wall.
On capital returns, Costco prefers organic reinvestment and special dividends to buybacks. The regular quarterly dividend was raised to $1.47 a share in April 2026 (an annualized $5.88, the 22nd consecutive year of increases), but the headline returns come from irregular special dividends: $15 a share in January 2024 (about $6.7 billion), preceded by $10 in 2020, $7 in 2017, $5 in 2015, and $7 in 2012. The buyback is modest, $903 million in FY2025 against a $4.0 billion authorization with about $1.542 billion remaining. Diluted shares sit around 444 million; dilution is minimal because the workforce is mostly hourly rather than equity-paid.
Geographically, the US is 72.7 percent of total revenue, Canada 13.4 percent, and Other International 13.9 percent. The 10-K discloses that the US and Canada together are 86 percent of net sales but 84 percent of operating income, which implies Other International earns a higher operating margin than its revenue share, a point in favor of the international growth case. The exact US-versus-Canada operating income split is not separately disclosed and is flagged as unverified. One concentration to note: California alone is 26 percent of US net sales, so a state-level regulatory, labor, or tax change there has outsized reach.
Costco’s own disclosed risk factors line up with the bear case. The 10-K names membership-fee dependency and renewal sensitivity (it explicitly states the model relies on fee income for roughly 51 percent of operating income, and that any dip in renewal or satisfaction could amplify vulnerabilities), competitive disruption from Sam’s Club’s digital app and Amazon Prime overlap, geographic concentration, and tariff and trade policy. On the last point the filing is blunt: roughly one-third of US merchandise cost of goods is imported, electronics, apparel, tires, and toys are the most exposed, and the 14 percent markup cap leaves Costco less pricing flexibility than competitors.
Unit economics and the moat: why this is hard to copy
Amazon, Walmart’s Sam’s Club, and BJ’s have all run the warehouse-club playbook, and none has matched Costco’s renewal rates, per-warehouse volume, or unit economics. The reasons are structural rather than accidental. Scale per SKU cannot be bought quickly: getting to Costco’s buying power requires roughly 80 million members shopping 4,000 items with predictable frequency, and that base takes decades to build. Sam’s Club has been at it since 1983 and remains roughly a third of Costco’s size by revenue. The Kirkland trust bond took more than 30 years of consistent quality to build, and a new private label has no reason to be trusted on day one. The wage and culture model, with 6 percent post-first-year turnover, is not a policy a competitor can import overnight.
There is a useful way to see how much of the value sits in the fee. If you valued the $5.323 billion fee stream alone as a recurring subscription at a conservative 20 times revenue, the fee business would be worth roughly $106 billion. Costco’s total market cap is about $418.63 billion. So the market is implicitly paying somewhere around $310 billion for the merchandise operation, the warehouse real estate, the Kirkland brand, the international growth options, and everything else. That framing cuts both ways: it shows the fee is not the whole company, and it shows how much of the price depends on the lower-quality, more cyclical merchandise half holding up.
A word on the cost of replication, because it gets thrown around loosely. A mature US warehouse generates on the order of $260 million to $300 million a year, and the buildout cost varies widely with whether the land is owned or leased; one reported recent US example came in near $37 million, while other estimates run higher. Any single replication-cost figure is an illustrative order-of-magnitude estimate, not a primary disclosure, and should be read that way. The durable barrier is not the cost of one building; it is the decades of member density, supplier relationships, and brand trust that make that building productive.
Growth levers: where the next chapter comes from
The growth levers rank cleanly by a combination of scale and certainty.
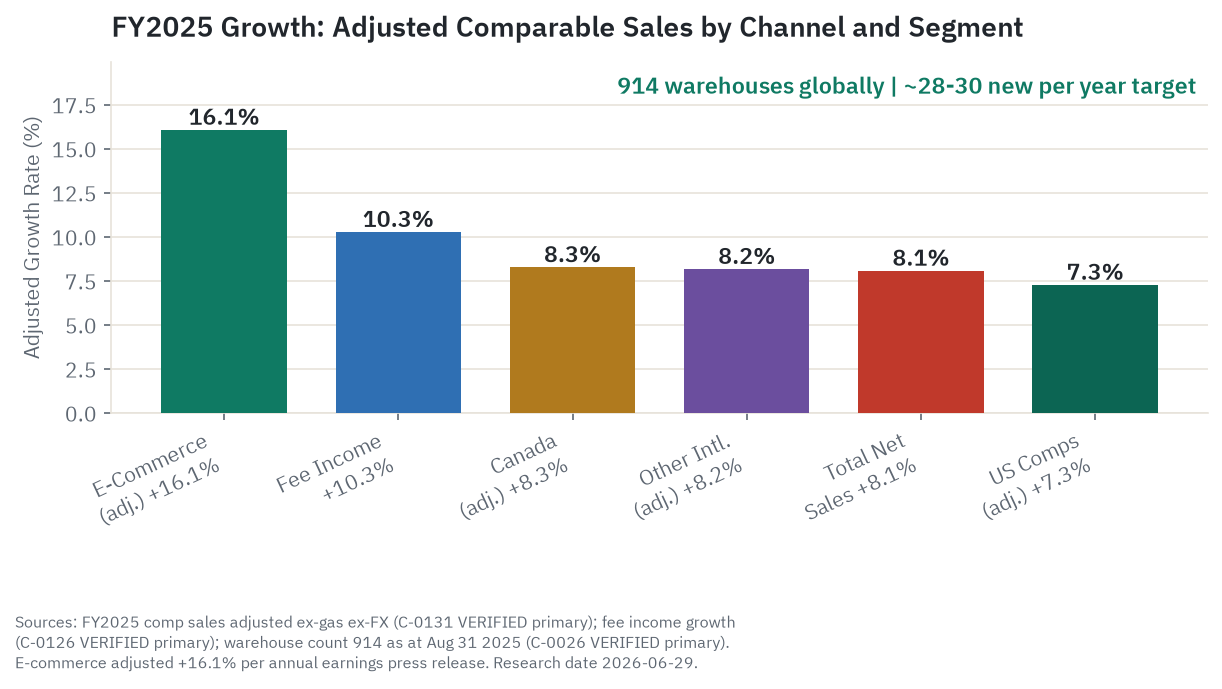
Warehouse expansion is the largest lever by absolute dollars. Costco operated 931 warehouses as of May 2026 (639 in the US and Puerto Rico, 115 in Canada, and roughly 177 across 12 other countries), up from 914 at the FY2025 year-end. Management targets about 28 net new in FY2026 (revised down from 35 because of Spain construction delays) and 30-plus a year over a five-to-ten-year horizon, roughly split between US and international, against a $6.0 to $6.5 billion annual capex budget. At 30 a year for five years, that is about 150 new warehouses and, on the company’s own per-warehouse revenue, an estimated $35 billion to $50 billion of incremental annual revenue at maturity. The US runway is finite (Sam’s runs about 600 US clubs, suggesting a practical US ceiling somewhere around 800 to 1,000), so international is the longer-term vector.
The next fee increase is the highest-certainty lever. As above, the 2029-2030 window points to an estimated $400 million to $500 million of pure-margin operating income, with only the timing in doubt.
Executive-tier penetration is a free internal lever. With roughly 42 million non-Executive paid members, each 1 percent that converts adds an estimated $420 million in incremental annual fee revenue at near-100-percent flow-through, no new members or warehouses required, and the conversion is already accelerating, helped by perks like a $10 monthly Instacart credit.
E-commerce is growing fast but capped by design. Digitally-enabled comparable sales grew about 21.5 percent in the May 2026 quarter, but pure e-commerce is only about 7 percent of net sales (roughly $18.9 billion; a $19.6 billion figure that circulates is not confirmed in any filing and is not used here). Costco deliberately limits digital to protect the in-warehouse treasure hunt. Costco Logistics, the in-house big-and-bulky last-mile operation covering about 90 percent of the US, is the more interesting piece: deliveries grew 31 percent in FY2025, and it extends the warehouse into the home in a way pure-play rivals cannot match through the store experience.
Kirkland and the ancillary services keep compounding quietly. Each point of Kirkland penetration shifts sales toward higher margin; pharmacy (now on a cost-plus model with Navitus), optical, and hearing aids carry above-average margin and ride the aging-member demographic; gas, food court, and travel are mostly traffic and retention tools rather than profit centers.
Two levers deserve hard hedges. China is real optionality but unproven. Costco runs 7 mainland warehouses, each reportedly generating well above the US revenue average, but the membership renewal rate there is reported at roughly 60 to 70 percent versus the roughly 90 percent global rate. That figure comes from a Shenzhen local-government press item, not from Costco, which does not disclose country-level renewal, so it should be treated as directional and unconfirmed. The bull thesis assumes China matures toward Japan and Korea renewal rates; that is a hope, not a disclosure, and the China premium in the multiple is therefore optionality, not a maturing certainty. Retail media is excluded from the numbers entirely. Costco launched an ad business in 2025 (using Criteo and Moloco technology), and Walmart’s comparable network reached roughly $4.4 billion, but Costco discloses no retail-media revenue, so any 5-year estimate (the modeled range runs $500 million to $1.5 billion) is unverified. The bull EPS case in this piece does not lean on it.
Company by company: who’s who
Costco’s competitors fall into three buckets: the warehouse-club tier that runs the same model, the format-adjacent tier that competes for the same wallet without a membership, and the discount fringe that serves a different shopper entirely. All figures are point-in-time to June 29, 2026.
Warehouse-club tier
Walmart (WMT), about $912 billion market cap. The world’s largest retailer, $713 billion in FY2026 revenue, with Sam’s Club as a roughly $93 billion segment running about 600 US clubs. Sam’s raised fees in May 2026 to $60 and $120, still a notch below Costco, and a 150-item 2026 price study put Sam’s about 8.2 percent cheaper on staples. Sam’s e-commerce hit $15 billion, up 24 percent. WMT trades at about 42.5 times trailing and 38.8 times forward earnings, roughly 23 times EV/EBITDA. Bull: Sam’s digital momentum and near-trillion-dollar scale fund price and logistics investment no rival can match. Bear: Sam’s renewal and Executive penetration both trail Costco, a loyalty gap sticker price alone has not closed, and WMT’s own 42-times multiple is not the cheap safe-haven it is sometimes painted as.
BJ’s Wholesale Club (BJ), about $11.42 billion market cap. The only other publicly traded pure-play warehouse club, roughly 245 clubs concentrated east of the Mississippi, about $21.45 billion in trailing revenue, with a coupon-accepting model and a co-branded card. Q1 FY2026 showed net sales up 9.9 percent, comps up 6.3 percent, fee income up 9.9 percent to a record $132.4 million, and a tenured renewal rate around 90 percent. BJ trades at about 19.3 times forward earnings and 12.7 times EV/EBITDA. Bull: the only investable pure-play alternative, at a fraction of Costco’s multiple, with renewal converging toward Costco levels. Bear: East-Coast concentration caps the addressable market, the coupon model dilutes the clean value proposition, and the roughly 90 percent renewal still trails Costco’s 92-plus percent. BJ’s 19-times multiple is the warehouse-club bear-case anchor, and it cuts against Costco’s premium, not for BJ.
Format-adjacent tier
Amazon (AMZN), about $2.58 trillion market cap. The most-cited Costco threat and the most overstated one. Prime, at $139 a year for roughly 240 million members, is the closest membership analog, and Amazon owns Whole Foods (about 529 stores, roughly 4 percent US grocery share) plus Amazon Fresh. But most Costco members also hold Prime; the two are largely complementary, not substitutes, and Amazon has not cracked bulk-warehouse discovery in 15 years of grocery investment. Bull: Prime deepens household wallet share alongside Costco, and AWS cash funds indefinite retail investment. Bear: Whole Foods is a premium niche, not Costco’s bulk floor, and the offline treasure-hunt format has stayed stubbornly out of Amazon’s reach. This one is roughly a wash for Costco, low-conviction either way.
Target (TGT), about $60.97 billion market cap. Roughly 2,000 stores, about $104.78 billion in trailing revenue, overlapping Costco on apparel, electronics, and home goods. Q1 FY2026 was a relief rally: revenue up 6.7 percent, the first positive comp in five quarters, traffic up 4.4 percent. But operating margin fell from 6.2 percent to 4.5 percent year over year on SG&A inflation, with no membership fee to cushion it. Bull: traffic recovery suggests the brand has stabilized, and Roundel ad revenue helps. Bear: margin compressed hard with no membership buffer, and Target keeps losing the overlapping basket to warehouse clubs.
Kroger (KR), about $34.43 billion market cap. The largest pure-play US supermarket, about 2,700 stores and $147.6 billion in revenue. Q1 FY2026 showed identical sales ex-fuel up just 1 percent, with e-commerce turning its first quarterly profit. Kroger’s 22.7 percent gross margin against Costco’s 11 percent encodes the core difference: Kroger earns on each item, Costco earns on the fee and runs goods near cost. Bull: the e-commerce profit inflection is real, and at about 0.23 times sales the stock is cheap. Bear: 1 percent identical sales signals structural traffic erosion toward clubs, and razor-thin margins leave no cushion.
Discount fringe
Dollar General (DG, about $25.95 billion) and Dollar Tree (DLTR, about $23.48 billion). Both serve a shopper earning materially less than Costco’s $75,000-plus core, with near-zero membership overlap. DG posted Q1 net sales up 3.4 percent and an EPS beat, with higher-income shoppers turning up in its value aisles, which is a sign of consumer stress, not a Costco threat. DLTR posted comps up 5.4 percent but warned Q2 EPS would fall 45 to 50 percent on Family Dollar separation costs and tariffs. Bull (both): credible EPS turnarounds and lean post-separation formats. Bear (both): credit-stressed core customers, tariff exposure, and no path to membership-club economics. Read these two as macro-stress indicators, not as competitors.
What the market is paying
Costco’s price action over the past year is the bear case in chart form. The stock returned about -3.94 percent over the trailing twelve months while the S&P 500 rose almost 22 percent, roughly 26 points of underperformance from a name with a reputation for never going down. It is up 9.74 percent year to date, up 76.93 percent over three years, and up 138.77 percent over five, so the long-run compounding is intact; the recent lag is the story. The 52-week range runs from $844.06 (December 2025) to an all-time high of $1,096.50 (May 19, 2026), and at $943.97 the stock sits about 13.9 percent below that peak reached only six weeks before the research date. It trades below both its 50-day moving average (around $1,003) and its 200-day (around $964), with near-term support around $926 to $944. Beta sits somewhere in the 0.6 to 0.9 range depending on the vendor and window; either reading confirms a stock less volatile than the market.
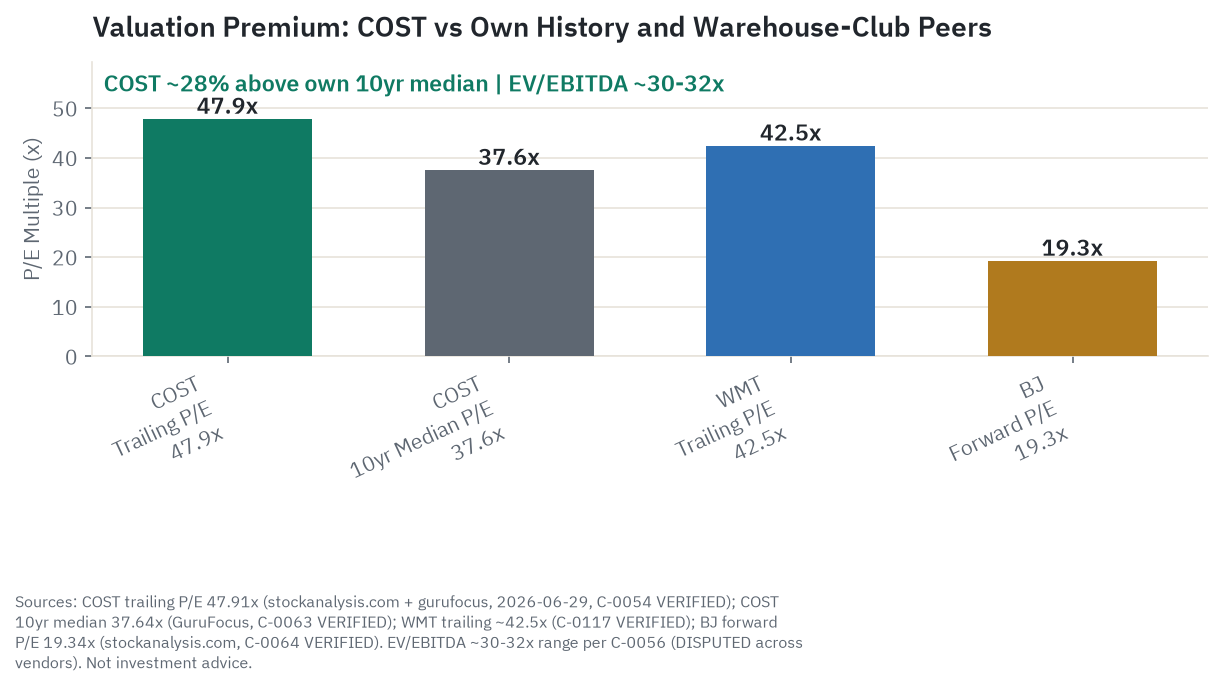
On valuation, the headline numbers are 47.91 times trailing earnings, 43.54 times forward, EV/EBITDA in a disputed 30-to-32 times range (vendors differ on lease treatment), 47.71 times free cash flow, and a 0.62 percent dividend yield. The honest read against its own history: Costco’s 10-year median P/E is 37.64 times, so the current trailing multiple is about 28 percent above it. It is closer to its own 5-year average of roughly 46 times, because the stock has traded richly since 2020, and it is well below the February 2025 peak near 62 times. So the stock is not at an extreme versus its recent range, but it is clearly expensive versus a full decade of history, and that 28 percent premium over the median is the real answer to “is this rich.”
Against peers, Costco commands about a 12 percent forward-P/E premium to Walmart and, on the cleaner EV/EBITDA basis that strips out capital structure (enterprise value, which adds debt and nets out cash, divided by cash operating earnings, so companies carrying different debt loads can be compared like for like), roughly a 36 percent premium. Against BJ’s, the structurally identical warehouse club, the forward-P/E premium is about 125 percent (43.5 times versus 19.3 times). That gap has historically reflected Costco’s higher renewal, international optionality, and Kirkland scale. Whether a 125 percent premium over the same business model is durable is the central valuation question, and the EV/EBITDA premium is the hardest part to defend: 36 percent over Walmart and well over 100 percent over BJ’s is a high bar that only holds if fee income keeps compounding at mid-teens rates while merchandise margins hold.
The price-to-earnings-growth math is where it gets uncomfortable. On a 10-to-13 percent earnings grower, 43.5 times forward earnings is a PEG ratio north of three, even north of four on the lower growth estimate. To justify 43.5 times at a conventional PEG of 2.0 the market would need roughly 21 to 22 percent NTM earnings growth, well above Costco’s historical 12-to-15 percent. The stock is liquid (about $2.35 billion of daily dollar volume), lightly shorted (1.5 to 1.8 percent of float, so no short-covering bid in reserve), and about 70.8 percent institutionally owned, with Vanguard, BlackRock, and State Street all having added recently. The sell-side leans bullish: of 37 analysts, 19 rate it Strong Buy and 13 Hold, with a mean target of $1,083 and a range from $740 to $1,315. Those are opinions, not conclusions of this analysis. The lone institutional bear worth naming is Roth Capital, which moved to Sell with a $769 target in December 2025, arguing that even small misses would trigger a re-rating.
What the crowd is saying
Sentiment splits cleanly into two well-represented camps, and they barely disagree about the business. The dominant “quality compounder, never sell” camp treats Costco as a quasi-subscription business that earns its premium, points to 92-plus percent renewal and clean execution under multiple management teams, and is untroubled by a 47-times multiple. The smaller “great company, wrong price” camp accepts the quality entirely and objects only to the entry price, citing the PEG north of three and the absence of any margin of safety; Roth’s December downgrade crystallized this view in institutional terms. The second camp does not short the stock, given the quality; they simply wait. StockTwits aggregated sentiment as “extremely bullish” by late May 2026 with message volume up sharply, but that is platform-provided and soft, and it tracks the price recovery rather than leading it.
The most useful divergence is the one between narrative and fundamentals. The crowd largely accepts 47 to 53 times earnings as permanently appropriate for a business growing EPS 10 to 13 percent, a PEG north of four, and that is the gap. The business is not deteriorating; the multiple is pricing an unusually long runway with no hiccups. A second, quieter divergence: disclosed insider transactions in early 2026 skewed toward sales while retail enthusiasm sat near a peak. That kind of skew at a mega-cap is usually consistent with routine diversification and should not be over-read; it is a soft signal, not a predictive one. The tariff class-action story, covered below, has generated both sympathetic and critical coverage; the crowd’s framing of Costco as “tariff-proof” understates the exposure to its merchandise margin.
Durability: quality premium or priced for perfection?
Steel-man the bear first, because the credibility of the whole read depends on it being real. The premium is the position, and the de-rate has arguably already started: the stock underperformed the S&P by 26 points over a year, trades below its 200-day, and met a strong May quarter with a price drop, the classic tell that good news is in the price. The “annuity” framing only cleanly covers about 51 percent of operating income; the other half is a 1.86-percent-margin, cyclical, tariff-exposed retail engine being valued at the same software-like multiple. And that retail half is now in a tariff trap. Roughly one-third of US merchandise sales are imported, and under half of that comes from China, Mexico, or Canada, so the tariff-exposed slice is on the order of 15 to 17 percent of US net sales. The 14 percent markup cap forbids the easy pass-through a normal retailer would use, and CEO Ron Vachris has pledged to absorb or refund tariff-driven increases rather than retain margin. As an illustrative sensitivity, a sustained 150-basis-point cost shock on about 16 percent of $270 billion of net sales is roughly $650 million pre-tax, around 5 to 6 percent of operating income, landing directly on a margin that is only 1.86 percent thick. Absorb that and the “two independent profit levers” story quietly becomes a one-lever story again, precisely when the bull is paying up for two.
Now the bull case, just as seriously. The renewal rate is unmatched in retail and has held through a fee increase, a pandemic, and prior recessions; the fee stream genuinely is annuity-like for the half of profit it represents. Kirkland at $90 billion is a brand asset no rival can replicate quickly. The SG&A ratio at 9.25 percent is a structural cost advantage a scaled attacker would take a decade to match. The balance sheet is net cash with $7.8 billion of free cash flow, and management has a multi-decade record of disciplined expansion with no missteps on location quality. The next fee increase is a near-certain, datable step-up. None of that is in dispute.
The synthesis is uncomfortable precisely because both sides are right. This is a wonderful business, and it is expensively priced, and those two facts do not cancel. The deciding variable is not whether Costco executes; it almost certainly will. It is what multiple the market assigns to that execution. If merchandise contribution proves more durable than the bear fears and the premium holds, the compounding wins. If tariff absorption grinds the merchandise half down and the multiple reverts toward its own median, a flawless operating decade can still be flat. The thing to watch is the merchandise gross margin line and the adjusted comp, not the gas-flattered headline.
The scenarios in detail
Four variables decide the next five years, and the scenarios below are just different settings of them. First and dominant, the valuation multiple: at 43.5 times forward against a 37.6-times median, a reversion toward the median is 12 to 15 percent of price on its own, independent of earnings. Second, EPS growth, which is fee compounding plus the thin merchandise contribution; the base path is about 10 to 11 percent a year off roughly $20.50 in FY2026 toward about $33 by FY2031. Third, renewal durability and member and Executive-tier growth, the annuity’s spine, with China renewal the unproven edge. Fourth, tariff cost pass-through and the reinvestment runway. The EPS path used throughout: about $21.70 next-twelve-months, $22.50 at one year, $27 at three years, $33 at five years (with the bull reaching about $35). In every bear cell below, EPS still grows. The loss comes from multiple normalization, not an earnings miss.
| Horizon | Bear | Base | Bull | What governs this window |
|---|---|---|---|---|
| Today | $943.97 | $943.97 | $943.97 | reference price, point-in-time |
| 6 months | $855 | $955 | $1,030 | holiday comps, monthly prints, rate path; beat-and-fall risk |
| 1 year | $795 | $975 | $1,085 | the de-rate question: 43.5x holding versus reverting toward 38x |
| 3 years | $830 | $1,030 | $1,235 | the 2029-2030 fee increase, Executive upgrades, multiple normalization |
| 5 years | $955 | $1,190 | $1,470 | warehouse and China runway, fee durability, where the multiple settles |
Bull, the sustained premium compounder (about $1,470 at five years). Fee income compounds at low double digits, the 2029-2030 fee increase adds $400 million to $500 million of operating income, Executive upgrades and international maturation (including China moving toward roughly 90 percent renewal) lift EPS growth into the mid-teens to about $35 by FY2031, and the multiple holds a premium around 42 times on a proven, recurring, low-beta annuity. Illustrative math: about 42 times $35. What has to be true: renewal stays above 90 percent through the next hike, tariff absorption stays a one-time rather than structural headwind, and China optionality begins to prove out. What most likely breaks it: the multiple compresses anyway, because a 2.1 percent earnings yield cannot hold against a 4.4-to-4.6 percent 10-year. The business is right and the stock still de-rates.
Base, a fine business giving back some multiple (about $1,190 at five years). EPS compounds about 10 to 11 percent (fee growth plus a modest merchandise contribution flexed slightly for tariff drag), renewal holds near 92 percent in the US and Canada, and the multiple normalizes gradually from 43.5 times toward the 36-to-38 times zone, above the 10-year median but below the recent average. The path runs roughly $22.50 at one year, $27 at three years, $33 at five years, valued near 36 times at the end for about $1,190, a mid-single-digit annual total return with the dividend. What has to be true: clean execution and a gradual, not abrupt, de-rate. What breaks it either way: the pace of the multiple move.
Bear, the priced-for-perfection de-rate (about $955 at five years, near-flat). EPS still compounds about 10 to 11 percent, with no operational disaster, but the multiple reverts toward and through the median: about 36 times at one year (near $795, close to Roth’s $769 Sell), about 31 times at three years (near $830), about 29 times at five years (near $955, dead money). Tariff absorption shaves a few points off merchandise contribution, China renewal stays sub-70 percent, and the China-optionality premium is questioned. The hard tail, low probability but worth showing, is a recession plus FX plus a China impairment that pushes EPS flat to down toward $19 at 24 to 26 times, implying roughly $460 to $490, about -50 percent. What has to be true for the bear: the Fed does not cut or even hikes, every beat is met with a flat-to-down stock (already observed on May 28), and the international premium gets questioned, none of which requires the business to stumble. What breaks the bear: a faster-than-cadence fee increase or a visible China renewal inflection that re-legitimizes the premium.
The near-term catalyst calendar: monthly comparable-sales 8-Ks mid-month (watch the adjusted, ex-gas comp, not the headline), Q4 FY2026 results in late September or October, the Q1 FY2027 holiday print in December, any special-dividend signal given the cash build, the pending tariff class-action docket (outcome unknown), and each FOMC decision. The multi-year inflections: the 2029-2030 fee increase, China’s move from 7 toward perhaps 15 to 20 warehouses and whether renewal climbs off the reported 60 to 70 percent, the warehouse cadence toward roughly 1,080 globally by FY2031, and whether retail media reaches materiality. The leading indicators that tell you which scenario is winning, in real time: worldwide renewal (below 88 percent is the thesis-breaker), adjusted comps (holding above 5 percent is base-to-bull, sliding toward 3 percent is bear), the forward P/E against the 38-times median (the de-rate gauge), merchandise gross margin and any commentary on absorbed tariff costs, and the 10-year yield.
Companies to watch (bull / base / bear)
Costco (COST) is the subject. Bull: the premium holds and double-digit fee growth carries the stock. Base: a fine business giving back some multiple, mid-single-digit total return. Bear: priced for perfection, a de-rate already underway, with no short-covering bid to cushion a break. Watch: worldwide renewal below 88 percent and forward P/E reverting toward 38 times.
Walmart (WMT) is the only rival at comparable scale via Sam’s Club. Bull: Sam’s digital momentum and trillion-dollar scale. Base: steady share gains in grocery. Bear: a 42-times multiple on a 4-to-5 percent revenue grower is not the safe-haven value rotation it is sometimes called. Watch: Sam’s renewal and digital comps.
BJ’s (BJ) is the cleanest read on the format’s structural health and the warehouse-club bear anchor. Bull: the cheap pure-play with renewal converging toward Costco. Base: steady East Coast comps. Bear: concentration and a coupon model that keep it at a floor multiple. Watch: tenured renewal rate and any margin convergence with Costco.
Amazon (AMZN), Target (TGT), Kroger (KR), Dollar General (DG), Dollar Tree (DLTR) round out the wallet-share map. Amazon is roughly a wash for Costco; Target and Kroger are the natural rotation destinations if Costco de-rates and investors want cheaper consumer exposure; the two dollar stores are macro-stress gauges, not competitors. Watch: Target’s margin recovery and Kroger’s identical-sales trend as reads on where the consumer basket is moving.
Risk controls
The honest risk paragraph for anyone holding or considering Costco. The dominant risk is valuation, not operations: at about 48 times trailing earnings, a de-rate to 35 times with no earnings miss at all implies roughly a 30 percent drawdown, and that arithmetic is the whole point of the bear case. The business itself carries real but slower-moving risks: a sustained worldwide renewal decline below 88 percent would be a structural warning the model has never given; a persistent tariff cost shock absorbed into a 1.86 percent merchandise margin would erode the merchandise half of profit and increase dependence on the fee stream; a China regulatory or geopolitical event could remove a high-optionality segment, and the China trademark dispute and the member tariff-billing class actions are pending matters with no determined outcome and should be treated as overhang, not as facts about wrongdoing. Costco is deeply liquid and lightly shorted, so access and forced-selling risk are low, but the low short interest also means there is no covering bid to cushion a break. Concentration risk is modest at the company level but real in California (26 percent of US sales) and, on the cost side, in tariff-exposed import categories. The thing that would change this read fastest is the multiple: a reset toward the median makes the same business a Buy, and a renewal break makes it a Sell.
Methodology, sourcing, and data-quality flags
This read was built from six research streams: the SEC filings (the FY2025 10-K, the Q1 and Q3 FY2026 10-Qs, the FY2025 and Q3 FY2026 earnings 8-Ks, the dividend 8-K, and the December 2025 proxy); the unit economics and membership model; the value chain and money flow; the market action and valuation; the macro and consumer backdrop; and a forward outlook. The source hierarchy runs primary (Costco filings and earnings releases) first, then analyst and reputable-vendor data, then trade press, then explicitly labeled estimates. Every load-bearing figure traces to a recorded claim. Of 82 load-bearing claims, 79 verified to primary or analyst tier, with the rest disputed across vendors or hedged below.
A specific correction governs this whole piece. The common framing that “membership fees are nearly all of Costco’s profit” is wrong on FY2025 numbers and is not used here. Fee income was 51.3 percent of operating income and merchandise net of SG&A was 48.7 percent; the 1.86 percent net merchandise margin is the same $5.060 billion contribution expressed on net sales, not a separate or contradictory fact. The premium-multiple case is argued on the roughly 51 percent that is genuinely annuity-like.
The full five-factor read, in plain prose. On valuation, Costco is clearly dear: about 48 times trailing and 43.5 times forward earnings, roughly 28 percent above its 10-year median, 30 to 32 times EV/EBITDA at a 36 percent premium to Walmart and about 125 percent to BJ’s, on a 10-to-13 percent grower, a PEG well north of three, and the stock has already lagged the S&P by about 26 points over the trailing year. This is the dominant negative. On growth, the runway is genuine and durable but not accelerating: double-digit fee growth, about 30 warehouse openings a year, a near-certain 2029-2030 fee increase, and international whitespace, which supports a positive but modest read. On quality, this is close to best-in-class: renewal above 90 percent, near-100-percent incremental fee margin, 13 times inventory turns, about $9.6 billion of net cash, and $7.8 billion of free cash flow, a clear strong positive. On risk, the balance sheet is a fortress, but the long-duration multiple’s rate sensitivity, tariff absorption into a 1.86 percent margin, unproven China renewal, and pending member-billing litigation net to a mild negative. On momentum and sentiment (soft, low weight), the tape is the tell: below the 50- and 200-day, a beat-and-fall reaction, and insider net-selling, partly offset by a still-bullish sell-side and continued institutional accumulation, a slight negative. The overall lean is a Hold: a high-quality business at a price that already discounts the quality. What would move the label up is a multiple reset toward the median on an unchanged business; what would move it down is a renewal break below 88 percent worldwide or a structural, not one-time, tariff hit to merchandise contribution. This is a rules-based research signal, not personalized investment advice.
Data-quality flags:
- The 51/49 fee-versus-merchandise split is the corrected, governing figure (fee income $5.323 billion, 51.3 percent of operating income; merchandise net of SG&A $5.060 billion, 48.7 percent). The “fee is nearly all the profit” and 65 percent framings are inaccurate for FY2025 and are not used.
- China renewal (roughly 60 to 70 percent) is sourced to a single Shenzhen local-government press item, not to Costco, which does not disclose country-level renewal. It is directional and unconfirmed, and China optionality is treated as unproven, not maturing.
- EV/EBITDA is disputed across vendors (about 29.6 to 32.4 times); it is presented as a 30-to-32 times range, not a single figure.
- Beta is disputed (0.63 to 0.87 across vendors and windows) and is presented as a 0.6-to-0.9 range; both readings indicate a stock less volatile than the market.
- Warehouse replication capex is an illustrative order-of-magnitude estimate, not a primary disclosure.
- Retail-media (Costco Velocity) revenue is not disclosed by Costco. Any 5-year figure is an estimate, and the bull EPS case here does not lean on it.
- E-commerce dollar figure: the 10-K discloses roughly 7 percent of net sales (about $18.9 billion); a $19.6 billion figure that circulates is not confirmed in any filing and is not used.
- Litigation: the China trademark dispute (an unaffiliated “Costco Beijing” entity) and the member tariff-billing class actions are pending, attributed, with no asserted outcome or wrongdoing. The class actions are reported by trade and local press, not confirmed from a docket here: a Western District of Washington (Seattle) suit per Seattle Red and Above the Law, and an Illinois suit per the Chicago Sun-Times (April 29, 2026).
- Segment detail: the individual US-versus-Canada operating income split was not separately disclosed and is flagged unverified; the combined US-plus-Canada 84 percent of operating income figure is from the 10-K.
- All prices, market caps, and multiples are point-in-time to June 29, 2026 ($943.97, $418.63 billion market cap) and move fast.
Key sources: Costco FY2025 10-K and Q1/Q3 FY2026 10-Qs; FY2025 and Q3 FY2026 earnings 8-Ks; April 2026 dividend 8-K; December 2025 DEF 14A proxy; May 2026 monthly sales 8-K; stockanalysis.com, GuruFocus, finbox, financecharts.com, and marketbeat.com for market and valuation data; company earnings-call transcripts; BJ’s, Walmart, Target, Kroger, Dollar General, and Dollar Tree earnings releases for peer figures; Roth Capital (via SahmCapital and TipRanks) for the attributed Sell view; Yicai for the China trademark dispute; Seattle Red and Above the Law for the reported Western District of Washington member tariff-billing suit and the Chicago Sun-Times for the reported Illinois suit; and reputable trade press for tariff context, all point-in-time to June 29, 2026.
Prepared June 29, 2026. Figures are point-in-time and will change. This is research and analysis for educational purposes, not investment advice, not a recommendation, and not a solicitation. Costco trades at a premium multiple that can compress sharply on no operational news, and the China trademark dispute and member tariff-billing class actions referenced here are pending matters with no determined outcome. Verify all figures independently and consult a licensed financial adviser before making any decision.