
Research date: June 29, 2026 | OSINT market research on Contemporary Amperex Technology Co., Limited (CATL), traded in the US as the unsponsored OTC ADR CYATY and on its home markets as 300750.SZ in Shenzhen and 3750.HK in Hong Kong. CATL is the world’s largest maker of the batteries inside electric vehicles and grid-scale storage, the company that supplied roughly two of every five EV batteries installed on Earth in 2025, sitting at the exact point where industrial scale, a brutal Chinese price war, and a US-China geopolitical fight over who is allowed to make and own battery technology all collide.
Important disclaimer. This is OSINT-based research and educational analysis, not investment advice. I am not a financial advisor. Nothing here is a recommendation to buy or sell any security, and the scenarios below are illustrative, not price targets. CYATY carries risks that do not apply to an ordinary US stock: it is an unsponsored OTC ADR on a thin trading line (daily dollar volume is small enough that a single institutional order would move the price, and the 52-week low is itself disputed across data vendors); it represents a Chinese A/H-listed company whose US ownership status hinges on a legal distinction that is widely misreported (CATL is on the Pentagon’s Section 1260H list, which is a procurement matter, but is NOT on the OFAC NS-CMIC list, which is the one that would bar US persons from holding it - that could change, and the precedent for what happens if it does is a forced 365-day divestment); every figure is in Chinese yuan translated to dollars at a point-in-time FX rate that moves; and the whole company sits inside a structurally overbuilt industry. Market caps, prices, valuation multiples, and market-share figures are point-in-time (June 29, 2026), press-reported where noted, and move fast. Do your own due diligence, verify the current legal status of the security with qualified counsel, and consult a licensed advisor.
Where this stock could be in 6 months, 1 year, 3 years, and 5 years
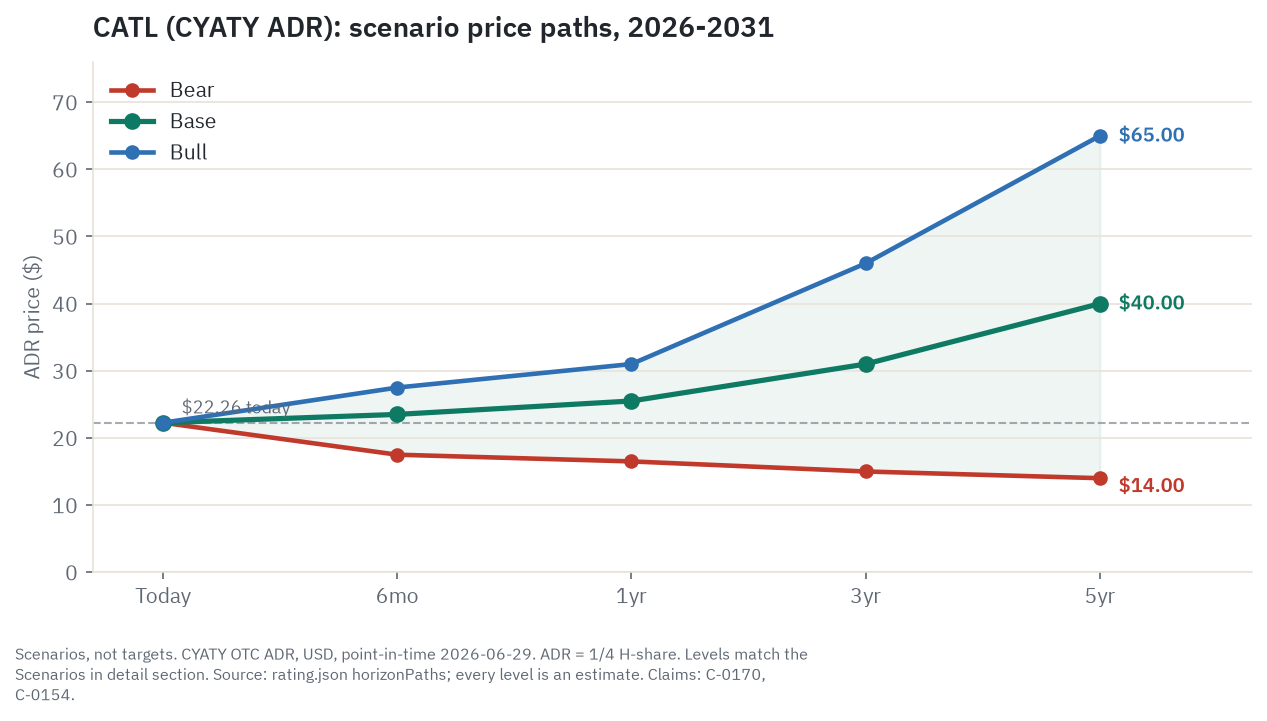
CATL is the rare company where the business and the security tell two different stories, and you have to hold both in your head at once. The business is one of the best industrials on the planet: number one in EV batteries for nine years running, number one in energy storage for five, the lowest-cost producer in the field, sitting on roughly RMB 217 billion of net cash and growing net profit faster than almost any company its size. The security is a thin US ADR on a Chinese champion that a slice of Washington would like to fence off entirely. The price you see is the business marked down to compensate for the security’s risk. Whether that markdown is a bargain or a fair price for a real danger is the entire question. All dollar ranges below are illustrative estimates built from scenario earnings and scenario multiples. None is a price target. CATL traded around $22.26 when this was written (the quote above is current).
6 months (to roughly December 2026). This window is driven by headlines and the cycle, not by fundamentals, because the fundamentals are already strong and slow to change. The datable event is June 30, 2026, one day after this research date, when the Pentagon’s Section 1260H contracting ban legally activates. Western financial press has been pre-positioned on that date for months, and any congressional letter, any movement on the COINS Act, or any signal from OFAC would re-rate the ADR’s tail risk higher overnight. Pulling the other way: the business is firing, with Q1 2026 revenue up about 50 percent and net profit up about 48.5 percent year on year, and a named tier-2 capacity cut would confirm that China’s “anti-involution” campaign against ruinous price competition is starting to bite. The base case lands near $23.50, with the business good but the ADR capped by the China-risk discount and a technically broken home-market share that is down roughly 16 percent from its May peak. The bull case is about $27.50 on a tier-2 exit plus no escalation. The bear case is about $17.50 on an NS-CMIC scare alone, with no actual deterioration in the business required. The single thing most likely to flip the read: an OFAC or congressional NS-CMIC signal pushes it down; a named tier-2 capacity cut pushes it up.
1 year (to roughly mid-2027). The dominant variable shifts to the FY2026 results, due around March 2027, and to one segment in particular. FY2026 should confirm another record profit, but the plus-50-percent comps set a brutal base, and a deceleration to low-teens growth in FY2027 is a setup for the multiple to compress, not expand. The swing factor is energy storage: does its gross margin hold above the mid-20s, and does the slide in cell-level market share stabilize, or do Hithium and EVE price into it the way the price war hit EV cells? The base case is about $25.50, with a record FY2026 confirmed and the multiple steady. The bull case is about $31.00 if storage margins stabilize, the Naxtra sodium battery ramps, a second licensing signal appears, and a firmer yuan helps the translation. The bear case is about $16.50 if storage margin disappoints and deceleration plus a persistent discount cap the ADR even while the A-share grinds higher. Flip signal: the first-half 2027 energy-storage gross-margin line.
3 years (to roughly 2029). Now the structural drivers start to show through. Net profit compounds toward an estimated RMB 105 billion to RMB 115 billion in the base case, but the question that decides everything is power-battery gross margin: does the moat hold the floor around 22 to 24 percent, or does price-war gravity drag it toward 18 to 20 percent? Alongside that sits whether the European plants ramp at a return above their cost of capital against tightening EU local-content rules, and whether customers building their own cells (BYD’s captive supply, Tesla’s 4680, Volkswagen’s PowerCo plus its 26 percent stake in Gotion) erode the share CATL does not have locked. The base case is about $31.00 on steady compounding at a roughly flat multiple. The bull case is about $46.00 if storage scales, licensing royalties become real money, overseas turns accretive, and the discount narrows. The bear case is about $15.00 if the commodity dynamic wins, plants run under-utilized, and the multiple halves, or if an NS-CMIC overhang simply never lifts. Flip signal: the power-battery margin trajectory and whether a real wave of tier-2 capacity exits actually arrives.
5 years (to roughly 2031). Durability decides it, and the two end-states are far apart. The bull terminal state has energy storage approaching half of sales (the company’s own stated aim), the Ford-style licensing model scaling toward USD 1 billion to 2 billion a year of near-pure-margin royalty, sodium chemistry providing a cost floor, overseas fully ramped, and the geopolitical discount reversing, for net profit around RMB 170 billion to 190 billion at a re-rated 26 to 28 times earnings, which maps to about $65.00. The bear terminal state has a China-market-bound volume champion earning commodity margins, fenced out of the US, fighting EU content rules, with a solid-state reset looming and the licensing and sodium hedges underdelivering, for net profit around RMB 90 billion to 100 billion at 10 to 12 times, which maps to about $14.00, and a step lower than that if NS-CMIC actually triggers. The base case is about $40.00, roughly 1.9 times FY2025 profit at a steady 18 to 20 times forward earnings, a 12-to-13 percent compound annual return on the ADR. Flip signal: the storage share-of-sales mix, and any resolution in either direction of the NS-CMIC question.
Where the read lands today. On balance the read holds at Hold. This is a genuinely excellent, fast-growing, cash-rich business wrapped inside a genuinely risky instrument, and the discount on that instrument is doing real work pricing a binary, precedented geopolitical risk rather than handing you a free bargain. The single thing most likely to flip it is the NS-CMIC question: a credible signal that the risk is off the table would let the quality and the cheapness re-assert toward a Buy, while an actual designation would crater the security regardless of how well the company is run.
Companion tool
Jump to the interactive dashboard to sort and filter all 17 peers and customers in this piece, or download the Excel model to flex the scenarios and the rating weights yourself.
TL;DR
CATL makes more EV and storage batteries than anyone, at the lowest cost, and it earns a gross margin around 26 percent while its closest Chinese rivals earn 15 to 17 percent and its Korean rivals lose money or barely break even. FY2025 brought RMB 423.7 billion of revenue (up 17 percent) and RMB 72.2 billion of net profit (up 42 percent), funded by RMB 133.2 billion of operating cash flow and backed by roughly RMB 217 billion of net cash. So why does it trade cheap, at roughly 25 times trailing and 18 times forward earnings versus a 10-year median near 36 times? Because the US instrument is a thin OTC ADR on a Chinese company that Washington is steadily fencing off, and the discount is the market pricing that risk, not missing it. The bull case is that the discount narrows as energy storage becomes a second engine and the licensing model scales. The bear case, and it is real, is an escalation from the Pentagon’s procurement list to the OFAC ownership list, which has a precedent (China Mobile, CNOOC) of forced US-person divestment inside 365 days, a step-function event for a security this thin. That single risk, more than the price war or customer in-housing, is why the read is Hold rather than Buy.
Explore it yourself: the interactive dashboard
Open the dashboard in a full screen
The two stories you have to hold at once
Most stock write-ups have one job: figure out whether the business is good and whether the price is fair. CATL has two, and they do not resolve into one answer.
Think of it like buying a tenant-occupied building in a great location where the deed has a disputed clause. The building is full, the rent rolls in, the tenants have signed long leases, and the construction is the best on the block. That is the business: number one in EV batteries at 39.2 percent global share, number one in grid storage, the lowest cost per kilowatt-hour in the field, and a balance sheet with more net cash than most rivals have in annual revenue. But there is a clause in the deed that says a particular government body could, under certain conditions, force you to sell within a year, possibly into a market with few buyers. That is the instrument: a thin US ADR on a Chinese national champion, where US ownership is currently legal but sits one regulatory decision away from being barred.
The price you pay reflects both. CATL’s home-market A-share is cheap against its own history and against loss-making Korean peers. The US buyer of CYATY does not capture all of that cheapness, because the ADR sits on top of a Hong Kong share that trades at roughly a 50 percent premium to the A-share, plus another 2.6 percent ADR premium on top of that. What is left over, the residual discount, is the market’s payment for the deed clause. The job of this piece is to price both the building and the clause honestly, because if you only look at one you will get the answer badly wrong in one direction or the other.
How the money flows
flowchart TD
    MINE["Upstream Resources\nLi mines (Jianxiawo/Yichun) + Indonesia Ni JV $6B"]
    ERA["Era Resources Group\nRMB 30B mining arm, 100% CATL-owned Apr 2026"]
    MAT["Battery Materials\nCathode LFP/NCM + anode; Brunp + BASF external"]
    BRUNP["Brunp Recycling\n120k t/yr spent batteries; 99.6% Ni/Co recovery"]
    CELL["Cell & Pack Manufacturing\nQilin CTP / Shenxing LFP; 661 GWh sold FY2025"]
    CHINA["China Gigafactories\n~85% of output; FEOC-ineligible for US tax credits"]
    EU["EU Gigafactories\nErfurt 14 GWh + Debrecen 40 GWh + Spain 50 GWh JV"]
    OEM["Automakers\nTesla, BMW, VW, NIO, Li Auto -- RMB 316.5B rev 23.8% GM"]
    ESS["ESS / Utilities\nGrid + datacentre storage -- RMB 62.4B rev 26.7% GM"]
    LRS["US Tech Licensing (Ford/LRS)\n~10% production value; near-100% gross margin"]
    SWAP["Choco-SEB Swap + Charge Net\n1,470 stations built; 4,000 target end-2026"]

    MINE --> ERA
    ERA --> MAT
    BRUNP -->|Recovered cathode precursors| MAT
    MAT --> CELL
    CELL --> CHINA
    CELL --> EU
    CHINA --> OEM
    EU --> OEM
    CHINA --> ESS
    OEM -.->|End-of-life batteries returned| BRUNP
    CELL -.->|IP + process fee royalty| LRS
    CHINA --> SWAP
Follow the money from the top. It starts in the ground, with lithium, nickel, and the other inputs. CATL has spent years pushing upstream into that layer, taking equity in lithium mines, building a 100-percent-owned mining arm (Era Resources, roughly RMB 30 billion), and running a USD 6 billion nickel-to-cathode-to-cell project in Indonesia. The point of owning the dirt is not to be a miner. It is to lock in supply costs below the spot market, reportedly around 10 percent under, so that when raw-material prices swing, CATL’s costs swing less than its rivals’ do.
The middle of the diagram is where CATL actually makes its money, and it is worth seeing the shape clearly. Materials feed into cell and pack manufacturing, where CATL turns out cells under brand names like Qilin and Shenxing. Roughly 85 percent of that output comes from Chinese gigafactories, with a growing slice from European plants in Germany, Hungary, and Spain. From there the product splits into two end-markets that behave very differently: automakers, which bought RMB 316.5 billion of power batteries at a 23.8 percent gross margin, and energy-storage and utility customers, which bought RMB 62.4 billion at a higher 26.7 percent margin. A recycling loop (Brunp) pulls end-of-life batteries back in and feeds recovered materials forward, recovering north of 99 percent of the nickel and cobalt.
The two dotted lines are the interesting part, because they are where CATL is trying to escape the commodity trap. One is the licensing branch: rather than ship cells into the US behind an 82 percent tariff wall, CATL licenses its technology and process to Ford’s US plant and collects a royalty at close to 100 percent gross margin. The other is the swap-and-charge network. Both are attempts to turn a manufacturing business that sells a deflating physical product into a toll business that collects fees on technology and infrastructure. The shape is the investing point. The bulk of the money still flows through the commodity middle, where prices fall every year, and the high-margin toll branches are small, early, and the most exposed to the geopolitical clause in the deed.
A field guide to what CATL actually sells
If you only know CATL as “the battery company,” here is the plain-language map of the business lines and the products that matter, because the mix is where the margin story lives.
Power batteries (the volume engine). This is 74.7 percent of revenue, RMB 316.51 billion in FY2025 at a 23.84 percent gross margin. These are the cells and packs that go into EVs. Most are LFP (lithium iron phosphate), the cheaper, safer, longer-cycle chemistry that now dominates China. The flagship product families are Qilin, a cell-to-pack architecture that crams more energy into the same space (the third generation hits 280 watt-hours per kilogram, enough for 1,000-plus kilometers of range), and Shenxing, the ultra-fast-charge LFP line whose third generation charges from 10 to 98 percent in 6 minutes and 27 seconds. These are not lab curiosities; Shenxing and Qilin are deployed across dozens of car models and are how CATL defends premium pricing in a price war.
Energy storage systems, or ESS (the second engine). This is 14.74 percent of revenue, RMB 62.44 billion, at a higher 26.71 percent margin. These are the big stationary batteries that firm up solar and wind farms and, increasingly, back up AI datacenters. The product here is TENER, including a 9 megawatt-hour stackable unit. ESS is the fastest-growing part of CATL, and the company has told Reuters it wants storage to be roughly half of sales by 2030, up from about a quarter today. Hold that target loosely; it is an ambition, not a forecast.
Battery materials and recycling (the cost moat). This is 5.16 percent of revenue, RMB 21.86 billion, at the highest reported segment margin of 27.27 percent. This is Brunp, the recycling arm, plus cathode and precursor production. It is small in revenue but large in strategic value, because it is the mechanism that keeps CATL’s input costs below the market.
Licensing, services, and new formats (the optionality). The residual roughly RMB 22.89 billion “other” line includes the Ford licensing royalty, the battery-swap network, and emerging platforms like the CIIC skateboard chassis. Margins here are not separately disclosed, but the licensing piece is near-pure profit.
Next-generation chemistry (the tech-lead claim). Worth its own note because the bull case leans on it. Naxtra is CATL’s sodium-ion battery, reaching mass production by late 2026 at 175 watt-hours per kilogram, which finally matches standard LFP at the pack level while using sodium, a material roughly 20 times cheaper than lithium per unit. It holds over 90 percent of its capacity at minus 40 degrees Celsius, a real advantage in cold climates. The catch is that sodium’s cost advantage over LFP shrinks when lithium is cheap, as it is now. Above sodium sits Qilin Condensed, a semi-solid (not true solid-state) cell at 350 watt-hours per kilogram, already used in aviation. And then full solid-state, where CATL targets small-scale trial production around 2027 and mass production around 2030. The honest read on solid-state: that timeline is shared with Toyota, Samsung SDI, and LG, and CATL has no documented lead. The condensed-state product is the real differentiator for the rest of this decade.
Who wins where
Step back from the company names and ask where the durable economics in this chain actually sit. They do not sit with the material suppliers, who sell commodities into an oversupplied market. They do not sit with the automakers, who are fighting their own price war and mostly cannot make competitive cells in-house. They sit with the cell makers who have scale, and among those, overwhelmingly with the one that has the most.
The reason is that LFP chemistry itself is open. Anyone can make a lithium-iron-phosphate cell. What cannot be copied quickly is 15-plus years of accumulated manufacturing process: the defect rates, the formation cycling time, the cell-to-pack integration, the battery-management software, the yield. That is why CATL earns 23 to 24 percent gross margin on power batteries while rivals using the identical chemistry earn 15 to 17 percent. The chemistry is a commodity. The factory is not.
Scale then compounds the lead. At 661 gigawatt-hours shipped, CATL is roughly six times the size of CALB and three times the size of LG Energy Solution. That scale buys procurement at around 10 percent below market, R&D spread across the widest revenue base (RMB 22.1 billion a year, more than most rivals’ entire battery revenue), and the highest plant utilization in the industry (around 86 percent on a shipments basis, against roughly 50 percent industry-wide in China). When LFP cell prices fall to USD 56 a kilowatt-hour, a rival plant running at half utilization is losing money while CATL is still earning a fifth of its revenue as gross profit.
The toll-takers worth watching are the new branches: the Ford licensing model, which collects royalties on US-made cells without owning a US factory, and the swap network, which positions CATL as the energy-management layer rather than the real-estate owner. The commodity fringe is the long tail of subsidized Chinese tier-2 makers who keep producing below cost because provincial governments will not let them fail. The regulatory- and geographic-risk name in this map is CATL itself, because the same scale and state linkage that make it dominant are exactly what Washington points to when it argues for fencing it off.
Company by company: who’s who
This map covers CATL plus 17 peers and customers: nine battery competitors and eight major customers. All market caps and results are point-in-time as of June 29, 2026, and dated to their source filings.
The battery makers (competitors)
BYD (002594.SZ / 1211.HK), about $107 billion. China’s vertically integrated EV-and-battery giant, number two in EV batteries at roughly 17.9 percent share and number one in EV vehicles by units. Its FinDreams arm makes Blade LFP cells, mostly captive (about 79 percent for BYD’s own cars) with growing external sales. FY2025: revenue CNY 804 billion (up 3.5 percent), but net profit fell 19 percent to CNY 32.6 billion as the domestic price war hit margins. Bull: unmatched vertical integration from cell to car to chip, and the fastest-growing overseas EV brand. Bear: BYD’s own aggressive EV pricing is a direct cause of the battery price war, and its cells are mostly captive, so the near-term external threat to CATL is smaller than the headlines suggest.
LG Energy Solution (373220.KS), about $64.5 billion. The number-three EV battery maker at roughly 9 percent share, and the main FEOC-compliant alternative to CATL for US-eligible vehicles. FEOC stands for Foreign Entity of Concern, the US tax-credit rule that disqualifies an EV or storage project from IRA credits if it is tied to a Chinese (or otherwise covered) battery entity, so a Korean-origin supplier like LG is “FEOC-clean” in a way a Chinese one is not. FY2025: revenue KRW 23.7 trillion (down 7.6 percent), but operating profit jumped 134 percent to KRW 1.3 trillion on US IRA production credits. Bull: the scaled, FEOC-clean supplier US and EU OEMs can actually use, with GM joint-venture volume as an anchor. Bear: revenue falling and margins thin even with subsidies, heavy US capex at risk of below-cost-of-capital returns, and IRA restructuring risk.
Panasonic (6752.T), about $66 billion. Tesla’s long-time cylindrical-cell partner and the only meaningful EV-battery production on US soil (Nevada). FY2025 (to March 2025): revenue down about 5 percent, with a one-off battery-defect charge. Bull: the sole at-scale US domestic maker, FEOC-clean Japanese origin, deepening Tesla 4680 work. Bear: dwarfed in capacity by Korean and Chinese rivals, and Tesla’s own in-house 4680 ambitions are an existential threat over three to five years.
Samsung SDI (006400.KS), about $24 billion. Premium NMC and cylindrical supplier (BMW, Rivian, Stellantis), betting on all-solid-state for 2027. FY2025 was ugly: its Energy Solutions segment swung to a KRW 1.85 trillion operating loss, and consolidated gross margin fell from 18.6 percent to 11 percent. Bull: a credible solid-state mass-production target that could leapfrog current chemistry. Bear: a large operating loss now, and a 2027 solid-state timeline that is aspirational with high technology risk. Hold this name in mind for the valuation section; it trades at 32 times EV/EBITDA on near-zero earnings.
SK On (part of SK Innovation, 096770.KS), about $12.5 billion. Ford’s and Hyundai-Kia’s pouch-cell partner, not separately listed. FY2025: SK Innovation’s net loss widened to KRW 5.4 trillion, including a KRW 4.2 trillion write-down tied to the BlueOval SK Ford joint venture. Bull: FEOC-clean Korean cells, Hyundai-Kia captive volume, losses narrowing. Bear: the BlueOval write-down signals the Ford EV-battery joint-venture thesis has stumbled, and the parent’s losses strain its ability to fund capex.
CALB (3931.HK), about $6.5 billion. China’s fifth-largest maker and the fastest-growing tier-2 name. FY2025: revenue RMB 44.4 billion (up 60 percent), net profit RMB 2.1 billion (up 140 percent), and a first-ever appearance in the global monthly top three. Bull: revenue up 60 percent and profit up 140 percent, with first entries into blue-chip OEM supply chains. Bear: revenue is about a tenth of CATL’s, gross margin is 16.7 percent against CATL’s 26 percent, and international qualification is a multi-year grind.
EVE Energy (300014.SZ), about $17.9 billion. A large-cylindrical specialist that won a spot as a BMW Neue Klasse co-supplier alongside CATL. FY2025: revenue CNY 61.5 billion (up 26 percent), net profit CNY 4.1 billion. Bull: the BMW win validates world-class quality, and cylindrical expertise is a differentiated niche. Bear: BMW dual-sources with CATL, EVE’s FY2024 gross margin was 15.14 percent, and it has no FEOC-compliant overseas production.
Gotion High-Tech (002074.SZ), about $8.8 billion. An LFP maker 26 percent owned by Volkswagen, now mass-producing VW’s unified cell. FY2025: revenue RMB 45.07 billion (up 27 percent), net profit RMB 2.38 billion (up 97.5 percent), gross margin 16.17 percent. Bull: a multi-year VW supply contract gives revenue visibility. Bear: a Pentagon FEOC listing disqualifies vehicles using its cells from US credits, margins are far below CATL’s, and it is wholly dependent on VW. Gotion matters to the CATL story twice over: it is both a subsidized competitor and the vehicle through which a major CATL customer (VW) is building its own supply.
Sunwoda (300207.SZ), about $6.8 billion. A consumer-battery specialist (Samsung Electronics is a key customer) building EV exposure. H1 2025 revenue CNY 27 billion (up 13 percent). Bull: a stable consumer-battery anchor and EV growth above 20 percent. Bear: EV-battery scale far too small to threaten CATL, with no technology moat or international OEM qualification.
The customers
Tesla (TSLA), about $1,430 billion. CATL’s single largest customer by estimated revenue, historically around 10 percent (it was 11.6 percent back in 2022, so treat the current figure as a stale estimate). Tesla triple-sources: CATL for LFP, Panasonic for cylindrical, LG for 4680. FY2025 revenue fell about 3 percent. Bull: if Tesla volume reaccelerates, CATL benefits directly as its LFP supplier. Bear: Tesla’s in-house 4680 ramp plus dual-sourcing caps CATL’s ceiling at its biggest account.
BMW (BMW.DE), about $48 billion. CATL’s primary cylindrical partner for the Neue Klasse platform, with EVE as second source. FY2025 revenue EUR 133.5 billion (down 6.3 percent). Bull: Neue Klasse runs through 2030-plus and locks in multi-gigawatt demand, with the Hungary plant satisfying EU content rules. Bear: active dual-sourcing caps CATL’s share, and auto demand is soft.
Mercedes-Benz (MBG.DE), about $50.8 billion. A strategic battery partner targeting 200-plus gigawatt-hours of sourcing and the first and largest customer at CATL’s Hungary plant. Bull: a 200-plus gigawatt-hour volume commitment and premium, higher-value contracts. Bear: Mercedes also sources from LG and SK On, and luxury-EV demand has disappointed.
NIO (NIO / 9866.HK), about $13 billion. CATL’s most concentrated major customer, with about 93 percent of its cells from CATL, a five-year cooperation deal signed January 2026, and a RMB 2.5 billion CATL investment in NIO’s battery-swap arm. FY2025 revenue RMB 87.5 billion (up 33 percent), first quarterly profit in Q4. Bull: NIO’s delivery acceleration flows almost entirely to CATL volume. Bear: NIO’s finances are still fragile, and the 93 percent concentration magnifies any production cut.
Li Auto (LI / 2015.HK), about $13.5 billion. A major CATL customer with a five-year deal and over a million cumulative CATL packs delivered. FY2025 revenue RMB 180.3 billion, narrowly profitable in Q4. Bull: strong delivery growth and demand visibility. Bear: its range-extender vehicles use smaller packs than pure EVs, so kilowatt-hours per car are lower.
Ford (F), about $55 billion. Not a cell customer but the LRS partner. LRS stands for License Royalty Service, the Ford-style model where CATL licenses its technology and know-how for a royalty instead of owning the plant: Ford owns the Michigan LFP plant and uses CATL’s technology and process, paying a fee. This is CATL’s highest-margin US revenue stream. FY2025 revenue $187.3 billion (up 1.2 percent). Bull: near-pure-margin licensing income regardless of FEOC, with scale-up optionality if the model spreads. Bear: congressional scrutiny of CATL engineers on US soil is escalating, and a stricter reading of the One Big Beautiful Bill Act (OBBBA) FEOC clause could end the eligibility.
Volkswagen (VOW3.DE), about $46 billion. A long-term MEB-platform customer, also 26 percent owner of Gotion and builder of its own PowerCo cells. FY2025 revenue EUR 321.9 billion (roughly flat), profit halved on tariffs and China competition. Bull: multi-brand EV demand sustains multi-gigawatt CATL orders. Bear: VW’s own PowerCo and its Gotion stake both cannibalize CATL’s share, and VW’s profit pressure may cut EV capex.
Stellantis (STLA), about $25 billion. CATL’s 50/50 joint-venture partner for a EUR 4.1 billion, 50 gigawatt-hour LFP plant in Spain. FY2025 net revenues EUR 153.5 billion (down 2 percent), with leadership turnover and financial strain. Bull: a dedicated EU-origin manufacturing base across Stellantis brands. Bear: Stellantis is under real financial pressure, putting joint-venture volume commitments at risk.
What the filings say
CATL is not an SEC 10-K filer. The primary sources are its FY2025 Annual Report (released March 10, 2026), the H1 2025 interim report, and the May 2025 Hong Kong IPO prospectus. Everything below is in Chinese yuan, with dollar conversions at 1 USD = 6.7983 RMB (the rate on the research date). The numbers move with FX; read them as point-in-time.
The income statement is the story of a company growing through a price war, not despite it. FY2025 revenue was RMB 423.7 billion (USD 62.3 billion), up 17 percent. Net profit attributable to shareholders was RMB 72.2 billion (USD 10.6 billion), up 42.3 percent. The gap between 17 percent revenue growth and 42 percent profit growth is the whole moat in one line: volume grew 39 percent while average selling prices kept falling, and CATL still expanded its gross margin to 26.27 percent (from 24.44 percent) and its operating margin to 21.13 percent. Net margin landed at 17.04 percent. For context on how unusual that is in this industry, the closest tier-2 Chinese rivals run net margins in the low single digits, and the Korean leaders run around 2 percent.
The multi-year revenue line is worth seeing because it explains the volatility: RMB 130.4 billion in 2021, then RMB 328.6 billion in 2022 (up 152 percent on the lithium-price spike passing through), about RMB 401 billion in 2023, RMB 362.0 billion in 2024 (down on falling cell prices), and RMB 423.7 billion in 2025. This is not a smooth compounder. It is a high-quality business riding a violently cyclical input cost.
The segment mix is where the margin trajectory lives. Power batteries are 74.7 percent of revenue at a 23.84 percent margin. Energy storage is 14.74 percent at a higher 26.71 percent. Materials and recycling is 5.16 percent at 27.27 percent. The pattern matters: the volume engine (EV cells) carries the lowest margin and the most price pressure, while the two faster-growing or higher-value segments carry better margins. The same is true geographically. Overseas revenue (RMB 129.6 billion, 30.6 percent of the total) earns a 31.44 percent gross margin against 24.00 percent at home, so internationalization is itself a margin-accretion story, assuming the overseas plants ramp well.
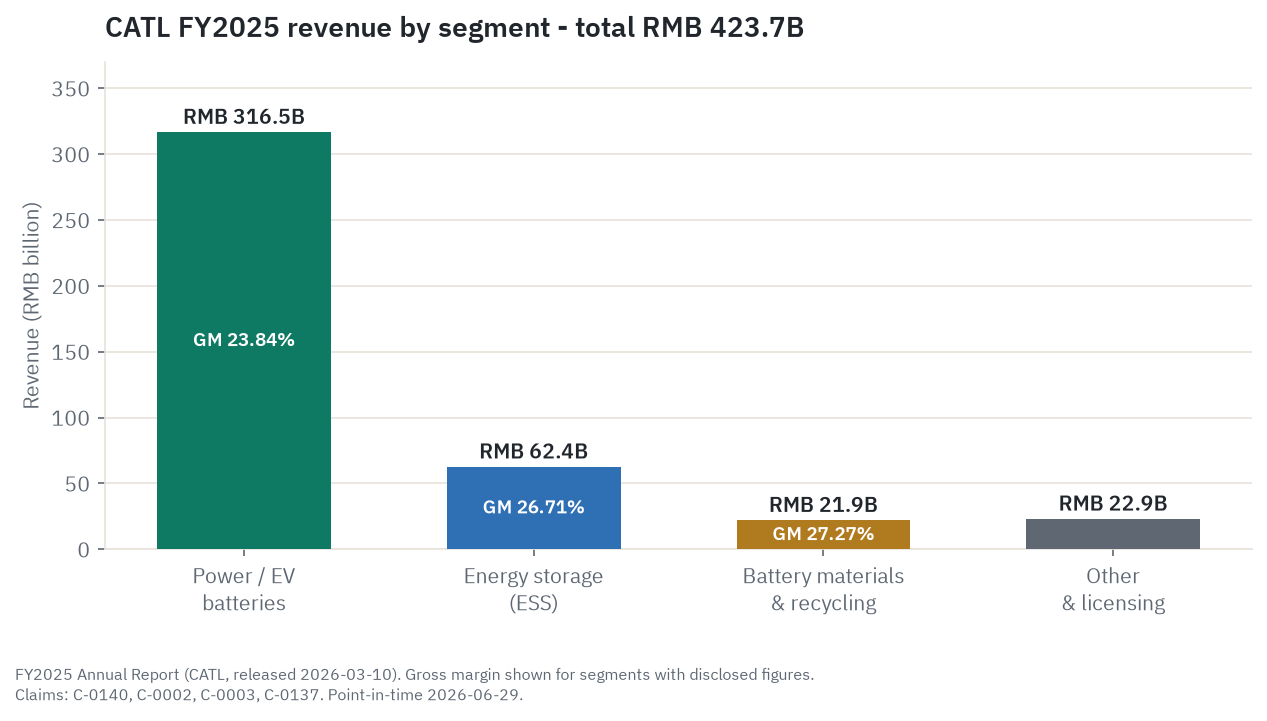
The volume engine (power batteries) is roughly three-quarters of the business, with the two higher-margin lines (storage and materials) still small but growing faster.
Cash flow and the balance sheet are the quiet strength. Operating cash flow was RMB 133.2 billion (USD 19.6 billion), up 37.35 percent. On capital spending, I am going to be straight with you: the FY2025 capex figure is not disclosed in the English-language filing summaries and could not be verified to a primary source, so I am not going to print a number for it or compute free cash flow from a guess. What can be said is that capex is clearly large (321 gigawatt-hours of capacity were under construction, with the Hungary plant funded mainly by IPO proceeds), so the free-cash-flow margin of safety is narrower than the operating-cash-flow figure alone implies. On the balance sheet, cash and equivalents stood at RMB 333.5 billion, equity at RMB 337.1 billion (up 36.5 percent), and the debt-to-asset ratio improved to 61.94 percent from 65.24 percent. Net of total interest-bearing debt, CATL held approximately RMB 217 billion of net cash. That net-cash pile alone is larger than the entire annual revenue of most of its rivals.
Capital returns and the order book. CATL paid a FY2025 dividend of RMB 6.957 per A-share, a total payout of about RMB 31.5 billion, or roughly 43.7 percent of net profit, against a policy target near 50 percent. There is no material buyback. The forward tell sits in contract liabilities, which jumped 77 percent to RMB 49.2 billion at year-end, a sign of a strong forward order book.
The capital structure and the IPO. In May 2025, CATL listed H-shares in Hong Kong (3750.HK), raising about HKD 41 billion (USD 5.24 billion) including the greenshoe, in the largest global IPO of that year. About 90 percent of the proceeds were earmarked for the Hungary plant. The company has two main share classes: roughly 4.4 billion A-shares in Shenzhen and roughly 150 million H-shares in Hong Kong. The US ADR, CYATY, is unsponsored and sits on the H-share line, with each ADR representing one-quarter of one H-share. Hold that ratio; it matters for both the market cap and the valuation.
What management itself flags as risk. CATL issues no formal guidance (standard for a Chinese issuer), but its own disclosed risk factors are not boilerplate. First is the battery price war and ASP compression: H1 2025 power-battery gross margin fell 4.5 points before recovering in the second half. Second is raw-material volatility, the lithium cycle that compressed margins to 11 percent in 2022. Third, and the one this piece spends the most time on, is the geopolitical and regulatory risk: the Pentagon CMC designation and the US FEOC regime. Management’s own framing puts the geopolitical question on the table; the company is not pretending it does not exist.
One last point from the filings on momentum: Q1 2026 (reported April 2026) showed revenue up more than 50 percent and net profit up 48.5 percent year on year. That confirms FY2026 is starting strong, but it also sets the brutal comparison base that makes FY2027 deceleration almost arithmetic.
What the market is paying
This is the section where the two stories collide, so read the mechanics first.
Why the market cap is not what your screen says. CATL trades on three lines: the Shenzhen A-share (300750.SZ, around CNY 392 on June 29), the Hong Kong H-share (3750.HK, around HKD 680 on June 26), and the US ADR (CYATY, $22.26). The correct whole-company market cap, computed from the A-share price across all shares, is approximately USD 268 billion. You will see a much larger figure (around USD 419.7 billion) on at least one major data site; that figure appears to apply the higher H-share-implied price to all 4.55 billion shares and overstates the company by more than half. Use the roughly USD 268 billion number. The discrepancy is not a rounding quibble; it changes whether the stock looks expensive or cheap.
The ADR ratio compounds the confusion. Dividing the market cap by the ADR price gives about 12 billion “ADR-equivalent units,” which is not the legal share count (that is about 4.55 billion, almost all A-shares). And the prices on the three lines are not interchangeable: the H-share trades at roughly a 50 percent premium to the A-share, because only about 150 million H-shares exist against 4.4 billion A-shares, so Hong Kong scarcity plus post-IPO demand created a structural premium. The CYATY ADR then trades about 2.6 percent above its underlying H-share, which is normal for a thin OTC line. Net effect: the US buyer pays the A-share’s cheapness plus the H-share premium plus the ADR premium, so CYATY is not as cheap as the A-share screen suggests.
Performance and relative strength. The A-share returned about 51.6 percent in 2025 and is up roughly 50 to 57 percent over the trailing year, well ahead of the broad China market. The H-share is up about 130 percent since its May 2025 debut, far outpacing the Hang Seng. CYATY itself is up about 69 percent over the trailing year. But the recent tape is weaker: the A-share is down 16.3 percent from its May 7, 2026 all-time high, sits below both its 50-day and 200-day moving averages, and carries a neutral RSI near 49. This is a strong trailing trend wrapped around a soft recent one. The five-year US-market beta of 0.40 is misleadingly calm; the real risk profile is the annual-return history, which includes drops of 37 percent (2022) and 26 percent (2023). This is not a low-volatility stock.
The multiples, in context. Here is the discount, quantified. On the FY2025 basis (USD 268 billion market cap against USD 10.6 billion of net profit), CATL trades around 25 times earnings, with a trailing P/E near 22.4 times on the home line and a forward P/E around 18 times. Against its own 10-year median P/E of about 36 times, that is a 38 percent discount. On EV/EBITDA, CATL is at 15.0 times.
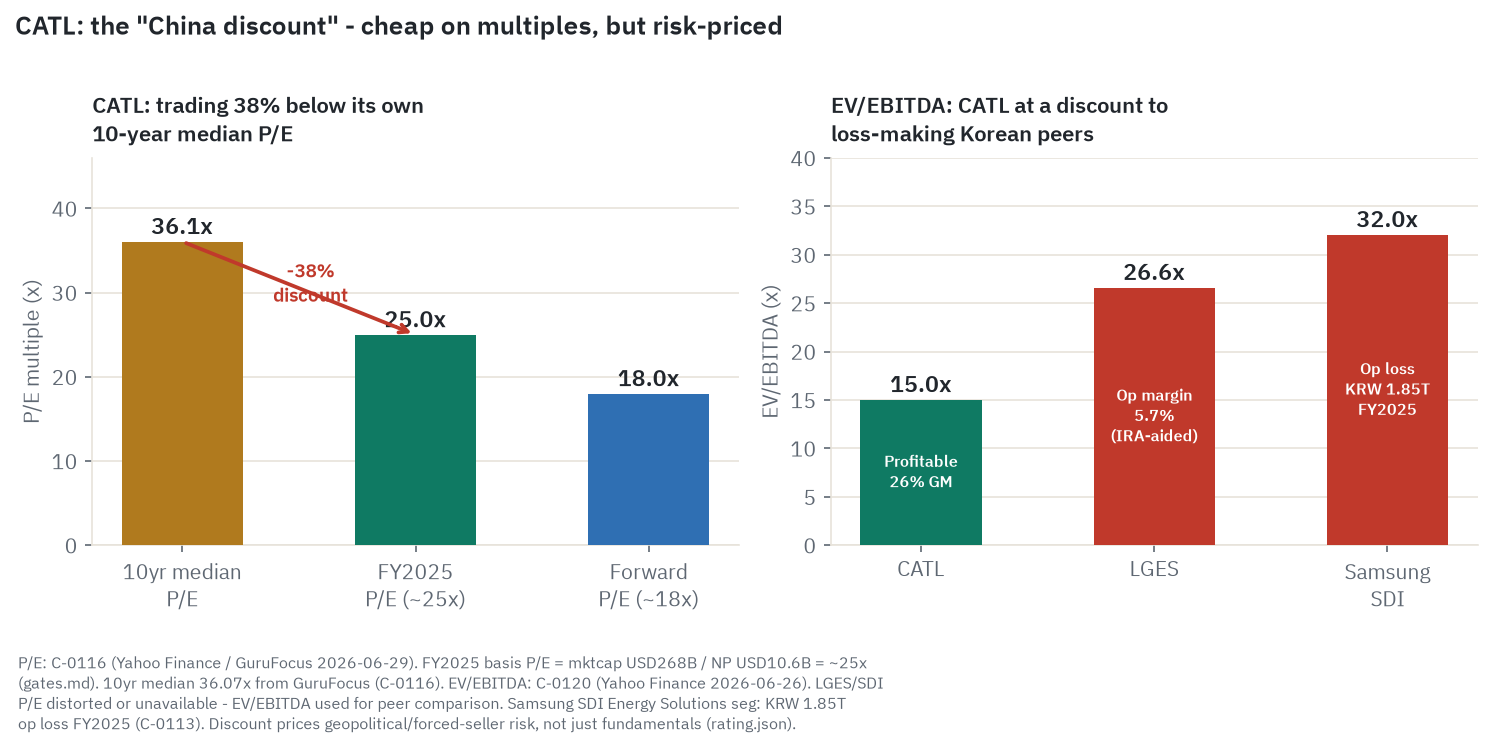
Now look at the peers, because this is the part that should make you sit up. LG Energy Solution trades at 26.6 times EV/EBITDA while losing money. Samsung SDI trades at 32.0 times on a KRW 1.85 trillion operating loss. CATL, the most profitable large-scale battery maker in the world, trades at 15.0 times. Normally the more profitable company commands the higher multiple. Here it is the reverse, and the gap is the China discount in its purest form: investors are pricing CATL’s earnings as less reliable or less accessible than its loss-making rivals’, not because the earnings are worse, but because the ownership is encumbered.
The discount is genuinely two-sided, though, and I do not want to oversell it as free money. The Korean peers’ multiples are flattered by near-zero EBITDA, so the comparison overstates how cheap CATL is on a like-for-like basis. And the ADR holder, as covered above, gives back a chunk of the A-share’s cheapness to the H-share and ADR premiums. So the right read is not “CATL is unambiguously cheap.” It is “CATL is cheap against its own history and against the only large peers it has, but the residual discount is the market charging you for a real risk, and on the instrument you actually buy, it is closer to fair than the screen suggests.”
Liquidity and the sell-side. The A-share is highly liquid (around USD 2 billion of daily turnover). The CYATY ADR is not: daily dollar volume is disputed across vendors but thin on every reading, small enough that the security is effectively inaccessible to institutional size and prone to wide spreads. Use limit orders, or access the H-share directly through a broker with Hong Kong access. On the sell-side, the A-share consensus is lopsided: 27 Buy, 0 Hold, 1 Sell, with a mean 12-month target around CNY 560, implying roughly 43 percent upside. Treat that with care. The coverage is heavily weighted to Chinese and Asian brokers covering a national champion, so the 27-to-1 ratio reflects coverage-selection bias more than a pristine bull case. One useful contrary data point: a major Western institution, Morgan Stanley, raised its H-share stake to 5.26 percent in June 2026, which is a real-money accumulation signal rather than a sell-side opinion.
What the crowd is saying
Sentiment here is unusually soft data, so treat all of it as signal, not fact, and notice where the crowd’s story diverges from what the filings and the tape actually show.
The dominant Western narrative is geopolitical and warning-toned. Virtually all US and European financial-media coverage of CATL runs through the Pentagon’s January 2025 Section 1260H designation. Three threads recur: whether the Ford Michigan plant, with CATL engineers on site, is consistent with US national security; whether the OBBBA’s FEOC provisions will gut the economics of CATL’s US licensing; and whether the Pentagon listing is a precursor to a harder OFAC investment ban. The brief window of neutral-to-positive coverage around the May 2025 IPO has closed. The current Western tone is cautious-to-negative, anchored on the June 30, 2026 activation date.
The Chinese and Hong Kong narrative is the mirror image. There CATL is the national champion executing a textbook globalization play: record profits, ninth straight year as world number one, a landmark IPO. The Pentagon designation is framed as politically motivated. And the price war is covered analytically, with the observation that CATL’s margins actually expanded during the LFP price collapse because it passed through raw-material cost cuts faster than rivals could.
US retail interest is thin and curious rather than loud. CYATY is not a meme stock. The most common retail question is literally “how do I even buy CATL,” and the proliferation of “how to buy CATL” explainer articles is a soft tell that curiosity exceeds participation: interest is rising, but the ADR structure, OTC-only listing, wide spreads, and geopolitical fog suppress actual buying. No coordinated promotion or pump pattern was found in this pass, though the thin float leaves the security structurally vulnerable to thin-volume noise.
The useful part is the divergence, and it runs both ways. The Western retail story treats CATL as a restricted, politically toxic stock where the geopolitical ceiling is the binding constraint. The fundamentals say otherwise: record revenue, record profit, record volume, rising share, an IPO that cleared at 15-times oversubscription with global institutions participating. The company is not in distress. But the Chinese framing has its own blind spot, treating the geopolitical risk as already navigated past. It is not resolved; it is deferred. The Pentagon contracting ban activated June 30, 2026. The OBBBA FEOC provision is now law and directly impairs the Ford licensing stream’s tax-credit eligibility. The NS-CMIC investment ban has not happened, but the policy pressure is directionally escalating. Both crowds are half right and half talking their book. The truth is a strong company carrying an unresolved, compounding regulatory overhang.
One hygiene flag worth stating plainly: a lot of retail-facing coverage conflates the Section 1260H list (a procurement and identification matter) with the OFAC NS-CMIC list (the actual investment prohibition). That conflation could mislead a US reader into thinking CYATY is already off-limits. As of the research date, it is not. The next section is where that distinction earns its keep.
Durability: the structural case, the cyclical bear, and the geopolitical wildcard
Pull the macro and micro together and you get three layers: a structural demand case that is genuinely strong, a cyclical margin risk that is genuinely live, and a geopolitical risk that sits outside both and cannot be hedged by being a good company.
The structural case is real. CATL sits on two demand streams driven by different customers and different budgets. EV demand hit 20.7 million units globally in 2025, more than a quarter of all new cars, and even the conservative IEA scenario has battery demand rising from 1.2 terawatt-hours in 2025 to about 3 terawatt-hours by 2030. China, where EV penetration is already near half of new sales, is roughly 60 percent of global battery demand, and that is the core of the thesis. The second stream, energy storage, is growing faster still: global storage cell shipments nearly doubled in 2025 to 612 gigawatt-hours, pulled by solar-plus-storage mandates and, increasingly, by AI datacenters that need 24/7 firmed power. CATL leads both, at 39.2 percent of EV batteries and a leading share of storage. Two structural currents, and both run through this one company.
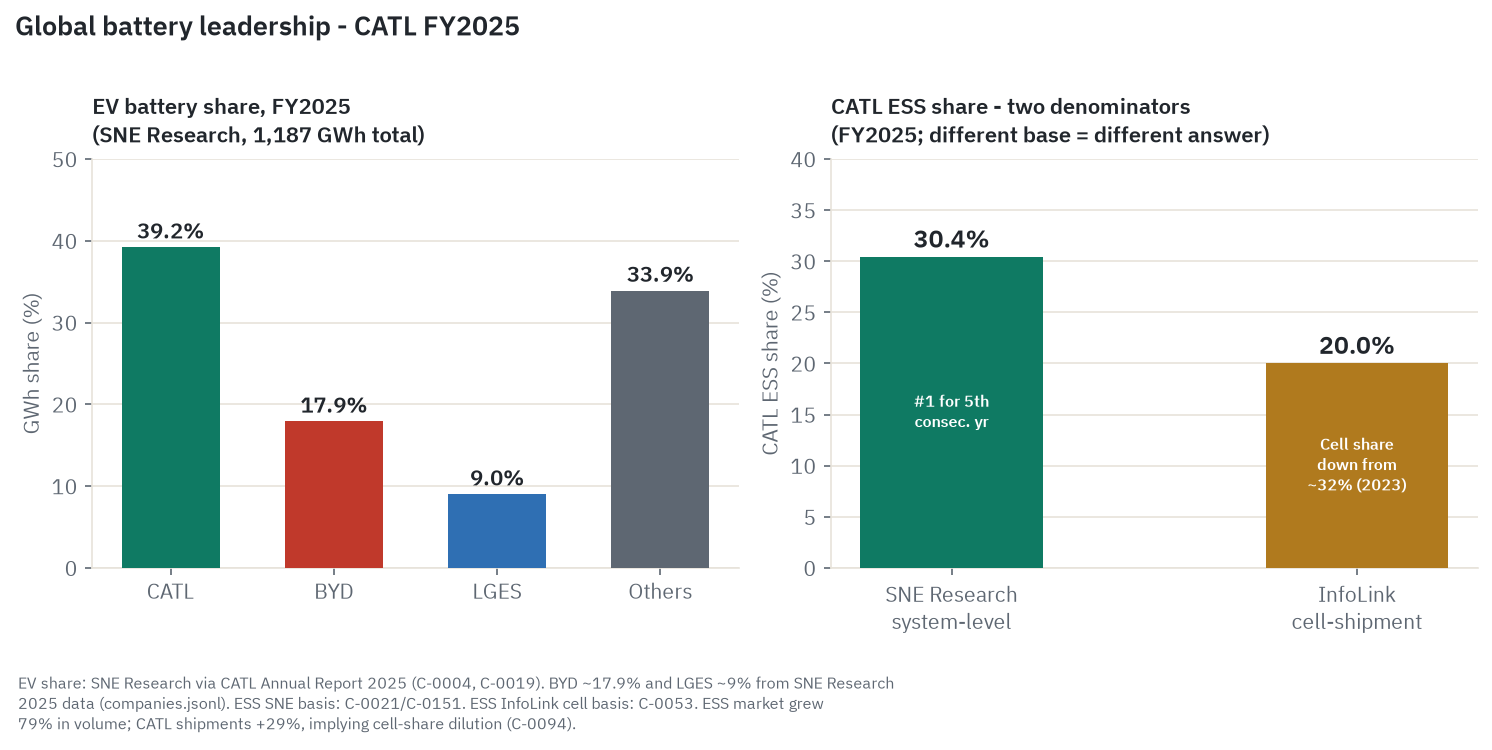
But notice the asterisk on storage, because it is a real crack in the bull case. CATL’s headline 30.4 percent storage share is on SNE Research’s system-level basis. On InfoLink’s cell-shipment basis, its share is closer to 20 percent, down from about 32 percent in 2023. The market grew roughly 79 percent in 2025 while CATL’s storage shipments grew 29 percent, which means it is losing cell-level share even as it leads the category. Storage revenue grew only 9 percent against 29 percent volume growth, the signature of a roughly 15-to-16 percent drop in selling prices per kilowatt-hour. The bull case needs storage to be a durable second engine. The bear case is that storage is just the next segment to commoditize, with Hithium and EVE pricing into the non-China market the way the price war hit EV cells.
The cyclical bear is the price war, and it is not theoretical. Chinese battery capacity is roughly 4,800 gigawatt-hours planned against about 1,000 gigawatt-hours of domestic demand, so industry utilization runs around 50 to 55 percent.
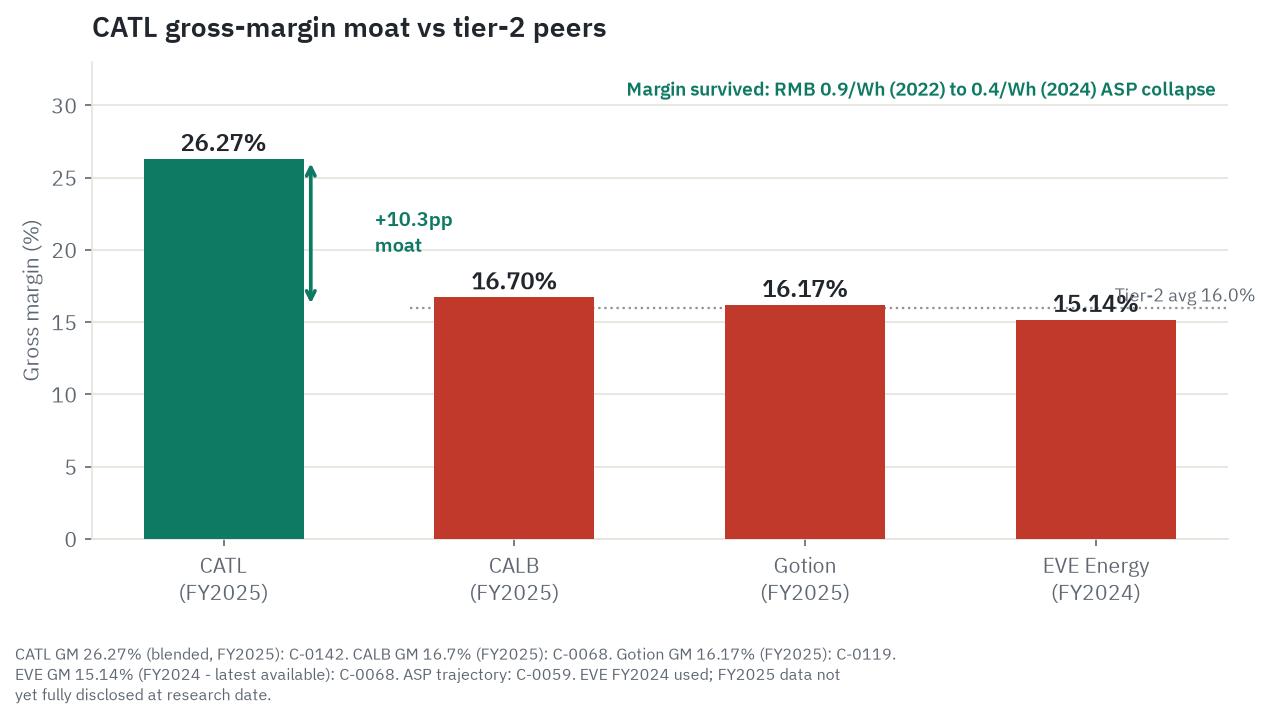
CATL has survived this better than anyone because its costs fall faster than its prices. The chart above is the evidence: blended gross margin of 26.27 percent against CALB at 16.7 percent, Gotion at 16.17 percent, and EVE at about 15 percent, a roughly 10-point gap that held even as cell prices fell more than half from their 2022 peak. The mechanism is the cost moat from the field guide: scale procurement, the highest utilization in the industry, recycled materials, and yield. CATL’s gross-margin floor through the cycle is around 22 to 24 percent, while tier-2 rivals hit breakeven at the same trough. The risk is not that CATL loses the price war. It is that the war grinds on, dragging even CATL’s power-battery margin from 23.84 percent toward 18 to 20 percent, because provincial governments keep subsidized tier-2 plants alive rather than letting them fail. China’s January 2026 “anti-involution” intervention, summoning the top makers to stop the ruinous pricing, is the swing factor: if it produces real capacity discipline, margins recover and CATL is the consolidation winner; if it is just jawboning, the gravity continues.
The geopolitical wildcard is the one that cannot be hedged, and it deserves precision because almost everyone gets it wrong. There are two separate US lists, and conflating them is the single most common error in CATL coverage.
The first is the Pentagon’s Section 1260H “Chinese Military Company” list. CATL has been on it since January 7, 2025. It is a procurement and identification instrument. It bars the Department of Defense from contracting with CATL (effective June 30, 2026, one day after this research date) and from buying CATL batteries (effective October 1, 2027). It creates reputational and political pressure. What it does NOT do is prohibit US persons from owning the stock. For its part, CATL publicly rejects the designation, has said it has never engaged in any military-related activities, and has called the listing a “mistake” and a “false designation,” so the label is contested rather than an established finding of wrongdoing.
The second is the OFAC NS-CMIC list (the Non-SDN Chinese Military-Industrial Complex list, under Executive Order 14032). That is the list that actually bars US persons from buying or holding a company’s securities, ADRs included. As of June 29, 2026, CATL is NOT on the NS-CMIC list, and US persons may legally own CYATY. This is confirmed by the structure of OFAC’s own publicly searchable list and by multiple law-firm compliance alerts. This is the load-bearing fact for any US holder.
The risk, then, is not the status quo. It is escalation from the first list to the second. That escalation is being pushed legislatively (the COINS Act), and it has a precedent that is the reason this risk caps the rating: when China Mobile and CNOOC were added to the equivalent restriction, the result was delisting and a forced 365-day window for US persons to divest. For a deeply liquid stock that is an orderly exit. For a thin OTC ADR like CYATY, a forced 365-day unwind is a structural air-pocket with few buyers on the other side. This is why the bear path in the lede models an orderly widening of the discount, and why an actual NS-CMIC designation would be a step-function below even that bear level, an outcome no single price can capture. I am framing this strictly as a risk with a precedent, not as a prediction. Nothing in the public record says it will happen. But it is the one factor that scale, cash, margin, and technology cannot offset, because it threatens the security itself rather than the earnings.
There is also a related but narrower commercial restriction worth separating out. The OBBBA, signed July 4, 2025, names CATL as a prohibited foreign entity for the purpose of US tax credits. That blocks vehicles and storage projects using CATL-licensed technology from claiming the credits if licensing fees cross a threshold, which is a tax issue for CATL’s customers and a constraint on the Ford licensing model, not a ban on owning the stock. The Ford deal itself is structured to be grandfathered, with Ford owning the plant and CATL holding no equity, but a stricter future reading of the “control” language is the live threat to that royalty stream.
The most likely outcome is a split, not a clean call. Demand stays structurally up through 2030. Power-battery margins compress mildly before recovering as overcapacity is absorbed. Storage holds better than EV cells but commoditizes gradually. The US market stays substantially closed, already priced in, with the open question being whether it deteriorates further or stabilizes. And the discount narrows only if the geopolitical risk de-escalates or major Western indices meaningfully include the name. That split is exactly why the read is Hold.
The scenarios in detail
Five variables decide the next five years. Every scenario below is just a different setting of these five dials.
- NS-CMIC escalation (binary, instrument-level, the dominant swing). Covered above: CATL is on the 1260H procurement list but not the OFAC ownership list. Escalation from one to the other is binary and precedented, and it threatens the security, not just the earnings. This is the dial that matters most.
- China overcapacity and price-war margin gravity. Roughly 4,800 gigawatt-hours of planned capacity against about 1,000 of demand. Whether the anti-involution campaign produces real tier-2 capacity discipline, or just talk, sets power-battery margins anywhere from a stable 23 to 24 percent down toward 18 to 20 percent.
- Storage as a second engine versus storage cell-share erosion. Storage margin sits above EV cells and the market is doubling, but CATL is losing cell-level share. Whether storage is a margin-accretive growth engine or the next thing to commoditize is worth several hundred basis points of blended margin by 2027 to 2028.
- Overseas plants plus licensing (the FEOC workaround). Germany operating and profitable, Hungary ramping with 40 gigawatt-hours fully booked, Spain under construction, Indonesia integrated. Overseas margin is 31.44 percent against 24.00 percent at home. The Ford licensing model (reportedly a roughly 10 percent royalty, an industry estimate, never confirmed contractually) is the capital-light US hedge. The gate is EU local-content tightening and the OBBBA “control” trigger.
- The China/ADR discount (re-rates either way). About 25 times trailing and 18 times forward, 38 percent below the 10-year median, but the ADR holder pays the H-share and ADR premiums on top. Whether that residual discount narrows or widens is the single biggest multiple lever on the price.
Every forward number below is an illustrative estimate, not a forecast and not a price target. The dollar ranges match the lede chart exactly.
Bull case
Assumptions. Revenue compounds about 15 to 16 percent a year. Storage reaches 40 to 50 percent of sales. Power-battery margin holds around 23 to 24 percent as anti-involution forces tier-2 exits. Storage margin holds 25 to 27 percent. Net profit reaches roughly RMB 170 billion to 190 billion by 2030. Licensing scales to USD 1 billion to 2 billion a year of near-pure-margin royalty. The yuan firms modestly toward 6.5. And, critically, the NS-CMIC risk recedes, so the discount narrows and the multiple re-rates from about 18 times toward 26 to 28 times.
Trajectory and valuation. Earnings roughly 2.5 times over five years, with multiple expansion adding the rest: about $27.50 at six months, $31.00 at one year, $46.00 at three years, $65.00 at five years. The illustrative endpoint is roughly RMB 180 billion of net profit at about 27 times on a narrowed discount, plus a firmer yuan, mapping to about $65 on the ADR.
What has to be true. Anti-involution produces real capacity discipline, storage cell-share stabilizes and stays margin-accretive, overseas plants earn above their cost of capital, the licensing model survives FEOC and spreads beyond Ford, and the NS-CMIC question resolves benignly or fades. What breaks it: an OFAC NS-CMIC designation, which voids the re-rate and the entire US-investability premise in one headline.
Base case
Assumptions. Revenue compounds about 12 to 13 percent. Power-battery margin drifts to 20 to 22 percent through 2027, then stabilizes. Storage margin holds 24 to 27 percent while cell share stays soft. Net profit reaches roughly RMB 135 billion to 145 billion by 2030. Overseas is marginally-to-modestly accretive. FX is broadly stable around 6.75 to 6.85. And the multiple holds around 18 to 20 times forward, so the discount neither narrows nor widens.
Trajectory and valuation. Earnings about 1.9 times over five years at a flat multiple: about $23.50 at six months, $25.50 at one year, $31.00 at three years, $40.00 at five years, roughly a 12.5 percent compound return on the ADR. The illustrative endpoint is about RMB 140 billion of net profit at 19 times with flat FX, mapping to about $40.
What has to be true. No NS-CMIC escalation, the price war compresses but does not break margins, storage commoditizes only gradually, and Europe executes adequately. The business compounds, and the discount stays put. What breaks it: faster-than-expected storage margin erosion with no tier-2 exits, which pulls the base toward the bear.
Bear case (anchored on the skeptic’s strongest case)
Assumptions. Revenue compounds only 3 to 6 percent. Power-battery margin compresses to 18 to 20 percent and storage margin toward 20 percent as Hithium and EVE price into the global market. Net profit stagnates around RMB 90 billion to 100 billion. Share is ceded to subsidized tier-2 makers that will not exit. Overseas plants run under-utilized against EU content rules. Licensing and sodium underdeliver. The yuan weakens toward 7.3 to 7.5. And the discount widens on NS-CMIC tail risk as the multiple de-rates to 10 to 12 times.
Trajectory and valuation. Earnings flat-to-down while the multiple halves: about $17.50 at six months, $16.50 at one year, $15.00 at three years, $14.00 at five years. The illustrative endpoint is roughly RMB 95 billion of net profit at about 11 times, a weaker yuan, and a widened instrument discount, mapping to about $14. The tail below the tail: an actual NS-CMIC designation forces a 365-day US-person unwind into a thin OTC market, a step-function below $14 that no modeled level captures, because the China Mobile and CNOOC precedent was delisting, not an orderly fade.
What has to be true (the skeptic’s core). First, NS-CMIC escalation, the only risk that threatens the instrument itself. Second, overcapacity that does not self-correct, with tier-2 makers kept alive by provincial backstops. Third, customer in-housing across the top accounts: BYD captive plus merchant, Tesla 4680, Volkswagen PowerCo plus its 26 percent of Gotion. In this case the discount turns out to be correct pricing, not a bargain. What rescues the bull from here: a Pentagon removal from the 1260H list, or a credible signal that NS-CMIC is off the table.
Catalysts and timeline
Near term: June 30, 2026, the 1260H contracting ban activates (the pre-positioned date and the NS-CMIC narrative anchor). Through the second half of 2026, watch for any COINS Act movement, congressional letter, or OFAC signal, and for any IRS notice tightening the OBBBA “control” definition. Also through late 2026, watch for a named tier-2 capacity cut or insolvency (the anti-involution test), the Naxtra sodium mass-production ramp, the first Changan sodium-EV sales, the 4,000-station charge-swap target, and Hungary and Spain production data. March 2027 brings FY2026 results, the plus-50-percent comp test. Multi-year: the DoD battery-purchase ban around October 2027, EU local-content thresholds tightening, solid-state limited production across the peer group in 2027 to 2028, and storage approaching half of sales toward the end of the decade if the company’s aim holds.
Leading indicators a reader can watch
The OFAC NS-CMIC list status for CATL (the single most important, because it determines whether US persons can hold the security at all) and any COINS Act progress. Storage gross margin in the semi-annual reports (above 25 percent says engine; below 22 percent says commoditizing) and the InfoLink storage cell-share trend. Power-battery gross margin (holding 22 to 24 percent versus drifting to 18 to 20). A named tier-2 capacity cut. The lithium carbonate spot price (above roughly CNY 200,000 a tonne signals input-cost pressure; below CNY 120,000 signals continued glut). Hungary and Spain output and utilization. The yuan (toward 6.5 helps the ADR; toward 7.5 hurts). And contract liabilities (RMB 49.2 billion, up 77 percent) as the forward order-book tell.
Companies to watch (bull / base / bear)
CATL (CYATY / 300750.SZ / 3750.HK). The subject. Bull: the discount narrows as storage and licensing scale and the geopolitical risk fades. Base: a high-quality business compounding low-teens with the discount stuck where it is. Bear: margin gravity plus an NS-CMIC overhang that never lifts, with a step-function tail if it triggers. Watch: the OFAC list and the storage margin line.
BYD (002594.SZ / 1211.HK). The most dangerous competitor because it makes the whole car. Bull: vertical integration and overseas growth. Bear: its own EV pricing fuels the war that compresses everyone’s battery margins. Watch: FinDreams external-sales share.
LG Energy Solution (373220.KS). The FEOC-clean alternative. Bull: the supplier the US can actually use at scale. Bear: thin margins even with subsidies, and US capex risk. Watch: utilization and IRA policy.
Samsung SDI (006400.KS). The solid-state bet. Bull: a 2027 leapfrog. Bear: a large operating loss now against a 32-times multiple. Watch: solid-state qualification milestones.
CALB, EVE, Gotion, Sunwoda (the Chinese tier-2s). Collectively the price-war pressure and the in-housing vector (Gotion for VW). Bull (for them): share gains and OEM wins. Bear: margins half of CATL’s, dependent on a small number of customers, first to lose volume in a downturn. Watch: whether any of them cuts capacity (the anti-involution signal).
The customers (Tesla, BMW, Mercedes, NIO, Li Auto, Ford, VW, Stellantis). Each is both demand and risk. Bull: deepening multi-year deals and EU local-content needs that favor CATL’s European plants. Bear: dual-sourcing and in-housing (Tesla 4680, VW PowerCo) cap CATL’s share, and several customers (VW, Stellantis) are financially strained. Watch: Ford’s licensing eligibility under FEOC, and NIO’s 93-percent concentration cutting both ways.
Risk controls
The honest risk paragraph, because the credibility of everything above rests on it. This is a cyclical business riding a violently cyclical input (lithium swung from RMB 500,000 a tonne to RMB 70,000 and back toward the middle), so the earnings line is lumpy and the stock has fallen more than a third in a single year before. It is geographically and politically concentrated, with the US market structurally closed and the single largest swing factor being a binary regulatory decision outside the company’s control. The instrument is a thin OTC ADR: liquidity is poor, spreads can be wide, the 52-week low is disputed across vendors, and an institutional-size order would move the price. There is FX translation risk that a Shenzhen investor does not bear. The valuation looks cheap on the screen but gives back much of that to the H-share and ADR premiums, so the margin of safety is smaller than 18 times forward suggests. And the thing that would change the thesis most is not in the financials at all: it is the OFAC list. A move to NS-CMIC would crater the security regardless of how well CATL executes; a credible signal that the risk is off the table would let the quality and cheapness re-assert. It is a risk a holder has to be sized for rather than one that can be diversified or hedged away, and the current legal status of the security is worth verifying independently before any decision.
Methodology, sourcing, and data-quality flags
This piece draws on seven parallel research streams: the value chain and how money flows through it, the regulatory filings (FY2025 Annual Report, H1 2025 interim, the May 2025 IPO prospectus), the market action and valuation, the OSINT and sentiment signal, the macro and micro economics, and a five-year bull/base/bear outlook. Every load-bearing figure traces to a claim in the ledger with a source and a tier (primary filing, analyst house, reputable trade press, or estimate). The source hierarchy used: company filings first for financials, named analyst houses (SNE Research, InfoLink, BloombergNEF, Goldman Sachs) for market and forecast data, reputable trade press for events, and clearly labeled estimates where no harder source exists.
The full five-factor read, in plain prose.
Valuation nets to fair, not a bargain. On the economic A-share basis CATL screens cheap, around 25 times trailing and 18 times forward, about 38 percent below its 10-year median near 36 times, and at a steep discount to loss-making Korean peers (C-0116, C-0120). But the US instrument is the ADR, which carries the roughly 50 percent H-share premium plus a 2.6 percent ADR premium (C-0101, C-0103), so the CYATY buyer does not capture that headline cheapness. On the instrument it is closer to fair, and the residual discount is compensation for forced-seller and illiquidity risk. The read is fair, not the unambiguous bargain the screen suggests.
Growth is strong. FY2025 revenue rose 17 percent and net profit 42 percent on 661 gigawatt-hours shipped, up 39 percent, with Q1 2026 up about 50 percent and 48.5 percent (C-0137, C-0138, C-0150). The EV-battery market is heading from 1.2 toward roughly 3 terawatt-hours by 2030 and the storage market is doubling, with CATL number one in both (C-0015, C-0019, C-0021, C-0025). The honest caveats, tough FY2026 comps, deceleration ahead, and storage cell-share erosion (C-0053, C-0094), temper but do not negate a clearly above-trend runway.
Quality is best-in-class. Blended gross margin around 26.3 percent, net margin around 17 percent, return on invested capital around 16.5 percent, return on equity around 24 percent, roughly RMB 217 billion of net cash, and RMB 133.2 billion of operating cash flow, all from the lowest-cost producer with an improving balance sheet (C-0142, C-0065, C-0144, C-0145, C-0146). Few industrials anywhere combine this scale, profitability, and cash generation.
Risk is heavy, and it is the offsetting weight. A binary, precedented NS-CMIC forced-seller risk on a thin OTC ADR (C-0049, with the China Mobile and CNOOC precedent and the pending COINS Act), framed strictly as a risk with no asserted outcome; plus overcapacity and price-war margin gravity (4,800 against about 1,000 gigawatt-hours, C-0031); plus customer in-housing across the top accounts; plus FX translation; plus a structurally closed US market. This is genuinely a name where the discount may be correct pricing rather than opportunity.
Momentum is mixed and carries low weight. The home-market share is technically broken, down 16.3 percent from its May 2026 high and below both its 50- and 200-day moving averages, against a strong trailing trend (CYATY up about 69 percent over a year, the H-share up about 130 percent since IPO) and a 27-to-1 Buy sell-side that is China-broker biased, with Morgan Stanley accumulating (C-0112, C-0109, C-0121). Net neutral.
Putting the five together, the read lands at Hold: a high-quality, fast-growing, cash-rich franchise wrapped in an instrument whose discount is doing real work pricing an existential, binary geopolitical risk. This is a labeled, rules-based research signal balanced between the business and the instrument, not a call on the company’s operating excellence and not personalized investment advice. A credible NS-CMIC de-escalation would push the read toward Buy; an actual designation would push it toward Sell regardless of fundamentals.
Data-quality flags:
- Market cap is disputed and the larger figure is wrong. Use approximately USD 268 billion (A-plus-H at their own prices), not the roughly USD 419.7 billion figure on at least one major site, which appears to apply the H-share price to all shares (C-0101). The roughly USD 268 billion figure is consistent across CompaniesMarketCap and StockAnalysis.
- The ADR ratio is one CYATY to one-quarter of one H-share, not the older one-to-0.4-A-share figure that appears in some summaries (C-0095, C-0154). All prices and the market cap in this piece use the corrected structure.
- Capex and free cash flow are not stated. The FY2025 capex figure is not in the English-language filing summaries and could not be verified to a primary source (C-0162), so no capex number and no free-cash-flow figure are printed. Operating cash flow (RMB 133.2 billion) is verified and used; net cash is labeled “approximately RMB 217 billion.”
- Storage market share differs by methodology. 30.4 percent on SNE Research’s system basis versus roughly 20 percent on InfoLink’s cell-shipment basis (C-0021, C-0053). Both are shown, with the explicit note that CATL is losing cell-level share even while leading the category.
- The China discount is two-sided. Cheap against its own history and against Korean peers, but those peers’ multiples are flattered by near-zero EBITDA, and the ADR holder gives back much of the A-share cheapness to the premiums. Not unambiguously cheap.
- The Ford LRS royalty rate (about 10 percent of production value) is a press estimate, reported by industry sources and never confirmed by Ford or CATL (C-0078). All licensing-revenue figures derived from it are illustrative.
- The Tesla revenue-concentration figure (about 10 percent) is a stale 2022-era estimate (it was 11.6 percent in 2022), not a current disclosure.
- CYATY OTC daily volume is disputed across vendors (StockAnalysis, Yahoo, and a web summary give wildly different figures) and the 52-week low is disputed ($11.31 versus $19.41). Treated qualitatively as thin OTC liquidity (C-0129, C-0141).
- The legal-access status is point-in-time. As of June 29, 2026, CATL is on the 1260H list, not on the OFAC NS-CMIC list, and US persons may legally own CYATY (C-0049). Laws change; verify current status before acting.
- The EV/EBITDA of 15.0x and the 10-year median P/E of 36.07x are single-sourced (Yahoo Finance and GuruFocus respectively) and should be cross-checked.
- All forward numbers are estimates, never price targets, and prices and FX are point-in-time (June 29, 2026) and move fast.
Key sources: CATL FY2025 Annual Report (March 10, 2026) and H1 2025 interim report; CATL HKEX IPO prospectus (May 2025); SNE Research and InfoLink (market share); IEA Global EV Outlook 2026 and BloombergNEF (demand and price); Goldman Sachs (lithium forecast); company and OFAC list documentation plus law-firm compliance alerts (1260H versus NS-CMIC); Yahoo Finance, GuruFocus, StockAnalysis, and CompaniesMarketCap (prices and multiples); Investing.com (technicals and consensus); and reputable trade press (CnEVPost, Carnewschina, ESS-News, Electrive, Reuters) for events and product specifications.
Prepared June 29, 2026. Figures are point-in-time and will change. This is research and analysis for educational purposes, not investment advice, not a recommendation, and not a solicitation. CYATY is a thin OTC ADR on a Chinese company whose US ownership status depends on a legal distinction (Section 1260H versus OFAC NS-CMIC) that can change, and an escalation to the NS-CMIC list has a precedent of forced US-person divestment. Verify all figures and the current legal status of the security independently, and consult a licensed financial advisor before making any decision.