
Research date: June 22, 2026 | OSINT market research on Tesla, Inc. (Nasdaq: TSLA), the car-and-energy business you can read in the filings, the robotaxi/Optimus/AI bet that is most of the price, and the five-year outlook. Live prices, stamped hard.
Important disclaimer. This is independent OSINT (open-source intelligence) research compiled for educational and informational purposes only. It is not investment advice, not a recommendation or solicitation to buy, sell, or hold any security, and not a statement that any security is suitable for you. The author is not a financial advisor and has no fiduciary relationship with any reader. The rules-based rating below is a research signal, not a directive. All figures are point-in-time (intraday on June 22, 2026 unless otherwise stamped) and move fast - prices, market caps, multiples, and legal status may be stale by the time you read this. Any bull / base / bear scenarios and the five-year illustrative valuations are analytical framings and arithmetic on stated assumptions, not price targets, predictions, or guarantees. Do your own due diligence and consult a licensed professional before making any financial decision.
Where this stock could be in 6 months, 1 year, 3 years, and 5 years
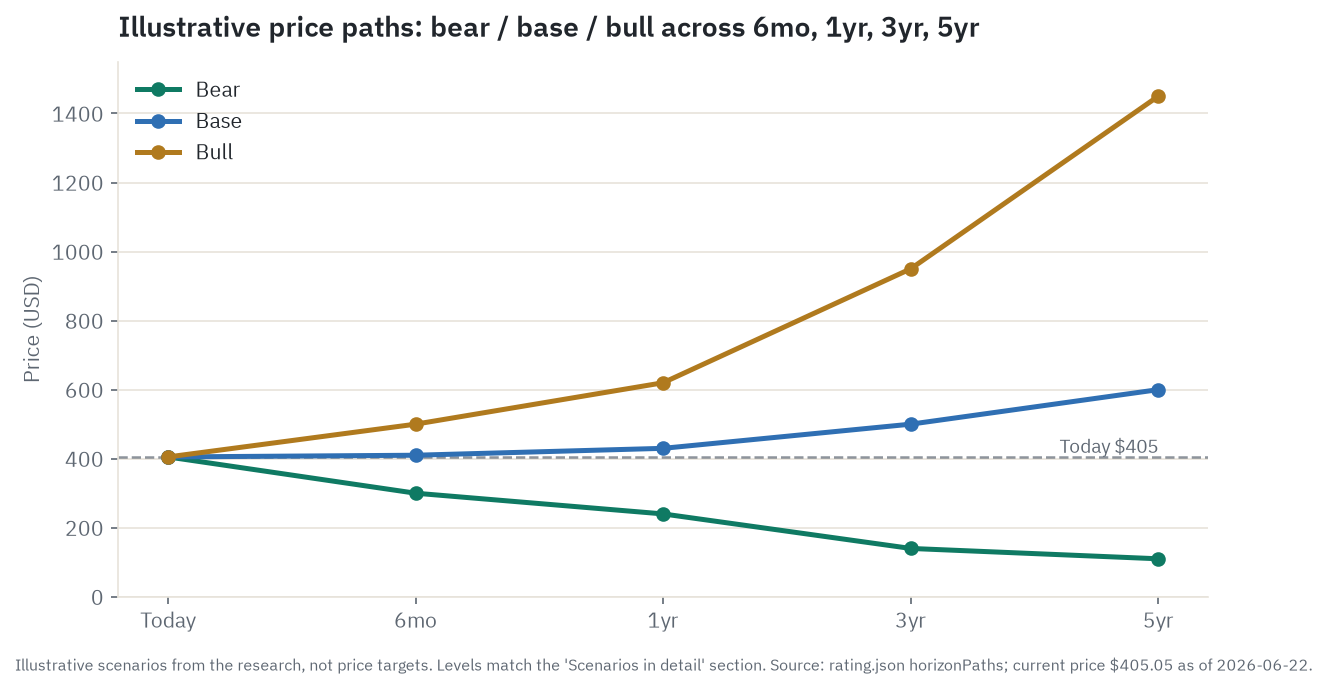
Start with the close: $405.05 on June 22, 2026, for a market cap near $1.52 trillion. Every dollar level below is illustrative arithmetic on stated assumptions, not a price target. The honest center of this whole piece is that almost none of that $405 is explained by the cars and batteries Tesla actually sold last year. The four horizons below are really four readings of one question: do the unproven bets pay off, or does the stock slowly settle back toward what the visible business is worth.
Six months (to late 2026). This window belongs to datable events, not to the long story. The July 22 earnings print, the Q2 and Q3 delivery numbers (Goldman models around 420,000 for Q2 against US deliveries running down mid-teens year to date), the cadence of FSD software updates, robotaxi geofence headlines, and any movement from NHTSA on its open FSD investigation. The base case is roughly flat near $410, because this is a violent stock (a 1.80 beta, implied volatility near 48 percent) that tends to chop around catalysts. Bull is about $500 on a clean delivery beat plus a credible robotaxi-scale signal; bear is about $300 if deliveries disappoint or NHTSA takes an adverse step. The single thing most likely to flip the read here is whether the big FSD rewrite, version 15, is confirmed on schedule or slips again.
One year (to mid-2027). The dominant variable becomes whether that FSD v15 ships and genuinely removes the remote human operator, set against the auto business as its high-margin regulatory-credit cushion finishes rolling off and 2026’s negative free cash flow gets digested. Base is about $430: the bets advance but underwhelm, the multiple grinds lower from today’s roughly 197x while earnings hold, and the stock ends modestly higher. Bull is about $620 if v15 ships and the driverless fleet scales past the dozens without a forced recall. Bear is about $240, a third straight year of “material next year” plus a margin squeeze, with the de-rating accelerating. Flip-trigger: a credible, operator-free robotaxi running at scale in more than one city.
Three years (to roughly 2029). Structure starts to dominate the headlines. Base is about $500, a genuine but modest robotaxi business and Optimus reaching first revenue, on a still-premium but compressed multiple. Bull is about $950 if robotaxi unit economics are proven, with the roughly $30,000 Cybercab undercutting Waymo’s sensor-heavy stack on cost and a real second franchise being capitalized. Bear is about $140, the de-rating largely complete: the bets advanced but never commercialized, and the stock trades close to auto-plus-energy fundamentals plus a shrinking option stub. Flip-trigger: a disclosed robotaxi profit-and-loss showing per-mile profitability with no driver, or the absence of it.
Five years (to roughly 2031). Pure structure: do the bets become durable franchises, or does the market stop paying for them. Base is about $600, the core compounding with a real-but-modest autonomy and energy contribution, where earnings rather than the multiple carry the stock. Bull is about $1,450, robotaxi at material scale and Optimus shipping into and beyond Tesla’s own factories - the create-the-market case paying off. Bear is about $110, a re-rating to fundamentals that is roughly a 70 to 75 percent decline from here, consistent with the stock’s documented 76 percent peak-to-trough drawdown history. That bear is a re-rating, not a wipeout: the auto and energy businesses and roughly $35.7 billion of net cash still have real value; the lottery ticket simply expired. Flip-trigger: sustained, audited revenue from robotaxi or Optimus large enough to move a company this size.
Where the read lands today. On balance the read lands at Sell, valuation Overvalued. The reason is not that Tesla is a bad company, because it probably is not. The reason is arithmetic: on any normal automaker framework the car and energy business is worth somewhere around $40 to $71 a share, so roughly 82 to 90 percent of the $405 price is payment for robotaxi, FSD, and Optimus businesses that are pre-revenue or immaterial today, financed by a car business that has now shrunk for two straight years. The single thing most likely to flip that read is a real, driver-out robotaxi business with disclosed positive unit economics. Until that prints, the burden of proof sits with the bull.
Companion tool
Jump to the interactive dashboard to sort and filter every company in the piece, or download the Excel model to flex the auto-multiple-versus-option split yourself.
TL;DR
Tesla is two businesses wearing one stock. The first is a real, now-profitable but contracting carmaker: 1.636 million deliveries in 2025, down 8.6 percent and the second straight annual decline, $94.8 billion of revenue (the first-ever annual revenue drop), automotive gross margin around 15 to 17 percent once you strip out a vanishing regulatory-credit cushion, and an operating margin that has collapsed from 9.2 percent in 2023 to 4.6 percent in 2025. Bolted to it is a genuinely good energy-storage business (around 30 percent gross margin, a $10.15 billion backlog) and a $35.7 billion net-cash balance sheet that funds every bet without forced borrowing. The second business is a bet: robotaxi, the FSD software behind it, and the Optimus humanoid robot. None of the second business is material in the filings yet. Robotaxi is a fleet of fewer than 50 driverless cars against Waymo’s roughly 3,067 and 500,000 paid rides a week; Optimus has zero revenue. Yet at roughly 197x forward earnings, with free cash flow about to turn negative against more than $25 billion of 2026 capex, the market is paying somewhere around 82 to 90 percent of the price for that second business. That is the whole investment question, and the single biggest risk is the calendar: a third straight year in which the bets are “material next year” while the car core decelerates would start a slow de-rating toward what the visible business is actually worth. On balance the read lands at Sell.
All prices, market caps, and valuation multiples below are as of June 22, 2026 unless otherwise stamped. TSLA is a high-beta name where a large slice of the value rests on businesses that do not yet exist as revenue. These figures move fast and may be materially stale by the time you read this. Verify live quotes before acting.
Explore it yourself: the interactive dashboard
Open the dashboard in a full screen
The dashboard holds the seven companies in this piece - Tesla, BYD, GM, Li Auto, NIO, Alphabet (the Waymo parent), and NVIDIA - sortable by market cap and tagged by role, with what each one does, its position, and a bull and bear one-liner. Use it to check any single name as you read.
Prefer a spreadsheet? Download the Excel model with the scored company table and an adjustable scoring tab, so you can flex the auto-multiple-versus-option assumptions yourself. The scenario outputs are illustrative arithmetic, not price targets.
The hook: a carmaker priced as an AI company
Picture a modest house on a quiet street. As a house, on any normal appraisal, it is worth maybe a tenth of its asking price. The reason the asking price is ten times the building is that the seller insists there is oil under the land. Nobody has drilled. There is a geologist’s report and a lot of confidence, but no barrel has come up. If the oil is real, the price is cheap. If it is not, you have massively overpaid for a house.
That is Tesla in one image. The house is the car company and the energy business, and you can walk through every room of it in the filings: the deliveries, the margins, the cash flow. On the numbers a careful appraiser can read, that house is worth roughly $40 to $71 a share. The stock is $405. The other $334 to $365, somewhere between 82 and 90 percent of the price, is the oil: robotaxi, the Full Self-Driving software that would power it, and the Optimus humanoid robot. Drilling has barely started. There are fewer than 50 driverless robotaxis on the road and zero dollars of Optimus revenue. So a holder of this stock is not really betting on whether Tesla is a good company. The bet is narrower and harder: are these specific unproven businesses worth more than a trillion dollars of present value, and is the car business funding them healthy enough to keep paying the drilling bill. Drop the analogy there. The rest of this piece is the appraisal of the house and the honest geology on the oil.
How the money flows
flowchart TD
    EV_BUYERS["Vehicle buyers\n1.636M deliveries in FY2025\n$69.5B auto revenue"]
    UTILITY_BUYERS["Utility/grid storage buyers\n46.7 GWh deployed FY2025\n$12.8B energy revenue"]
    SOFTWARE_BUYERS["Services/software buyers\nSupercharging + FSD subs + insurance\n$12.5B services revenue"]
    REG_CREDITS["Regulatory credit buyers\nStellantis, Toyota, Ford\n$1.99B FY2025 at ~100% margin"]
    FUTURE_AI["Future AI/robotaxi\nCybercab pilot ~42 vehicles\n~$0 revenue today"]

    EV_BUYERS --> TESLA_DIRECT["Tesla direct-sales channel\nno dealer; captures ~8-10pp margin"]
    UTILITY_BUYERS --> TESLA_ENERGY["Tesla Megapack integration\nLathrop + Shanghai factories\n~25-30% normalized gross margin"]
    SOFTWARE_BUYERS --> TESLA_SERVICES["Tesla services platform\nSupercharger toll-taker + FSD sub"]
    REG_CREDITS --> TESLA_CREDITS["Tesla regulatory credit desk\n100% margin; shrinking fast"]
    FUTURE_AI --> TESLA_AI["Tesla FSD + Robotaxi platform\nFSD v15 targeted end-2026"]

    TESLA_DIRECT --> GIGA_MANUFACTURING["Gigafactory auto assembly\nFremont/Shanghai/Berlin/Texas\n2.35M capacity; 70% utilized FY2025"]
    TESLA_ENERGY --> MEGAPACK_ASSEMBLY["Megapack assembly\nLathrop CA + Shanghai\n80 GWh nameplate; Houston 2026"]
    TESLA_SERVICES --> SUPERCHARGER_NET["Supercharger network\n7,753 stations; 73,817 connectors"]
    TESLA_AI --> CORTEX_CLUSTER["Cortex 1+2 NVIDIA cluster\n230k+ H100e GPUs; Giga Texas\nonly training compute after Dojo shutdown"]

    GIGA_MANUFACTURING --> CELL_4680["In-house 4680 cells\nGiga Texas; 15-20 GWh/yr\nNMC chemistry; >95% yield"]
    GIGA_MANUFACTURING --> CELL_EXT["External auto cells\nPanasonic NV JV + CATL + LG\n2170 and LFP for std-range"]
    MEGAPACK_ASSEMBLY --> CELL_LFP["LFP cells for Megapack\nCATL Chinese plants today\n82.4% US tariff blocks path\nLG MI + Samsung IN from 2027"]
    CORTEX_CLUSTER --> NVIDIA_SUPPLY["NVIDIA H100/H200 GPUs\nTSMC Taiwan + Samsung Korea\nSole training supplier 2025-2027"]

    CELL_4680 --> LITHIUM["Lithium + nickel raw materials\nPiedmont/NAL offtake; Albemarle/SQM\nChinese refining 60%+ of supply"]
    CELL_EXT --> CATL_NODE["CATL ~38% global battery share\nalso competes via EnerC storage brand"]
    CELL_LFP --> CATL_NODE
    CORTEX_CLUSTER --> AI5_CHIP["AI5 chip in development\nTape-out Apr 2026; vol prod mid-2027\nTSMC N3/N2 + Samsung Taylor TX"]
Read the diagram top to bottom and the investing point falls out of the shape. Money enters from four real pools and one future one. The biggest by far is vehicle buyers, $69.5 billion of automotive revenue in 2025, paid straight to Tesla because it sells direct with no dealer in the middle, which is a genuine structural edge: it keeps the 8 to 10 percentage points of margin a franchise dealer would take. The second pool, growing fast, is utilities and power producers buying Megapack grid batteries, $12.8 billion at a much better gross margin than cars. The third is services and software, $12.5 billion from Supercharging, insurance, used cars, and FSD subscriptions, and it turned reliably profitable for the first time. Tucked inside the automotive line is a fourth, pure-profit trickle: regulatory credits sold to other carmakers who need them to meet emissions rules, $1.99 billion in 2025 at essentially 100 percent margin, and structurally shrinking.
The fifth pool is the one that dominates management’s attention and most of the capex: future robotaxi fares and Optimus sales, which today are roughly zero. The cash from the four real pools is being plowed into building that fifth one. That is the whole shape of the company. A cash-generative manufacturing business is funding a moonshot, and the chokepoints sit at the bottom of the chart. Battery cells are the single largest cost in a car, and Tesla still buys most of them from Panasonic, CATL, and LG. The energy business is acutely exposed: an 82.4 percent effective US tariff on Chinese grid-storage cells has cut off the cheap supply path, and Tesla’s domestic replacement from LG (Michigan) and Samsung SDI (Indiana) does not arrive until around mid-2027. The AI bet runs through one supplier: with Tesla’s in-house Dojo training computer shut down in 2025, all of its model training depends on NVIDIA GPUs (Tesla is one of NVIDIA’s larger AI customers, which makes the relationship a cost and supply exposure, not a synergy). The shape to remember is simple. The cars pay the bills. The bets spend them.
What Tesla actually sells: the segment field guide
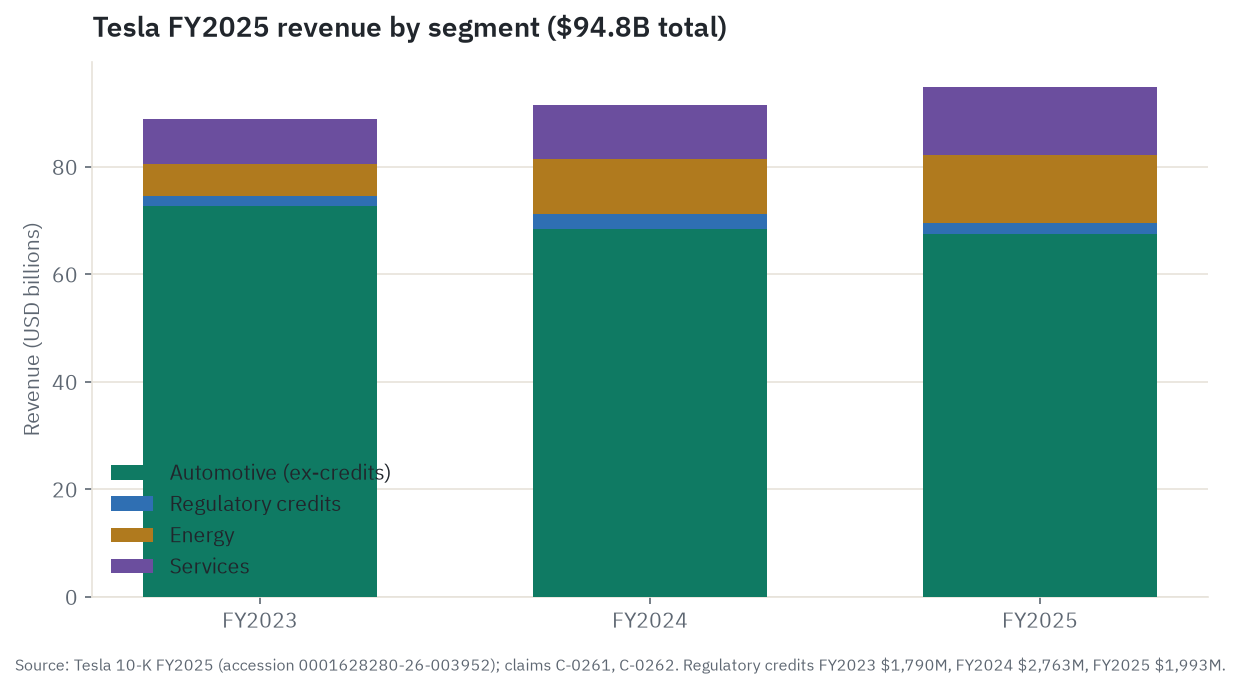
A quick caution before the tour, because Tesla’s own reporting can mislead. In its 10-K, Tesla files only two operating segments: Automotive (which folds Services and credits in, $82.1 billion) and Energy Generation and Storage ($12.8 billion). The three-way “Automotive / Energy / Services” split used throughout this piece comes from the disaggregated-revenue note, not the operating segments, so read the segment gross margins below as derived from that note, not as the company’s formally reported segment profit.
Vehicles are the volume core. The Model 3 and Model Y do roughly 97 percent of deliveries; the Model S and X are low-volume halo cars (S and X production actually ends in Q2 2026, with the Fremont line redirected to Optimus); the Cybertruck is a niche; and the Cybercab is the purpose-built robotaxi, in slow pilot production. The single most important unsold product is the affordable, sub-$30,000 next-generation model, the thing that would move the affordability math and re-inflect volume. It is not yet shipping in volume.
Energy storage is the Megapack (a shipping-container-sized grid battery for utilities) and the Powerwall (a home unit). Tesla deployed 46.7 GWh in 2025, up 49 percent, for $12.8 billion of revenue, and this is the underrated leg: its gross margin (around 29.8 percent in 2025) is roughly double the car business once credits are stripped out.
Services and other is Supercharging (now open to non-Tesla cars, so every rival EV that plugs in pays Tesla a per-kilowatt-hour fee), insurance, used-car sales, and parts. It generated $12.5 billion at a 19.7 percent gross margin in 2025, profitable at scale for the first time.
FSD software is the subscription that, in theory, becomes a recurring annuity on the installed fleet. Around 1.1 to 1.3 million paid customers as of Q1 2026, roughly a 12 to 14 percent take rate, at $99 a month in the US (Tesla went subscription-only in February 2026), for an estimated $546 million of annual recurring revenue. Real, but under 1 percent of the company’s value today.
Regulatory credits are worth understanding because they flatter the margins. These are emissions credits Tesla earns for selling zero-emission cars and sells to legacy automakers (Stellantis, Toyota, Ford, and others) who need them to avoid fines. The cash arrives at essentially 100 percent margin. The problem is the buyer pool is collapsing: the 2025 “One Big Beautiful Bill” zeroed out the US fuel-economy penalty fines that created the demand, and the line has fallen from a $2,763 million peak in 2024 to $1,993 million in 2025 to $380 million in Q1 2026. William Blair projects a 75 percent drop in 2026 and effective disappearance in the US by 2027. When that cushion is gone, you see the true car-business margin underneath it.
The auto business: the core you can see
This is the house in the appraisal, so it deserves the most care.
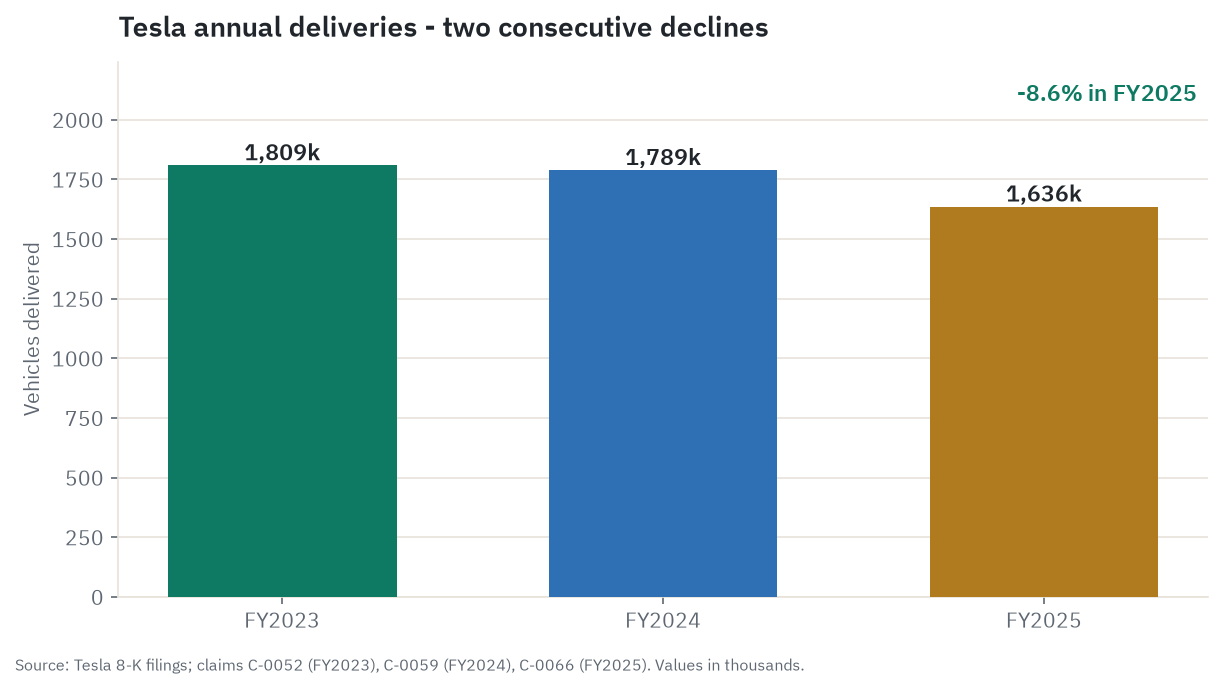
Volume is shrinking. Deliveries went 1,809k (2023), to 1,789k (2024, the first-ever decline at down 1.1 percent), to 1,636,129 (2025, down 8.6 percent). That is two straight down years off a peak quarter (496k) in the third quarter of 2024 that Tesla has not revisited. Q1 2026 deliveries of 358,023 were up 6.2 percent year over year and got reported as a recovery, but the picture underneath is murkier: US deliveries were tracking down mid-teens year to date, the quarter coincided with a pull-forward of demand ahead of the EV tax credit’s September 2025 expiry, and Tesla built up about 50,363 units of inventory (production ran ahead of deliveries). Treat the “rebound” as borrowed demand until Q2 and Q3 confirm it.
The margin is the real story, and it has a disguise. The honest gauge of how profitable the cars are is automotive gross margin excluding those 100 percent-margin credits. On that basis it has fallen from above 20 percent in 2022-2023 to about 15.4 percent in 2025. The headline Q1 2026 number, 19.2 percent ex-credits, looked like a sharp recovery, but the CFO confirmed it leaned on roughly $250 million of one-time tariff relief and about $230 million of warranty true-downs. Strip those out and the underlying figure is closer to 17.5 percent. So the true car-making margin is somewhere in the mid-to-high teens at the gross level, which is the economics of a premium contract manufacturer running its factories at about 70 percent utilization, not those of a software company.
Operating margin tells you where the money went. It collapsed from 9.2 percent in 2023 to 7.2 percent in 2024 to 4.6 percent in 2025, because R&D jumped to $6,411 million and SG&A to $6,328 million, the two together up sharply year over year. Tesla is spending the car business’s profit on the AI bet. Per car, that nets out to roughly $2,660 of operating income per vehicle delivered in 2025, on a cost base built for 2 million-plus cars a year while the company delivered 1.636 million. The empty third of the factory is exactly why the operating margin is 4.6 percent and not 9.
Pricing power is limited and getting weaker. From 2018 to 2022 Tesla had a genuine production constraint and a technology lead; both are gone. BYD’s in-house LFP “Blade” battery and full vertical integration give it a structural cost advantage of roughly 15 to 25 percent at equivalent positioning, and BYD outsold Tesla in pure EVs globally in 2025 (2.26 million to 1.64 million). In China, Xiaomi’s SU7 outsold the Model 3 for the full year. Tesla is now a price-taker in the volume segments where 97 percent of its cars sell.
Two manufacturing bets are central to Tesla’s cost roadmap and appear throughout this piece. The 4680 cell is Tesla’s in-house cylindrical battery format (named for its 46mm x 80mm dimensions), built at Giga Texas, designed to cut cell cost via a simplified tab-free design and higher energy density. Gigacasting is the process of replacing dozens of stamped-and-welded body parts with a single large aluminum casting - first applied to the Model Y rear underbody and now planned for the Cybercab - reducing parts count and assembly labor at the cost of upfront die investment. Both are real cost-reduction programs, and both carry execution risk: 4680 yield rates and gigacasting die longevity are the two most-watched manufacturing metrics in the Tesla-watcher community.
The energy-storage business: the underrated real leg
If the car business is the part of Tesla that is getting harder, energy storage is the part that is genuinely working, and it is the most defensible cash leg the company has today.
The numbers: 46.7 GWh deployed in 2025 (up 49 percent, a 93 percent compound growth rate from 2022’s 6.5 GWh), $12.8 billion of revenue, and a gross margin around 29.8 percent in 2025 - roughly double the car business ex-credits. There is also real forward visibility the auto side cannot match: a $10.15 billion order backlog as of Q1 2026, with about $5.02 billion expected to be recognized in the next twelve months. The demand driver is structural rather than cyclical, funded by utility capital budgets and the power-hungry AI data-center build rather than by household incomes, and the global grid-battery market is growing fast (around 421 GWh shipped in 2025, projected near 600 GWh in 2026). For comparison, the pure-play competitor Fluence ran a 13.1 percent gross margin in its 2025 fiscal year; Tesla’s margin sits 10-plus points above that, which says the integration-and-brand premium in utility-scale projects is real.
Now the asterisks, because the bull energy story has three of them, all policy-dependent rather than self-reinforcing. First, a meaningful chunk of the margin is subsidy: Tesla recognized $756 million of IRA Section 45X manufacturing credits in the energy segment in 2024 (about 29 percent of that year’s segment gross profit), and if that credit were curtailed the margin would compress several points in a single year. Second, the tariff wall: until the domestic LG and Samsung cells arrive around mid-2027, US Megapack economics carry that 82.4 percent Chinese-cell tariff drag, and the CFO has explicitly warned of energy-margin compression from competition and tariffs. Third, BYD has already overtaken Tesla in global grid-storage GWh deployed (more than 60 GWh in 2025), and Q1 2026 was the first year-over-year deployment decline since the segment became material (down about 15 percent in GWh). The energy leg is the best non-car business Tesla has, and it is roughly 18 to 24 months from being able to prove it can hold those margins on its own.
The FSD and robotaxi thesis, and its real status
Here is the first half of the oil, and the place where the gap between the narrative and the operational facts is widest.
The narrative says Tesla is on the verge of a vast robotaxi fleet that transforms the income statement. The operational reality as of June 2026: about 20 active driverless Model Y robotaxis in Austin (the fleet peaked near 25 in late April and has since shrunk), plus roughly 3 in Dallas and 6 in Houston, for a three-city Texas total under 50 cars. Set that against Waymo’s roughly 3,067 vehicles across 10 cities serving more than 500,000 paid rides a week, and Tesla is something like 75 times smaller by fleet after more than a year of commercial operation. Musk himself told investors on the Q1 2026 call that robotaxi revenue “would not be super material this year, but will be material probably in a significant way next year.” The stock trades at roughly 197x earnings on the strength of that “next year.”
Three facts cut hardest against the bull case, and all are sourced.
The cars are not fully driverless yet. Tesla’s Texas robotaxis use remote teleoperators who can take control at low speed when the car cannot proceed. Two of the reported Austin incidents happened during a teleoperator handoff. That matters because the bull case assumes away the labor cost of a human in the loop; until the operators are removed, the driver-out unit economics that justify the valuation do not yet exist.
Most of the existing fleet cannot do it at all. Tesla confirmed at the Q1 2026 earnings call that HW3 vehicles, an estimated 60 to 65 percent of the cars already delivered (this fleet split is a back-of-envelope estimate, not a disclosed figure), can never achieve unsupervised FSD under any software version. The “millions of existing Teslas flip into a robotaxi fleet overnight” premise applies only to the newer HW4 subset.
It is regulator-gated and the safety record is contested. NHTSA has an open Engineering Analysis, EA26002, covering about 3.2 million vehicles, into whether the FSD system fails to warn drivers when its cameras are blinded by glare, fog, or dust; a second open investigation, PE25012, covers red-light and wrong-way events. An Engineering Analysis is the step before a possible recall, and these are open investigations, not findings of defect and not recalls. Separately, a federal jury awarded $243 million in a 2019 Autopilot crash case (a judge upheld it in February 2026, and Tesla is in the appeal and post-trial process; a verdict is not a final adjudication), and the California DMV ruled in December 2025 that the “Autopilot” and “Full Self-Driving” names were deceptive marketing (an administrative ruling Tesla is contesting). Reuters reported in May 2026 that Tesla’s “10x safer” FSD statistic was overstated by roughly threefold by a methodology error, comparing airbag-deploying crashes against all tow-away crashes and not adjusting for a much newer fleet; Tesla disputes the comparison basis, and this is a press investigation, attributed to Reuters, not a primary finding.
The bull rebuttal is real and worth stating fairly. Tesla’s vision-only approach is cheaper per car than Waymo’s lidar-and-radar stack; if FSD v15 (a roughly 10-billion-parameter architectural rewrite, targeted for late 2026 or early 2027) genuinely removes the operator and NHTSA clears EA26002 without a crippling recall, a late lead in cost could beat an early lead in rides, and the roughly $30,000 Cybercab could undercut Waymo’s per-mile economics. The one data point in that direction is that Tesla’s Dallas fares have run near half of Waymo’s. The bear answer: that is a single data point, pricing below cost proves nothing, and Tesla’s FSD timelines have a long history of slipping by years.
Optimus and in-house AI compute: the other half of the bet
The second half of the oil is the Optimus humanoid robot and the chips meant to power Tesla’s whole AI stack. Both are real programs. Neither is revenue.
Optimus produced an estimated few hundred units in 2025 against a stated target of about 10,000, a roughly 97 percent miss, and Musk admitted on the Q4 2025 call that zero of them were doing “useful work” - they were for learning and data collection. The Gen 3 reveal has slipped twice; the Fremont production line conversion (from the discontinued Model S and X) targets a late-July or August 2026 start; no firm 2026 production number was given because, in Musk’s words, it is “literally impossible to predict.” Commercial sales are targeted at $20,000 to $30,000 a unit, at earliest late 2026. The honest TAM check: Goldman Sachs pegs the entire global humanoid-robot market at about $38 billion by 2035 (an attributed forecast), so even a 40 percent Tesla share is around $15 billion a year a decade out - meaningful, but not on its own a $1.5 trillion story. Musk has floated an “up to $10 trillion” long-run revenue aspiration for Optimus; that is his figure with no underlying model behind it, and no analyst house has validated it.
In-house compute is a story of serial promises that keep converging on more NVIDIA dependence, not less. Tesla’s Dojo training supercomputer was shut down in August 2025, which Musk called an “evolutionary dead end,” after about $314 million of a $500 million Buffalo commitment had been spent. The AI5 chip meant to run the cars and robots taped out (a design milestone, not production) in April 2026, roughly two years after it was first promised in vehicles, with volume production now targeted for mid-2027. A “Dojo 3” was mentioned in passing in early 2026 with no capex, headcount, or timeline attached. The practical consequence is that for the next 18 to 24 months, all of Tesla’s AI training runs on NVIDIA hardware in the Cortex 1 and Cortex 2 clusters at Giga Texas (more than 230,000 H100-equivalent GPUs at full build). The “in-house AI moat” is, for now, a deeper bill from NVIDIA.
The valuation decomposition: the spine of the whole question
This is the section everything else feeds. The calculation is an estimate built on sourced peer multiples, not a price target.
Start with the enterprise value, about $1.48 trillion, and the implied trailing EBITDA the market is capitalizing, about $11.6 billion. Now value the manufacturing-and-energy business the way the market values actual carmakers. BYD trades around 6.7x EV/EBITDA, GM around 9.8x, Toyota around 11.7x. Apply a range from a BYD-like 10x up to a generous 20x (no pure auto peer trades that high), add back the roughly $44.7 billion of cash and subtract the debt, and the auto-plus-energy business is worth somewhere between about $40 and $71 a share.
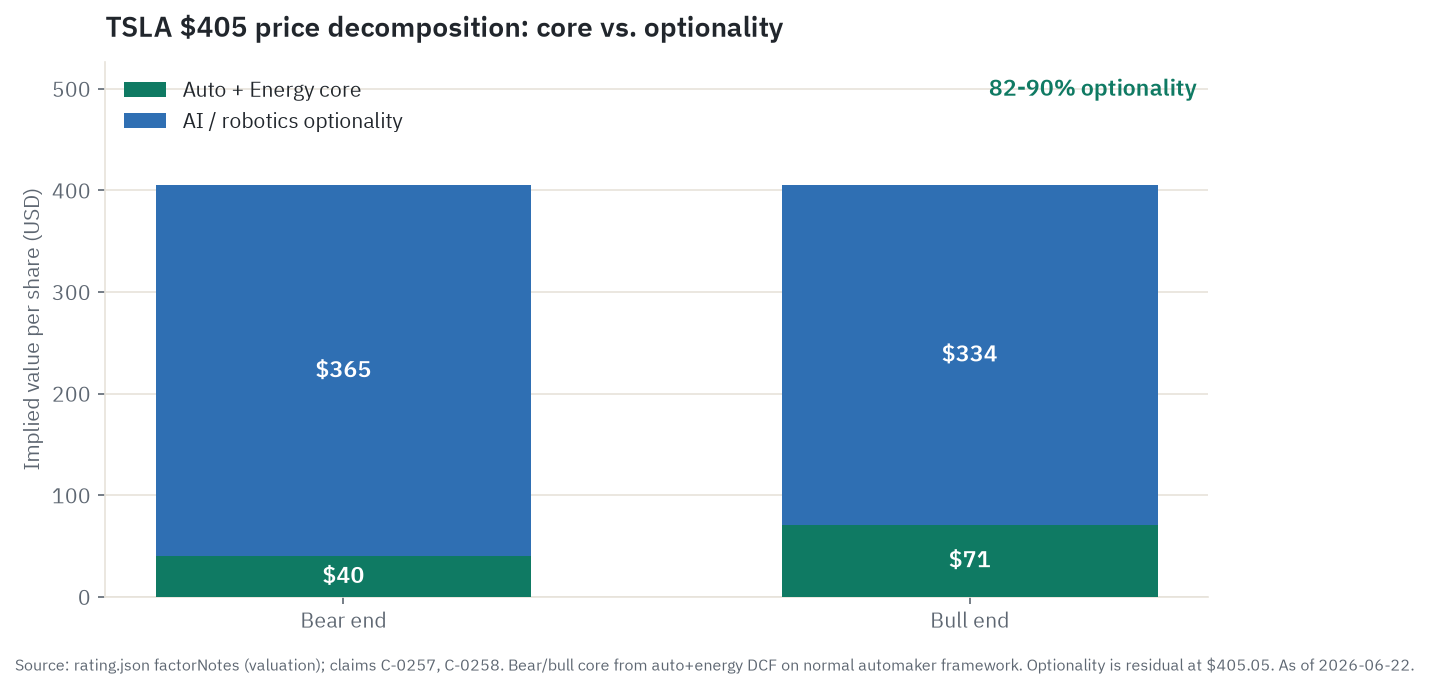
The stock is $405. So the residual, the part of the price not explained by any normal automaker math, is about $334 to $365 a share, or roughly 82 to 90 percent of the price. A price-to-sales cross-check lands in the same zip code: at a Toyota/BYD-like 0.7 to 1.0x sales on Tesla’s roughly $82 billion of auto-plus-energy revenue, the manufacturing business is worth $57 to $82 billion against a $1.52 trillion market cap, leaving the bulk as residual. This 82-to-90 figure is an estimate built on a disputed EBITDA and disputed multiples; treat it as a range, not a precise fact. But the order of magnitude is robust across methods.
That residual is what the market is paying for FSD, robotaxi, and Optimus. It is not an auto multiple and it is not a tech multiple; it is a lottery-ticket structure that needs several unproven things to work at once. The analyst community cannot even agree on its order of magnitude: Bank of America has separately valued just the robotaxi business at up to $750 billion (around $199 a share) in a bull case, while GLJ Research sets a $25 price target on the view that the bets fail and the option is worth nothing. When credible analysts disagree by a factor of eight, you are not looking at a valuation dispute; you are looking at a disagreement about what kind of company this is.
Company by company: who’s who
The peer set sizes the auto reality and stress-tests the bet. Figures are point-in-time as of June 22, 2026.
Tesla, Inc. (TSLA, Nasdaq). Global BEV leader by quarterly deliveries (358k in Q1 2026), the dominant US EV brand at roughly 46 percent share, with a market cap near $1.52 trillion at about 197x forward earnings. Recent result: Q1 2026 deliveries about 358k (up about 3 percent year over year), automotive gross margin around 18 percent headline, free cash flow turning negative as 2026 capex surges past $25 billion. Bull: FSD/robotaxi plus Optimus convert the business from carmaker to AI platform, and the $1.52 trillion cap is cheap if even one bet lands at scale. Bear: the car core is declining in China and Europe, the stock is at 186 to 208x forward earnings with no material revenue from any AI leg yet, and a single valuation-compression event wipes out most of the auto-only value.
BYD Company (1211.HK primary; BYDDY OTC). The Chinese automaker-and-battery conglomerate that overtook Tesla in global pure-BEV volume in 2025 (2.26 million BEVs) and leads China NEV at about 27 percent domestic share, with a market cap near $107 billion. Recent result: Q1 2026 BEV deliveries down 25.5 percent year over year on a China subsidy hangover, revenue down 12 percent, net profit down 55 percent (its overseas volume surged about 56 percent in the same quarter, so the slump looks policy-driven, not structural). Bull: the cheapest battery cost in the industry, dominant China share, accelerating exports, and free ADAS bundling that pressure-tests every Western rival on price. Bear: heavy reliance on China policy, a 17 percent extra EU BEV tariff, thin roughly 1 percent net margins, and new below-cost-selling rules that constrain the price-war weapon that drove its share gains. Access note: no US primary listing; the OTC BYDDY ADR is thin and wide-spread.
General Motors (GM, NYSE). The number-two US automaker and number-two in US EVs at about 13 percent share, with a market cap near $72.5 billion despite revenue ($177 billion in 2025) far above Tesla’s. Recent result: Q1 2026 revenue $43.6 billion, adjusted EPS $3.70 (a 42 percent beat), 9.7 percent adjusted EBIT margin, full-year EBIT guidance raised to $13.5 to $15.5 billion. Bull: 6x forward earnings with record profit and growing EV share, so any EV-margin improvement could drive a dramatic re-rating. Bear: peak-cycle ICE volumes, a Cruise autonomy program in rebuild mode, and a market that assigns near-zero software-option value. GM is the control experiment: a profitable carmaker the market refuses to pay an AI multiple for.
Li Auto (LI, Nasdaq). Chinese premium EV maker built on extended-range (petrol-generator-assisted) vehicles, transitioning to pure BEV, market cap near $20.3 billion. Recent result: Q1 2026 revenue down 11.4 percent, gross margin collapsed to 7.9 percent from a roughly 22 percent peak, a net loss; full-year 2025 deliveries fell 18.8 percent. Bull: its range-extender tech suits China’s geography and the new i6 BEV is gaining traction. Bear: a one-year margin collapse and a crowded premium segment with Huawei and Xiaomi pressing in.
NIO (NIO, NYSE). Chinese premium EV maker with a battery-swap network and three brands, market cap near $13 billion. Recent result: Q1 2026 revenue up 112 percent, vehicle margin 18.8 percent (from 10.2 percent a year earlier), near-breakeven on an adjusted basis after years of losses. Bull: the multi-brand push unlocks three price tiers at once and the swap network is a structural moat. Bear: GAAP losses persist, swap-station capex is heavy, and BYD prices aggressively beneath it.
Alphabet (GOOGL, Nasdaq), the Waymo parent. Waymo is the most commercially advanced robotaxi operator: roughly 3,067 fifth-generation vehicles, more than 500,000 paid rides a week across 10 US metros, no safety driver, and a standalone $126 billion valuation after a roughly $16 billion 2026 raise. Alphabet’s market cap is near $4.27 trillion. Bull: years of unsupervised commercial operating data that Tesla’s vision-only approach has not matched - a genuine safety-record and scaling moat. Bear: Waymo burns heavy capital with no disclosed profitability (its roughly $355 million annualized revenue is a Sacra estimate, not a filing), and the lidar stack carries a higher per-unit cost. This is the direct robotaxi competitor, and it is winning the race in the open today.
NVIDIA (NVDA, Nasdaq). The world’s most valuable company near $5.14 trillion, and the toll-taker on the AI build-out - including Tesla’s Cortex training clusters. Recent result: record quarterly revenue $81.6 billion (up 85 percent), data center $75.2 billion, gross margin near 75 percent. Bull: every major AI player, Tesla included, depends on NVIDIA compute. Bear: custom silicon from hyperscalers and AI-native players (Tesla’s own AI5 among them) is advancing, and the moat narrows if architectures shift. For Tesla specifically, the relevant point is the one from the money-flow map: after Dojo’s death, Tesla is more NVIDIA-dependent, which is a cost and supply exposure, not a partnership upside. See the deeper write-up on NVIDIA stock.
What the filings say
Every figure here is from a Tesla 10-K, 10-Q, or 8-K, dated.
Revenue and mix. FY2025 total revenue was $94,827 million, down 3 percent and Tesla’s first-ever annual revenue decline, driven entirely by a 10 percent drop in automotive revenue ($69,526 million) as deliveries fell and prices compressed. Energy grew 27 percent to $12,771 million and services grew 19 percent to $12,530 million, partly offsetting. Q1 2026 revenue was $22,387 million.
Margins. FY2025 gross margin was 18.0 percent ($17,094 million of gross profit); operating income $4,355 million (4.6 percent); net income to common $3,794 million (4.0 percent); diluted EPS $1.08. The collapse from FY2023’s 9.2 percent operating margin is the headline: R&D and SG&A together ran $12,739 million as the AI spend ramped.
Cash flow and the balance sheet. This is the genuine strength. FY2025 operating cash flow was $14,747 million, capex $8,527 million, free cash flow $6,220 million. Cash and investments reached $44,059 million against $8,376 million of debt at year-end, a net-cash position of roughly $35.7 billion - a fortress balance sheet that funds every bet without forced borrowing. But the direction has reversed: 2026 capex is guided above $25 billion (up from “over $20 billion” initially), the CFO confirmed negative free cash flow for the rest of 2026, and Q1 2026 already swung to negative FCF (a positive $1.4 billion ex a new $2.0 billion equity investment in SpaceX, but minus $558 million including it). That SpaceX investment is a related-party transaction (Musk runs both companies), disclosed in the 10-Q, and it sits outside any forward guidance, which makes the FCF path harder to forecast.
Dilution and the pay packages. Tesla pays no dividend and runs no buyback. Stock-based compensation rose 41 percent to $2,825 million in 2025 and is running above a $4 billion annualized pace. Two pay events matter for governance and dilution. The Delaware Supreme Court reinstated Musk’s 2018 award (about $139 to $140 billion in adjusted value at the then-price) in December 2025, reversing the lower court’s rescission; Musk forfeited 96 million shares and exercised 303,960,630 options at $23.34 on June 16, 2026, with 17.5 million shares withheld for taxes and no open-market sales. Separately, shareholders approved a new 2025 performance award in November 2025 (about 75 percent in favor): 423,743,904 restricted shares in 12 tranches, vesting against market-cap milestones up to $8.5 trillion plus operational milestones (20 million annual deliveries, 1 million robotaxis deployed, $400 billion adjusted EBITDA). Full vesting of the 2025 award alone would add roughly 11 percent to the share count. Post-exercise, Musk’s stake is roughly 30 percent (about 19.9 percent of the economic count by one measure; sources disagree, and the cleaner 10-K/A figure is about 30.4 percent total).
What management guided, and what it did not. The FY2025 10-K gave no volume, revenue, or margin guidance. It said Cybercab, Semi, and Megapack 3 are on schedule for volume production starting in 2026, flagged energy-margin compression from competition and tariffs, and added an autonomy-regulatory risk factor. One disclosure choice stands out: Tesla removed the key-man (dependence-on-Musk) risk factor in its FY2024 filing and has not restored it, a governance signal worth holding in mind and framed here as a disclosure choice rather than a motive.
The risk factors that matter, in Tesla’s own words. Three stand out as material and non-boilerplate: rapidly evolving trade and tariff policy posing risks to the supply chain and cost structure; the FSD/autonomy regulatory and safety risk (the 10-Q discloses EA26002, the $243 million Autopilot verdict, the California DMV ruling, and aggregate litigation exposure of up to $14.5 billion, which is an aggregate exposure estimate disclosed in the filing, not an amount owed); and cyclical demand sensitivity to consumer and political trends.
What the market is paying
All figures point-in-time as of June 22, 2026, and they move fast.
Price and range. The stock closed at $405.05, market cap about $1.52 trillion, on 3.76 billion shares. The 52-week range is $288.77 to $498.83, with the high (also the all-time high) set on December 22, 2025, so the stock sits about 19 percent below its peak.
Returns and character. TSLA is down roughly 10 to 12 percent year to date (sources disagree) against the S&P 500 up about 11 percent, a 21-to-23-point underperformance in six months, though it is still up about 25 percent over the trailing year. The character is the part to internalize: a 1.80 beta (it tends to move 1.8x the market), annualized volatility near 48 percent, and a documented 76 percent peak-to-trough drawdown from the 2021 high to the early-2023 trough. This is not a calm compounder; single-day swings of 3 to 6 percent are routine.
The multiples, and the fight inside them. Every multiple here is vendor-dependent and disputed, so each is a range with the as-of date:
| Multiple | Tesla | Note |
|---|---|---|
| Trailing P/E | ~335-395x | Yahoo 375x, StockAnalysis 395x, GuruFocus 334x; varies by EPS treatment |
| Forward P/E (2026E EPS ~$2.06) | ~186-208x | StockAnalysis 186x, Yahoo 200x, GuruFocus 208x; ~197x at $405/$2.06 |
| EV/EBITDA | ~122-135x | EV ~$1.48T |
| P/S | ~14.5-15.6x | on ~$94.8B 2025 revenue |
| P/FCF | ~218x | on a business about to run negative FCF |
For context, BYD’s forward P/E is about 17.6x, GM’s about 6.2x, Toyota’s trailing about 9.2x. Tesla’s price-to-sales sits roughly 15 to 52 times its auto peers; its forward P/E is 11 to 33 times theirs. And it is rich even against its own elevated history: current EV/EBITDA near 128x is about 40 percent above the roughly 92x five-year average. There is no conventional automaker context in which these multiples make sense, which is the entire point - the market is not valuing Tesla as a carmaker.
Liquidity and short interest. TSLA is among the most liquid stocks on the Nasdaq ($19 to $24 billion of daily dollar volume). Short interest is low at about 2.56 percent of float as of May 29, 2026, far below the 15 percent-plus peak of 2019, which means there is little dedicated bear positioning and little squeeze fuel to cushion a decline. Retail owns an unusually high roughly 35 percent of the shares, which makes the stock sensitive to sentiment and social-media catalysts.
The sell-side, as opinion not fact. Across 47 analysts as of June 17, 2026, the breakdown was 18 Strong Buy, 5 Buy, 18 Hold, 2 Sell, 4 Strong Sell, an average target of $420.55 (about 4 percent above the price). The striking feature is the spread: a high of $600 (Bank of America) and a low of $123 (GLJ Research; GLJ also publishes a $25 fundamentals-only target). A high-low range wider than the stock price itself is not ordinary valuation disagreement; it reflects categorical disagreement about what Tesla is.
Technicals, as context only. The stock trades just below both its 50-day (about $414) and 200-day (about $415) moving averages, having crossed under them recently, with support cited near $393 and resistance in the $445 to $470 zone. For a stock this news-driven, technical levels describe where buyers and sellers have clustered, not where it goes next.
What the crowd is saying
Everything in this section is soft data, drawn from press, analyst notes, and third-party aggregators with undisclosed methods. Read it as signal, not fact.
The dominant narratives. Warming fast in late June 2026 is the Musk options-exercise and SpaceX-merger story: the June 16 exercise pushed Musk’s stake toward 20 percent one week after SpaceX began trading publicly (around a $2.6 trillion valuation), and prediction-market odds for a Tesla-SpaceX combination sat around 45 to 55 percent in mid-June, with Wedbush’s Dan Ives separately putting it at 80 percent. All of this is speculation: there is no announced transaction, the probability figures are one analyst’s opinion and thin prediction markets, and Jefferies has warned the framing risks turning Tesla into a “SpaceX proxy,” which is a negative for pure-Tesla holders. Warming gradually is a delivery-recovery narrative (Goldman’s ~420k Q2 estimate) and a brand-redemption arc tied to Musk’s DOGE step-back. Cooling into acceptance is the $25 billion capex and negative-FCF concern. Genuinely mixed is the robotaxi story: hype accelerating, execution cooling.
The retail and social lean. TSLA occupies an unusually polarized space, with both an organized bull base (it reads every event bullishly: the options exercise is “doubling down,” NHTSA probes are “political”) and an organized bear community. Third-party sentiment scores read in the 20 to 30 range out of 100 through mid-May 2026, with a quarterly average falling from 42.9 to 32.3 - directional only, not precise. A structural feature worth naming: Musk’s own X account, with hundreds of millions of followers, is the single largest amplifier of Tesla bull narratives, which makes it hard for a retail reader to separate organic news from CEO-curated narrative. This is not pump-and-dump in the securities-law sense (he is the CEO and largest owner, not an outside promoter), but it is a structural overlap with no real precedent among large US companies, and a reader is left to weigh it.
Where the crowd’s story and the data diverge. The sharpest gap is robotaxi: a crowd pricing a multi-trillion-dollar autonomy option against an operational baseline of fewer than 50 cars and zero disclosed robotaxi revenue. The second is Optimus: social-media excitement about “the most valuable robot company in the world” against zero commercial revenue and a 97 percent miss on the 2025 unit target. The third is the recovery-versus-brand-damage split: the recovery narrative (Q1 deliveries up 6.2 percent, Europe positive) has been absorbed faster than the structural damage data (Brand Finance puts Tesla’s brand value at $27.6 billion in 2026, down from a $66.2 billion 2023 peak; an NBER working paper attributes 1.0 to 1.26 million lost US vehicle sales to the Musk partisan effect over 2022-2025; both are attributed estimates, the NBER figure a working paper, not peer-reviewed). The crowd has priced the rebound and discounted the damage.
The economics: what governs the cycle and the bet
Pull the macro and micro together and Tesla becomes two demand stories that need separate verdicts.
The auto cycle is in a policy-induced trough, and the policy is deliberate. US EV retail share fell to about 6.6 percent in Q1 2026 from 9.5 percent a year earlier, and industry US EV volumes dropped 27 percent year over year, because the $7,500 new-EV and $4,000 used-EV federal tax credits expired on September 30, 2025 under the One Big Beautiful Bill. That is a policy event, not a product regression, but it is less reversible than a normal cyclical pause because the withdrawal is deliberate and there is no named initiative to restore it. The same law zeroed the fuel-economy penalty fines that created the regulatory-credit market. With auto loan rates near 7 percent and a roughly $722 average monthly payment on a $43,900 vehicle, the affordability math at Tesla’s price points is hard, and the sub-$30,000 model that would fix it is not yet in volume. China is its own pressure: Tesla’s retail share there fell to about 4.9 percent (fifth place) with Q1 2026 retail down about 16 percent year over year, squeezed by BYD and Xiaomi on price, not by tariffs (Shanghai’s local content shields the cars from vehicle-level tariffs).
The energy cycle is structural and up, with policy asterisks. Grid decarbonization and AI-data-center power demand fund the Megapack from utility budgets, not households, and that demand is in a multi-year build (global grid-battery capacity is projected to grow from about 200 GWh to 1,200 GWh by 2030). The risks here are the IRA 45X credit, the Chinese-cell tariff gap through mid-2027, and BYD’s volume lead, all covered above.
The structural bull, honestly stated. Two specific facts did not exist at prior Tesla cycle peaks. The energy business has crossed from subscale to meaningful (27 percent of revenue run-rate with a $10.15 billion backlog), giving a demand anchor insulated from EV-credit removal and brand risk. And a physical robotaxi fleet now actually exists, however embryonic, on the largest real-world autonomy training dataset in the industry.
The cyclical bear, with a trigger. The specific trigger is a quarter in which Tesla reports automotive gross margin below 16 percent while US deliveries stay flat-to-down year over year, which would crystallize the view that the price-cut strategy has maxed out its volume gains without a product-cycle catalyst. That is a live possibility in the second half of 2026 if no affordable model is confirmed, the Q1 one-time tariff benefits are not replaced by structural improvement, and China retail keeps falling. A rebound in lithium carbonate prices (from about 59,000 to 130,000 yuan a ton in late 2025) would tighten the screw at the same time the credit cushion finishes rolling off.
Durability and synthesis
So how durable is the cash engine, and how probable is the bet.
The durable economics today sit in energy storage, not in cars or software - which is striking given the car business is five times larger by revenue. The car business earns the margins of a premium contract manufacturer (mid-teens gross, mid-single-digit operating) and is losing structural ground to BYD’s cost advantage; its reported margin was propped up for years by regulatory credits that are now disappearing. Energy storage earns roughly double those gross margins, has a year-plus of backlog visibility, and rides a secular tailwind, though its margin leans partly on subsidy and tariff protection that are policy-dependent rather than self-reinforcing. The FSD subscription is a genuine annuity in embryo - recurring, high-margin, defensible against commodity carmakers - but at under $500 million annualized it is less than 1 percent of enterprise value. Robotaxi at fewer than 50 cars and zero disclosed revenue is a proof of concept, not a business. Optimus is a decade-long manufacturing and AI problem with no near-term unit economics to analyze because none yet exist.
The most likely outcome is a two-speed company through 2026-2027: energy compounding, the car business in a margin-pressured demand trough, and the AI bets advancing without commercializing on the timeline the multiple requires. The honest one-line synthesis: Tesla is an energy-storage company and a manufacturing business funding an AI bet, and the AI bet may well be worth funding, but it is not yet economics. It is a funded option on a multi-year execution story, priced as if the option is already a certainty.
The scenarios in detail
The dollar levels here match the lede chart exactly, and every one is an illustrative estimate, not a price target.
The driver tree. Four variables decide the next five years, and the heaviest is not how many cars Tesla sells. First, robotaxi and FSD commercialization: does v15 remove the operator and let the fleet scale, with NHTSA clearing EA26002 without a crippling recall. Second, the auto-plus-energy core’s margin and volume trajectory, which sets the floor the stock de-rates toward. Third, Optimus, the longest-dated and lowest-visibility option. Fourth, the multiple itself - how long the market keeps paying roughly 197x for milestones that keep being “next year,” plus the Musk-specific swings (dilution from the awards, the SpaceX orbit, the quantified brand drag).
Bull, “the options execute” (3yr ~$950, 5yr ~$1,450). FSD v15 removes the teleoperator in 2027, NHTSA clears EA26002, the HW4/Cybercab fleet scales to hundreds of thousands and undercuts Waymo on cost; the affordable model re-inflects auto volume past about 2 million a year as the brand drag reverses; energy compounds past 100 GWh a year; Optimus ships tens of thousands of units at positive contribution. Revenue roughly doubles toward $200 billion-plus with a visible autonomy line, and the market capitalizes a real second franchise on top of the core. What breaks it: FSD v15 slips again, the modal outcome given the 2019-2026 milestone history, and the driver-out economics stay theoretical.
Base, “advance, but underwhelm” (6mo ~$410, 1yr ~$430, 3yr ~$500, 5yr ~$600). Robotaxi expands geofences and v15 ships late-ish, but the fleet stays in the thousands, not hundreds of thousands, and still partly leans on operators, becoming a real but modest business. Auto re-inflects gently on the affordable model with mid-teens margins as the credit cushion finishes rolling off; energy keeps compounding; Optimus reaches first immaterial revenue. The multiple compresses from roughly 197x as earnings, not narrative, carry the stock. Revenue grows from about $95 billion toward $140 to $160 billion. What breaks it: a post-credit US demand air pocket plus BYD/China competition pushing auto margin below mid-teens with FCF staying negative, which tips the read toward the bear.
Bear, “the calendar wins” (6mo ~$300, 1yr ~$240, 3yr ~$140, 5yr ~$110). This is the skeptic’s most-likely path, and it is a slow de-rating, not a blow-up. Through 2026-2028 the car business hits the demand air pocket and relentless China price competition, margins drift toward the mid-teens as the credit cushion finishes rolling off, and FCF stays negative under $25 billion-plus capex. Each bet advances but underwhelms: robotaxi stays in the dozens-to-hundreds and still uses operators, v15 slips into 2027-plus, NHTSA forces a software recall out of EA26002, Optimus ships low thousands with no external revenue, AI5 stays sample-stage. Nothing fails outright, but nothing commercializes on the schedule the multiple requires, and the market stops paying roughly 200x for options that keep being a year away. The 5yr ~$110 sits near the top of the $40 to $120 core range, because it is a re-rating to auto-plus-energy fundamentals plus a residual FSD annuity and the net-cash floor, not an impairment - a roughly 70 to 75 percent decline consistent with the stock’s documented drawdown history. What breaks it: a genuinely driver-out, operator-free robotaxi business with disclosed positive unit economics, which would flip the read.
The catalyst timeline. Near term: the July 22, 2026 Q2 earnings (the options market typically prices an 8 to 12 percent move); Q3 and Q4 deliveries as the test of whether Q1’s rebound was real demand or a credit pull-forward; the FSD v14-to-v15 cadence; any NHTSA outcome on EA26002 (an Engineering Analysis typically completes within about 18 months); the quarterly regulatory-credit line as the cushion erodes; and the Musk pay/attention/SpaceX thread. Multi-year: the 2027 “material next year” test on robotaxi revenue; the affordable model and Cybercab ramp; the Houston Megafactory and domestic cell supply from mid-2027; the Optimus Gen 3 reveal and any external revenue; and the maturing state-by-state AV framework.
The leading indicators a reader can watch. The single most important is the driverless fleet size together with the operator-per-vehicle ratio: a fleet breaking out of the dozens-to-hundreds with a falling operator ratio signals the bull path. Then: the FSD v15 ship date versus slip; auto gross margin ex-credits and ex-one-time-items (holding mid-to-high teens is base, drifting below 15 percent is bear); the regulatory-credit roll-off pace; whether free cash flow turns back positive after the 2026 capex peak; the EA26002 outcome (a binary swing); energy GWh and segment margin ex-subsidy; and Optimus external units shipped.
Companies to watch (bull / base / bear)
Tesla (TSLA) - the carmaker priced as an AI company. Bull: the autonomy and robotics bets commercialize and justify the multiple. Base: the bets advance but underwhelm; earnings, not the multiple, carry the stock. Bear: a slow de-rate toward auto-plus-energy fundamentals worth a fraction of today’s price. Watch: 82 to 90 percent of the price is unproven optionality, the auto core is decelerating with margins ex-credits near 17.5 percent normalized, and negative FCF is coming. Do not read it as a clean “AI company.”
BYD (1211.HK / BYDDY) - the cost leader that overtook Tesla globally. Bull: cheapest batteries, dominant China share, accelerating exports. Base: China policy hangover passes and overseas growth resumes. Bear: Q1 2026 BEV volume down 25.5 percent, below-cost-selling rules now in force, thin roughly 1 percent net margins, and tariff/political barriers in the US and EU. Watch: the US OTC ADR is thin; the cleaner exposure is the HK line.
GM (GM) - the profitable carmaker the market won’t pay an AI multiple for. Bull: 6x forward earnings with record profit and rising EV share. Base: steady truck-funded profit, gradual EV-margin improvement. Bear: peak-cycle ICE volumes and a market assigning near-zero option value. Watch: the control experiment for what Tesla’s auto business alone might fetch.
Li Auto (LI) / NIO (NIO) - China premium EV names with very different trajectories. Bull: NIO’s revenue more than doubled and it neared adjusted breakeven; Li’s i6 BEV is gaining. Base: both fight for a crowded premium tier. Bear: Li’s margin collapsed to 7.9 percent and full-year volume fell 18.8 percent; NIO still posts GAAP losses against heavy swap-station capex. Watch: domestic-China concentration and BYD pricing beneath them.
Alphabet/Waymo (GOOGL) - the robotaxi operator that is actually winning the race. Bull: 500,000 paid rides a week and a multi-year operating lead with no safety driver. Base: steady city-by-city expansion funded by Alphabet’s cash. Bear: no disclosed standalone profitability, a higher-cost sensor stack, and slow permitting. Watch: Waymo economics are an estimate, not a filing; this is the direct competitive yardstick for Tesla’s robotaxi claim.
NVIDIA (NVDA) - the compute Tesla buys, not a synergy. Bull: the indispensable AI toll-taker. Base: continued dominance as AI capex stays high. Bear: custom silicon, including Tesla’s AI5, narrows the moat. Watch: for Tesla holders, this is a cost and supply exposure that deepened after Dojo’s shutdown. See the NVIDIA deep dive.
Risk controls
The honest list of what can go wrong, and what would change the read.
Valuation after a run, with the option priced as near-certain. At roughly 197x forward earnings with 82 to 90 percent of the price resting on businesses that are pre-revenue today, even a partial de-rating of the option leg is a 40 to 70 percent move. There is little dedicated short interest (about 2.56 percent) to cushion a fall, and a 1.80 beta with a documented 76 percent drawdown history says the downside, when it comes, comes fast.
Single-key-man and governance risk. Tesla is unusually exposed to one person, and that exposure now runs in both directions - Musk is both the brand’s biggest asset and, per the NBER estimate, a quantifiable brand liability. Add the dilution from the reinstated 2018 and new 2025 awards (roughly 11 to 12 percent), the split attention across xAI, SpaceX, X, and politics, the SpaceX-merger speculation that could reframe the stock, and the related-party transactions where Musk sits on both sides.
Demand cyclicality and China/policy/tariff exposure. The US credit removal is a structural reduction in the target buyer’s purchasing power; China share is eroding to domestic rivals on price; the energy margin leans on the IRA 45X credit and a tariff wall that are both policy-dependent.
Regulatory gating of the whole AI thesis. A NHTSA recall out of EA26002, an adverse final outcome on the Autopilot verdict appeal, or the DMV marketing matter could each gate the robotaxi monetization the multiple is paying for.
What would flip the thesis toward more bullish. A genuinely driver-out, operator-free robotaxi business with disclosed positive per-mile unit economics at scale in more than one metro; NHTSA clearing EA26002 without a recall; Optimus shipping meaningful external units at positive contribution; or the auto core re-inflecting on the affordable model with margins expanding and FCF turning positive.
Methodology, sourcing, and data-quality flags
This piece drew on parallel research streams: the value-chain and money-flow map; the SEC filings (FY2025 10-K, the 10-K/A amendment, the Q1 2026 10-Q, and recent 8-Ks); the market action and valuation; the OSINT and social-sentiment read; the macro and micro economics; and deep dives on the auto business, energy storage, FSD/robotaxi, Optimus and AI compute, the China/BYD competition, and the demand/brand/Musk risk. The source hierarchy: primary (SEC filings, NHTSA documents, court reporting, Form 4s) first; then analyst-tier (TrendForce, Goldman, William Blair, Brand Finance, the NBER working paper); then reputable trade press; then explicitly labeled estimates. Of 240 load-bearing claims, 107 were verified, 9 were disputed and resolved to the filing figure, and the remainder were predominantly single-source trade-press color, hedged or attributed rather than stated as hard fact. All 8 legally or reputationally sensitive load-bearing claims reached primary or analyst tier.
The full five-factor read, in plain prose:
Valuation is the clearly negative factor. At roughly 197x forward earnings (186 to 208x by source), 335 to 395x trailing, about 128x EV/EBITDA, and about 218x price-to-free-cash-flow on a business about to run negative FCF, Tesla is dear on every conventional metric, 10 to 50 times its auto peers and above its own already-elevated five-year history. The bull retort is that these are the wrong denominators for an options basket, but a research signal cannot read “expensive on everything measurable” as anything but negative.
Growth is genuinely two-sided. The reported business is shrinking - two straight delivery declines, the first-ever revenue decline, energy deployments down year over year in Q1 - which is a negative. Against that, the optionality (robotaxi TAM, Optimus, the FSD annuity) is a real if unproven runway, and energy storage has a secular tailwind and a $10.15 billion backlog. Verified results point down, the credible runway points up; roughly neutral with a slight optionality tilt.
Quality is mixed-to-good on the balance sheet and weak on returns. The roughly $35.7 billion net-cash fortress that funds every bet without forced dilution is a real strength, and the energy segment’s roughly 30 percent gross margin is a bright spot. But operating margin has collapsed to 4.6 percent, net margin is about 4 percent, FCF is going negative, and around 9 percent of auto gross profit still leans on the vanishing credit cushion. Net mildly positive on the balance sheet, dragged by deteriorating profitability.
Risk is the most clearly negative factor after valuation. Two NHTSA Engineering Analyses covering 3.2 million vehicles (open investigations, the step before a possible recall), the $243 million Autopilot verdict upheld and under appeal, BYD overtaking Tesla globally and commoditizing driver-assist, the quantified brand impairment, acute key-man and key-man-liability risk, roughly 11 to 12 percent dilution from the pay awards, and a 1.80 beta with a 76 percent drawdown history. The concentration of the price in unproven optionality is itself the dominant risk.
Momentum and sentiment, the soft and low-weight read, is genuinely mixed: down year to date and just below the 50- and 200-day moving averages (negative), but up about 25 percent over the trailing year and well off the 52-week low, with the Musk options-exercise and SpaceX-merger narrative reigniting retail energy and the average analyst target modestly above the price. Roughly neutral.
The overall lean: a rich, high-quality-balance-sheet but contracting-core business whose price is roughly 82 to 90 percent unproven optionality, with valuation and risk both clearly negative and growth, quality, and momentum roughly neutral. As a labeled, rules-based research signal, that lands at Sell, valuation Overvalued. It would move up toward Hold if a credible driver-out robotaxi business with disclosed positive unit economics appears, or if the multiple de-rates materially while the core holds; it would move down toward Strong Sell if the auto core breaks below mid-teens gross margin with deepening negative FCF while the bets keep slipping. This is a research signal, not advice.
Data-quality flags:
- Live-price and multiple figures are point-in-time aggregator reads, not filings, and move daily. Price ($405.05), market cap (~$1.52T), and every multiple are stamped June 22, 2026 (short interest May 29; consensus June 17). The valuation multiples are vendor-dependent and presented as ranges: trailing P/E ~335-395x, forward P/E ~186-208x, EV/EBITDA ~122-135x, P/S ~14.5-15.6x.
- The valuation decomposition (the 82-90% optionality figure) is an estimate, not a fact. It is arithmetic on a disputed implied EBITDA (~$11.6B) and disputed peer multiples; the auto-plus-energy core value (~$40-71/share) is a range, and the 82-90 percent is a range, not a precise number.
- Forecasts are not facts. The robotaxi/Optimus TAM figures (Goldman ~$38B by 2035, Musk’s ~$10T aspiration), the NBER partisan-effect study (a working paper, not peer-reviewed), the Q2 2026 delivery estimates, and the BNEF/IEA EV outlooks are attributed projections, labeled as such.
- Sensitive items are hedged and attributed. The NHTSA matters (EA26002, PE25012) are open investigations, not findings of defect or recalls. The $243 million Autopilot verdict and the California DMV ruling are not final and carry appeal/post-trial posture. Robotaxi crash counts, the California-permit reporting, the Reuters safety-stats investigation, the Germany-sales attribution to Musk’s politics, the GPU-diversion-to-xAI allegation, and all SpaceX-Tesla merger material are attributed to the named outlets and labeled press-reported or speculative; none is stated as settled fact.
- Reporting-segment caveat. Tesla reports only two operating segments (Automotive incl. services $82.1B; Energy $12.8B); the three-way auto/energy/services split used here is the disaggregated-revenue note, so the segment gross margins are derived, not formally reported segment profit.
- Two corrected primary-tier figures. The FY2025 regulatory-credit figure is $1,993M (an earlier $1,668M in source data was an error) and FY2025 energy gross margin is 29.8 percent (an earlier 20.8 percent was an error); both use the 10-K figures.
Key sources: Tesla FY2025 10-K (accession 0001628280-26-003952), 10-K/A, and Q1 2026 10-Q (0001628280-26-026673) on SEC EDGAR; Tesla 8-K delivery and earnings releases; NHTSA ODI documents (EA26002, PE25012); Delaware Supreme Court reporting and Musk Form 4 (June 16, 2026); StockAnalysis and Yahoo Finance for point-in-time market data; CnEVPost, InsideEVs, CleanTechnica, Electrek, Reuters, CNBC, and TechCrunch for operational and competitive reporting; Goldman Sachs and William Blair notes; Brand Finance and the NBER working paper WP34413 (Yale) as attributed estimates.
This document is OSINT research for educational purposes only and is not investment advice, not a recommendation, and not a solicitation. The author is not a financial advisor. All data is point-in-time as of June 22, 2026 and may be outdated; nothing here is guaranteed. The five-year scenarios and illustrative valuations are arithmetic on stated assumptions, not price targets. Forward-looking statements are estimates or attributed third-party views, not promises. Do your own due diligence and consult a licensed financial advisor before making any decision.