
Research date: June 30, 2026 | OSINT market research on The Coca-Cola Company (NYSE: KO)
Important disclaimer. This is OSINT-based research and educational analysis, not investment advice. I am not a financial advisor. Nothing here is a recommendation to buy or sell any security, and the scenarios below are illustrative, not price targets. Consumer-staples valuations move with interest rates and currency as much as with the underlying business, and food and beverage names carry their own regulatory and litigation risks that can change quickly. Market caps, prices, valuation multiples, and market-share figures are point-in-time (June 30, 2026), press-reported where noted, and move fast. Do your own due diligence and consult a licensed advisor.
Where this stock could be in 6 months, 1 year, 3 years, and 5 years
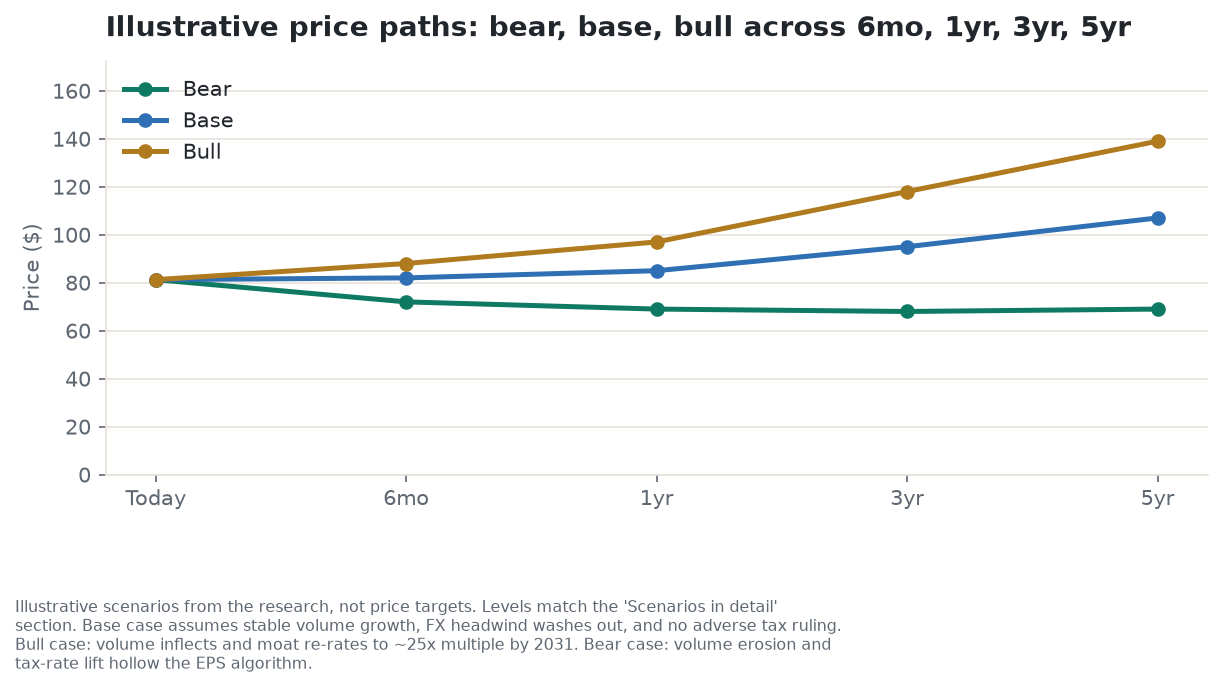
Six months. The next few months hinge on one specific, datable event: Coca-Cola’s second-quarter report, expected in late July, will be the first read on unit-case volume on a normal selling-day count. The first quarter’s headline 10 percent organic growth and 3 percent volume growth leaned on six extra selling days built into the calendar, an artifact that reverses by definition once the quarter changes. Layered on top is the currency path, which has flipped from a drag to a help this year. The base case is roughly flat to slightly up, around $82, reflecting a quality name sitting near its 52-week high with limited room left to run. The bull case, near $88, needs the volume print to hold up even without the calendar boost and the currency tailwind to stay in place. The bear case, near $72, is what happens if volume disappoints and the market starts pricing in the currency tailwind fading. The one thing most likely to flip this window is the actual, calendar-adjusted unit-case number in that print.
One year. By mid-2027 the dominant variable shifts from the calendar to the quality of the earnings themselves. Coca-Cola has guided to 8 to 9 percent growth in comparable earnings per share for 2026, a figure that embeds a real currency tailwind and a currency-neutral underlying growth rate of only about 6 to 7 percent. Whether that gap closes or widens is the story of the next four quarters. Sitting alongside it is a genuinely binary event: the Eleventh Circuit Court of Appeals heard oral argument on Coca-Cola’s transfer-pricing case with the IRS on June 25, 2026, just days before this research was compiled, and a ruling could land at any point with no fixed timetable. The base case, around $85, assumes clean mid-single-digit underlying earnings growth and no adverse tax ruling. The bull case, near $97, needs durable volume growth and either a win in the tax case or no ruling yet. The bear case, near $69, is a slow de-rate: earnings growth prints in the low-to-mid single digits against a promise of 8 to 9 percent once the currency and calendar boosts fade, or the tax case goes against the company. The flip factor here is whether currency-neutral earnings growth holds up once currency itself stops helping.
Three years. By roughly mid-2029, the structural drivers finally start to show through the noise of any single quarter. Does Coca-Cola’s emerging-market growth, still a small fraction of what it could be in markets like India, outrun the erosion in its full-sugar, mature-market core from health trends and weight-loss drugs? And does the market keep paying a 55 to 65 percent valuation premium over PepsiCo for a company growing organic revenue in the mid-single digits? The base case, around $95, assumes the growth algorithm holds and the valuation premium compresses only modestly. The bull case, near $118, needs real volume growth to appear and the moat narrative to earn a fresh re-rating. The bear case, around $68, is what a skeptic calls “the PepsiCo experience”: a good business that becomes dead money at a compressing multiple for a stretch of years. The flip factor is the trend in real, physical unit-case volume, not the trend in price and mix.
Five years. By roughly mid-2031, almost everything comes down to the same handful of structural questions compounded over time: does the concentrate moat and the emerging-market runway outrun the cumulative bite of weight-loss drugs and shifting health habits, and did the tax dispute resolve for or against the company. The base case, around $107, assumes earnings compound at roughly 7 percent a year at a somewhat lower, still-premium multiple, alongside a dividend that keeps growing, for a high-single-digit total return including that dividend. The bull case, near $139, is the scenario where volume growth genuinely reappears and the market keeps paying today’s multiple for it. The bear case, around $69, is a flat-to-down outcome where volume erosion and a structural tax-rate increase hollow out the earnings growth the current price already assumes. The flip factor across the full five years is simple to state and hard to predict: is Coca-Cola actually selling more drinks, not just charging more for the same number of them.
Where the read lands today. On balance the read holds at Hold: this is about as close to an A-plus franchise as consumer staples gets, wrapped in a stock that is fairly priced to rich at today’s level. That means treating it as a low-beta defensive and income holding to own through a cycle rather than a name to add to near its own 52-week high, at roughly 24 times forward earnings and a 55 to 65 percent premium to PepsiCo. The lean would move up to Accumulate on a genuine pullback toward Coca-Cola’s own historical valuation range, or on a clean, calendar-neutral quarter that proves the recent growth is more than price and mix. It would move down to Reduce if the weight-loss-drug risk starts showing up in the actual volume numbers rather than just the disclosed risk factors, or if the Eleventh Circuit rules against the company on appeal. The nearest-term thing to watch is the second-quarter print on a normal selling-day count.
Companion tool
Jump to the interactive dashboard to sort and filter Coca-Cola against its bottlers and beverage peers, or download the Excel model to flex the scenario assumptions yourself.
TL;DR
Coca-Cola does not really sell a can of soda to the public. It sells a concentrate formula and a brand license to a worldwide network of independently owned bottlers, and that one structural choice is most of the investment case in miniature. Because Coca-Cola keeps the roughly 60 percent gross-margin concentrate-and-royalty layer of the business for itself and pushes the capital-intensive bottling, trucking, and cold-chain work onto franchised partners such as Coca-Cola Europacific Partners, Coca-Cola FEMSA, and Coca-Cola Consolidated, the parent company converts an outsized share of every dollar of system sales into cash without carrying much capital risk of its own. That structure is why it can fund a 64th consecutive annual dividend increase even in a year when reported free cash flow was distorted by a large one-time payment. The tension in the story is that revenue growth over the last two years has been carried overwhelmingly by price and product mix rather than more bottles and cans actually moving off shelves. Worldwide unit-case volume was roughly flat for full-year 2025, and the strong-looking 10 percent organic growth reported for the first quarter of 2026 leaned on six extra selling days in the calendar rather than a genuine acceleration in demand. Layer on a currency swing that is flattering this year’s earnings guidance rather than hurting it, a newly acknowledged weight-loss-drug risk sitting squarely on the highest-margin full-sugar core, and a multibillion-dollar transfer-pricing dispute with the IRS that remains unresolved and is barely reserved for, and the picture that emerges is a genuinely excellent business trading at a rich multiple for reasons that have more to do with calm and reliability than with growth.
Explore it yourself: the interactive dashboard
Open the dashboard in a full screen
What Coca-Cola actually does
Most people think of Coca-Cola as a company that makes soda. It is more accurate, and more useful for understanding the stock, to think of Coca-Cola as a company that owns a recipe and a brand and rents both out to a global network of manufacturers. The parent company formulates and produces concentrate and syrup, a small-volume, high-value product, and sells it to a worldwide system of independently owned bottling partners. Those bottlers, not Coca-Cola itself, buy the concentrate, add sweetener and carbonated water, package the finished drink in cans or bottles, and run the trucks, warehouses, and retail relationships that get it onto a shelf or into a vending machine. It is the same basic arrangement as a chef who sells only the secret spice blend to a chain of restaurants and collects a fee on every plate served, without ever owning a kitchen, hiring a line cook, or paying rent on a dining room. The restaurant chain carries all the capital cost and all the operating risk of the physical business; the chef banks a high-margin royalty on volume someone else is financing.
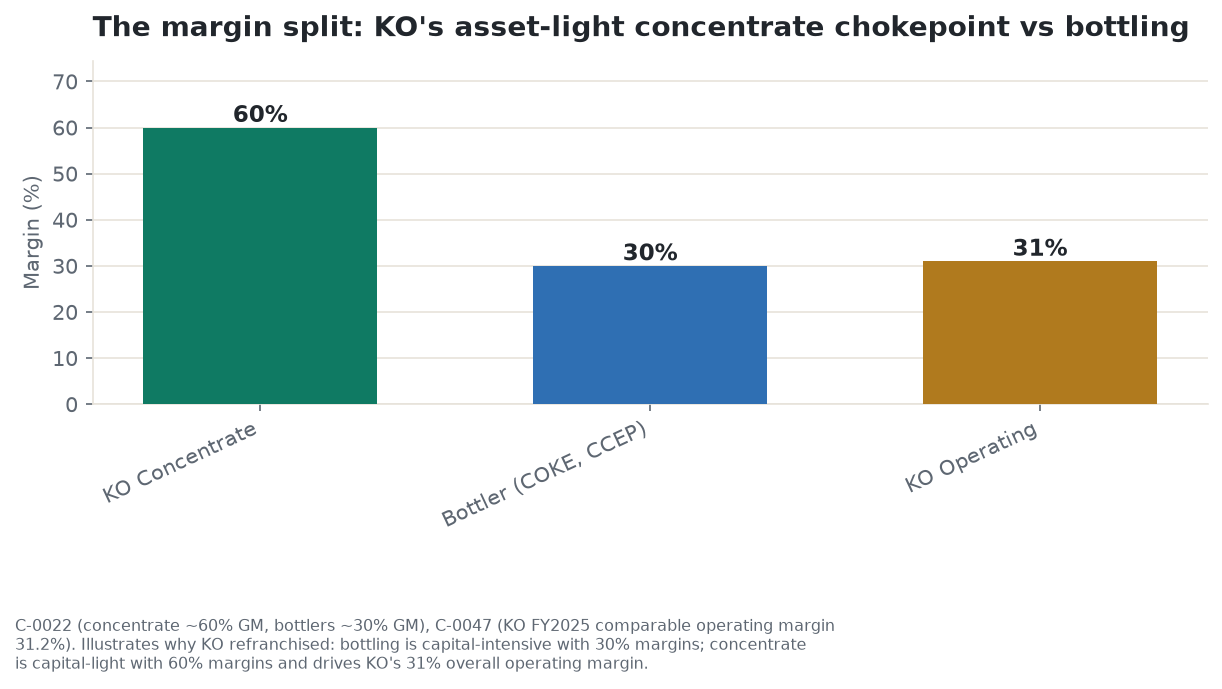
That split shows up cleanly in Coca-Cola’s own accounts. In fiscal 2025, concentrate operations made up 59 percent of net operating revenue and finished-product operations made up the other 41 percent, mostly the company’s own consolidated Bottling Investments segment plus a handful of finished-goods brands it now owns outright. Concentrate carries roughly 60 percent gross margin; the consolidated company reports gross margin near 61.6 percent, because concentrate is the profit engine and the finished-goods layer is a smaller, thinner-margin add-on riding alongside it.
Coca-Cola reports results across five geographic operating segments plus a corporate line: North America (40.8 percent of fiscal 2025 revenue), Europe, Middle East and Africa (22.6 percent), Latin America (13.2 percent), Bottling Investments (12.0 percent), and Asia Pacific (11.1 percent). Operating income tells a sharper story than revenue does. Latin America runs the highest operating margin in the company at 59.1 percent, because it is the most concentrate-heavy, least company-owned-bottling segment. Bottling Investments, the one segment where Coca-Cola still owns and runs bottling operations directly, generated 12 percent of revenue but just 3 percent of segment operating income, at a 7.4 percent margin, by far the thinnest in the company. The concentrate-and-franchise model, not the owned-bottling business, is what actually drives Coca-Cola’s profit.
The company has spent the better part of a decade deliberately shrinking its exposure to that lower-margin bottling layer, a process called refranchising. Coca-Cola finished refranchising essentially all of its US bottling territories to independent partners by 2017, and by the company’s own investor-relations framing, bottling investments have fallen from roughly half of net revenue in 2015 to a low single-digit share today. Every dollar of bottling revenue that gets refranchised away is replaced by a smaller but far higher-margin concentrate royalty, which is the single biggest lever the company has pulled to keep its own balance sheet asset-light while bottlers like Coca-Cola Europacific Partners, Coca-Cola FEMSA, and Coca-Cola Consolidated carry the plants, fleets, and warehouses.
Coca-Cola has partly reversed that logic for a handful of specific brands where management wants finished-goods economics directly rather than a licensing fee: it took full ownership of the dairy-protein brand Fairlife in 2022 (cumulative consideration, including earn-outs, reaching roughly $7.4 billion), bought the remaining stake in BodyArmor for $5.6 billion in 2021, its largest deal ever, and bought Costa Coffee outright from Whitbread for about $5.1 billion in 2019. Fairlife is the clearest case of that exception in practice: dairy-protein beverages were growing fast enough, and throwing off enough margin per case, that Coca-Cola judged owning the manufacturing and the profit outright was worth more than collecting a smaller royalty on someone else’s growth. These are the exceptions that prove the rule: Coca-Cola will carry capital intensity when a category is growing fast enough to be worth financing directly, but its default posture across the roughly 200-country core sparkling and juice business remains concentrate-and-brand, not bottling.
Scale is genuinely global. By the company’s own count, Coca-Cola beverages account for about 2.2 billion of an estimated 65 billion servings of all beverages, alcoholic and non-alcoholic combined, consumed worldwide every day, a bit over 3 percent of everything anyone anywhere drinks. A unit case, the company’s standard yardstick for physical volume, equals 24 eight-ounce servings, or about 192 ounces of finished beverage; because it counts servings actually sold rather than dollars billed, it is the cleanest available read on real demand, stripped of any price increase or shift toward pricier products. Only about 16 percent of the company’s worldwide unit-case volume is sold in the United States; the other 84 percent is international, with Mexico, China, Brazil, and India together making up a third of global volume. That volume split explains a common point of confusion in coverage of the stock: roughly 60 percent of Coca-Cola’s net operating revenue is generated outside the United States, a smaller share than the 84 percent international volume figure because US pricing and the company’s US-consolidated bottling revenue skew reported domestic revenue higher relative to domestic volume. Both numbers are real; they answer different questions, and conflating them overstates or understates the company’s currency exposure depending on which one gets misapplied.
How the money flows
flowchart TD
    TOP["Consumer purchase - point of sale"]
    TOP --> RETAIL["Retailer / foodservice / vending<br/>keeps channel margin"]
    RETAIL --> BOTTLER["Franchised bottlers<br/>FEMSA ~12% sys. volume, CCEP ~9%, COKE, HBC<br/>~30-40% gross margin, capital-intensive"]
    BOTTLER --> KOCONC["KO concentrate + brand license<br/>~59% of KO net op. revenue, ~60% gross margin"]
    BOTTLER -.->|inputs, commodity price risk| PKG["Aluminum cans / PET resin / water / energy"]
    KOCONC -.->|inputs| ING["Sweeteners (sugar/HFCS) + flavor concentrate"]
    KOFINISHED["KO-owned finished-goods brands<br/>fairlife (2022), BodyArmor (2021), Costa (2019)"]
    RETAIL --> KOFINISHED
    KOCONC --> KOCASH["KO operating cash flow<br/>FY2025 CFO ~$7.4B"]
    KOFINISHED --> KOCASH
    KOCASH --> DIV["Dividend - priority 1<br/>$8.779B paid FY2025, 64th straight annual raise"]
    KOCASH --> BUYBACK["Buybacks - priority 2<br/>~$0.7B gross FY2025"]
    KOCASH --> MNA["Bolt-on M&A - priority 3<br/>fairlife/BodyArmor/Costa-type deals"]
    IRS["IRS transfer-pricing case<br/>$6B deposit paid 2024, up to ~$14B contingent, on appeal"] -.->|overhangs| KOCONC
    TAX["Sugar-sweetened-beverage taxes<br/>50+ countries, incl. Mexico/UK/US cities"] -.->|overhangs| BOTTLER
Follow the money from the register outward. A consumer buys a can, bottle, or fountain pour, and that dollar splits three ways before any of it reaches Atlanta. The retailer or foodservice operator, a supermarket chain, a convenience store, a stadium concession stand, keeps its own margin and shelf or fountain fee first. What is left flows to a franchised bottler: Coca-Cola FEMSA, the largest by volume at roughly 12 percent of worldwide system volume; Coca-Cola Europacific Partners, the largest by revenue at roughly 9 percent of system volume; Coca-Cola Consolidated in the US southeast; Coca-Cola HBC; and a long tail of regional licensees. Together, the top five bottling partners cover about 44 percent of worldwide unit-case volume, a concentrated, entrenched network that would be extraordinarily expensive for a new entrant to rebuild from scratch. Bottlers buy water, add sweetener and carbonation, package the drink, and run the trucks and coolers that get it to a shelf, all for a gross margin in the 30 to 40 percent range on a business that requires enormous fixed investment in plants and fleets.
The bottlers, in turn, pay Coca-Cola for concentrate, syrup, the license to use the brand, and marketing support funded from the company’s own advertising budget. This is the chokepoint of the entire system. Only Coca-Cola makes the concentrate and only Coca-Cola owns the trademarks, so every unit sold anywhere in the world throws off a royalty-like payment back to the parent company with almost none of the capital risk. That cash then funds a strict, stated capital-allocation order: the dividend comes first, and management has been explicit that dividend growth outranks share buybacks in priority; buybacks come second, largely to offset dilution from employee stock compensation rather than as an aggressive capital-return program; bolt-on acquisitions like Fairlife, BodyArmor, and Costa come third. Two risks hang over this flow without yet having changed it: the unresolved IRS transfer-pricing dispute sits directly on top of the concentrate-royalty structure that makes the whole model work, and sugar-sweetened-beverage taxes weigh most heavily on the bottling layer, where volume and pricing meet the shelf price a consumer actually sees.
The brand portfolio and the margin math behind it
Coca-Cola’s portfolio spans far beyond the flagship cola. Trademark Coca-Cola itself, including Coca-Cola Zero Sugar, remains the single largest brand by volume at roughly 47 percent of worldwide unit cases, and sparkling soft drinks overall make up about 69 percent of system volume. Around that core sits Sprite and Fanta in flavored carbonated drinks; Dasani and smartwater in packaged water; Powerade and BodyArmor in sports drinks; Costa in coffee; Fairlife in dairy-protein beverages; and Minute Maid in juice. Coca-Cola Zero Sugar has been the fastest-growing major line inside the core portfolio, up 14 percent in full-year 2025 and 13 percent in the first quarter of 2026, and the company’s chief financial officer has stated that roughly 68 percent of the global portfolio, measured by servings, already carries a low- or no-calorie formulation. That is a genuine strategic hedge against shifting health sentiment, not a marketing talking point: Coca-Cola has been quietly substituting its own volume toward lower-sugar options for well over a decade, ahead of most of the regulatory and consumer pressure now building around sugar.
The margin chart above is the clearest single illustration of why the company is structured the way it is. Coca-Cola’s own concentrate operations run at roughly 60 percent gross margin, its independent bottlers average closer to 30 percent, and the consolidated company reports a comparable operating margin of 31.2 percent for fiscal 2025, up from 30.0 percent the year before. The gap between those two margin lines is the entire economic rationale for refranchising: bottling ties up billions of dollars in plants and trucks for a margin roughly half of what the concentrate business earns, so every territory Coca-Cola hands off to an independent bottler swaps low-multiple bottling revenue for high-multiple concentrate royalty revenue.
On brand strength specifically, the major valuation houses disagree sharply on a single number, which is itself informative. Interbrand’s 2025 ranking puts Coca-Cola at seventh globally with a brand value of $64.2 billion; Brand Finance separately values it at $46.3 billion; Kantar’s methodology puts it above $100 billion. The honest reading is not any one of those figures, it is that Coca-Cola sits consistently in the top ten most valuable brands on earth by every major methodology, even though the methodologies themselves disagree by more than double. In the US soda category specifically, Beverage Digest data reported by outlets including the Atlanta Journal-Constitution puts Coca-Cola Classic first with an 18.5 percent share, Dr Pepper second at 8.8 percent, and Pepsi reclaiming third place from Sprite in the 2025 rankings.
A capacity investment worth flagging as a concrete, dated growth catalyst rather than a marketing claim: Coca-Cola is building a $650 million Fairlife production facility in Webster, New York, expected online in 2026, adding roughly 30 percent capacity to that dairy-protein brand, direct evidence of where the company is putting fresh capital to work.
Who wins where
Reasoning through the chain from raw input to consumer makes clear who actually keeps the economics of a can of Coca-Cola, and it is not the company that owns the plant.
Commodity suppliers of sugar, high-fructose corn syrup, aluminum, and PET resin sit at the bottom of the chain with the thinnest and most cyclical margins. They are price-takers in global commodity markets with no brand power of their own.
Bottlers sit above them, and they absorb nearly all of that commodity volatility directly. Aluminum prices approached a four-year high near $3,500 a tonne in early 2026 on tariff and supply pressure, and US tariffs on aluminum and steel were raised to 50 percent in 2025. Coca-Cola Consolidated, the largest US bottler, disclosed roughly $35 million of higher aluminum, wage, and benefit costs in its own first-quarter 2026 results, costs that outran its pricing and compressed its adjusted gross margin. That $35 million figure belongs specifically to Coca-Cola Consolidated as an independent bottler, not to the parent company; Coca-Cola’s own quarterly filings do not break out a comparable aluminum-specific cost line, because the company itself does not carry that packaging exposure directly. The honest framing is that rising aluminum and tariff costs are a real, system-wide pressure on the bottling layer of the Coca-Cola business, evidenced by an independent bottler’s own disclosure, rather than a quantified hit to the parent company’s own income statement.
Coca-Cola itself, the concentrate, brand, and intellectual-property layer, sits above the bottlers and is the best-protected part of the entire chain through a downturn, because its costs are largely marketing and overhead, which can be cut quickly, rather than depreciation on plants and delivery fleets, which cannot. Its revenue is a contractually set share of a product it does not have to finance the manufacturing of. That is the layer this article, and the stock, is really about.
Retailers, the supermarkets, convenience chains, and quick-service restaurants that sell the finished product, have meaningful bargaining power against most consumer-goods suppliers but materially less against Coca-Cola specifically, because no grocery retailer can credibly run a beverage aisle without Coca-Cola, Sprite, and Fanta on the shelf.
One adjacent growth category worth naming: energy and functional drinks are the fastest-growing corner of the beverage business, and Coca-Cola has bought its way into that growth rather than being purely disrupted by it, holding a strategic equity stake reported in the high teens as a percentage of shares in Monster Beverage alongside owning BodyArmor outright. A handful of much larger, diversified global staples names, Nestle and Danone among them, sit adjacent to this chain as comparison points on health-and-wellness positioning rather than as direct cola competitors; both carry their own multi-year growth and margin questions that fall outside the scope of a Coca-Cola-specific analysis and are not treated as comparable investment cases here.
Company by company: who’s who
The Coca-Cola Company (KO), NYSE, market cap approximately $349.7 billion as of July 1, 2026. Owns and markets concentrate, syrup, and finished beverage brands, and licenses production to an independent bottling system worldwide. First-quarter 2026 results: net revenue up 12 percent to $12.5 billion, organic revenue up 10 percent, comparable earnings per share up 18 percent to $0.86, with the quarter’s raised full-year comparable earnings-per-share guidance now at 8 to 9 percent growth. Bull: the global concentrate model throws off comparable operating margins above 31 percent with minimal capital spending, and Zero Sugar, energy, and water lines are growing volume faster than legacy full-sugar soda. Bear: underlying unit-case volume growth is thin and heavily calendar- and price-driven rather than genuinely accelerating; GLP-1 weight-loss drugs, sugar taxes (Mexico’s 2026 excise hike already cut bottler volume there), and shifting health sentiment are structural headwinds to the core sparkling category, and an unresolved multibillion-dollar IRS tax dispute sits on top of the very royalty structure that makes the business model work.
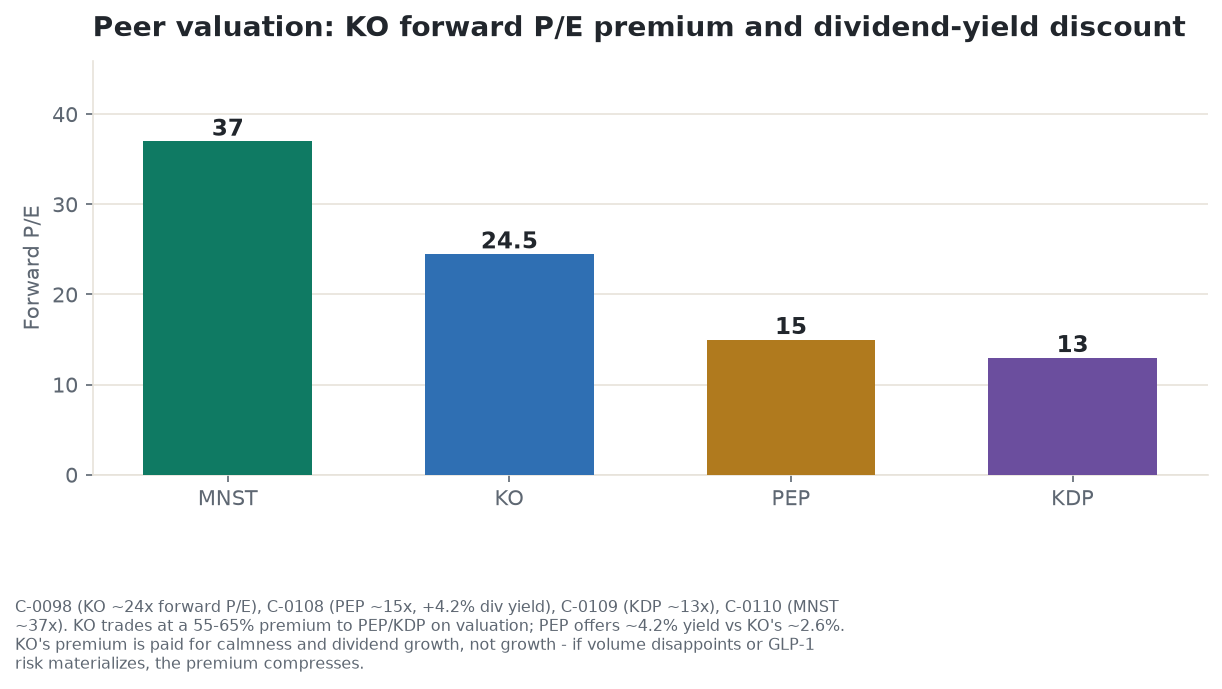
PepsiCo, Inc. (PEP), NASDAQ, market cap approximately $185.1 billion. A diversified snacks-and-beverage major (Pepsi, Mountain Dew, Gatorade beverages alongside Frito-Lay and Quaker foods), structurally different from Coca-Cola because roughly half the business is salty snacks and packaged food rather than a licensed beverage system. First-quarter 2026 net revenue rose 8.5 percent to $19.4 billion, but organic revenue grew only 2.6 percent, and its North American food business returned to volume growth (up 2 percent) for the first time in two years, after a period of price cuts. As a fellow consumer-staples dividend compounder, PepsiCo offers a useful valuation comparison: a diversified snack-and-beverage model, but at a lower operating margin than Coca-Cola’s concentrate model, and trading at a lower multiple ($15x forward vs KO’s ~$24x) despite a higher dividend yield (~4.2% vs KO’s ~2.6%). Bull: snack-and-beverage diversification, plus recent North American price cuts, appear to be reigniting volume after two years of share loss to private label, though that read rests on a single quarter and should be treated as an unproven turn rather than an established trend. Bear: PepsiCo owns its manufacturing and logistics rather than licensing to bottlers, so it carries structurally lower margins and more input-cost cyclicality than Coca-Cola, and its stock is down over both three and five years even while it pays a materially higher dividend yield than Coca-Cola does.
Keurig Dr Pepper Inc. (KDP), NASDAQ, market cap approximately $44.5 billion. A US-centric soda and coffee-systems company (Dr Pepper, 7UP, Canada Dry, Snapple, plus Keurig single-serve hardware) that recently closed its acquisition of JDE Peet’s, the parent of Peet’s, Jacobs, and L’OR coffee brands. First-quarter 2026 net sales rose 9.4 percent to $3.98 billion, beating consensus, though adjusted earnings per share fell 7 percent as inflation and expenses outweighed productivity gains, and the US Coffee segment shrank 2.3 percent even before the merger fully closed. Bull: the JDE Peet’s deal turns Keurig Dr Pepper into a scaled global coffee player and diversifies it away from a maturing US soda portfolio. Bear: its forward earnings multiple sits far below its trailing multiple, a gap that embeds a large assumed earnings recovery on top of real integration and debt-load risk from the JDE Peet’s deal, worth treating as a recovery bet requiring its own fundamental check rather than a value signal at face value.
Monster Beverage Corporation (MNST), NASDAQ, market cap approximately $94.0 billion. The number-two global energy-drink brand behind privately held Red Bull, distributed largely through Coca-Cola’s own bottler network, with Coca-Cola holding a strategic equity stake in the company. First-quarter 2026 revenue rose 26.9 percent to $2.35 billion, well above consensus, with international sales up 44.9 percent and now roughly 45 percent of the total. Bull: the fastest revenue growth in this peer set, with international expansion still early relative to a more saturated US energy category, plus the distribution tie-up with Coca-Cola’s own system. Bear: the richest valuation multiple in the group by a wide margin, on a single-category business exposed to aluminum and freight cost inflation and an increasingly crowded field of competitors including Celsius, Red Bull, and private label.
Coca-Cola Europacific Partners plc (CCEP), primary NASDAQ listing (also trades in Amsterdam, London, and Spain), market cap approximately $44.4 billion. Coca-Cola’s largest independent bottler by revenue, franchised across Western Europe, Australia, New Zealand, Indonesia, and the Pacific. First-quarter 2026 revenue rose a currency-neutral 9.4 percent, and the company reaffirmed full-year guidance of 3 to 4 percent revenue growth and roughly 7 percent operating-profit growth, while running a €1.0 billion buyback program. Bull: a scaled, cash-generative bottler operating in mostly stable, developed markets, with direct exposure to Coca-Cola’s zero-sugar and energy-category growth. Bear: bottler economics are structurally lower-margin and more capital-intensive than Coca-Cola’s own concentrate model, and growth is capped by the territories the parent company franchises to it.
Coca-Cola FEMSA, S.A.B. de C.V. (KOF), NYSE-listed American Depositary Receipt, market cap approximately $22.3 billion. The largest Coca-Cola bottler by volume, covering Mexico, Brazil, Colombia, Argentina, and Central America. First-quarter 2026 revenue rose a currency-neutral 6.0 percent, but volume in its home Mexican market fell 2.6 percent, tied directly to a 2026 soda excise-tax hike, and net income fell 15.5 percent on higher financing costs even as revenue grew. Bull: the largest-volume bottler in the system, with genuine emerging-market population and per-capita consumption runway once currency and interest-rate headwinds ease. Bear: Mexico’s excise tax is already cutting into home-market volume, and Latin American currency and interest-rate volatility flows straight through to reported earnings, as this quarter’s double-digit net-income decline despite revenue growth illustrates.
Coca-Cola Consolidated, Inc. (COKE), NASDAQ, market cap approximately $12.7 billion. The largest Coca-Cola bottler in the United States, covering roughly the southeast and mid-Atlantic under a long-term franchise, majority controlled by the Harrison family. First-quarter 2026 sales rose 16.9 percent to $1.847 billion and volume rose 13.4 percent, but adjusted gross margin fell 70 basis points and adjusted net income fell 12.3 percent on roughly $35 million of higher aluminum, wage, and benefit costs outrunning pricing. Bull: direct exposure to strong US Coca-Cola volume growth this cycle, backed by a rare, long-duration franchise territory. Bear: aluminum can and labor cost inflation is currently outrunning pricing power in US bottling, squeezing margins even as headline sales grow, and the stock is thinly traded with a small public float given family control, making it a poor liquidity substitute for Coca-Cola itself.
What the filings say
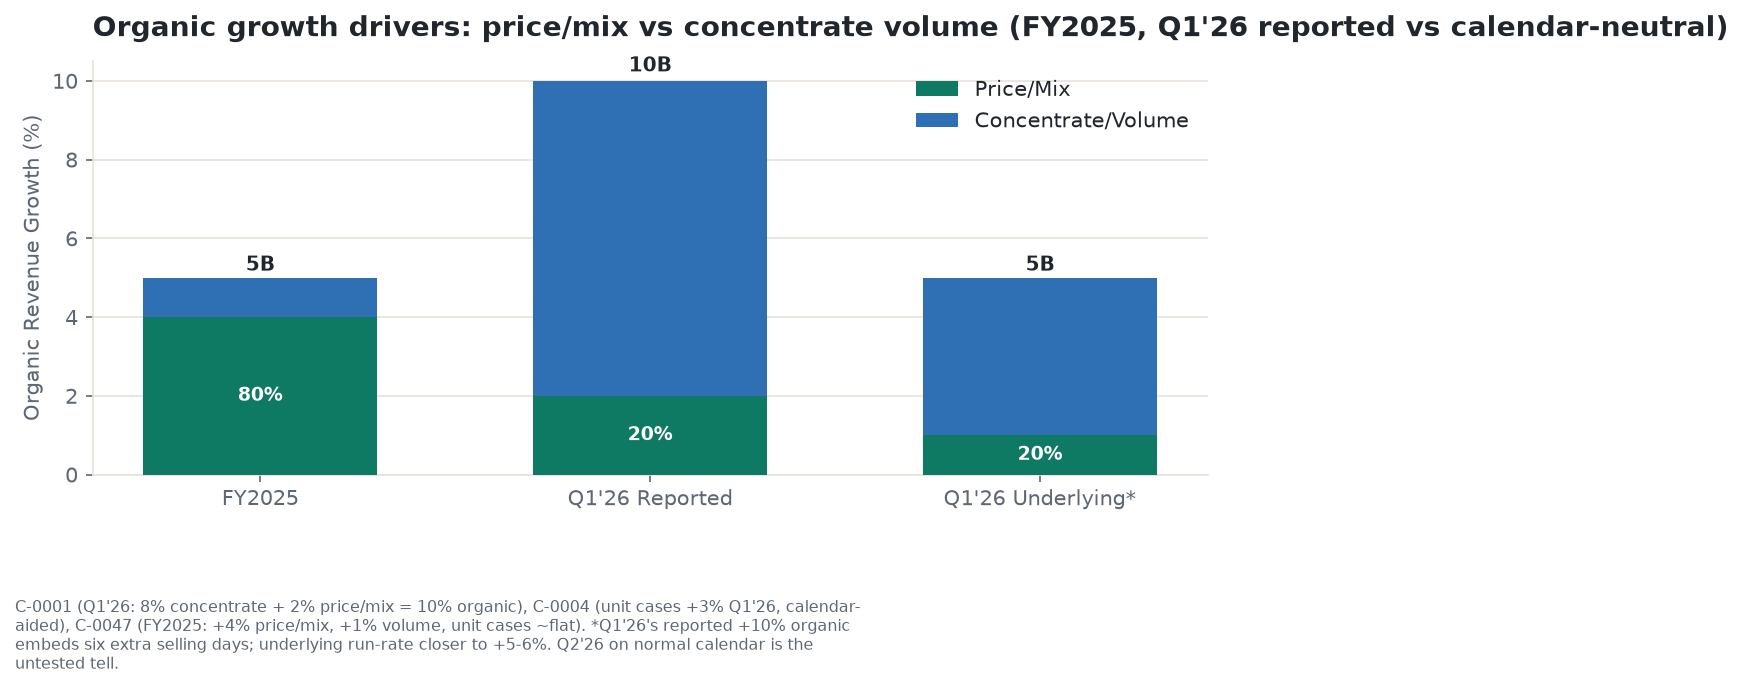
Revenue, margins, and the quality of the growth. Net operating revenue was $47,941 million in fiscal 2025, up 2 percent reported and 5 percent on an organic basis from $47,061 million in 2024. Organic revenue growth is Coca-Cola’s measure of how much the existing business itself grew, stripping out the effect of acquisitions, divestitures, and currency swings so that only price, mix, and volume in the ongoing operations remain. That organic growth broke down into 4 points of price and mix and just 1 point of concentrate-sales volume, and worldwide unit-case volume, the cleanest read on how many physical drinks actually moved, was flat for the full year. Gross margin expanded to 61.6 percent from 61.1 percent. GAAP operating margin jumped to 28.7 percent from 21.2 percent, but that comparison is distorted by a large one-time charge, mostly a Fairlife earn-out remeasurement, that depressed the prior year’s base; the cleaner comparable operating margin, which strips out one-time items, was 31.2 percent versus 30.0 percent a year earlier. GAAP diluted earnings per share came in at $3.04, up 23 percent, again flattered by that prior-year charge; comparable earnings per share, Coca-Cola’s preferred non-GAAP measure that strips out one-time items such as deal costs, legal and tax charges, and asset sales to show the ongoing earnings power of the business, was $3.00, up 4 percent, which itself absorbed a 5-point currency headwind during the year.
The first quarter of 2026 accelerated sharply: net revenue up 12 percent to $12.5 billion, organic revenue up 10 percent, comparable earnings per share up 18 percent to $0.86. But the quarter’s own 10-Q filing states directly that the period contained six additional selling days compared with the year-earlier quarter, a calendar effect that inflated concentrate sales growth to 8 points versus a 3 percent unit-case volume gain, a roughly 5-point gap driven mostly by that extra timing rather than a change in underlying demand. Reported price and mix contributed the remaining 2 points. By region, North America volume grew 4 percent, its best showing in years; Asia Pacific volume grew 5 percent but price and mix fell 6 percent as the company leaned on affordability actions, and regional operating income there fell 17 percent on a currency-neutral basis, meaning the figure holds exchange rates constant so it reflects the underlying business rather than a stronger or weaker dollar, a distinction that matters given roughly 60 percent of Coca-Cola’s revenue is generated outside the United States, live evidence of emerging-market trade-down pressure even where volume held up. The second-quarter print, on a normal day count and against a tougher comparison, is the genuine test of whether volume growth is real or was borrowed from the calendar.
Segments and geography. Coca-Cola’s five reportable geographic segments, by share of fiscal 2025 net operating revenue, break down as North America 40.8 percent, Europe/Middle East/Africa 22.6 percent, Latin America 13.2 percent, Bottling Investments 12.0 percent, and Asia Pacific 11.1 percent. By operating income, Latin America is the standout at a 59.1 percent margin, the most concentrate-heavy and least company-owned-bottling segment; Bottling Investments runs just a 7.4 percent margin, by far the thinnest, because it is the one segment where Coca-Cola itself still owns and consolidates lower-margin finished-goods bottling.
Cash flow and the balance sheet. Operating cash flow was $7,408 million in fiscal 2025, up from $6,805 million in 2024 but well below the $11,599 million posted in 2023, because both 2024 and 2025 carried large one-time cash outflows: a $6.0 billion IRS tax-litigation deposit paid in 2024, and roughly $6.1 to $6.2 billion of a Fairlife acquisition earn-out paid in 2025. Capital spending remains genuinely light, at $2,112 million in 2025, or 4.4 percent of revenue, consistent with the asset-light concentrate model. The two resulting free-cash-flow figures matter and should never be quoted without specifying which one is meant: reported free cash flow, including the one-time Fairlife payment, was $5.3 billion for 2025; free cash flow excluding that one-time item was $11.4 billion, the more representative run-rate figure. Against $8,779 million of dividends paid in 2025, that gives a payout ratio of roughly 166 percent on the reported basis and roughly 77 percent on the adjusted, ex-Fairlife basis, an enormous difference depending entirely on which denominator gets used. Management has guided to approximately $12.2 billion of free cash flow for fiscal 2026, a clean year that assumes no repeat of either 2024’s tax deposit or 2025’s Fairlife payment; if that guide holds, dividend coverage returns comfortably to the healthier end of that range without needing the ex-Fairlife adjustment as a caveat. Put plainly, the figure to trust when judging whether the dividend itself is safe is the adjusted, ex-Fairlife number: the $6.1 billion earn-out was a one-time payment tied to a single acquisition’s contractual terms, not a recurring cash outflow, so the 166 percent reported payout ratio overstates the real risk, and the roughly 77 percent adjusted ratio is the more honest read of ongoing coverage.
As of December 31, 2025, cash, short-term investments, and marketable securities totaled $15.8 billion, and total debt stood at roughly $45.5 billion against total assets of $104.8 billion and total equity of $34.3 billion; by the first-quarter 2026 filing, total debt had eased to roughly $43.9 billion. Coca-Cola’s debt carries A-plus and A1 ratings from S&P and Moody’s, with $6.2 billion of unused backup credit lines through 2030, and only about $3.3 billion of obligations come due in 2026 itself, with the bulk of maturities stretched out into 2031 and beyond. There is no near-term refinancing wall.
Capital returns and dilution. Coca-Cola raised its dividend for the 64th consecutive year at its February 2026 board meeting, to $0.53 a quarter, or $2.12 a share annualized for 2026, up from $2.04 in 2025. Buybacks have been deliberately modest and explicitly framed by management as offsetting employee-compensation dilution rather than an aggressive capital-return program: fiscal 2025 treasury-stock purchases totaled $746 million, down from $1,795 million in 2024. Shares outstanding have stayed essentially flat, at 4,302 million at both the end of fiscal 2025 and fiscal 2024, meaning buybacks have been just enough to offset new share issuance from stock compensation, not more. Management states its capital-allocation order plainly: fund operations first, grow the dividend second, pursue bolt-on acquisitions third, and buy back shares fourth. Dividend growth outranks buybacks in the company’s own stated priority.
Guidance. With first-quarter 2026 results, Coca-Cola reiterated 4 to 5 percent organic revenue growth for the full year, the low end of its long-term 4 to 6 percent algorithm, while raising comparable earnings-per-share guidance to 8 to 9 percent growth, the high end of its long-term 7 to 9 percent algorithm, versus the $3.00 fiscal 2025 base. That earnings guide assumes an approximate 1 to 2 percent currency tailwind and roughly a 4 percent net-revenue headwind from acquisitions and divestitures, largely reflecting the planned sale of the company’s stake in Coca-Cola Beverages Africa to Coca-Cola HBC in the second half of 2026, a transaction valuing 100 percent of the African bottler at roughly $3.4 billion and still subject to regulatory approval. The company’s underlying effective tax rate is guided to approximately 19.9 percent for 2026, a figure that explicitly excludes any impact should Coca-Cola lose the ongoing IRS litigation; separately, the 10-K’s own management discussion cites a slightly different GAAP effective tax rate expectation near 20.9 percent, a normal gap between a GAAP figure and an underlying non-GAAP figure from two different filing dates, not a contradiction to resolve into a single number.
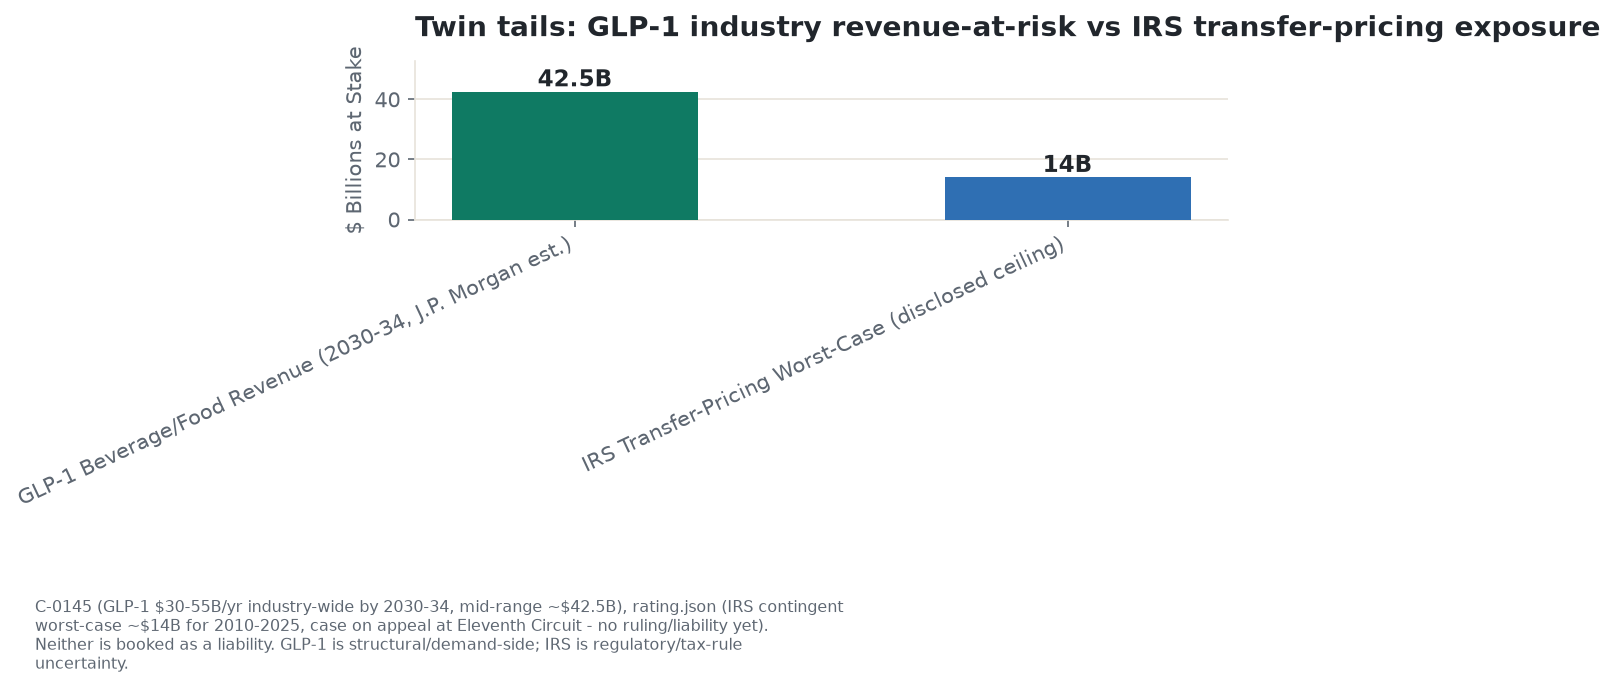
Disclosed risk factors, in the company’s own words. Coca-Cola’s own 10-K names, among others: “Obesity and other health-related concerns may reduce demand for some of our products”; a currency-fluctuation risk factor that the filing itself connects to a material effect on financial results; reliance on bottling partners, with the filing noting directly that the company’s business could suffer if it cannot maintain good relationships with those partners or if a partner’s financial condition deteriorates; a tax-rate risk factor explicitly linked in the filing to the IRS dispute discussed below; labeling and marketing-restriction risk; and water-scarcity risk to system production capacity. The most recent 10-K breaks from earlier filings by adding specific language citing “the effects or perceived effects of the usage of weight-loss drugs on consumption patterns” inside its obesity risk factor. The filing still does not use the term GLP-1 by name and does not attach a dollar figure to the exposure, so the honest framing is that Coca-Cola has begun formally acknowledging the weight-loss-drug risk in its own disclosures without yet quantifying it, closing part, but not all, of a gap between Wall Street’s GLP-1 narrative and the company’s own risk-factor language. It is worth being precise about timing: this is a forward-looking, actively debated risk rather than something already visible in the numbers, since Coca-Cola’s own first-quarter 2026 unit-case volume rose 3 percent with no discernible drag from it; the concern among skeptics is a slow, multi-year erosion of the full-sugar core as the drugs’ adoption spreads over years, not an effect anyone can point to in the current print. The widely cited estimate that $30 to $55 billion of annual food-and-beverage revenue is at risk industry-wide from GLP-1 adoption is a J.P. Morgan analyst projection, not a Coca-Cola disclosure or an adjudicated fact, and should be read as one credible forecast rather than settled science.
The IRS transfer-pricing dispute. This is the single largest disclosed contingency in Coca-Cola’s filings, and it needs to be stated with precision, as ongoing and unresolved litigation, never as a settled liability. The origin dates to a September 2015 IRS Notice of Deficiency, which sought to reallocate more than $9 billion of income from Coca-Cola’s foreign licensees back to the US parent for tax years 2007 through 2009, retroactively rejecting a transfer-pricing methodology the IRS itself had negotiated with the company in 1996 and had audited as compliant for the following decade. The core of the disagreement is straightforward to state even though the numbers are not: the IRS argues that Coca-Cola’s foreign bottling and concentrate affiliates paid the US parent too little in royalties for the rights to use Coca-Cola’s formulas and trademarks, letting profit accumulate in lower-tax foreign subsidiaries instead of being taxed in the United States. Coca-Cola’s position is that its royalty rates were set under the 1996 closing agreement it negotiated with, and was audited by, that same IRS, and that the rates reflect an arm’s-length price, meaning what a genuinely unrelated licensee would have paid for the same rights. Coca-Cola petitioned the Tax Court in December 2015. The Tax Court sided predominantly with the IRS in a November 2020 opinion and a supplemental November 2023 opinion on a related “blocked income” question involving Coca-Cola’s Brazilian royalties. On August 2, 2024, the Tax Court entered a decision for $2.7 billion of additional federal tax for the 2007 to 2009 period; with interest, the total came to $6.0 billion. Coca-Cola paid that $6.0 billion as a deposit on September 10, 2024, which stopped further interest from accruing. It is recorded as an other noncurrent asset on the balance sheet and would be refunded, in full or in part, if the company ultimately prevails on appeal; accrued interest receivable on that deposit stood at $385 million as of December 31, 2025.
Coca-Cola appealed to the Eleventh Circuit Court of Appeals on October 22, 2024. Briefing closed with the company’s reply brief on August 27, 2025, and oral argument was heard on June 25, 2026, five days before this research was compiled. As of this writing, no ruling has been issued. The company separately discloses that, in a worst case, if its position is not ultimately upheld and the Tax Court’s methodology were extended to cover tax years 2010 through 2025 as well, the aggregate incremental tax and interest could reach approximately $14 billion as of December 31, 2025. That figure is a disclosed ceiling under an adverse scenario, not an amount currently owed or a probable loss, and it should never be reported as money Coca-Cola owes today. If that scenario did play out, it would also raise the company’s ongoing effective tax rate by roughly 3.5 percentage points a year going forward, a permanent structural cost on top of any one-time cash payment, because an adverse ruling would challenge the transfer-pricing methodology underlying the royalty model itself, not just settle a historical bill. Coca-Cola has booked a reserve of only $512 million against this matter, far short of both the $6.0 billion already paid as a deposit and the $14 billion contingent ceiling, and the company states it believes it is “more likely than not” to prevail on appeal. A related and favorable data point: on October 1, 2025, the Eighth Circuit reversed a Tax Court decision in an unrelated case, 3M Co. v. Commissioner, involving the same “blocked income” regulations, and Coca-Cola’s own 10-K characterizes that ruling as supportive of its position on the Brazilian blocked-income issue in its own appeal. None of this should be read as any suggestion of wrongdoing on Coca-Cola’s part; it is a good-faith disagreement between the company and the IRS over how to allocate income across a multinational licensing structure, working its way through the ordinary appellate process, with real money already on deposit and a genuinely uncertain outcome still ahead.
Leadership. Two changes touch the top of the organization within the same six-month window. Henrique Braun, a 30-year company veteran and former chief operating officer, became chief executive officer effective March 31, 2026, succeeding James Quincey, who moved to executive chairman after nine years in the role; market reception to the internal succession was neutral to positive given the low change risk of promoting from within. Separately, an announcement filed June 25, 2026, disclosed that Jennifer Mann, president of the North America operating unit, Coca-Cola’s largest segment and, in the first quarter of 2026, its fastest-accelerating one, is departing effective July 31, 2026, with chief financial officer John Murphy taking interim charge of North America starting August 1. Both transitions were announced in an orderly, planned fashion rather than as a surprise, but together they touch the company’s top job and the leadership of its single most important segment inside the same half-year, worth watching for execution continuity through the back half of 2026.
Ownership. Berkshire Hathaway remains Coca-Cola’s largest shareholder, holding 400,000,000 shares, or 9.29 percent of shares outstanding as of the end of 2025, a position essentially unchanged in share count since it was built in the late 1980s, which reads as a long-held legacy position rather than a fresh endorsement at today’s price; a near-zero embedded cost basis and a substantial deferred capital-gains tax bill make simply not selling the default outcome for Berkshire, regardless of view on current valuation. Vanguard, at 8.61 percent, and BlackRock, at 7.28 percent, are the next-largest holders, though those figures come from filings dated late 2023 and early 2024, notably staler than Berkshire’s own more recent disclosure. On the insider side, outgoing chief executive James Quincey and departing North America president Jennifer Mann both sold shares in May and June 2026, largely through scheduled option-exercise-and-sell transactions tied to known corporate events rather than open-market conviction selling, though the timing, coinciding with both leadership transitions and a stock sitting near its 52-week high, is worth noting even if it does not, on its own, constitute a bearish signal.
What the market is paying
Price and range. Coca-Cola last closed at $81.27 on June 30, 2026, within a 52-week range of $65.35 to $84.04. The low printed on September 29, 2025 and the high on June 11, 2026, so the stock sits roughly 85 percent of the way up its own 52-week range, about 3.3 percent below that recent high, having pulled back modestly into quarter-end.
Returns. On a price-only basis, Coca-Cola is up 16.25 percent year to date, 14.87 percent over one year, 34.96 percent over three years, and 50.19 percent over five years. One dividend-reinvested return calculator, not independently cross-checked on a second source and treated here as a single-vendor estimate, puts total return closer to 18 percent over one year and roughly 74 percent over five years, consistent with dividends adding a couple of points a year on top of the price return for a stock yielding around 2.6 percent.
Volatility. Coca-Cola’s five-year monthly beta is 0.35, notably calmer than its own longer-run historical beta of roughly 0.55 to 0.65, meaning the last five years have been unusually placid for the stock relative to its own history, consistent with its identity as a defensive staple. A genuine peak-to-trough maximum drawdown figure could not be sourced from a dedicated calculator; the cleanest available proxy is the 52-week high-to-low spread itself, a decline of 22.2 percent from high to low.
Relative performance. Coca-Cola has clearly beaten both its own consumer-staples sector and its closest direct rival, PepsiCo, across every window measured, while lagging the broader S&P 500 over one, three, and five years even as it has kept pace with or exceeded the index year to date. PepsiCo is down double digits over both three and five years amid concerns about its Frito-Lay and beverage mix; Monster Beverage’s energy-drink growth story has dwarfed the entire group over three and five years; Keurig Dr Pepper has had the strongest recent quarter and year-to-date run in the group but a weak multi-year record. The precise return figures for the sector ETF itself vary by several points depending on the data vendor and calculation method used, but the qualitative conclusion, that Coca-Cola has clearly outperformed its own sector fund over the past year, holds under every version of the data.
Valuation. Trailing price-to-earnings sits around 25.6 times. Forward price-to-earnings is disputed across data vendors in a range of roughly 23.3 to 24.9 times; call it about 24 times. Enterprise value to EBITDA is similarly disputed, ranging from roughly 19.4 to 22.8 times depending on how a given vendor treats equity-method bottler income in the EBITDA calculation. Price to sales runs 7.0 to 7.3 times, well above the broader consumer-staples median. The dividend yield sits at roughly 2.6 percent, with a payout ratio near 65 percent on a GAAP earnings basis. Against PepsiCo, whose forward multiple runs roughly 15 times, Coca-Cola’s premium is on the order of 55 to 65 percent, even though PepsiCo pays a materially higher dividend yield of around 4.2 percent. That premium is not new. Coca-Cola has historically traded richer than PepsiCo as the “purer” beverage business with less snack-category cost exposure, but the current gap is wide by recent standards, and it is the single hardest number in this entire analysis to defend on growth grounds alone, since Coca-Cola’s consensus long-term growth outlook is not obviously double PepsiCo’s. A meaningful share of the premium is being paid for calmness, the 0.35 beta, and dividend reliability rather than for growth. Against its own history, the picture is genuinely two-sided and depends on which window is used: at roughly 24 times forward earnings, Coca-Cola trades below its own approximate 28-times ten-year average multiple, but above its own three- and five-year average. Anyone arguing the stock is “rich versus its own history” needs to specify that window; the more defensible version of that argument compares Coca-Cola to PepsiCo and to its own growth rate, not to its full decade of trading history. Some of that PepsiCo gap is also simply PepsiCo’s own doing rather than Coca-Cola’s: PepsiCo’s stock has underperformed and been repriced downward over the past several years on weak snack-category volume and share losses, so part of the premium reflects a discount opening up in PepsiCo rather than Coca-Cola compounding earnings at anywhere close to twice PepsiCo’s rate.
Liquidity and short interest. Average daily trading volume runs in the neighborhood of 16 to 20 million shares, roughly $1.3 billion of notional value a day, highly liquid with no meaningful position-sizing constraint for an ordinary investor. Short interest sits around 1.2 to 1.3 percent of shares outstanding, with roughly three days needed to cover, a low level that does not suggest any meaningful short thesis is currently attached to the stock, notwithstanding one vendor’s flag of a recent month-over-month increase in shares sold short.
Sell-side. Consensus analyst ratings vary by data source between a “moderate buy” and a “strong buy” label, drawn from 15 to 17 covering analysts, with the overwhelming majority rating the stock a buy. The mean price target clusters between roughly $86 and $87, implying only 6 to 8 percent upside from the current price, with a high target of $92 and a disputed low target ranging from $76 to $80 depending on vendor. As always, treat sell-side price targets as opinion rather than fact; they are frequently wrong and tend to track recent fundamentals more than they predict future ones.
What the crowd is saying
News coverage through the second quarter of 2026 has warmed on operational delivery. The first-quarter results, the CEO transition, and analyst endorsements, including one large bank calling Coca-Cola the “top beverage bet” in mid-June, have all been received as factually positive, with coverage tone reflecting genuine acknowledgment of macro headwinds, lower-income consumer weakness, and the GLP-1 volume question, rather than any suggestion of a surprise miss or an execution problem. The divergence in coverage is over valuation versus growth, not over whether the company is delivering what it promised.
Retail chatter is bullish but thin, concentrated on platforms like StockTwits rather than Reddit, consistent with Coca-Cola’s identity as what one report called a “boring Buffett hold” rather than a thesis-driven speculative name. Message volume reportedly spiked sharply over a single month in mid-2026, tied to the earnings beat and the bank endorsement rather than any sign of coordinated promotion, a pattern consistent with this being a mega-cap, highly liquid, institutionally dominated stock where pump-and-dump mechanics simply do not apply. The dominant retail narrative repeats a familiar refrain: dividend king, low beta, pricing power, a defensive holding rather than a speculative bet. A lower-volume bearish counter-chatter exists alongside it, focused on the multiple looking rich for the growth on offer and on insider stock sales by outgoing executives, both real and worth naming, though insider sales tied to scheduled option exercises around a known leadership transition are a normal event rather than a distinct warning sign on their own.
Search interest in Coca-Cola as a company runs consistently above the median of its industry peer group, a stable rather than spiking signal consistent with a steady, well-known defensive holding. Search interest in specific zero-sugar and diet product lines has spiked at points during 2026, tracking the company’s own messaging and suggesting the consumer interest in health-positioned variants is genuine rather than purely a marketing narrative, though that is a signal about product interest, not stock sentiment, and the two should not be conflated.
Employee sentiment on Glassdoor sits at 4.1 out of 5 across more than 7,000 reviews, with 83 percent saying they would recommend the company to a friend, a broadly healthy read for a legacy blue-chip employer. Recent reviews do consistently flag frequent layoffs, ongoing restructuring, and complaints that advancement is driven by internal politics rather than merit, a real if soft signal of organizational churn worth watching alongside the concurrent leadership transitions, though a 4.1 rating at this scale is not itself a crisis indicator. On the consumer side, management describes GLP-1’s effect so far as a shift from full-sugar to diet and protein variants within the company’s own portfolio rather than an outright loss of consumers to a substitute category, and there has been no visible social-media backlash on the sugar-and-health debate through mid-2026, though health advocacy groups have continued routine calls for board-level review of sweetener choices. Company commentary also acknowledges real affordability pressure among consumers earning less than roughly $50,000 to $60,000 a year, met with mini-cans and value packs rather than outright price cuts, a margin-preserving but volume-limiting response.
The clearest divergence between crowd narrative and the underlying numbers is the valuation-growth mismatch itself: the dominant retail story treats Coca-Cola’s dividend reliability and low volatility as justification for a rich multiple, while the filings show a company guiding to mid-single-digit organic growth, with sell-side price targets implying only modest upside from here, an indication that even bullish observers are not pricing in much more than the company itself is promising.
How durable is the moat, and what would actually break it
The structural bull case for Coca-Cola does not require anything new to be true; it requires the same franchise to keep doing what it has done for decades, with two specific facts strengthening the case beyond a generic brand argument. First, the refranchised, asset-light bottling structure is a completed change, not a promise still being delivered on: the comparison period is now normalized, so any further margin expansion has to come from genuine operational scaling rather than one-time restructuring credit. Second, the emerging-market opportunity is still wide open. Per-capita packaged beverage consumption in the United States runs around 140 liters a year against roughly 35 liters a year in the Middle East and Africa region, a fourfold gap, and in India only about 4 to 5 percent of beverages consumed are packaged commercial beverages at all, the rest being tap water, tea, and dairy. That gap closes as incomes rise and urbanization spreads, funded by local bottler capital rather than Coca-Cola’s own balance sheet, which is about as close as a mature consumer-staples business gets to a growth-stock runway. Layer in a 64-year unbroken dividend-growth record and a business model that requires minimal reinvestment, and the bull case adds up to a durable total shareholder return achievable primarily from pricing, mix, emerging-market volume, and capital returns, largely independent of any particular rate or macro cycle.
The real cyclical bear case is not a crash, it is a slow de-rate, and it has a specific, plausible trigger and timeline. Over the next twelve to twenty-four months, the currency tailwind currently flattering earnings guidance fades or reverses, the extra-selling-day and marketing-timing boosts that inflated the first quarter of 2026 roll off, and one or two quarters print reported earnings growth in the low-to-mid single digits against a guide that promised 8 to 9 percent. Unit-case volume stays flat to thin as GLP-1 adoption and lower-income trade-down chip away at the full-sugar core faster than emerging-market volume can offset it, so whatever growth does show up is visibly price and mix rather than units, a lower-quality mix the market is generally unwilling to pay as much for. Against a softer print like that, the market re-asks why a mid-single-digit organic grower deserves a 55 to 65 percent premium over PepsiCo, and the bond-proxy multiple compresses several turns, amplified further if long-term interest rates rise at the same time. Because Coca-Cola’s dividend-heavy shareholder base partly treats the stock as a bond substitute, a rise in risk-free yields can compress the multiple even if the underlying operating business executes exactly as planned; that is a genuine source of valuation risk distinct from anything happening inside the company itself. The mechanism is simple: income-focused investors are choosing between owning a steady dividend payer like Coca-Cola and owning a bond, so when bond yields climb, those investors can get more income for less risk elsewhere, and they demand a higher earnings yield, meaning a lower price-to-earnings multiple, from Coca-Cola to keep competing for that same pool of capital, even though Coca-Cola’s own profits have not changed at all. On top of that cyclical case sits a real tail risk: an adverse ruling from the Eleventh Circuit, argued in June 2026 and still undecided, would crystallize a multibillion-dollar cash payment and permanently lift the effective tax rate by roughly 3.5 percentage points, landing directly on the earnings algorithm the current premium is built on. None of these forces individually breaks the company. Together, over a couple of years, they could turn “quality compounder at a fair premium” into “dead money at a rich multiple,” the experience PepsiCo’s own stock has had over the past several years, and which the bull case implicitly treats as something that cannot happen to Coca-Cola specifically.
The most likely outcome sits between those two poles, as it usually does with a mature consumer staple. Blended global volume growth probably stays low-single-digit at best, a mix of modest emerging-market gains net of mature-market stagnation and the ongoing shift from full-sugar to zero-sugar. Organic revenue growth likely continues to be led by price and mix rather than pure volume, as it has been for the last two years. Margins probably hold near current elevated levels, because the asset-light structure behind them is real and durable rather than a temporary input-cost tailwind, though reported earnings growth will likely continue to trail the underlying, currency-neutral growth rate by several points in most years, because the currency drag is structural even as its size ebbs and flows with the dollar’s own multi-year cycle. The stock’s own multiple stays more sensitive to interest rates than to anything specific happening inside the beverage business, meaning Coca-Cola’s day-to-day volatility is likely to be driven more by macro forces than by its own operating results, a genuinely defensive operating profile wrapped inside a genuinely rate-sensitive valuation.
The scenarios in detail
Four variables decide Coca-Cola’s outcome over the next five years, and every scenario below is simply a different setting of these same four dials.
Real unit-case volume, stripped of calendar and price effects. This is the master variable, and the one the bull case tends to be quietest about. Full-year 2025 worldwide unit cases were essentially flat; nearly all of the 5 percent organic growth was price and mix. The first quarter of 2026’s headline 10 percent organic growth and 3 percent volume growth was calendar-aided by six extra selling days and is not a genuine run rate. Whether Coca-Cola can grow physical volume in the low single digits, meaning the emerging-market runway winning out, or stays flat to thin, meaning GLP-1 and low-income trade-down winning instead, is the hinge the whole valuation swings on. Price and mix can carry revenue for a while, but the market pays less for growth that is led by price than for growth led by volume.
Margin durability of the concentrate model. The moat sits in roughly 60 percent concentrate gross margin, roughly 31 percent comparable operating margin, and a return on invested capital that third-party trackers estimate anywhere from about 12 to 18 percent depending on methodology, itself a sign the figure should be treated as directional rather than precise. Two things could bend that margin: a GLP-1-driven mix shift out of the highest-margin full-sugar Trademark Coca-Cola and Sprite lines, and an adverse IRS ruling that structurally challenges the royalty transfer-pricing model itself and lifts the tax rate by roughly 3.5 percentage points.
Currency and the quality of reported earnings. In 2026, currency is a tailwind of roughly 3 to 6 percentage points, flattering the raised 8 to 9 percent comparable earnings guide; the currency-neutral underlying growth rate, excluding acquisitions, is only about 6 to 7 percent. Currency swings both ways and has subtracted from results for years at a time; right now it is helping, which means a real portion of the current “reacceleration” narrative can reverse just as quickly as it appeared.
The multiple itself, and its exposure to a bond-like re-rating. At roughly 24 times forward earnings, Coca-Cola carries a 55 to 65 percent premium over PepsiCo, a price-to-earnings-growth ratio near 3 times, and sits above its own three- to five-year average multiple while remaining below its roughly 28-times ten-year average. The premium is carried by calmness and dividend reliability, not by a growth rate anywhere close to double PepsiCo’s. A rise in long-term interest rates, or a soft earnings print once the currency and calendar boosts fade, is what would compress it.
Bull case. Organic revenue growth runs at the high end of the algorithm, around 6 percent, with unit-case volume finally contributing meaningfully rather than just price and mix, on the back of the emerging-market runway and a winning zero-sugar and functional-beverage mix. Comparable earnings per share compound 9 to 10 percent a year, currency stays neutral to helpful, Coca-Cola prevails at the Eleventh Circuit with no tax-rate impact, and GLP-1 proves to be a manageable mix shift rather than a genuine volume drain, letting the multiple hold in the 24 to 25 times range on proven durability. Earnings per share would compound from the $3.00 fiscal 2025 base toward something above $5 by the early 2030s, an order-of-magnitude trajectory rather than a precise forecast, implying a price near $139 by roughly mid-2031, a scenario estimate and not a price target. What has to be true: volume growth genuinely reappears and visibly outruns the GLP-1 headwind. What is most likely to break it: flat or thin unit-case volume persisting, exposing the price-led growth the market pays less for.
Base case. The company’s own long-term algorithm roughly holds: organic revenue growth of 4 to 6 percent, currency-neutral comparable earnings growth around 7 percent net of currency normalizing over time, with volume flat to slightly positive and growth still mostly price and mix. Currency effects wash out over the horizon, the IRS matter resolves without a catastrophic cash-and-tax-rate event, GLP-1 remains a slow, partly offset headwind, and the multiple compresses modestly from roughly 24 times toward 22 times as the market normalizes a mid-single-digit grower. Earnings per share would compound from $3.00 toward roughly $4.90 by 2032, implying a price near $107 by roughly mid-2031, plus a still-growing dividend, for a high-single-digit total return including that dividend. What has to be true: the algorithm holds and no tail risk lands. What is most likely to break it: the currency tailwind reversing into a soft earnings print that triggers a premium-to-PepsiCo de-rate before earnings growth compounds enough to offset it.
Bear case, anchored on the skeptic’s strongest argument. The currency tailwind fades or reverses and the extra-selling-day and marketing-timing boosts roll off, so one or two years print low-to-mid single-digit earnings growth against an 8 to 9 percent promise. Unit-case volume stays flat to negative as GLP-1 adoption (one investment bank models roughly 31.5 million US users by 2035) and low-income trade-down chip away at the full-sugar core faster than emerging-market volume offsets it. Sugar taxes, already in place in more than 50 countries, continue spreading, and Mexico’s 2026 excise increase has already cut volume at Coca-Cola’s largest bottler there. The market re-asks why a mid-single-digit grower deserves a 55 to 65 percent premium over PepsiCo and compresses the bond-proxy multiple, and on top of that, an adverse Eleventh Circuit ruling crystallizes a multibillion-dollar cash payment, a disclosed worst-case ceiling of roughly $14 billion for 2010 through 2025, reserved for only about $512 million, contingent rather than adjudicated, and structurally lifts the effective tax rate by roughly 3.5 percentage points, hitting the exact earnings algorithm the current premium is built on. Earnings growth crawls at roughly 4 percent a year while the multiple de-rates toward 17 to 18 times. Earnings per share would crawl from $3.00 toward roughly $3.90 by 2032, implying a price near $69 by roughly mid-2031, the stock effectively dead money at a still-rich multiple for a stretch of years, with total return kept only marginally positive by the dividend. What has to be true for this case: volume erosion outruns the emerging-market runway, or the IRS tail lands, or both. What would rescue the bull case from here: a clean IRS win paired with a genuine volume inflection.
Catalysts and timeline. In the near term: the second-quarter 2026 report, expected in late July, is the single most important event, the first normal-day-count read on real volume growth. The Eleventh Circuit’s ruling on the IRS appeal could land at any time following June 2026 oral argument and is a binary swing for the tax-rate and cash-flow story. Each quarter’s currency disclosure will show how much of the 8 to 9 percent earnings guide is currency versus operations. The new chief executive’s early decisions, and execution continuity in North America following the president’s July 2026 departure, bear watching. The next dividend-increase announcement, expected around February 2027, would extend the 64-year streak. Over a multi-year horizon: the pace of GLP-1 adoption through the early 2030s and whether it shows up in Coca-Cola’s own full-sugar volume; the emerging-market build-out, including the pending sale of the Coca-Cola Beverages Africa stake and India’s still-tiny packaged-beverage penetration; continued sugar-tax adoption across the more than 50 countries that already have one; and the Fairlife capacity expansion coming online in 2026 as a concrete non-soda growth offset.
Leading indicators to watch. Real unit-case volume, stripped of calendar effects, is the master indicator: sustained low-single-digit growth points toward the base or bull case, flat-to-negative points toward the bear case. Currency-neutral, acquisition-adjusted comparable earnings growth shows whether the underlying algorithm is intact once currency stops helping. The Eleventh Circuit’s ruling is a binary event with a large swing either way. The split between price-and-mix growth and volume growth each quarter is the clearest tell on the quality of whatever growth is being reported. The size of the forward price-to-earnings premium over PepsiCo shows whether the market’s confidence in Coca-Cola’s quality is holding, widening, or starting to compress. Finally, the prevalence of affordability actions like mini-cans and value packs is a direct read on lower-income and emerging-market trade-down stress.
Companies to watch (bull / base / bear)
Coca-Cola (KO), the concentrate-and-brand owner at the top of its own value chain. Bull: real unit-case volume growth reappears and the Eleventh Circuit rules in the company’s favor, removing the tax tail and confirming the moat still outruns GLP-1 and health-driven mix shift. Base: the long-term algorithm holds roughly as guided, price and mix continue to carry most of the growth, and the valuation premium over PepsiCo compresses only modestly over time. Bear: the second-quarter print and beyond show flat-to-thin volume once the calendar boost fades, the currency tailwind reverses, and either an adverse tax ruling or a widening GLP-1 effect forces a multi-quarter de-rate. Watch: the normal-day-count volume number, the currency-neutral earnings growth rate, and the Eleventh Circuit’s ruling.
PepsiCo (PEP), the closest direct rival, structurally different because of its large snack-food business. Bull: recent North American price cuts genuinely reignite volume growth after two years of share loss to private label. Base: organic growth stabilizes in the low single digits as the snack and beverage businesses roughly offset one another. Bear: the recent volume uptick proves to be a single-quarter blip rather than a durable turn, and the stock’s multi-year underperformance continues. Watch: whether North American food volume growth persists for more than one quarter.
Keurig Dr Pepper (KDP), the US-centric soda-and-coffee consolidator now folding in JDE Peet’s. Bull: the JDE Peet’s integration succeeds and turns the company into a credible global coffee player, diversifying away from a maturing US soda base. Base: integration proceeds on schedule with modest synergies while US Coffee stabilizes rather than shrinking further. Bear: integration and debt-load risk from the deal outweighs the coffee diversification benefit while US Coffee keeps shrinking. Watch: whether the forward earnings multiple’s implied recovery actually materializes in reported results.
Monster Beverage (MNST), the energy-drink grower distributed through Coca-Cola’s own bottler network. Bull: international expansion keeps compounding at a high rate as the category matures more slowly abroad than in the US. Base: growth moderates from its current pace but remains the fastest in this peer set. Bear: aluminum and freight cost inflation, plus intensifying competition from Celsius, Red Bull, and private label, compress margins on what is already the richest multiple in the group. Watch: gross margin trend against aluminum and freight costs.
Coca-Cola Europacific Partners (CCEP), the largest bottler by revenue, concentrated in developed markets. Bull: stable developed-market cash generation continues funding steady dividends and buybacks. Base: growth tracks the low-single-digit guidance the company has already reaffirmed. Bear: bottler-level margin pressure from packaging and freight costs erodes returns faster than pricing can offset. Watch: currency-neutral revenue growth against guidance.
Coca-Cola FEMSA (KOF), the largest bottler by volume, concentrated in Latin America. Bull: the emerging-market per-capita runway eventually outruns currency and rate volatility. Base: volume growth continues outside Mexico while the home market absorbs the new excise tax. Bear: further sugar-tax adoption across Latin America and continued currency and interest-rate volatility keep compressing reported earnings even as revenue grows. Watch: Mexican volume trend against the new excise tax.
Coca-Cola Consolidated (COKE), the largest US bottler, family-controlled with a thin public float. Bull: strong US Coca-Cola volume growth this cycle continues flowing through to a thinly followed, long-duration franchise. Bear: aluminum, wage, and benefit cost inflation keeps outrunning pricing power, compressing margins even as headline sales grow. Watch: whether pricing catches up to input-cost inflation in the next two quarters.
Risk controls
Coca-Cola’s risk profile is unusual for a mega-cap in that its biggest swing factors are not really about the underlying beverage business at all. The company’s own operating model is genuinely low-cyclicality: modest capital needs, a diversified global customer base of hundreds of millions of individual purchases a day, and a demand profile that does not depend on any single economy or enterprise budget cycle. The real risk concentration sits elsewhere. First, in the currency and interest-rate sensitivity of a bond-proxy valuation: a stock trading at a premium multiple mostly because of its calm and its dividend is exposed to any rise in long-term rates independent of how well the business itself performs. Second, in a genuinely unresolved multibillion-dollar tax dispute that is reserved for only a small fraction of its disclosed worst-case exposure, sitting directly on top of the transfer-pricing structure that makes the whole royalty model work. Third, in a slow-moving but real demand-composition risk from weight-loss drugs and shifting health sentiment, now formally if not fully acknowledged in the company’s own risk factors, landing specifically on the highest-margin, full-sugar core of the portfolio. Fourth, in valuation itself: at roughly 24 times forward earnings and near a 52-week high, the stock has limited room for a disappointing quarter without a real multiple reset, since consensus price targets already imply only modest upside from here. Liquidity is not a concern; the stock trades roughly $1.3 billion of notional value a day and would not present a position-sizing constraint for an ordinary investor.
What would change this thesis for the worse: two or more consecutive quarters of flat-to-negative unit-case volume once calendar effects wash out, currency-neutral earnings growth slipping meaningfully below the underlying 6 to 7 percent algorithm, an adverse Eleventh Circuit ruling, or a widening of the forward price-to-earnings premium over PepsiCo on a soft print rather than a compression of it. What would change it for the better: a clean, calendar-neutral quarter showing real volume growth, a favorable or dismissed outcome on the tax appeal, and continued evidence that the GLP-1 effect is a manageable shift within Coca-Cola’s own portfolio rather than a net loss of beverage occasions to the category as a whole.
Methodology, sourcing, and data-quality flags
This article draws on Coca-Cola’s fiscal 2025 Form 10-K (filed February 20, 2026), the first-quarter 2026 Form 10-Q and accompanying earnings-release exhibits, the 2026 proxy statement, Form 8-K filings from January through June 2026, and cross-checked market data from multiple vendors including stockanalysis.com, finance.yahoo.com, finviz.com, marketbeat.com, GuruFocus, and financecharts.com. Every figure treated as a fact in the sections above traces to a claim recorded and verified against a primary filing or independently corroborated across at least two data sources; figures that could not be reconciled to a single number are presented here as ranges rather than points.
The single most important correction made in preparing this piece: an earlier read of Coca-Cola’s international revenue exposure, citing roughly 76 percent of revenue generated outside the United States, does not survive a direct check against the fiscal 2025 10-K’s own revenue disaggregation table, which shows international revenue at roughly 60 percent of the total, alongside 84 percent of unit-case volume being international. Both figures are real; they answer different questions, and the earlier, larger figure has been corrected throughout this piece.
The GLP-1 industry-revenue-at-risk estimate of $30 to $55 billion annually by 2030 to 2034 is a J.P. Morgan analyst projection, not an AlixPartners estimate as an earlier version of this research mistakenly attributed it; that attribution has been corrected here. It remains a forecast from a single analyst house, not a company disclosure or an adjudicated fact, and should be read as one credible estimate rather than a consensus figure. Coca-Cola’s own fiscal 2025 10-K has, for the first time, added risk-factor language referencing weight-loss drugs, though it does not use the term GLP-1 or attach a dollar figure to the risk; this piece treats that as a genuine, if partial, closing of the gap between the Wall Street narrative and the company’s own disclosure, not as evidence the risk is fully quantified or resolved.
The approximately $35 million of incremental aluminum, wage, and benefit costs disclosed for the first quarter of 2026 belongs specifically to the independent bottler Coca-Cola Consolidated, not to the parent company; an earlier draft of this research mistakenly implied it as a Coca-Cola-parent cost, and it has been corrected throughout to reflect it as bottler-level, system-wide input-cost pressure rather than a quantified hit to the parent’s own income statement.
Currency is treated in this piece as a 2026 tailwind of roughly 3 to 6 percentage points to comparable earnings guidance, not as the “persistent headwind” framing sometimes applied to Coca-Cola’s currency exposure historically; currency-neutral, acquisition-adjusted underlying growth is guided at only about 6 to 7 percent. Currency is a genuine multi-year swing factor that has subtracted from results for extended periods in the past and will again in the future; this piece is explicit that its current status as a tailwind is a point-in-time condition, not a permanent feature.
Free cash flow is presented on both bases throughout this piece, reported ($5.3 billion for fiscal 2025, including a one-time $6.1 billion Fairlife earn-out payment) and adjusted ($11.4 billion, excluding that one-time item), with the resulting dividend-payout-ratio calculation shown on both denominators (roughly 166 percent on the reported basis, roughly 77 percent on the adjusted basis) rather than presenting a single figure that would flatter or understate the dividend’s coverage.
Several valuation multiples, including forward price-to-earnings, enterprise-value-to-EBITDA, the sell-side consensus rating label, and the low end of the analyst price-target range, are genuinely disputed across data vendors by several percentage points to several dollars, reflecting different consensus-estimate windows or EBITDA construction methods rather than a single resolvable error; this piece presents those figures as ranges. Total-return-with-dividends-reinvested figures and sector-ETF performance figures rely on single-vendor calculators not independently cross-checked on a second source, and are flagged as softer, single-source data where used. Institutional-ownership percentages likewise vary by vendor depending on methodology.
The IRS transfer-pricing case is treated throughout as ongoing, unresolved litigation. The $6.0 billion figure is a refundable deposit, not a settled liability; the $14 billion figure is a disclosed contingent ceiling under a worst-case scenario extending the Tax Court’s methodology to later tax years, not an amount currently owed; and the $512 million figure is Coca-Cola’s own probability-weighted reserve. These are three different numbers answering three different questions, and this piece has been careful never to collapse them into a single “amount Coca-Cola owes,” and never to suggest the dispute involves fraud or improper conduct rather than a good-faith disagreement over transfer-pricing methodology now before an appeals court.
Now, briefly, the full five-factor read that sits behind the Hold rating stated in the lede. On valuation, the evidence points toward overvalued: at roughly 24 times forward earnings, Coca-Cola carries a 55 to 65 percent premium over PepsiCo and a price-to-earnings-growth ratio near 3 times on 4 to 5 percent organic growth, above its own three- to five-year average multiple though below its ten-year average, with sell-side price targets implying only modest upside from a price already 85 percent up its 52-week range. On growth, the picture reads as roughly average for a mature staple: the company’s own long-term algorithm of 4 to 6 percent organic revenue growth and 7 to 9 percent currency-neutral comparable earnings growth is credible and demonstrated, but fiscal 2025’s unit-case volume was flat, this cycle’s growth has been carried by price and mix, and the current headline is flattered by currency, a solid mid-single-digit grower rather than a compounder priced like one. On quality, the evidence is unambiguous and strongly positive: the asset-light concentrate and royalty model earns roughly 60 percent concentrate gross margin and roughly 31 percent comparable operating margin, converts reliably to strong free cash flow on a clean-year basis, and funds a 64-year unbroken dividend-growth record, the clearest strength in the entire file. On risk, the read is balanced with a modest negative tilt: low day-to-day market risk from a 0.35 beta and defensive positioning sits against genuine, if contingent and unresolved, tail risks in the IRS transfer-pricing dispute, the newly acknowledged weight-loss-drug demand risk to the highest-margin core, ongoing sugar-tax adoption, and two leadership transitions inside the same six-month window. On momentum, the read is mildly positive but stretched: the stock trades above its 20, 50, and 200-day moving averages with a neutral relative-strength reading, consensus analyst sentiment leaning bullish, and low short interest, all sitting inside a 52-week range that is already 85 percent full. Taken together, the quality and momentum strengths are offset by a rich valuation and real, if contingent, risk tails, and the overall lean holds at Hold, a labeled research signal built from the evidence above, not a personal recommendation.
Data-quality flags:
- Ex-US revenue share was corrected from a mistaken ~76 percent to the 10-K’s own ~60 percent; unit-case volume is separately ~84 percent international, and the two figures should never be conflated or substituted for one another.
- The GLP-1 $30-55 billion industry-revenue-at-risk estimate is attributed to J.P. Morgan, corrected from an earlier mistaken attribution to AlixPartners; it is a single analyst house’s forecast, not a consensus or a company disclosure.
- Coca-Cola’s fiscal 2025 10-K newly references weight-loss drugs in its risk factors, without using the term GLP-1 or quantifying a dollar exposure; this is a real but partial disclosure change, not full acknowledgment of the Street’s dollar-value thesis.
- The ~$35 million aluminum/wage cost figure belongs to independent bottler Coca-Cola Consolidated (COKE), not to Coca-Cola parent (KO); corrected throughout to bottler-level framing.
- Currency is a 2026 tailwind (~3-6 points to comparable EPS guidance), not the historical “persistent headwind” framing; currency-neutral, ex-M&A underlying growth is guided at only ~6-7 percent.
- Forward P/E (~23.3-24.9x), EV/EBITDA (~19.4-22.8x), the sell-side consensus rating label, and the low end of the price-target range are all disputed across data vendors and presented here as ranges.
- Free cash flow and dividend-payout-ratio figures are shown on both a reported ($5.3B, including the one-time Fairlife payment) and adjusted ($11.4B, excluding it) basis.
- Total-return-with-dividends-reinvested and sector-ETF (XLP) performance figures rely on single-vendor calculators not cross-checked on a second source.
- The IRS transfer-pricing case is ongoing and unresolved as of this writing (oral argument June 25, 2026, no ruling issued); the $6.0B deposit, the $14B contingent worst-case ceiling, and the $512M booked reserve are three distinct figures that must never be collapsed into a single “amount owed.”
- Nestle and Danone are named only as adjacent diversified-staples context, not as load-bearing comparables, because their current-period financial results were not independently sourced for this analysis.
Key sources: Coca-Cola fiscal 2025 Form 10-K (filed 2026-02-20, SEC EDGAR); Coca-Cola Q1 2026 Form 10-Q and earnings-release exhibits; Coca-Cola 2026 DEF 14A proxy statement; Coca-Cola Q1 2026 and Q4/FY2025 8-K press releases (investors.coca-colacompany.com); stockanalysis.com; finance.yahoo.com; finviz.com; marketbeat.com; GuruFocus; financecharts.com; company filings for PepsiCo, Keurig Dr Pepper, Monster Beverage, Coca-Cola Europacific Partners, Coca-Cola FEMSA, and Coca-Cola Consolidated; J.P. Morgan GLP-1 industry research; Beverage Digest data as reported by the Atlanta Journal-Constitution; Glassdoor.
Prepared June 30, 2026. Figures are point-in-time and will change. This is research and analysis for educational purposes, not investment advice, not a recommendation, and not a solicitation. Consumer-staples valuations move with interest rates and currency as much as with the underlying business, and food and beverage names carry their own regulatory and litigation risks that can change quickly. Verify all figures independently and consult a licensed financial advisor before making any decision.