
Research date: June 25, 2026 | OSINT market research on Intel Corporation (INTC, Nasdaq), the only US company that both designs and manufactures leading-edge logic chips, and the central bet on American semiconductor independence.
Important disclaimer. This article is OSINT research produced for educational and informational purposes only. It is not investment advice, not a recommendation to buy or sell any security, and not a solicitation of any kind. All figures are point-in-time as of the research date (2026-06-25) and move fast - prices, market caps, and share counts will have changed by the time you read this. Do your own due diligence and consult a qualified financial adviser before making any investment decision.
Where this stock could be in 6 months, 1 year, 3 years, and 5 years
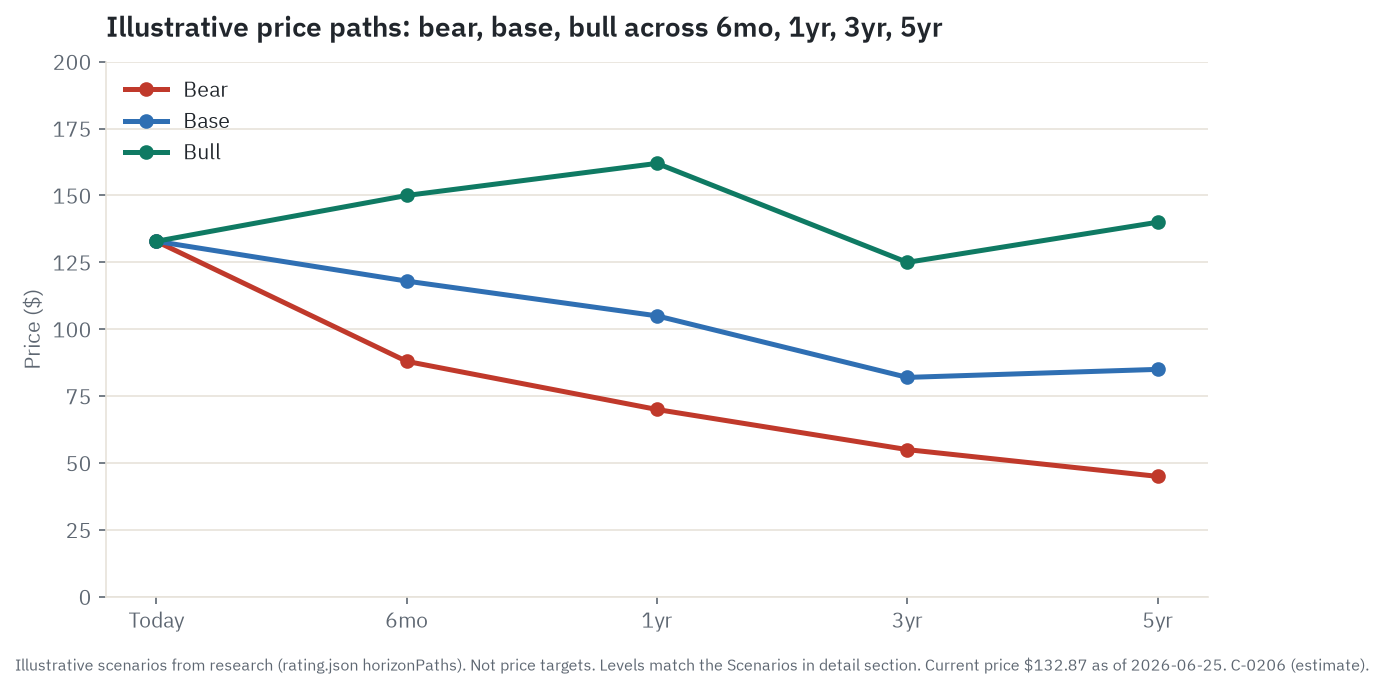
Intel closed at approximately $131.65 on June 24, 2026 (last confirmed close). The research-date reference price is $132.87 (as of June 25, 2026; fast-moving, provider-specific; after-hours $132.72). Market cap at that level is approximately $667.8 billion, as of June 25, 2026. The stock began 2026 somewhere in the mid-$30s and has gained roughly 250 to 260 percent year to date - Barchart shows +260.08 percent; a secondary source shows +217 percent; the gap reflects different base-date conventions, not a fundamental discrepancy in the trajectory. Either way, it is the most dramatic large-cap semiconductor move of 2026. The ranges below are arithmetic on stated assumptions, not predictions. They are here first because they are the answer to the question most readers arrive with.
6 months (approximately December 2026). Two datable events govern this window. Q2 2026 earnings land July 23, 2026, and Intel 14A PDK 0.9 (a Process Design Kit is the toolbox of device models, design rules, and layout constraints that a chip designer uses to build a chip on a specific process; the 0.5 release supports early exploration but does not lock design rules and so cannot bind a customer to capacity; PDK 0.9 locks the rules, enabling customers to finalize chip layouts, submit tape-out runs, and make firm volume commitments - which is why 0.9 is the decision gate that 0.5 is not) is targeted for October 2026, after which named customers are expected to communicate volume decisions. Intel guided Q2 non-GAAP gross margin at 39 percent, down sequentially from the 41 percent Q1 print that surprised Wall Street by 650 basis points. If Q2 comes in at or above the guide, the recovery narrative holds. If it comes in below 37 percent, the Q1 beat starts to look like a one-quarter event rather than a structural turn, and the stock is already trading 37 to 49 percent above the analyst consensus average price target. Base case near $118 (estimate) - the stock digests some of the run while awaiting 14A customer news. Bull near $150 (estimate) - Q2 beats again and at least one named 14A evaluator signals intent. Bear near $88 (estimate) - a gross-margin miss or a macro/rate shock hits a stock that has very little cushion between current price and fundamental support. The single thing most likely to flip this window: the July 23 gross-margin print.
1 year (approximately June 2027). The dominant variable is proof: does Intel 14A attract a commercially meaningful external customer? PDK 0.9 releases in October 2026 and customer capacity decisions follow within months. If NVIDIA, Apple, or a major hyperscaler commits volume to 14A, the foundry thesis has its first real commercial evidence and the stock re-rates toward $162 (estimate). If the major evaluators decline - as NVIDIA declined on 18A - the stock moves toward product-only sum-of-parts territory near $70 (estimate). The base case holds an ambiguous middle: one or two smaller commitments (defense, specialized AI chip designers) that sustain the narrative without proving it, with the stock near $105 (estimate). The flip: a formal press release or SEC 8-K disclosing signed 14A volume commitments.
3 years (approximately June 2029). By the three-year mark, 14A is either in risk production with a named customer or effectively abandoned for commercial use. If Intel has landed Apple M-series chips at 15 to 20 million units per year (the Ming-Chi Kuo analyst estimate, unconfirmed) or an AI chip from a hyperscaler, external foundry revenue reaches $4 to 6 billion annualized and the foundry thesis is commercially real. Bull near $125 (estimate). If foundry progress is partial - one or two smaller customers, external revenue $2 to 3 billion, losses narrowed but not zero - the SOTP-implied equity is near $82 (estimate). If 14A is effectively abandoned and ARM accelerates past 25 percent of server CPU units, products op income erodes and the stock converges toward $55 (estimate). The flip: whether foundry external revenue is tracked in the hundreds of millions or the billions by late 2027.
5 years (approximately June 2031). The structural story resolves here. In the bull scenario, foundry reaches $7 billion or more in external revenue approaching 30 percent operating margins, product segments generate $16 to 18 billion combined operating income, and non-GAAP EPS reaches approximately $2.65 to $3.00. At 50 to 55 times that earnings on a proven national-champion turnaround, the stock reaches roughly $140 (estimate) - which is close to today’s price. That is the uncomfortable arithmetic for bulls: the five-year upside case barely exceeds the current level after five years of execution risk. Base near $85 (estimate) as foundry makes partial progress and SOTP grows slowly. Bear near $45 (estimate) as foundry exits leading-edge manufacturing and ARM erosion compresses product earnings toward $10 to 11 billion.
Where the read lands today. I’d call Intel a Hold here, and here’s why in plain terms: the design business earns real money, the 18A process works, and the government, NVIDIA, and SoftBank have all put capital at risk alongside ordinary shareholders. But at $133 the stock already prices a highly optimistic foundry scenario - roughly $55 per share of foundry option premium above the product-only sum-of-parts - and that option has not produced a single major external commercial customer yet. The five-year bull case barely exceeds today’s price. The bear case sits in the mid-$40s. Neither a strong buy nor a sell; the honest answer is Hold pending the 14A customer outcome, which will likely be clear by year-end 2026.
Companion tool
Jump to the interactive dashboard to sort and filter every company in the Intel ecosystem, or download the Excel model to flex the scenarios yourself.
TL;DR
Intel is the Integrated Device Manufacturer - the one company in the Western world that both designs x86 chips and runs its own leading-edge fabs. Its products business, combining PC client CPUs (CCG) and data-center CPUs (DCAI), generated $12.7 billion of operating income in FY2025. Intel Foundry consumed $10.3 billion of that same year in operating losses, leaving the consolidated company barely profitable on a GAAP basis. The turnaround thesis rests on two bets. First, 18A - a production-ready process with genuinely novel transistor and power-delivery technology - starts attracting external customers who will pay commercial foundry prices for US-made leading-edge chips. Second, DCAI holds or grows AI-host CPU revenue even as AMD takes x86 server share and ARM takes the structural growth layer of new hyperscaler capacity. The US government owns 9.9 percent at a $20.47 cost basis. NVIDIA owns 4.3 percent at $23.28. A preliminary Apple foundry arrangement was publicly referenced by President Trump on June 18, 2026, though neither Apple nor Intel has disclosed signed terms or volume. The stock is up roughly 250 to 260 percent year to date as of June 25, 2026, and trades 37 to 49 percent above the consensus analyst price target of approximately $90 to $96. The near-term binary event is 14A PDK 0.9 in October 2026, after which named customers are expected to communicate capacity decisions. The bull case barely reaches today’s price in five years. The bear case - the Global Foundries scenario where a technically viable process finds insufficient commercial demand - puts the stock in the mid-$40s. The read lands at Hold.
Explore it yourself: the interactive dashboard
Open the dashboard in a full screen
What Intel actually is today
Most companies that make chips do not make the fabs. AMD designs CPUs and sends the orders to TSMC in Taiwan. NVIDIA designs AI accelerators and does the same. The foundry handles the silicon; the chip designer handles the architecture and the go-to-market. Intel has done both under one roof since it was founded in 1968. That integrated model made Intel the most profitable semiconductor company in the world for most of the period between 1990 and 2020.
Then it did not. Between 2016 and 2024, Intel repeatedly failed to hit process-node milestones that TSMC hit on schedule. Chips that Intel said would ship on its own advanced fabs ended up outsourced to TSMC. The PC market that funded the fabs went through a post-pandemic bust. The data-center market Intel once owned was being carved up by AMD. The operating loss at the foundry unit hit $13.4 billion in FY2024. The stock fell from near $57 in early 2021 to $18.97 on August 1, 2025, a drawdown of about 67 percent over four years. By the time the board brought in Lip-Bu Tan as CEO in March 2025, Intel was described in press coverage as the most important company nobody wanted to own.
The Lip-Bu Tan era reset three things. First, the organizational structure: Intel Products (CCG plus DCAI) and Intel Foundry now report as separate segments with arm’s-length transfer pricing between them, so investors can see the design business and the manufacturing business as distinct P&Ls rather than a blended number that obscures both. Second, the cost structure: over 25,000 positions have been cut since August 2024, gross capex was reduced from $23.9 billion in FY2024 to $17.7 billion in FY2025, and Lip-Bu Tan described prior capital spending as “excessive” and committed to a demand-driven investment model. As part of that discipline, Intel cancelled planned fab expansions in Magdeburg, Germany and Wroclaw, Poland in 2024 - both projects had been announced with EU government backing and local political support but were paused before construction commitments were made, concentrating Intel’s advanced-node fab footprint in the United States (Arizona, Ohio, Oregon) and Ireland. Third, the product roadmap: 18A entered high-volume manufacturing (HVM - full commercial-scale wafer production at production yields, meaning the process is stable enough to fill real customer orders) at Fab 52 in Chandler, Arizona in December 2025, on schedule. Panther Lake - the first 18A-based PC CPU - launched at CES 2026 with over 200 OEM designs planned. Clearwater Forest, the first 18A-based server CPU, launched at Computex in June 2026. These are real products shipping on a new process node, not roadmap slides.
What Intel is today, then, is a company mid-way through a restructuring. The design business is healthy and profitable. The foundry is still losing billions annually but losing less than it was. The fundamental question - whether the foundry can attract enough external commercial customers to cover its fixed cost base - has not been answered yet. That unanswered question is what makes the current price both interesting and dangerous.
How the money flows
flowchart TD
    PCOEM["PC OEMs: Lenovo / HP / Dell\nUSD 32.2B CCG revenue FY2025\nIntel 70% x86 PC units Q1 2026"]
    DCHYP["Hyperscalers + Enterprise\nUSD 16.9B DCAI revenue FY2025\nIntel 67% x86 server units Q1 2026"]
    EXTC["External Foundry Demand\nMicrosoft Maia2 / AWS AI Fabric / Apple M-series\nNear-zero revenue today; binary bet"]
    INTLP["Intel Products CCG + DCAI\nUSD 49B revenue / USD 12.7B op income FY2025\nDesign IP + go-to-market for x86"]
    TSMCOUT["TSMC outsourced compute tiles\nN3/N4 tiles for Lunar Lake etc.\nIntel pays rival to make its own chips"]
    INTLF["Intel Foundry\nFab52 AZ 18A + Fab34 Ireland Intel4\nUSD 17.8B rev / USD 10.3B op loss FY2025"]
    PACKAG["Intel Advanced Packaging\nFoveros 3D stacking + EMIB 2.5D\nIn-house differentiator vs TSMC CoWoS"]
    ASML["ASML EUV Lithography\n100% EUV market share; USD 220-400M per tool\nSole source; 18-24 month lead time"]
    WFE["Deposition Etch Metrology\nApplied Materials / Lam Research / KLA / TEL\n4-firm oligopoly; every node requires all 4"]
    WAFER["Silicon Wafers 300mm\nShin-Etsu Chemical / SUMCO Japan\nCombined ~60% global supply"]
    SUB["ABF IC Substrates\nIbiden / Shinko Electric Japan\n~50-60% advanced substrate share"]
    CHEM["EUV Photoresists + Specialty Gases\nJSR / Shin-Etsu Chem / TOK\nJSR ~60% EUV resist market"]

    PCOEM -->|CPU purchase orders| INTLP
    DCHYP -->|Server CPU and AI chip orders| INTLP
    EXTC -->|Wafer service agreements| INTLF
    INTLP -->|Internal wafer orders transfer-priced at market| INTLF
    INTLP -->|Outsourced tile orders| TSMCOUT
    INTLF -->|Chiplets packaged in-house| PACKAG
    INTLF -->|EUV scanner capital purchases| ASML
    INTLF -->|Deposition etch inspection tools| WFE
    INTLF -->|Blank wafer purchases| WAFER
    INTLF -->|Substrate orders| SUB
    INTLF -->|Chemical and resist purchases| CHEM
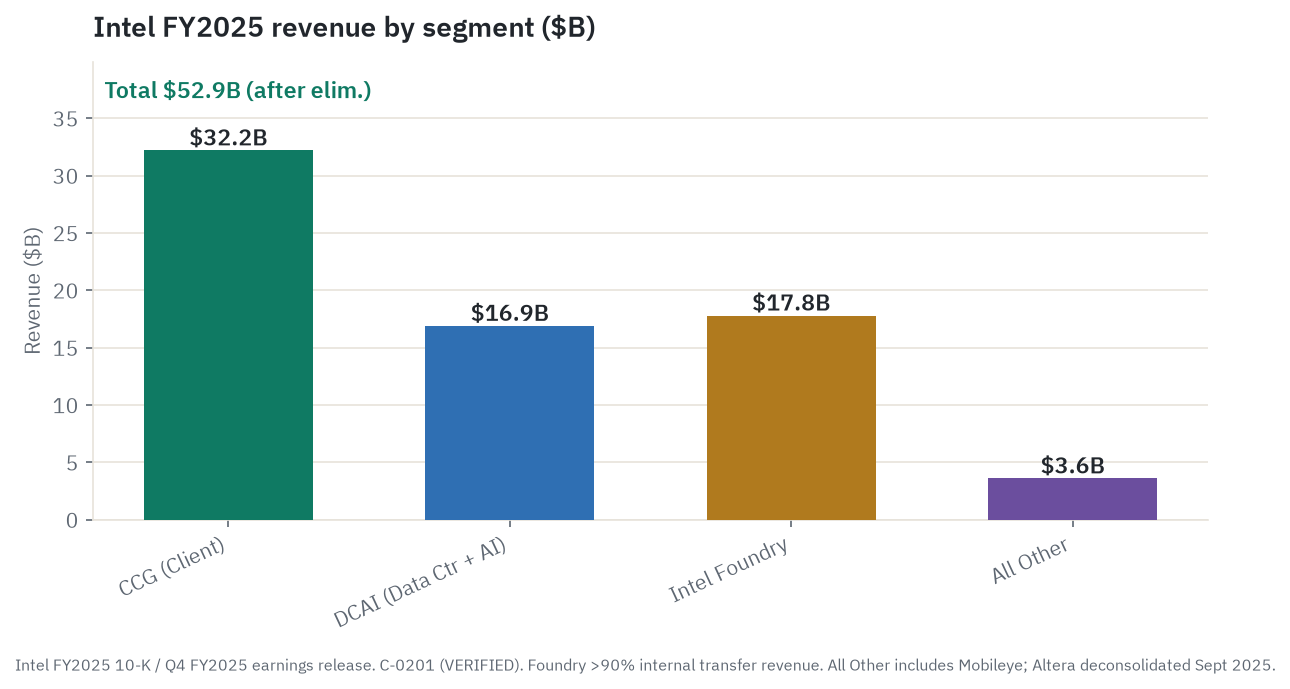
Money enters Intel from three demand pools. PC OEMs (Lenovo, HP, Dell) buy client CPUs through the CCG segment - $32.2 billion in FY2025. Hyperscalers and enterprise IT departments buy server CPUs and AI-adjacent chips through DCAI - $16.9 billion in FY2025. External foundry customers pay Intel to manufacture their chips on Intel’s leading-edge processes - currently a rounding error in the P&L but the entire thesis.
Intel sits in the middle as both designer and manufacturer. The design side buys wafers from the foundry side at arm’s-length transfer prices, so the same silicon shows up as foundry revenue and product cost simultaneously. This internal accounting loop makes Intel’s consolidated P&L harder to read than AMD’s or TSMC’s, because two-thirds of foundry revenue is essentially Intel talking to itself. The external customers - Microsoft for its Maia 2 AI chip, AWS for a custom AI fabric chip, the US Department of Defense for classified processing - are the signal that matters. All the way down the stack, Intel sources equipment from ASML (the only company on earth that makes EUV lithography machines), deposition and etch tools from Applied Materials, Lam Research, and KLA, and wafers from Japanese suppliers Shin-Etsu and SUMCO. This supply chain is global, fragile in a few chokepoints, and runs years ahead of production.
Unlike a fabless company like AMD, Intel captures both the design margin and the manufacturing margin. The cost is that it also absorbs both sets of capital expenditure and operational risk. When both sides run at full utilization with a healthy customer book, the IDM model is the most profitable structure in semiconductors. When one side is half-empty, as the foundry is today, it is a cash furnace.
The business segments
Client Computing Group (CCG)
CCG makes the PC CPUs that go into laptops and desktops sold by Lenovo, HP, Dell, and hundreds of other OEMs. In FY2025 it was Intel’s largest segment at $32.2 billion in revenue, generating $9.3 billion in operating income at roughly a 29 percent margin. Those are solid numbers from a segment that has no real competition outside AMD Ryzen.
The near-term pressure is real, though. PC unit volumes declined roughly 11 percent in 2026, per IDC forecasts, as memory shortages from AI’s insatiable appetite for HBM redirected DRAM wafer capacity and pushed consumer PC prices up. Enterprise fleets completed most of their Windows 10 end-of-life refresh in 2024 and early 2025, and that tailwind is now behind us.
The medium-term thesis for CCG is the AI PC wave. Intel’s Panther Lake, launched January 2026 on the 18A process, carries a 50-TOPS neural processing unit. Gartner projected that 100 percent of commercial PC purchases will be AI PCs by end of 2026, meaning systems with dedicated NPU silicon capable of running on-device AI inference. Whether enterprises actually deploy AI PC workloads fast enough to drive ahead-of-cycle replacement purchases is less clear - enterprise procurement still weights price and manageability ahead of NPU TOPS count - but the structural direction points toward higher ASPs and an eventual replacement wave that benefits Intel. Intel held 70.4 percent of x86 client CPU units in Q1 2026 per Mercury Research, so the installed base is largely theirs to defend.
In the client market, AMD’s Ryzen AI 300 series is a genuine competitor at the premium laptop tier, and Qualcomm’s Snapdragon X Elite holds roughly 10 percent of the US premium Windows PC market (Qualcomm’s own Q1 2025 earnings claim; not independently verified by third parties). Windows-on-ARM is real but its total market share remains small: Qualcomm sold approximately 720,000 Snapdragon X PCs in Q3 2024, about 0.8 percent of total global PC shipments per IDC/Mercury Research methodology. The ARM threat in client is medium-term and real, but it is not yet eating into Intel’s unit share at a pace that changes the near-term earnings profile.
Data Center and AI (DCAI)
DCAI is Intel’s growth engine as of Q1 2026. The segment generated $5.1 billion in Q1 2026, up 22 percent year over year, and $16.9 billion across FY2025, up about 5 percent on a restated comparable basis. (A segment definition change absorbed Network and Edge into DCAI in 2025; the earlier as-reported FY2024 DCAI figure of $12.8 billion is not directly comparable and should not be treated as the base for a 32 percent organic growth calculation.)
The Q1 2026 acceleration reflects something structural: every AI server rack requires host CPUs alongside the GPU accelerator cards, and AI-rack deployments are scaling rapidly as hyperscalers spend $490 to 540 billion on AI infrastructure in 2026 alone. Intel’s Xeon 6 is the host CPU in NVIDIA’s DGX Rubin NVL8 AI server system, confirmed at GTC 2026. That puts Intel CPUs inside the most widely deployed AI server platform in the industry. This is CPU-attach revenue, not AI accelerator revenue - an important distinction - but it is real and growing.
Within DCAI, custom ASIC revenue (chips Intel designs for specific hyperscaler workloads, distinct from standard Xeon) more than doubled to over $1 billion in annual run rate by Q1 2026 per management commentary on the earnings call. That is a new and growing revenue line.
The competitive problem in server CPUs is that AMD is winning the premium end. AMD EPYC Turin reached a record 46.2 percent of x86 server CPU revenue in Q1 2026 per Mercury Research, while Intel’s x86 server CPU revenue share fell to 53.8 percent. On units, Intel held 66.8 percent, down from 72.8 percent a year earlier. AMD is winning because AWS M8a (EPYC Turin) delivers roughly 1.6 times the compute performance of M8i (Intel Granite Rapids) at 30 percent lower cloud operating cost, per AWS’s own data. Intel’s price premium is hard to justify when the performance deficit is that visible.
Intel’s planned response is Diamond Rapids (Xeon 7), confirmed at Computex 2026 for a 2027 launch on the 18A-P process. 18A-P is a production-optimized refinement of 18A: it incorporates yield and performance improvements derived from the initial 18A ramp and is intended to serve high-volume product applications like data-center CPUs. Because 18A-P is newer than 18A and has not yet completed ramp validation, it sits at an earlier production stage - risk production - even though 18A has already reached HVM. Diamond Rapids is designed with 256-plus P-cores (Performance cores - Intel’s high-frequency, full-featured CPU cores; E-cores, or Efficiency cores, are smaller sibling cores that handle background workloads at lower power and clock speed) per socket, PCIe 6.0, and 1.6 terabytes per second of memory bandwidth, roughly twice what Granite Rapids offers. Intel asserts it will beat AMD Turin Refresh on the workloads where it has been losing share. No independent third-party benchmark had validated that claim as of the research date.
The deeper problem Diamond Rapids cannot solve is ARM. ARM-based server CPUs reached approximately 17.7 percent of total server CPU units in Q1 2026 per Mercury Research, nearly doubling year over year, driven by NVIDIA Grace CPUs inside Blackwell NVL72 racks and AWS Graviton5. Arm Holdings stated that approximately 50 percent of new CPU capacity shipped to major hyperscalers in 2025 was ARM-based. The math suggests that Intel and AMD are competing for less than half of new hyperscaler server deployments. A better Xeon competes only for the x86 portion; it cannot win back the structural shift to custom ARM silicon that hyperscalers are choosing to design in-house.
On AI accelerators, Intel’s Gaudi 3 is a niche product at best. It failed to reach the $500 million H2 2024 revenue target management set under prior CEO Pat Gelsinger - the miss was confirmed at the Q3 2024 earnings call, with the exact shortfall figure not disclosed. An independent benchmark test by Aquatron and Los Alamos National Laboratory found NVIDIA H200 was approximately nine times faster than Gaudi 3 on Llama 3.1 405B inference inference (roughly 25 tokens per second versus 2.7 tokens per second). That benchmark represents a single independent test and the methodology should be read in context, but the performance gap is consistent with the commercial result: Gaudi 3 deployment is limited to IBM Cloud, select enterprise private clouds, and government workloads where NVIDIA is either too expensive or supply-constrained.
Falcon Shores, the planned Gaudi successor, was cancelled for commercial release in January 2025 - Intel’s third consecutive cancelled datacenter GPU program after Rialto Bridge and Ponte Vecchio. The next bet is Jaguar Shores, a rack-scale disaggregated AI system on 18A with SK Hynix HBM4 and silicon photonics interconnects. Intel targeted H2 2026 volume production for Jaguar Shores; most analyst commentary expects 2027, given the combination of 18A process ramp with an unprecedented system architecture. No external customer has committed to Jaguar Shores as of the research date.
The more credible Intel AI story is CPU attachment. Xeon 6 in NVIDIA’s AI racks, custom ASIC revenue, and sovereign/government AI workloads where NVIDIA’s supply constraints or US-export requirements make Intel a practical necessity.
Intel Foundry
Intel Foundry is the manufacturing business. In FY2025 it reported $17.8 billion in revenue at a negative $10.3 billion operating loss - a 58 percent negative operating margin. This is the segment that consumes almost all the profit the design businesses generate. The FY2024 operating loss was approximately $13.4 billion, so FY2025 represents meaningful narrowing, but $10.3 billion is still a very large annual burn.
Two things are critical to understand about Intel Foundry’s revenue. First, more than 90 percent of it is internal transfer pricing - Intel Products paying Intel Foundry for wafers at arm’s-length simulated market rates. External wafer revenue from paying outside customers was $307 million for all of FY2025, and $174 million in Q1 2026 alone, annualizing to under $700 million. The entire foundry commercial thesis rests on growing that $700 million annualized run rate to “low-to-mid single-digit billions” in external wafer revenue - the level Intel’s CFO stated at the J.P. Morgan Global Technology Conference would put the foundry at operating breakeven. The 2027 breakeven is a management target, not a guarantee.
Second, Intel Foundry held $32.7 billion in total liquidity as of March 28, 2026 per the Q1 2026 10-Q, and no going-concern language appears in the FY2025 10-K. Intel is not in financial distress. It funded the foundry build-out with $15.9 billion in strategic equity raised in H2 2025 (US government, SoftBank, NVIDIA). The burn is real; the existential risk is not.
The foundry’s confirmed external customers are: Microsoft (Maia 2 AI accelerator chip on 18A-P - the most commercially significant external commitment), AWS (custom AI fabric chip on 18A under a multi-year multi-billion framework announced September 2024 via Intel 8-K), and the US Department of Defense (Secure Enclave program, up to $3 billion for domestic defense chips over multiple years). NVIDIA tested 18A in 2025 and stopped moving forward, citing a density gap versus TSMC N2 and the need for TSMC’s more mature ecosystem for large GPU dies. Broadcom is testing. NVIDIA and AMD are reported to be evaluating 14A; no commitment from either has been announced.
A preliminary foundry arrangement between Intel and Apple was publicly referenced by President Trump on June 18, 2026, and first reported by The Wall Street Journal in May 2026. As of June 25, 2026, neither Apple nor Intel has publicly disclosed the terms, confirmed volume, or named a product. Analyst Ming-Chi Kuo (TF International Securities, May 2026) estimated initial volumes of 15 to 20 million units per year for lower-end M-series chips on the 18A-P node beginning H2 2027, but that estimate has not been independently confirmed. This arrangement must be treated as a reported preliminary discussion, not a signed customer commitment.
On June 8, 2026, The Information reported - citing two unnamed sources, with Bloomberg and Reuters subsequently citing that report - that Google had placed a foundry order with Intel for more than 3 million tensor processing units (TPUs), with delivery targeted before 2028. The process node was not identified in any primary source; some analyst commentary assumed Intel 18A, but the node remains unspecified. Intel’s EMIB advanced packaging technology, which has reportedly achieved approximately 90 percent yield, was also cited as part of the arrangement. Neither Intel nor Google confirmed the deal in any press release, SEC 8-K, joint announcement, or investor relations communication as of June 25, 2026. The stock rose approximately 11 percent on June 8 on the unconfirmed report. If confirmed at those volumes, this would be Intel Foundry’s largest AI chip production commitment from a mainstream cloud provider. It must be treated as an unconfirmed press report until either company files or makes a joint public statement.
Ohio One - the 14A fab campus in New Albany, Ohio - broke ground in September 2022. Original target was first fab operational in 2025; current target is 2030 to 2031, with a committed investment now exceeding $28 billion. Construction has gone vertical on Fab 1’s above-ground structure, with over 6.4 million labor hours logged. The timeline has slipped roughly five years from the original announcement. That is not a failure of construction; it is a deliberate choice to slow capital deployment until external customer demand justifies acceleration.
Mobileye (MBLY)
Intel holds approximately 85 percent of Mobileye, the Advanced Driver Assistance Systems company that went public in October 2022. Mobileye’s EyeQ chips are embedded in roughly 27 OEM brands, covering everything from lane-keep assist to highway pilot features. At Mobileye’s current price of approximately $7.77 per share (as of June 25, 2026, 52-week range $6.47 to $20.18), Intel’s stake is worth roughly $5.57 billion.
In Q1 2026 Mobileye reported $558 million in revenue, up 27 percent year over year, and raised its FY2026 revenue guidance to roughly $1.975 billion midpoint. The GAAP result included a $3.788 billion non-cash goodwill impairment linked to Intel’s 2017 acquisition premium. Mobileye faces intensifying competition from NVIDIA DRIVE Thor, which is winning premium autonomous-driving mandates at OEMs like BYD and Hyundai. Intel could eventually monetize its stake via secondary sales (it sold approximately 4 percent for roughly $0.9 billion in FY2025) or a full spin-out, but no formal timeline has been announced.
Altera (formerly PSG)
Intel sold 51 percent of its Altera FPGA business (FPGAs - Field-Programmable Gate Arrays - are chips whose internal logic circuits can be reconfigured by the customer after manufacture, used widely in telecommunications equipment, defense systems, and industrial controls) to Silver Lake in September 2025, at an enterprise value of $8.75 billion, with proceeds of approximately $3.3 billion for the majority stake. Altera was deconsolidated from Intel’s P&L on September 12, 2025. Intel retains 49 percent, worth approximately $4.3 billion at the September 2025 transaction price (that figure is stale; Altera is targeting a 2026 IPO and no updated valuation has been publicly disclosed). The sale removed Altera’s operating losses from Intel’s consolidated income statement and generated capital for the foundry program.
In the FPGA market, AMD/Xilinx holds roughly 51 percent share, Altera roughly 29 percent, and Lattice roughly 7 percent per Gartner estimates from late 2025.
The process-technology bet: “five nodes in four years”
The roadmap sequence
Intel’s “five nodes in four years” plan committed the company to moving from Intel 7 (the process behind Raptor Lake and early data-center chips) through Intel 4, Intel 3, 18A, and 14A between 2023 and 2026. Calling each step a “node” is partly marketing - the industry’s node naming has not tracked physical gate lengths since roughly the 22nm era - but the performance improvements at each step are real and verified.
18A is where the roadmap delivers something genuinely new. The two innovations built into 18A are RibbonFET and PowerVia.
RibbonFET is Intel’s implementation of gate-all-around (GAA) transistors. In the previous FinFET architecture (used in Intel 7 and Intel 4), the transistor gate wraps around three sides of a fin-shaped silicon channel. In a GAA design, horizontal silicon ribbons replace the fin, and the gate surrounds the channel on all four sides. This gives tighter electrostatic control, reduces leakage current, and allows better performance at smaller geometries. The physical analogy is the difference between a pipe valve that only grips three sides of the pipe versus one that grips the whole circumference. Samsung’s SF2 node and TSMC’s N2 use the same GAA architecture (they call their implementations MBCFETs and NSFETs respectively), so Intel is not alone in deploying GAA at leading edge. The IEEE IEDM 2024 paper on Intel 18A - a primary technical source from the standard-setting conference for semiconductor engineering - confirms the gate length at 6 nanometers and channel thickness at 1.7 nanometers.
PowerVia moves the power delivery network from the front surface of the wafer to the back. Every chip needs power rails - metal wires that deliver electricity to the transistors. Traditionally these rails run on the same surface as the signal wires, competing for routing space and causing voltage drop across the chip. Moving them to the back frees the front for signal routing, reduces the distance electricity must travel to reach each transistor, and cuts dynamic voltage droop. Intel’s VLSI Symposium 2026 data shows 11 percent routed area reduction and 10 times lower dynamic voltage droop versus front-side power delivery, with up to 6 percent frequency uplift or greater than 15 percent dynamic power reduction. No other leading foundry - not TSMC on N2, not Samsung on SF2 - has combined backside power delivery with GAA transistors in a production chip as of mid-2026. That is Intel’s specific technical differentiation.
The honest caveats: the 18A performance figures (18 percent better performance at iso-power versus Intel 3, 30 percent density improvement) are Intel’s own measurements, not independently replicated. TechInsights, the third-party silicon analysis firm, rated Intel 18A at 2.53 on its proprietary performance/power efficiency scale versus TSMC N2’s 2.27 - giving Intel an edge on efficiency. But on transistor density, TSMC N2 HD achieves approximately 313 million transistors per square millimeter versus Intel 18A’s roughly 238 million, a 31 percent density gap. Density matters for large compute chips: at the same wafer price, TSMC N2 HD gives external customers more functional die per wafer.
18A yield and customer status
18A yield is estimated at roughly 55 to 65 percent by mid-2026, based on analyst cross-checks from Electronics Weekly and industry commentary. Intel has not published an official yield figure. Intel’s CFO guided “appropriate yields by end of 2026.” Tom’s Hardware reported management expects “industry-standard levels” by 2027. The target for high-volume manufacturing maturity is typically 75 percent or above.
The yield gap matters commercially. A 10-percentage-point yield gap at an estimated $25,000 per wafer (an industry estimate; Intel has not disclosed pricing) equals roughly $2,500 in additional wasted cost per wafer compared to TSMC. For large AI GPU dies where a single good chip might be worth $10,000 or more, every extra defective die is a meaningful cost penalty. This is the specific reason NVIDIA tested 18A and chose not to commit: NVIDIA’s GPU dies are large enough that the density deficit and yield immaturity at launch outweighed the PowerVia routing advantage.
Intel 18A-P - a production-optimized refinement of 18A that incorporates yield and performance improvements from the initial 18A ramp - entered risk production on June 16, 2026. Risk production is the stage of limited, controlled wafer runs where the process is validated on real chip designs before scaling to full commercial output; it sits earlier in the manufacturing lifecycle than HVM, where a process runs at full commercial wafer volumes for paying customers. The point matters here: 18A has already reached HVM (Fab 52, December 2025), while 18A-P entering risk production in June 2026 means it is a newer process stage than 18A but at an earlier commercialization point - a normal sequencing as Intel iterates the process recipe. Clearwater Forest (the 288-core server Xeon) is shipping on 18A. Panther Lake (the client AI PC CPU) launched on 18A in January 2026. These are real Intel products on Intel’s own process, which is itself a recovery from the years when Intel was outsourcing key chip tiles to TSMC.
14A and High-NA EUV
14A is where Intel believes it can fully close the gap with TSMC for external foundry customers. The node is the first at Intel to mandate High-NA EUV lithography - the ASML EXE:5200B machine that operates at 0.55 numerical aperture instead of the standard 0.33, enabling up to 1.7 times smaller features and a 2.9 times density improvement over standard EUV. Intel installed its first production EXE:5200B at Hillsboro, Oregon in December 2025. ASML charges approximately $380 to 400 million per unit for the EXE:5200B (press sources based on Samsung pricing data; ASML has not published a list price). Intel is one of the earliest and largest committed buyers of High-NA EUV.
PDK 0.5 has been distributed to two unnamed prospective external customers per Lip-Bu Tan’s Q4 2025 earnings disclosure. PDK 0.9 - the version that locks design rules and allows customers to finalize tape-out (the point at which a chip design is frozen and submitted to the fab for first silicon manufacturing runs, effectively committing both the customer and the fab to production capacity) and firm volume decisions - is targeted for October 2026. The Intel FY2025 10-K explicitly flagged potential “pause or discontinuation” of 14A development if no significant external customer is secured. That is rare language from a risk-factors section; companies reserve it for scenarios they believe are genuinely plausible.
Risk production for 14A is planned for 2027 (management target). High-volume manufacturing is planned for 2028 to 2029 (a target timeline; no production commitment yet). Ohio One Fab 1 - the first 14A fab - is now targeted for operational status in 2030 to 2031, compared with an original 2025 target.
Two ecosystem signals from June 2026 are meaningful for the 14A customer pipeline. On June 8, 2026, Cadence Design Systems announced a multi-year Design Technology Co-Optimization (DTCO) collaboration with Intel Foundry specifically for the 14A node - combining Cadence’s AI-driven EDA tools and design IP with Intel’s process expertise to build certified design flows, PDK libraries, and methodologies for HPC and mobile chip designs. This follows a parallel Synopsys DTCO engagement that covers Intel 18A. The significance: chip designers cannot commit to tape-out on a new process node until their EDA toolchain has certified flows validated against that node. Having both major EDA houses - Synopsys for 18A, Cadence for 14A - partnered with Intel Foundry removes a technical barrier that prospective customers would otherwise cite as a reason to delay capacity decisions.
In April 2026, Intel joined the Terafab project alongside Tesla, SpaceX, and xAI. The Terafab initiative - announced by Elon Musk in March 2026 and planned for a full-scale facility in Grimes County, Texas (with a prototype near Tesla’s Gigafactory Texas in Austin) - aims to produce more than 1 terawatt per year of AI compute capacity. Intel made a corporate statement on April 7, 2026: “Intel is proud to join the Terafab project with SpaceX, xAI, and Tesla to help refactor silicon fab technology.” Intel’s 14A process is slated for the full-scale Grimes County facility. This is a stated manufacturing collaboration, not a disclosed wafer purchase contract; no binding volume, revenue, or timeline commitments have been made public by any party.
Why the bet is high-stakes
Leading-edge fabs cost $15 to 25 billion to build and equip. Once built, the depreciation accrues whether the fab runs at 40,000 wafer starts per month or 5,000. A simple utilization table makes the economics stark: at 40 percent utilization of a $18 billion fab producing $25,000 wafers, the annual revenue of roughly $4.8 billion does not cover fixed costs plus variable costs, and the fab loses money indefinitely. At 80 percent utilization, the same fab generates roughly $9.6 billion in annual revenue against approximately $6.5 billion in total costs, producing a healthy operating profit. Intel Foundry today is operating somewhere in the 40 to 60 percent utilization range for leading-edge capacity, based on the implied arithmetic from the reported loss. Every incremental wafer above the internal Intel Products fill rate contributes nearly 100 cents on the dollar to loss reduction, because the fixed costs are already sunk.
Management’s statement that breakeven requires only “low-to-mid single-digit billions” in annual external wafer revenue is arithmetically correct, given that most of the fixed-cost base is already covered by internal transfers. The problem is that $700 million in annualized external revenue needs to grow three to five times in roughly 18 months for the 2027 breakeven target to hold, and not a single major commercial customer has yet committed to 14A volume.
Competitive map
Intel vs AMD in x86 CPUs
AMD is winning the enterprise server CPU market at the premium tier, and the trend accelerated sharply in Q1 2026. AMD reached 46.2 percent of x86 server CPU revenue in Q1 2026, an all-time record, while Intel’s server CPU revenue share fell to 53.8 percent on units and lower on revenue. The gap between AMD’s unit share (33.2 percent) and revenue share (46.2 percent) tells the real story: AMD is systematically winning the most expensive deployments. On AWS, the M8a instance (EPYC Turin) delivers about 1.6 times the performance of M8i (Intel Granite Rapids) at 30 percent lower cloud operating cost. Azure uses AMD’s custom EPYC 9V64H for HPC workloads with 6.7 terabytes per second of HBM3 bandwidth. Database workloads, HPC codes, and video transcoding are the areas AMD wins most consistently on benchmark tests.
Intel’s near-term competitive response is Clearwater Forest (Xeon 6+), launched Computex June 2026, with 288 E-cores on 18A. Intel claims 30 percent better performance per thread and 30 percent better power efficiency versus AMD EPYC 9965. Independent benchmarks from Phoronix, AnandTech, or NextPlatform had not yet validated those claims as of the research date; treat them as Intel-asserted pending third-party confirmation.
The medium-term response is Diamond Rapids (Xeon 7), confirmed for 2027 on 18A-P. If Diamond Rapids delivers on the architectural specifications - 256-plus P-cores, PCIe 6.0, 1.6 terabytes per second memory bandwidth - and if 18A-P yields are at manufacturing maturity by 2027, Intel has a credible path to stabilizing server CPU share. Whether it can actually reclaim premium cloud workloads from AMD EPYC depends on performance-per-dollar at real enterprise deployment conditions, not benchmark claims.
What Diamond Rapids cannot address is the ARM displacement. AMD is Intel’s rival in x86; ARM is Intel’s structural ceiling. Every percentage point of total server CPU market that migrates to ARM-based designs (Grace, Graviton, Cobalt, Axion) reduces the revenue pool that Intel and AMD share. By Q1 2026, ARM held roughly 17.7 percent of all server CPU units. Arm Holdings’ own data indicates approximately 50 percent of new CPU capacity additions at major hyperscalers in 2025 were ARM-based. Even if Intel holds 67 percent of x86 server units, 67 percent of a declining share of total server CPU spend is not a stable franchise over a five-year horizon.
In the PC client market, Intel held 70.4 percent of x86 client units in Q1 2026 per Mercury Research. AMD held 29.6 percent, at a record high, with strong gains in mobile. The PC market as a whole faces a 2026 unit decline of roughly 10 to 11 percent (IDC and Gartner forecasts), with recovery pushed to 2028 as AI memory-chip demand continues to divert DRAM wafer capacity away from consumer DRAM. Intel’s CCG revenue is partially insulated by AI PC ASP uplift, but unit volume headwinds are real.
Intel vs NVIDIA in AI compute
NVIDIA has roughly 80 to 90 percent of discrete AI accelerator revenue, per Silicon Analysts estimates, backed by the CUDA software ecosystem that has roughly 15 years of optimization depth for training and inference workloads. Intel holds less than 1 percent of the AI accelerator market. Gaudi 3 is priced competitively at approximately $15,625 per chip versus H100 at roughly $30,000, but at any price the performance gap on large frontier model inference is severe, per the LANL/Aquatron benchmark data.
The NVIDIA-Intel relationship is more partnership than pure competition today. NVIDIA’s $5 billion equity investment in Intel (completed December 2025, approximately 215 million shares at $23.28; FTC cleared December 2025) covers three collaboration areas: Intel manufactures custom x86 CPUs for NVIDIA AI infrastructure platforms, Intel and NVIDIA are building an x86 RTX SoC (combining Intel CPU and NVIDIA GPU chiplets) for high-end AI PCs, and NVLink integration connects the two architectures in server deployments. This is a CPU partnership, not a foundry agreement for NVIDIA GPUs; NVIDIA has not committed to manufacturing Blackwell or its successors on Intel processes. Declining to manufacture GPUs on 18A while investing $5 billion in Intel as a CPU partner is a rational strategy for a company that wants strong x86 host CPU partners alongside its own GPU platforms.
Where can Intel realistically compete in AI? The credible near-term addressable segments are: CPU attachment to GPU clusters (Xeon 6 in DGX Rubin NVL8), custom ASIC design wins within DCAI (over $1 billion annual run rate by Q1 2026 and growing), sovereign AI and government inference workloads (where US-soil manufacturing is a genuine requirement), and price-sensitive enterprise inference at moderate scale where Gaudi 3’s $15,625 price point beats H100 even with the performance penalty.
Intel vs TSMC in foundry
TSMC is the world’s largest contract chip manufacturer with roughly 60 percent of global foundry revenue. In Q1 2026, TSMC reported $35.9 billion in revenue, up 35 percent year over year, at a 66.2 percent gross margin. Intel Foundry, at negative 58 percent operating margin, is at the opposite end of the foundry economics spectrum.
TSMC’s specific advantage is a mature, trusted multi-customer foundry built over 35-plus years, with proven multi-node yields, a deep CoWoS advanced packaging platform, and a customer base that includes virtually every significant fabless chip company. TSMC N2 is entering volume production in 2026, with CoWoS packaging capable of combining HBM memory directly adjacent to logic dies. Intel 18A has the PowerVia backside power advantage; TSMC N2 has the density advantage.
Intel’s commercial differentiation against TSMC comes in two specific areas. US corporate ownership - Intel is a Delaware company; TSMC Arizona is a subsidiary of a Taiwanese company with fiduciary obligations to Taiwan - matters to US government and defense customers, and matters structurally in any scenario involving Taiwan supply-chain risk. TSMC Arizona does not carry the same national-security positioning as Intel Chandler, regardless of its location. The second differentiator is process lead: Intel 18A (in HVM at Fab 52, Chandler) is more advanced than anything TSMC currently has in Arizona. TSMC Arizona Phase 1 produces N4/N5, and Phase 2 (N3, targeted H2 2027) and Phase 3 (N2/A16, targeted approximately 2029 to 2030) will progressively narrow the technology gap. Intel’s “only US leading-edge fab” story has roughly three to four years of shelf life for commercial customers who have the option of waiting for TSMC Arizona N2.
For commercial fabless customers who can choose TSMC, the honest comparison is: TSMC N2 offers better density now, a more mature ecosystem, and a track record. Intel 18A offers PowerVia (uniquely better power integrity), a US-soil domestic address, and access to 14A (potentially density-competitive with TSMC A14) on a timeline starting 2028. The customer decision on 14A is the thing most worth watching.
Intel vs ARM architecture
ARM is not a competitor in the traditional sense - it licenses the instruction set and core designs, but does not manufacture or directly design system-on-chips. Its threat to Intel is architectural: ARM cores (Cortex-A, Neoverse) are winning the workloads that are growing fastest (AI inference orchestration, cloud-native scale-out) while x86 defends workloads that are growing more slowly or shrinking (single-threaded latency-sensitive compute, legacy enterprise application servers).
The enterprise software installed base is Intel’s strongest defense. SAP, Oracle, SQL Server, VMware, and hundreds of enterprise ISV products are certified and optimized for x86. Migrating a large enterprise data center to ARM is a multi-year project with real recompilation, recertification, and testing costs. That inertia is why Intel DCAI still grows even as ARM takes new hyperscaler capacity: the existing x86 installed base is sticky, and it generates CPU refresh revenue as each generation of Xeon replaces the prior.
The ceiling Intel cannot raise is the structural one. Every new AI rack where a hyperscaler chooses Graviton5, Grace, or Cobalt over Xeon sets an endpoint for Intel’s future CPU refresh cycle in that rack. The process compounds: as ARM’s installed base grows, the ISV certification ecosystem follows, the inertia argument weakens, and Intel’s defense shrinks. This is a 5 to 10 year dynamic, not a quarterly earnings story, but it is the most important structural factor limiting DCAI’s long-run revenue ceiling.
Financials from the filings
Income statement
Intel’s revenue has been essentially flat at $52.9 to 53.1 billion for two consecutive fiscal years (FY2024 and FY2025). The four reporting segments are CCG, DCAI, Intel Foundry, and “All Other” ($3.6 billion in FY2025). The All Other segment consists primarily of Mobileye - still fully consolidated in Intel’s financials through FY2025, because Intel’s retained 85 percent majority meets the GAAP consolidation threshold regardless of the minority float from Mobileye’s IPO - plus corporate-level items and residual legacy businesses; it does not represent a distinct product revenue stream. The mix inside that flat-top line has shifted significantly: DCAI grew while CCG softened, and Foundry (almost entirely internal transfers) grew as well. Q1 2026 broke the stagnation: revenue came in at $13.6 billion, up 7 percent year over year, beating the high end of guidance by $0.9 billion.
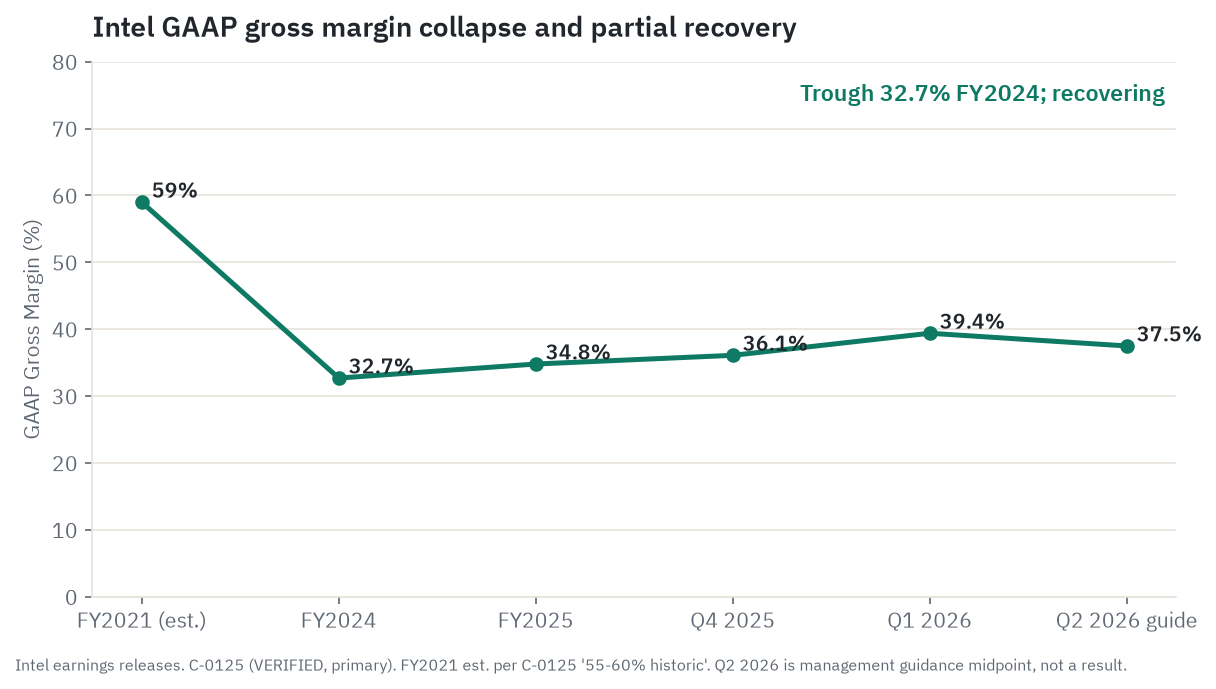
Gross margin is the most watched number in the recovery story. GAAP gross margin collapsed from roughly 55 to 60 percent historically to 32.7 percent in FY2024, the trough. FY2025 recovered to 34.8 percent GAAP and 36.7 percent non-GAAP. Q1 2026 jumped to 39.4 percent GAAP and 41.0 percent non-GAAP, beating Q1 guidance of 34.5 percent non-GAAP by 650 basis points. That 650-basis-point guidance beat created the sentiment inflection that drove much of the Q2 2026 stock run. Q2 2026 guidance is 39 percent non-GAAP gross margin, sequentially down from 41 percent, which management attributed to 18A ramp costs. Whether that sequential step-down reflects normal ramp timing or a structural cost pressure returning is the question the July 23 earnings will answer.
Operating income and net income remain heavily distorted by non-cash charges. FY2024’s GAAP net loss of $18.76 billion reflected $15.9 billion in impairments and accelerated depreciation taken primarily in Q3 2024. FY2025 narrowed to a GAAP net loss of $267 million despite the foundry still losing $10.3 billion at the operating line. Q1 2026 GAAP net loss was $3.7 billion, driven almost entirely by a $4.1 billion non-cash Mobileye goodwill impairment and a $1.09 billion mark-to-market loss on the Escrowed Government Shares. The mechanism is worth understanding because it inverts the normal relationship between stock price and reported income: the 158.74 million shares placed in escrow at the time of the August 2025 government deal are recorded as a derivative liability at their current fair value, because Intel is obligated to deliver those shares as the DoD makes Secure Enclave disbursements at $20 per share. As Intel’s stock rises, the cost of that future share delivery rises, the derivative liability increases, and the change flows through “interest and other, net” as a GAAP loss - even though Intel’s business is getting stronger. The liability stood at $2.7 billion at the end of Q4 2025 and rose to $3.6 billion at the end of Q1 2026 as the stock recovered, producing the $1.09 billion non-cash charge. This item is excluded from non-GAAP results. Non-GAAP EPS in Q1 2026 was $0.29, beating the $0.00 guide.
The product segments tell a cleaner story. Intel Products (CCG plus DCAI combined) generated $12.7 billion in operating income in FY2025 at roughly a 26 percent blended operating margin.
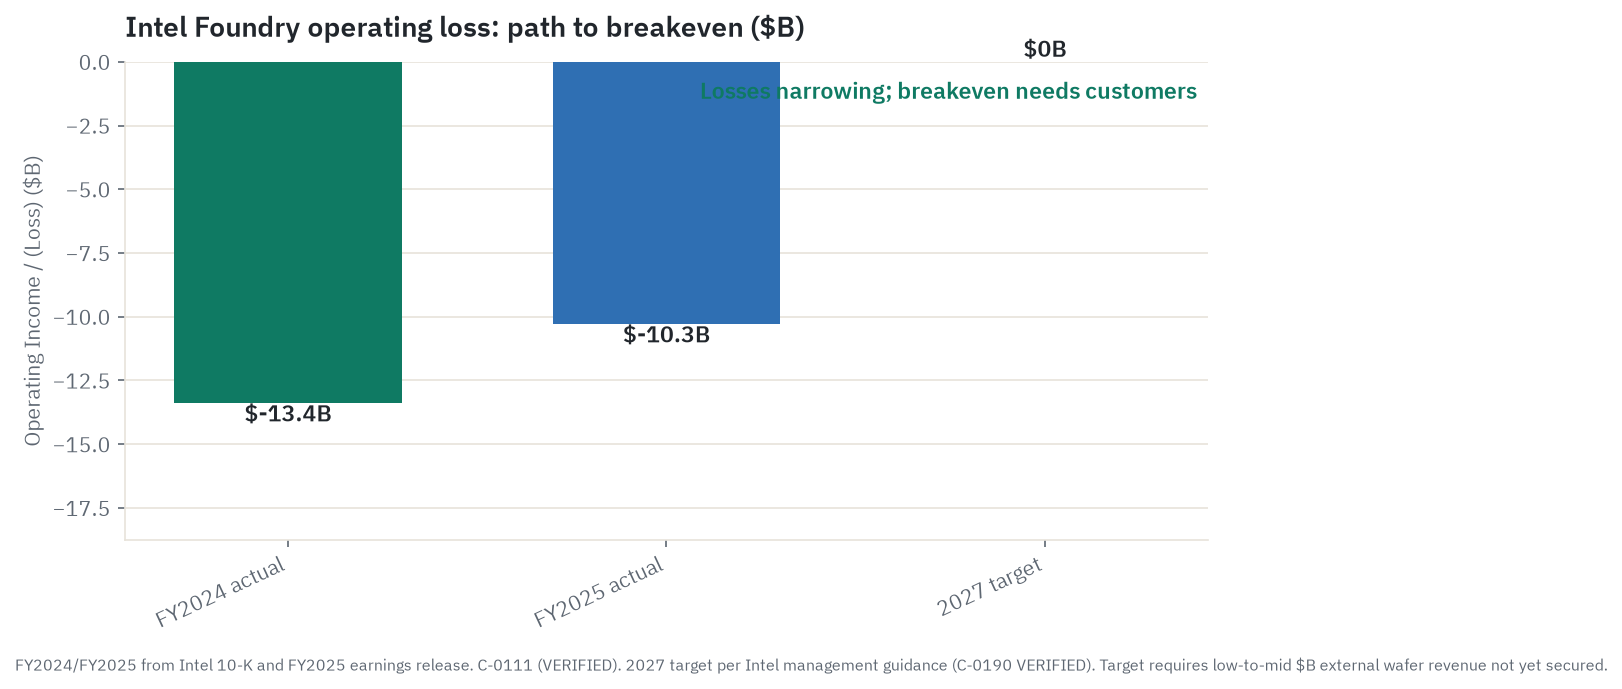
Intel Foundry reported an operating loss of $10.3 billion in FY2025, narrowing from an estimated $13.4 billion loss in FY2024. The quarterly run rate in Q4 2025 was approximately $2.5 billion per quarter (roughly $10 billion annualized). The $10.3 billion annual figure is the verified primary-sourced number from the Intel FY2025 10-K; any reference in broader market commentary to a “$2.4 billion annual” foundry loss reflects a single-quarter approximation and should not be used as an annual figure.
Cash flow and capital expenditure
Free cash flow remains negative. Intel reported adjusted FCF of negative $1.6 billion for FY2025 and negative $2.0 billion in Q1 2026. Gross capital expenditure was $17.7 billion in FY2025, down from $23.9 billion in FY2024. The company’s target for FY2026 is positive adjusted free cash flow, explicitly excluding the Fab 34 buyout. That qualifier is material, and the Fab 34 story runs in two acts.
In June 2024, Intel sold 49 percent of Fab 34 (Leixlip, Ireland - Intel’s high-volume manufacturing campus for Intel 4 and Intel 3 process nodes, which produce Intel Core Ultra and Granite Rapids chips) to Apollo Global Management for $11 billion under Intel’s Semiconductor Co-Investment Program (SCIP). Intel retained 51 percent controlling interest and full operational control; the joint venture paid Intel on a cost-plus-margin basis with minimum volume commitments. Intel’s CFO at the time described the deal as the right structure to raise capital during the 2024 cash crunch without taking on all the debt directly. Apollo’s money went in when Intel was burning cash on an ambitious multi-fab expansion plan and needed off-balance-sheet financing flexibility.
By April 2026, the picture had changed: $15.9 billion in strategic equity from the US government, SoftBank, and NVIDIA had shored up Intel’s capital structure, and management had decided to consolidate the Fab 34 ownership. Intel repurchased Apollo’s 49 percent stake for $14.2 billion ($7.7 billion cash plus $6.5 billion in new debt), giving Apollo roughly a 27 percent gain in under two years on its $11 billion outlay. Intel’s CFO described the buyback as enabling the company to retire debt maturities as they come due and said management expected it to be accretive to EPS beginning 2027. The Fab 34 payment alone will make reported GAAP FCF deeply negative in FY2026. Intel held $32.7 billion in total liquidity as of March 28, 2026 (Q1 2026 10-Q: $17.2 billion cash plus $15.5 billion short-term investments), and reported no going-concern language in the FY2025 10-K. The FY2025 adjusted FCF deficit of $1.6 billion was offset by $15.9 billion in strategic equity raised from the US Government, SoftBank, and NVIDIA in H2 2025. Intel is consuming capital; it is not approaching a liquidity crisis at current levels.
Balance sheet
Total debt as of Q1 2026 was $45.0 billion ($43.0 billion long-term, $2.0 billion short-term), with a net debt position of approximately $12.3 billion. Post-Fab34 acquisition (April 2026), the pro-forma debt rose to approximately $51.5 billion with net debt near $26.4 billion. Intel has two near-term debt maturities to manage: $2.5 billion due in 2026 and $3.8 billion due in 2027. Management committed on the Q1 2026 earnings call to retiring both. Interest expense was $1.09 billion in FY2025. At 3.50 to 3.75 percent Fed funds (the rate as of the June 17, 2026 FOMC meeting), new borrowing at 4 to 5 percent raises Intel’s annual interest burden on its ongoing capex program.
The share count tells a dilution story. Between Q2 2025 and Q1 2026, Intel’s diluted share count rose from approximately 4.377 billion to approximately 5.083 billion. The 706 million net new shares came from three strategic investors in H2 2025: 433.3 million to the US Government at $20.47/share ($8.9 billion), approximately 86.96 million to SoftBank at $23.00/share ($2.0 billion), and approximately 215 million to NVIDIA at $23.28/share ($5.0 billion). All three investments were made at roughly $20 to $23 per share, against the current price near $133. Existing shareholders absorbed roughly 14 to 16 percent dilution in a single year.
Dividends and buybacks
Intel suspended its dividend starting Q4 2024, at the same time as the August 2024 announcement of the $10 billion cost reduction plan and 15 percent workforce cuts. The last quarterly payment was $0.125 per share (annualized $0.50). Management’s stated condition for reinstatement is “sustainably higher” free cash flow levels, with no specific threshold or date given. No reinstatement is likely before FCF is decisively positive, which management targets for FY2026 excluding the Fab 34 one-time, or genuinely for FY2027 at the earliest. No buyback program is active while FCF is negative.
Market action and valuation
INTC closed at approximately $131.65 on June 24, 2026 (last confirmed close). The June 25, 2026 reference price is $132.87, with an after-hours print of $132.72. Market cap at that level is approximately $667.8 billion (as of June 25, 2026; fast-moving). The 52-week range is $18.97 (low, August 1, 2025) to $141.45 (high, June 22, 2026). The stock sits about 6 percent below its 52-week high set three trading days before the research date.
Year-to-date return as of June 25, 2026: Barchart reports +260.08 percent. A secondary data source shows +217 percent. The discrepancy likely reflects different base-date conventions - both providers agree the direction and magnitude are extraordinary. The 1-year return is approximately +499 percent (Barchart). For context, AMD returned roughly +149 percent year to date, TSMC roughly +43 percent, the SOXX semiconductor ETF roughly +98 percent, and the S&P 500 roughly +10 percent over the same period. Intel has more than doubled the semiconductor index in a year that was already a strong one for the sector.
The drawdown context matters. INTC fell approximately 67 percent from its early 2021 high near $57 to the August 2025 trough at $18.97. The recovery from $18.97 to the June 22, 2026 high of $141.45 represents roughly +645 percent in under eleven months.
Valuation. Because Intel’s trailing earnings per share are negative (TTM EPS negative $0.61 to $0.67 depending on source), traditional trailing P/E is not applicable. The market is not paying for current earnings; it is paying for a turnaround scenario that has not yet fully delivered.
Forward P/E is deeply disputed: Finviz shows 85.15 times, StockAnalysis 125.31 times, Yahoo Finance 151.52 times. These differences reflect different consensus NTM EPS estimates in the denominator. The range is 85 to 152 times depending on which estimate source is used; no single figure can be stated with confidence. What all three sources agree on is that at any of those levels, the stock is extraordinarily expensive on forward earnings and is priced for a specific, narrow recovery trajectory.
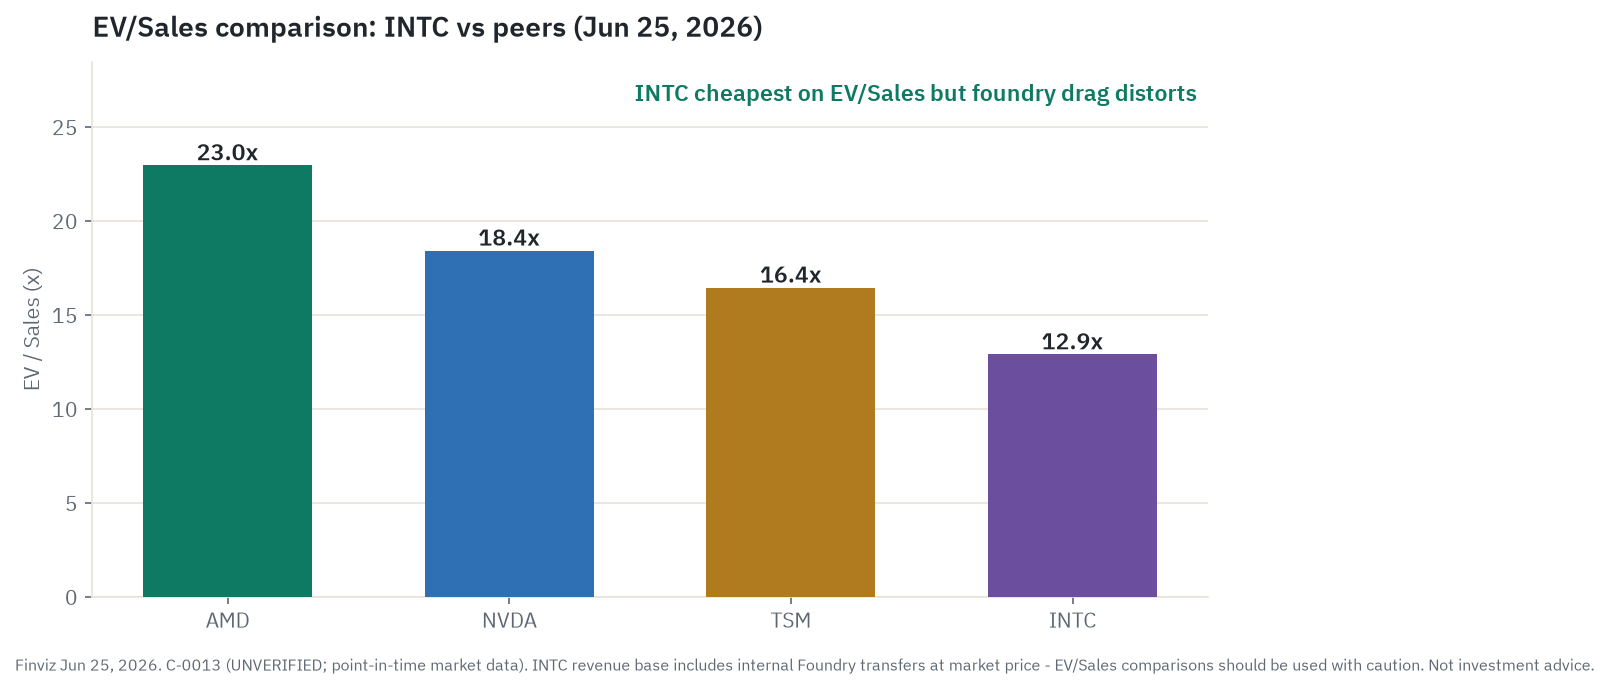
EV/Sales at 12.9 times (Finviz, June 25, 2026) looks cheaper than AMD at 23.0 times, NVIDIA at 18.4 times, or TSMC at 16.5 times. But this comparison requires a flag: Intel’s $53 billion revenue base includes $17.8 billion of Intel Foundry revenue that is more than 90 percent internal transfer pricing, not arm’s-length external revenue. A fabless company’s EV/Sales reflects external commercial revenue; Intel’s includes an internal accounting loop at scale. The comparison flatters Intel.
P/B at 5.99 times (Finviz) is the lowest in the peer group: AMD 13.47 times, NVIDIA 24.25 times, TSMC 12.24 times. A low P/B is simultaneously a value signal (assets worth more than implied) and a risk signal (book value includes fab assets that could be impaired if the foundry fails to commercialize).
The clearest valuation anchor for a non-specialist reader is the sum-of-parts. Intel Products standalone - CCG and DCAI together - generated $12.7 billion of operating income in FY2025. At 18 to 25 times operating income (a reasonable range for a duopoly-protected CPU design business), Intel Products is worth $229 to $318 billion. Adding Intel Foundry at a conservative 3 to 5 times revenue on $17.8 billion (FY2025 Intel Foundry revenue; discounted for continuing losses), Mobileye at roughly $5.6 billion (85 percent of MBLY market cap), and the Altera 49 percent stub at approximately $4.3 billion (stale September 2025 transaction price), then subtracting net debt of approximately $26 billion post-Fab34, produces an equity SOTP range of roughly $52 to $79 per share on 5.1 billion diluted shares.
At $132.87 per share and a $667.8 billion market cap, the stock sits 1.7 to 2.5 times above the top of the product-only SOTP range. The premium of roughly $55 per share at current prices represents what the market is paying for the foundry option alone. That option is real. But it has not yet produced a single major external commercial customer commitment.
Sell-side consensus. As of June 25, 2026, the consensus across 49 analysts is Hold, with a median price target of $90 and a mean near $90 to $96 depending on the aggregator. The stock trades 37 to 49 percent above the consensus mean. The high target in coverage is $160, raised by Bank of America (analyst Vivek Arya) on June 23, 2026 after a double upgrade from Underperform to Buy. Goldman Sachs initiated coverage the same week at Neutral with a $150 target. Morgan Stanley downgraded to Underweight during the same period - a notably contrarian call at these prices. Mizuho reiterated Hold on June 25, raising its target from $128 to $135.
A stock trading more than 37 percent above its consensus target is either pricing a scenario that most sell-side models have not yet underwritten, or getting ahead of the fundamental evidence. Both are true here. The speed of the run has outpaced target revisions for most of the Street.
Technical context. The 200-day simple moving average is near $57.71 as of June 25, 2026 - the stock trades roughly 130 percent above its own long-term average, a degree of separation that is historically associated with turnaround situations or momentum extremes, not stable fundamental footing. The 50-day moving average is near $107, which is the first major support level for a meaningful pullback. Daily average true range is approximately $10.17, meaning routine intraday swings of 5 to 8 percent are normal. RSI at 60.5 is elevated but not in classic overbought territory above 70. Shorter-term stochastic oscillators at roughly 70 to 80 percent are more extended. These are risk-sizing signals, not direction calls.
Government and strategic stakes
This section has no direct parallel at AMD, TSMC, or NVIDIA. It is specific to Intel’s current situation and needs to be read carefully, because the mechanics are different from how they are often described in press coverage.
The US government stake. On August 22, 2025, Intel disclosed in an 8-K filing that the US Department of Commerce acquired 433.3 million Intel common shares at $20.47 per share for $8.9 billion total. Of these, 274.6 million shares were issued immediately, and 158.7 million were placed in escrow, to be released at $20 per share as the Department of Defense makes disbursements under the separate Secure Enclave program. The DOC stake is passive: no board seat, no governance or information rights, and the DOC has committed to vote its shares with Intel’s Board. The DOC also received a warrant for approximately 5 percent additional shares at $20 per share, exercisable only if Intel fails to maintain majority ownership of its foundry business.
The funding breakdown: $5.7 billion came from remaining unpaid CHIPS Act commercial fabrication grants (part of the $7.865 billion total grant package finalized in November 2024, itself a reduction from the $8.5 billion preliminary figure announced in March 2024 as Intel deferred Ohio construction commitments; the grants covered fab projects in Arizona, New Mexico, Ohio, and Oregon), and $3.2 billion from the separate DoD Secure Enclave manufacturing contract. The earlier $2.2 billion in CHIPS grants already disbursed remained with Intel; all prior milestone-based obligations (union neutrality requirements, apprenticeship investment mandates, excess-profit-sharing provisions, factory-construction mandates) were discharged. The original March 2024 CHIPS package also included up to $11 billion in DOE low-interest loans. That loan facility does not appear in the August 2025 equity-conversion announcement or in Intel’s subsequent Q1 2026 10-Q and related disclosures reviewed for this article; no Intel filing or DOE communication explicitly confirms the facility was cancelled or confirms it remains available. The post-conversion status of the loan facility is unconfirmed. The Secure Enclave disbursements remain outstanding - approximately $2.99 billion remaining per the Intel 2026 proxy (this figure is derived from the proxy escrow share count and is approximate; the verifier flagged it as needing confirmation from the proxy language directly).
At mid-2026 INTC prices of approximately $131, the DOC’s 433.3 million shares (acquired at $20.47) represent an unrealized paper gain of approximately $47 billion on the initial cost of $8.9 billion (approximate, point-in-time as of June 25, 2026). That paper gain has attracted political commentary. Senator Warren wrote to Commerce Secretary Lutnick that the conversion of CHIPS grants to equity gave “billions in taxpayer money to Intel asking for nothing in return” and eliminated factory-construction requirements. Some Republican legislators (Senator Rand Paul) described the government equity ownership as “socialism.” These are attributed political reactions, not factual conclusions about the legality or appropriateness of the transaction; the deal structure itself is documented in a primary SEC 8-K filing.
The government warrant creates a structural tension worth understanding. If Intel ever separated the foundry - the outcome that most bears consider the rational restructuring path - the warrant for an additional approximately 250 to 260 million shares at $20 becomes exercisable. At $133 per share, that warrant exercise would add roughly $33 billion in dilution to existing shareholders. The bear’s preferred outcome (foundry spin-off) is exactly what triggers maximum dilution. This asymmetry is not well understood in retail commentary.
The SoftBank stake. SoftBank signed a securities purchase agreement in August 2025 to invest $2 billion in Intel common stock at $23 per share (approximately 86.96 million shares, roughly 2 percent of post-investment shares). No board seat and no special governance rights were disclosed. The strategic rationale from SoftBank’s perspective is its “AI revolution” thesis as described by CEO Masayoshi Son.
The relevant conflict: SoftBank owns the majority of Arm Holdings, whose ARM architecture directly competes with Intel’s x86 in server, PC, and edge markets. No formal conflict-of-interest resolution protocol between SoftBank’s Intel stake and its ARM ownership has been publicly disclosed. SoftBank holds Intel equity while owning the instruction-set architecture that is Intel’s structural competitor. That is an unusual dual alignment.
The NVIDIA stake. NVIDIA’s $5 billion investment (approximately 215 million shares at $23.28, completed December 2025, approximately 4.3 percent of Intel) was described by Jensen Huang as “an incredible investment” - suggesting a hold posture rather than a near-term sale. The FTC cleared the deal in December 2025. This is a CPU partnership stake, not a foundry commitment; NVIDIA has not agreed to manufacture GPUs on Intel processes.
Sentiment and OSINT
The dominant market narrative as of late June 2026 is a full-scale turnaround story. Coverage volume is high and warming fast. The June 2026 cascade included a report by The Information on June 8 that Google had ordered more than 3 million TPU chips from Intel Foundry for delivery before 2028, with the node unspecified and neither Intel nor Google confirming any part of the report (stock up roughly 11 percent on the day on the unconfirmed story). The same June 8 date brought the Cadence 14A DTCO partnership announcement. Then came the preliminary Apple foundry discussion referenced publicly by President Trump on June 18 (stock up 8 to 11 percent on the statement). Bank of America’s double upgrade from Underperform to Buy and Goldman Sachs’ initiation at Neutral with a $150 target followed within days. Each catalyst was real in the sense of involving a named company, analyst, or institution. Where they differ is on confirmation: the sell-side upgrades are real; the Apple arrangement is reported preliminary; the Google deal is an unconfirmed press report with zero official statements from either party.
But it is running ahead of the fundamentals on several specific points.
The government stake is read in retail circles as “the stock cannot go bankrupt” and “short sellers are fighting the US government.” The first part is close to true in practical terms - an uncontrolled bankruptcy is near-impossible with a US government equity stake. The second part is a sentiment argument, not a valuation one. A government stake does not prevent a stock from repricing from $133 to $80 if foundry customers fail to materialize.
The Apple deal is widely read as confirmed in retail commentary. It is not. Trump’s public statement on June 18, 2026 and the WSJ reporting in May 2026 are sourced to a preliminary arrangement; no Intel or Apple press release, no SEC 8-K disclosing signed commercial terms or volume, has been filed. Ming-Chi Kuo’s estimate of 15 to 20 million units per year is from a May 2026 post on his X account - an analyst estimate, not a disclosed contract. This distinction matters enormously for the foundry thesis if the deal does not formalize at the volume implied.
Retail INTC discussion has been running extremely hot through May and June 2026. Schwab reported Intel among the most net-bought large-cap names in May 2026 per press articles citing their retail flow data. The bull themes on forums like r/stocks and StockTwits center on the turnaround narrative, the government backstop, and the Apple deal - not on detailed foundry economics. The skeptic threads are organically grounded: AMD EPYC share gains, negative FCF, Gaudi underperformance, and the stock trading well above analyst consensus.
In May 2026, investor Michael Burry stated publicly that he viewed Intel as a “poster child for the top.” He noted, however, that options pricing made a direct Intel put position unattractive, and indicated he preferred to express a bearish semiconductor view through the SOXX ETF instead. This is a disclosed opinion, not a confirmed reportable short position - no 13F filing has confirmed a large Intel put position from Burry. Treating his comment as a confirmed large short is incorrect.
Short interest is not a near-term squeeze factor. At approximately 134 to 135 million shares short (Finviz and MarketBeat as of June 25, 2026; two sources within 5 percent of each other, trend declining) against average daily dollar volume near $15 billion, days-to-cover is approximately one day. The +260 percent YTD move was driven by fundamental re-rating and momentum, not short-squeeze mechanics.
The narrative vs. fundamentals divergence. Intel Foundry’s operating loss was $10.3 billion in FY2025 on external revenue of $307 million for the year. FCF is negative. Gross margin at 41 percent non-GAAP in Q1 2026 remains well below AMD’s 53 to 54 percent and TSMC’s 66-plus percent. The business is executing a multi-year restructuring that may succeed. But the Q1 2026 sentiment inflection - driven by a gross-margin guidance beat and a cascade of announced partnerships and political statements - has run materially ahead of what the foundry’s financial results have confirmed. The most concrete divergence signal: 49 analysts with a median price target of $90, and a stock at $133.
Macro and micro economics
Macro drivers
PC market. CCG, Intel’s largest segment at roughly 61 percent of product revenue, lives inside a mature replacement-driven market. The Windows 10 end-of-life event (October 14, 2025) pulled forward enterprise refresh spending into 2024 and early 2025. Now that tailwind is behind us, and the hangover has arrived in a specific form: AI’s appetite for HBM redirected DRAM wafer capacity away from consumer DRAM, inflating consumer PC memory prices and suppressing unit demand. IDC forecasts 252.53 million PC units for full-year 2026, down 11.3 percent from 2025, with recovery deferred to 2028. The AI PC structural demand wave (Panther Lake on 18A, 50-TOPS NPU, enterprise on-device inference) is real but 2 to 3 years from peak replacement-cycle velocity.
Data center capex. Hyperscalers collectively plan approximately $660 to 725 billion in total 2026 capex, with roughly 75 percent AI-related infrastructure. Goldman Sachs projects the 2025 to 2027 cumulative hyperscaler capex at $1.15 trillion, more than double the prior three-year period. Intel DCAI benefits from this cycle through CPU-attach revenue. The risk is that ARM is winning the new capacity additions at exactly the AI-workload orchestration layer Intel needs to hold: AWS reports Graviton CPUs account for more than 50 percent of all new EC2 CPU capacity for three consecutive years.
Reshoring geopolitics. The US CHIPS Act and the government equity stake reflect a bipartisan consensus that the United States needs domestic leading-edge semiconductor manufacturing. Intel Fab 52 in Chandler, Arizona is the physical embodiment of that policy choice. In any scenario involving Taiwan supply-chain disruption - whether from natural disaster, political crisis, or military escalation - Intel’s Arizona fabs become the most strategically valuable manufacturing infrastructure in the world. The probability of needing that insurance is low in any given year; the cost of not having it is high at the societal level. That asymmetry is what a $57 billion paper gain for the US government in 11 months of holding captures.
Trade and export controls. The May 2026 US-China trade truce reduced tariffs (from 145 percent to 30 percent on Chinese goods), suspended China’s antitrust investigation into Intel, and allowed NVIDIA H200 exports while keeping Blackwell blocked. The truce expires in 12 months. China represented 29.25 percent of Intel’s FY2024 revenue at approximately $15.53 billion. Domestic Chinese CPU substitution - Loongson, Zhaoxin, Hygon x86-compatible designs, RISC-V alternatives - is a decade-long secular trend funded by government mandate. No trade deal reverses it. Intel’s China-exposed revenue is structurally declining on the design-and-sell side regardless of the tariff headline.
Trump’s January 2026 proclamation imposed 25 percent tariffs on advanced computing chips and semiconductor manufacturing equipment. Intel argues its imported equipment (ASML EUV machines, WFE tools from Applied Materials, Lam Research, KLA) qualifies for domestic-manufacturing exemptions, but the legal boundary is not fully settled. ASML EXE:5200B machines, at roughly $380 to 400 million each, are imported from the Netherlands. Any tariff applied to those specific imports would materially raise 14A capital costs.
Rate environment. The Federal Reserve held the federal funds rate at 3.50 to 3.75 percent at the June 17, 2026 FOMC meeting. Nine dot-plot members projected at least one additional hike in 2026, with April CPI at 3.8 percent year over year. Intel carries approximately $51.5 billion in gross debt post-Fab34. A rate increase raises refinancing costs on the $2.5 billion 2026 maturity and the $3.8 billion 2027 maturity that management has committed to retiring.
Micro economics
Leading-edge fab unit economics. A leading-edge fab like Fab 52 costs $15 to 20 billion to build and equip. The cost structure is roughly 60 to 70 percent fixed (equipment depreciation, cleanroom maintenance, engineering headcount, process software) and 30 to 40 percent variable (gases, chemicals, photomasks, electricity). That fixed-cost dominance is the leverage mechanism in both directions.
Think of it like a toll highway with a fixed maintenance cost regardless of traffic. At 40 percent traffic, the maintenance cost per car is enormous and the highway bleeds money. At 80 percent traffic, the same maintenance cost is spread across twice as many cars, and the highway generates substantial operating profit per car. Intel Foundry is at the low end of that utilization range for leading-edge capacity. Each 10-percentage-point gain in utilization is worth roughly $600 million to $1.2 billion of additional revenue against near-zero marginal cost, because the fixed costs are already absorbed.
18A yield compounds the fixed-cost problem. At an estimated 55 to 65 percent yield (analyst range; Intel has not published an official figure), approximately 35 to 45 percent of wafers do not produce functional chips. At $25,000 per wafer (an industry estimate; Intel has not disclosed pricing), a 10-point yield deficit versus TSMC’s production-mature equivalent costs roughly $2,500 per wafer in additional waste. Intel’s CFO targeted “appropriate yields by end of 2026,” and Tom’s Hardware reported “industry-standard levels” (typically 75 percent or above) expected by 2027.
IDM versus fabless. AMD outsources all its manufacturing to TSMC. Its cost of goods is primarily the wafer cost it pays TSMC. In a downturn, AMD reduces wafer orders; TSMC absorbs the utilization impact. AMD’s FY2025 non-GAAP gross margin is roughly 53 to 54 percent. Intel’s Q1 2026 non-GAAP gross margin is 41 percent and climbing. The blended Intel number reflects the foundry drag; the underlying Intel Products design business likely earns margins closer to 55 to 65 percent on its own, similar to AMD.
The IDM model wins structurally when three conditions align: process leadership (Intel must be at or ahead of TSMC), near-full utilization of leading-edge fabs, and a defensible internal customer (Intel Products) that cannot easily move to TSMC. The third condition is now permanent - Intel Products cannot simply call TSMC and cut 40,000 wafers per month there; the process transition would take years and destroy Intel’s competitive differentiation. The first condition is partially restored with 18A. The second condition is the open question.
Durability and synthesis
The turnaround thesis has structural legs in two specific areas. First, US-soil leading-edge manufacturing has genuine national-security option value that did not exist before 2021 and will not disappear regardless of who wins the next US election. Both parties have a financial stake in Intel’s success now. Second, the Intel Products design franchise - $12.7 billion of annual operating income from IP-driven, duopoly-protected x86 CPU revenue - has genuine durability from enterprise software lock-in, ISV certification ecosystems, and the installed base of hundreds of millions of x86 servers and PCs. That business does not collapse because foundry struggles.
The structural problems are also clear. TSMC has a 35-year head start in building customer trust for external foundry services. Its process recipe knowledge, its multi-customer production scheduling, its packaging integration - all of it is decades in the making. Intel Foundry is attempting to build a comparable business in years, not decades, while simultaneously running two other major businesses. ARM is a structural threat to DCAI’s revenue ceiling that a better Xeon cannot answer. And the current stock price at $133 embeds a highly optimistic foundry scenario as the base assumption, not the upside scenario.
The Global Foundries analogy - the precedent the skeptic cited most forcefully - deserves serious attention. GlobalFoundries announced in August 2018 that it was permanently halting development of its 7nm process and abandoning leading-edge manufacturing, retreating to mature specialty nodes. Intel Foundry is on that trajectory in one specific scenario: PDK 0.9 releases in October 2026, major commercial evaluators (NVIDIA, AMD, Broadcom) compare 14A against TSMC N2P already in volume production, and decline to commit. Without a named external customer of meaningful commercial scale on 14A, Ohio One becomes a $28 billion stranded asset and the $55-per-share foundry option premium embedded in the current stock price deflates.
The bull rebuttal is real. The product business earns $12.7 billion per year. US-sovereign leading-edge manufacturing has never existed before; the government effectively bought it at $20 per share in August 2025 and that option is now worth $57 billion on paper. 18A works - Panther Lake, Clearwater Forest, and Microsoft Maia 2 are real products on a real process. And TSMC’s own trajectory in Arizona confirms that US-soil advanced manufacturing is economically viable; the only question is which US-soil fab wins external customers.
The synthesis: Intel is a real business being rebuilt in real time. The design franchise is healthy. The process technology is genuinely advancing. The question for the 5-year investor is whether Intel Foundry becomes the next TSMC - building a trusted external manufacturing business over 5 to 10 years - or the next GlobalFoundries, a technically capable process that found insufficient commercial demand at leading-edge prices. The answer will be substantially visible by end of 2026. At $133, a buyer is paying for the TSMC outcome as approximately base case and the GlobalFoundries outcome as a tail risk. The research says it should be the other way around.
The scenarios in detail
Bull - 14A wins commercial volume; foundry reaches breakeven; national-champion re-rate
The bull scenario requires one named major-volume customer to commit to 14A by Q2 2027. Not Apple at preliminary-discussion terms; a formal filed agreement with NVIDIA, AMD, Broadcom, or a hyperscaler AI accelerator at meaningful wafer volume. If that commitment materializes:
External foundry revenue grows from $700 million annualized (Q1 2026) to $3 to 4 billion by end-2027 and $6 to 7 billion or more by 2030. Intel Foundry exits the operating-loss trough and reaches breakeven by 2028 (one year behind the management target, allowing execution margin), then contributes $8 to 10 billion of operating income by 2030 to 2031. DCAI grows at approximately 12 to 15 percent annually from FY2025’s $16.9 billion to roughly $28 billion by 2030, driven by AI-host CPU attachment and custom ASIC wins. CCG grows modestly as the AI PC replacement cycle and enterprise refresh combine. On non-GAAP EPS of approximately $2.65 to $3.00 (estimate for 2030 to 2031), a 50 to 55 times multiple on proof of completed turnaround and national-champion positioning yields approximately $140 per share (estimate).
The uncomfortable arithmetic for bulls: $140 in five years on the best-case scenario is essentially today’s price. A buyer at $133 earns approximately zero upside from the bull case in five years, with five years of execution risk on the path. The bull case is the price; it is not above it.
6-month bull: approximately $150 (estimate). Q2 gross margin beats at 40 percent or above, external foundry revenue shows sequential acceleration, and at least one named 14A evaluator signals commitment intent before October PDK 0.9.
1-year bull: approximately $162 (estimate). NVIDIA, Apple, or a major hyperscaler formally commits 14A volume via 8-K or joint press release. External revenue accelerating toward breakeven run rate.
3-year bull: approximately $125 (estimate). 14A in high-volume manufacturing with Apple and/or a hyperscaler at scale. External revenue $4 to 6 billion approaching breakeven.
5-year bull: approximately $140 (estimate). Full turnaround executed. Non-GAAP EPS approximately $2.65 to $3.00 at 50 to 55 times P/E national-champion multiple.
Base - partial foundry progress; products stable; turnaround narrative intact but unproven
In the base case, 14A attracts one or two smaller customers (defense, government, an AI chip startup, or Apple at partial volume below the Kuo estimate) but no tier-1 commercial volume commitment from NVIDIA, AMD, or a major hyperscaler by end-2027. External foundry revenue reaches $1.5 to 2.5 billion annualized by end-2027, falling short of the breakeven threshold. Foundry operating losses narrow from $10.3 billion in FY2025 to approximately $4 to 6 billion by 2027 to 2028, but breakeven slips to 2029 or later.
DCAI grows at 7 to 8 percent annually, with ARM continuing to take new hyperscaler capacity and AMD holding above 45 percent of x86 server revenue. CCG remains roughly flat. FCF turns positive in 2028 to 2029. No dividend reinstatement before 2029.
Product-only SOTP with partial foundry credit and a discretionary 35 to 40 percent national-security premium above fundamental value yields approximately $85 per share (estimate) at five years. That is 36 percent below today’s price, confirming that the base case carries meaningful downside from current levels.
6-month base: approximately $118 (estimate). Stock digests some of the run. Q2 earnings roughly meet the 39 percent guide. No major 14A announcement.
1-year base: approximately $105 (estimate). One or two smaller 14A commitments that do not provide tier-1 commercial proof.
3-year base: approximately $82 (estimate). External revenue $2 to 3 billion; foundry still losing $3 to 5 billion annually; SOTP growing but below current price.
5-year base: approximately $85 (estimate). Foundry external $3 to 4 billion, losses narrowed but not zero; products $13 to 14 billion combined op income.
Bear - 14A customer failure; foundry restructuring; product erosion
The bear case is anchored on the company’s own 10-K language: “potential pause or discontinuation of Intel 14A” without a significant external customer. This is not a technology failure scenario. 18A works; Panther Lake and Clearwater Forest are real products. The failure mode is commercial: a technically viable process with insufficient external demand to justify a $17 billion annual gross capex commitment.
In the bear scenario, NVIDIA and AMD both decline 14A after evaluating PDK 0.9 - NVIDIA has already declined 18A, and AMD’s entire business model depends on TSMC being the better foundry choice. Apple’s preliminary deal materializes at below-Kuo scale and does not provide the anchor customer Intel needs. Intel announces in 2027 a restructuring of the foundry to defense/government, mature specialty nodes, and internal Intel Products wafers only. Ohio One is mothballed or sold. External foundry revenue stays below $1 billion annualized.
Simultaneously, DCAI faces pressure from two directions: AMD reaches above 55 percent of x86 server CPU revenue as Diamond Rapids underperforms or arrives late, and ARM passes 30 percent of total server CPU units as hyperscalers accelerate custom ARM deployments. CCG faces Windows-on-ARM wins at the premium PC tier. Products operating income erodes toward $10 to 11 billion.
With foundry restructured, gross capex falls below $12 billion, FCF turns positive in 2027 to 2028, and debt is gradually reduced. But without a foundry growth story, there is no re-rating catalyst and the multiple contracts toward mature semiconductor company levels. A product-only SOTP of $33 to 35 per share at the pure fundamental level, plus a national-security premium that the government backstop practically guarantees does not go below some floor, produces an estimated $45 per share (estimate) bear case at five years. That is roughly 66 percent below current price.
6-month bear: approximately $88 (estimate). Q2 gross margin miss (below 37 percent), or 14A PDK news disappoints, or broader macro/rate shock.
1-year bear: approximately $70 (estimate). No major 14A customer by end-2026; NVIDIA and AMD both decline after PDK 0.9 evaluation.
3-year bear: approximately $55 (estimate). 14A effectively abandoned; ARM passes 25 percent of server CPU units; product-only SOTP.
5-year bear: approximately $45 (estimate). Foundry exits leading-edge; ARM at 30 percent; DCAI and CCG both under structural pressure.
Companies to watch (bull / base / bear)
ASML Holding (/posts/asml)
ASML is Intel’s essential equipment partner and, in a real sense, Intel Foundry’s enabling chokepoint. ASML holds a monopoly on EUV lithography and an absolute monopoly on High-NA EUV - no other company makes these machines. Every 14A wafer Intel runs requires an ASML EXE:5200B. Intel was the first customer to receive the EXE:5000 R&D unit (December 2023) and the first commercial EXE:5200B (December 2025). Intel’s committed investment in High-NA EUV is already well over $760 to 800 million in machine cost alone for the first two production units, before any Ohio One 14A-at-scale deployment.
In the bull case, Intel’s 14A ramp is a multi-year ASML revenue anchor. In the base case, ASML still benefits from TSMC’s N2 ramp and Samsung’s HBM4. In the bear case, a 14A delay or cancellation removes one of ASML’s three major leading-edge customers for High-NA EUV and reduces near-term demand visibility. ASML’s own risk: it stopped disclosing order bookings in Q1 2026, reducing backlog transparency at exactly the moment Intel’s 14A customer uncertainty peaks.
ASML’s market cap is approximately $679 billion as of June 25, 2026. The stock set a 52-week high of roughly EUR 1,929.68 on June 18, 2026 and pulled back approximately 19 percent in the following days.
Advanced Micro Devices (/posts/amd)
AMD is Intel’s primary x86 rival and currently winning the value exchange in server CPUs. AMD’s bull case is Intel’s bear case. If Diamond Rapids underperforms or arrives late, AMD takes another 5 to 7 percentage points of x86 server revenue share and approaches 55 percent revenue share. If 14A fails to attract external customers and Intel restructures the foundry, AMD continues buying from TSMC with no disruption to its roadmap. AMD Q1 2026 revenue was $10.25 billion, up 38 percent year over year, with Data Center at $5.8 billion, up 57 percent. AMD raised its server CPU market forecast to $120 billion by 2030.
AMD’s own risk: the stock trades at approximately 85 times trailing P/E (as of June 25, 2026, market cap roughly $854 billion). AMD’s bull case on Intel’s failure is partially priced in.
NVIDIA Corporation (/posts/nvda)
NVIDIA is Intel’s strategic partner, Intel’s customer (Xeon in DGX Rubin), and Intel’s competitor in AI accelerators. NVIDIA is largely indifferent to the Intel foundry outcome - Blackwell and Rubin will be manufactured at TSMC regardless of Intel Foundry’s trajectory. The $5 billion NVIDIA equity investment is a CPU partnership, not a foundry bet. NVIDIA’s bull case for its own stock does not require Intel Foundry to succeed.
The specific NVIDIA risk in the Intel context: if Jaguar Shores somehow achieves commercial traction in AI inference against Blackwell/Rubin, it is a Gaudi-to-NVIDIA headwind. If it does not - the far more likely outcome - NVIDIA’s AI compute monopoly remains intact and NVIDIA stock is unaffected. NVIDIA’s market cap is approximately $4.88 trillion as of June 25, 2026.
Taiwan Semiconductor Manufacturing Company
TSMC is Intel’s outsourcing partner (Panther Lake tiles on TSMC N3E) and Intel Foundry’s existential commercial competitor. In the bull case for Intel, 14A pulls some external customers away from TSMC’s customer base - particularly for US-soil manufacturing requirements. TSMC Arizona N3 (H2 2027) and N2 (approximately 2029 to 2030) progressively narrow Intel’s commercial differentiation.
In the bear case for Intel (14A fails commercially), TSMC is the clean winner: it retains all the external customers Intel hoped to attract and continues gaining share of the global advanced-logic wafer market. TSMC Q1 2026 gross margin was 66.2 percent; Q1 2026 revenue was $35.9 billion, up 35 percent year over year. TSMC market cap is approximately $1.95 trillion (TSM ADR).
Mobileye Global (MBLY)
Mobileye is Intel’s majority-owned ADAS subsidiary, publicly traded at approximately $7.77 per share as of June 25, 2026 (52-week range $6.47 to $20.18, down 62 percent from peak). NVIDIA DRIVE Thor is winning premium autonomous-driving mandates at Mobileye’s expense. Mobileye’s Q1 2026 $3.788 billion goodwill impairment was non-cash but reflects the gap between Intel’s 2017 acquisition premium and Mobileye’s current market standing. Intel may monetize additional stake over time. Watch Mobileye as a sentiment indicator for Intel’s willingness to generate cash through asset sales.
Qualcomm and Broadcom (/posts/avgo)
Both are potential Intel Foundry customers evaluating 14A. Broadcom is actively testing. Qualcomm has not publicly announced an evaluation. Either signing a 14A volume agreement would be a significant positive signal for the foundry commercial thesis. Broadcom is particularly relevant because it designs custom silicon for Google, Meta, Apple, and other hyperscalers at scale - a Broadcom 14A commitment would imply access to hyperscaler silicon demand without those hyperscalers having to directly engage Intel Foundry.
Micron Technology (/posts/mu)
Micron is adjacent to the Intel story in two ways. First, Jaguar Shores’ AI accelerator architecture uses SK Hynix HBM4, not Micron’s HBM - Micron is a supplier to Intel’s Xeon and Panther Lake platforms through DRAM rather than HBM. Second, the AI-driven memory shortage that is pressuring CCG’s PC unit volumes is partly a Micron story: HBM demand is redirecting DRAM wafer capacity, lifting memory prices and suppressing PC units. A Micron supply ramp that normalizes DRAM prices would be a CCG tailwind.
Wafer fab equipment suppliers: Applied Materials (AMAT), Lam Research (LRCX), and KLA (KLAC)
These three companies supply the specialized process equipment that makes Intel’s manufacturing differentiation physically possible - and their fortunes track Intel Foundry’s capital program directly.
Applied Materials (market cap approximately $460 to 468 billion as of June 25, 2026) is the largest WFE supplier by revenue at roughly 22 percent market share. AMAT tools handle chemical vapor deposition, physical vapor deposition, etch, chemical mechanical planarization, and ion implantation - all of which are required at Intel 18A and 14A. Q2 FY2026 revenue was a record $7.91 billion, with non-GAAP gross margin at 50.0 percent, the highest in 25 years. Q3 FY2026 guidance of $8.95 billion reflects a broader WFE industry projected to grow more than 30 percent in CY2026.
Lam Research (market cap approximately $493 billion) dominates plasma etch - the equipment that patterns the gate-all-around channels in Intel’s RibbonFET transistors on 18A. Lam also leads in atomic layer deposition. Q3 FY2026 revenue was a record $5.84 billion, up 24 percent year over year, and Lam raised its CY2026 WFE forecast to $140 billion. Its Customer Support Business Group, which services installed tools at Intel and other fabs, generated a record $2.1-plus billion in Q3 FY2026 alone, providing a recurring revenue base that cushions cyclical downturns.
KLA (market cap approximately $340 billion post 10-for-1 stock split effective June 12, 2026) is the dominant process control and yield management company with roughly 50 percent market share. KLA inspection tools catch defects between every patterning step. At Intel 18A, where yield is estimated at 55 to 65 percent and management is targeting industry-standard levels by 2027, KLA tools are central to every percentage point of yield improvement. More complexity at 14A (High-NA EUV, additional pattern layers) means more KLA tool-steps per wafer and a structurally higher KLA revenue per wafer than at prior nodes. Q3 FY2026 revenue was $3.415 billion, up 11.5 percent year over year, with peer-leading gross margin of 62.2 percent.
In the Intel bull case, all three WFE suppliers benefit from sustained leading-edge capex as 14A ramps at Ohio One alongside existing 18A volume. In the base case, they still benefit from TSMC N2 and Samsung HBM4 ramps even if Intel 14A is slower than management targets. In the Intel bear case - where 14A is restructured and Ohio One is delayed further - the specific Intel Foundry capex contribution to AMAT, LRCX, and KLAC order books shrinks, but demand from TSMC and Samsung partially offsets.
For Intel-focused investors, tracking AMAT, LRCX, and KLAC revenue and guidance is a useful independent signal on foundry industry capital spending trends. (See also ASML for the EUV lithography dimension of this supply chain.)
Arm Holdings (ARM)
Arm Holdings (market cap approximately $427 to 439 billion as of late June 2026; roughly 75 to 80 percent owned by SoftBank) licenses the instruction set architecture and core designs that power the structural threat to Intel’s x86 franchise. Arm does not make chips; it earns royalties every time a chip using its ISA ships. ARM royalty revenue more than doubled year over year in FY2026, driven by data center royalties from AWS Graviton5, NVIDIA Grace, and custom hyperscaler designs (Google Axion, Microsoft Cobalt, Amazon Graviton5).
In the Intel bull case, ARM’s server CPU gains slow if Intel 14A delivers density and power parity with TSMC N2, giving hyperscalers a US-manufactured x86 alternative competitive enough to pause ARM transitions at the margin. The foundry relationship is actually complementary here: if Intel Foundry manufactures chips for ARM-licensee customers (NVIDIA, Qualcomm, AWS) it benefits from ARM’s growth. In the base case, ARM continues taking new hyperscaler server CPU capacity while Intel holds its installed x86 base through refresh cycles - both grow, Intel’s ceiling lowers slowly. In the bear case, ARM passes 30 percent of total server CPU units by 2030, shrinking the revenue pool Intel and AMD share for new deployments.
The SoftBank dual-alignment issue noted earlier applies here: SoftBank owns approximately 75 to 80 percent of ARM and approximately 2 percent of Intel. Those two Intel DCAI’s primary structural threat is also Intel’s largest non-government strategic investor’s crown jewel. No formal conflict-of-interest resolution between these positions has been publicly disclosed.
Samsung Electronics (005930.KS / OTC: SSNLF)
Samsung plays two roles in the Intel ecosystem: foundry competitor and memory supplier.
As a foundry competitor, Samsung Foundry (SF3, SF2 in roadmap) competes directly with Intel Foundry for the same external chip-design customers evaluating non-TSMC options. Samsung’s SF2 uses the same gate-all-around transistor architecture as Intel 18A (Samsung calls its implementation MBCFETs). Samsung’s foundry business has faced persistent yield challenges at 3nm, and TSMC has widened its technology lead. Intel 18A’s yield challenge is real, but Samsung’s yield problems at its leading-edge node have been at least as pronounced, making Samsung a weakened rather than dominant alternative for customers evaluating Intel Foundry.
As a memory supplier, Samsung is relevant to Intel’s Xeon and AI platform strategy through DRAM and its own HBM4 production. Samsung began HBM4 mass production and shipments in February 2026, adding a second major HBM4 supplier alongside SK Hynix (the current market leader at approximately 57 to 62 percent HBM share). Samsung’s entry into HBM4 volume production matters for Intel’s DCAI products and for Jaguar Shores’ memory stack.
Samsung’s primary US listing is OTC (SSNLF), which is very thinly traded; practical US retail access is through Korea-focused ETFs such as EWY rather than direct Samsung shares. In the Intel bull case (14A wins external customers and Intel becomes a credible foundry option), Samsung Foundry’s competitive position in the non-TSMC foundry market weakens further. In the bear case (Intel 14A fails commercially), Samsung Foundry’s competitive positioning is unaffected and it remains the third foundry option behind TSMC and Intel for advanced-logic customers.
Risk controls
Intel carries an unusually concentrated risk profile for a company of its size. Any position sizing should account for these:
Execution risk. 18A yield must reach industry-standard by end-2026 (management target) and 14A must attract at least one volume commercial customer by end-2026. Both are binary in their near-term resolution. A miss on either resets the narrative.
Competitive risk. AMD EPYC is winning premium server workloads on verifiable independent benchmarks. ARM is taking new hyperscaler capacity structurally. Diamond Rapids (2027) is Intel’s answer to the first; there is no x86 answer to the second. NVIDIA’s CUDA moat in AI accelerators has 15 years of compounding depth.
Financial risk. Gross debt of approximately $51.5 billion post-Fab34, against negative adjusted FCF and a $17 to 18 billion annual gross capex commitment. The $32.7 billion liquidity buffer (Q1 2026) provides runway, but it depends on capital markets remaining accessible at reasonable rates. Near-term debt maturities of $2.5 billion (2026) and $3.8 billion (2027) need refinancing in a 3.5 to 3.75 percent Fed funds environment. No going-concern language in the FY2025 10-K; this is a risk, not an imminent threat.
Political risk. The US government’s 433.3 million share stake introduces policy entanglement that has no precedent in modern US semiconductor history. Government behavior as a passive shareholder could change if administration priorities shift. The warrant for additional shares exercisable on foundry spin-off is a structural deterrent to the most obvious bear-case restructuring path. CHIPS Act Secure Enclave disbursements require continued DoD milestone delivery.
Dilution risk. 14.9 percent dilution was already absorbed in FY2025 from the strategic investments. Stock-based compensation in Q1 2026 alone was $0.6 billion. The government warrant for an additional approximately 250 to 260 million shares (exercisable on foundry separation) adds potential future dilution. A normalized share count of 5.1 to 5.3 billion diluted shares through 2030 is the reasonable working assumption.
China revenue risk. China was 29.25 percent of FY2024 revenue at roughly $15.53 billion. Domestic Chinese substitution (Loongson, Zhaoxin, Hygon, RISC-V) is secular and continues beneath any trade-truce headline. The 12-month truce expiration in May 2027 creates a renewal cliff for DCAI China revenue.
Macro risk. A simultaneous PC downturn and data-center capex deceleration would hit CCG and DCAI together. The PC unit trough is already here (2026, minus 11 percent); the data-center capex cycle is early-stage but depends on AI ROI materializing at enterprise scale. Intel has significant operating leverage in the wrong direction in a simultaneous downturn.
Position sizing. A daily ATR of roughly $10 on a $133 stock means routine 7 to 8 percent intraday moves are normal. A half-position or smaller is appropriate for a stock with this volatility profile, this range of potential outcomes ($45 to $140 in 5 years), and this degree of binary risk concentration in a single datable event (14A customer, H2 2026). Standard stop-loss frameworks suggest defining a maximum acceptable loss before sizing. This is not a stock for money one cannot afford to lose.
Methodology, sourcing, and data-quality flags
Research basis. This article is generated from OSINT, public filings, and verified market data as of June 25, 2026. Primary sources include Intel SEC filings (FY2025 10-K, Q1 2026 10-Q, Q1 2026 8-K, government stake 8-K August 2025), Intel earnings call transcripts, Intel newsroom announcements, ASML Q1 2026 earnings, TSMC Q1 2026 Form 6-K, AMD Q1 2026 earnings, and Arm Holdings newsroom. Analyst-tier sources include Mercury Research server and PC CPU market share data (via Tom’s Hardware, The Register, Tweaktown), TechInsights 18A performance scores (via TechPowerUp), IDC PC unit forecasts, and Gartner enterprise PC forecasts. Press-tier sources include The Wall Street Journal, TechPowerUp, Tom’s Hardware, Electronics Weekly, The Register, and Data Center Dynamics.
The house rating for INTC as of June 25, 2026 is Hold. This is a research signal based on the analysis above, not a personalized investment recommendation.
Valuation factor. The stock at approximately $132 to $133 as of June 25, 2026 trades 37 to 49 percent above the sell-side consensus average price target of $89 to $96 (S&P Global/MarketBeat; 48 to 49 analysts; modal rating is Hold across all sources). The product-only sum-of-parts is $52 to $79 per share (Intel Products at 18 to 25 times FY2025 segment operating income of $12.7 billion, less net debt of approximately $26 billion post-Fab34, divided by 5.1 billion diluted shares). The roughly $55 per share gap between current price and the top of that product-only SOTP range is what the market is paying for the foundry option alone - an option that has not yet produced a single major external commercial customer commitment. On EV/Sales (12.9 times), Intel looks less expensive than AMD (22.9 times), but Intel’s revenue base is largely internal Foundry transfer pricing, making the comparison misleading. Forward P/E is disputed at 85 to 152 times across three sources depending on which NTM EPS estimate is used. No fundamental valuation framework supports the current price without assuming a foundry success scenario that remains commercially unproven. The valuation evidence points negative.
Growth factor. DCAI grew 22 percent year over year in Q1 2026 to $5.1 billion, verified from Intel’s Q1 2026 8-K. Q2 2026 guidance of $13.8 to $14.8 billion revenue implies continued 7 to 9 percent year-over-year growth. Custom ASIC revenue within DCAI doubled to over $1 billion annualized per management Q1 2026 earnings commentary. The AI PC structural wave (Panther Lake on 18A, 50-TOPS NPU) provides a CCG medium-term tailwind. Against these positives: CCG declined roughly 3 percent year over year on a restated FY2025 basis; AMD holds 46.2 percent of x86 server CPU revenue (a record high); ARM held roughly 17.7 percent of total server CPU units in Q1 2026 and growing structurally. Near-term growth pockets are real; structural revenue ceiling headwinds are real beyond two to three years. The growth evidence points modestly positive.
Quality factor. Intel Products (CCG plus DCAI) generated $12.7 billion of operating income in FY2025 at roughly 26 percent combined operating margin - a genuinely high-quality design business with IP-driven, duopoly-protected revenue. The consolidated entity is not a quality compounder by standard financial metrics: GAAP operating loss of $2.2 billion in FY2025, adjusted FCF negative at $1.6 billion for FY2025 and $2.0 billion in Q1 2026, dividend suspended since Q4 2024, net issuer of equity (15.3 percent dilution in a single year), $45 to 51 billion gross debt. Non-GAAP gross margin of 41 percent in Q1 2026 is improving but well below Intel’s historical 55 to 60 percent and below TSMC’s 66-plus percent. The design franchise is excellent; the consolidated financial profile is below average for an investment-grade semiconductor company. The quality evidence points slightly negative.
Risk factor. Intel’s own FY2025 10-K explicitly flagged potential pause or discontinuation of 14A development without a significant external customer - one of the clearest company-level binary-risk disclosures in modern semiconductor history. External foundry revenue of $174 million in Q1 2026 against a breakeven requiring $500 million to $1 billion or more per quarter confirms the gap. Gross debt of $45 to 51 billion against negative adjusted FCF (offset by $32.7 billion in liquidity). China was 29.25 percent of FY2024 revenue with secular domestic-substitution risk. ARM structural displacement at roughly 17.7 percent of server CPU units is an architectural threat a better x86 CPU cannot address. TSMC Arizona N3 (H2 2027) narrows Intel’s commercial US-soil differentiation. The US government warrant for approximately 5 percent additional shares at $20 exercisable on foundry spin-off creates an overhang on the most obvious bear-case restructuring path. The risk evidence points strongly negative.
Momentum factor. The stock gained approximately 250 to 260 percent year to date as of late June 2026 (Barchart +260.08 percent; alternate source +217 percent; the discrepancy likely reflects different base-date conventions, with both figures representing extraordinary performance versus the SOXX at roughly +98 percent year to date over the comparable period). The 52-week high of $141.45 was set three trading days before the research date. RSI at 60.5 is strong but not classically overbought. Bank of America double upgrade to Buy with a $160 target (June 23, 2026) and Goldman Sachs new coverage at Neutral with a $150 target (June 25, 2026) represent two major-bank actions within 48 hours of the research date. News flow (Google TPU deal, preliminary Apple announcement, NVIDIA strategic investment, Clearwater Forest launch) has been consistently positive in June 2026. Retail sentiment is extremely bullish. Insider selling is net negative (seven sales, zero buys in the 90-day window), but this is rational at prices roughly 250 percent above the $20 to $23 cost basis of the strategic investors, not a signal of insider alarm. The momentum evidence points strongly positive.
Overall read. Positive momentum and real near-term growth meet negative valuation, elevated risk, and mixed quality at a consolidated level. The Hold reflects a stock where genuine fundamental progress - 18A in HVM, DCAI growth, strategic investor validation, government backstop - is already priced into or beyond current levels (37 to 49 percent above analyst consensus) without the commercial proof that would justify the foundry option premium: a major external customer for 14A. Neither a strong buy (the valuation is objectively stretched at any framework that requires earnings support) nor a sell (the option value is real, the momentum is powerful, and the national-security premium is not zero). The honest signal is Hold pending the 14A customer outcome expected in H2 2026.
Specific data-quality flags required by the compliance review:
-
YTD return (C-0004): Barchart reports +260.08 percent YTD as of June 25, 2026. A secondary source shows +217.21 percent. The discrepancy likely reflects different base-date conventions (December 31, 2025 closing price varies by data provider). Both figures confirm extraordinary performance versus the SOXX at roughly +98 percent over the comparable period. Neither is wrong; the reader should not assume a single precise figure.
-
Forward P/E (C-0009): Three sources give materially different forward P/E figures: Finviz 85.15 times, StockAnalysis 125.31 times, Yahoo Finance 151.52 times. These differences reflect different NTM EPS consensus estimates in the denominator. The range is 85 to 152 times depending on the source; any single point estimate would be misleading. All sources agree the multiple is extraordinarily high.
-
Beta (C-0006): Yahoo Finance and StockAnalysis show 2.23 (5-year monthly); Finviz shows 2.16. The difference reflects calculation window. Both confirm this is a high-beta stock that moves roughly twice the market on a daily basis.
-
Short interest (C-0015): Two sources within 5 percent of each other (Finviz 134.96 million shares, MarketBeat 128.6 million shares). Directional read (declining trend from approximately 141 million shares) is consistent across sources.
-
Average daily volume (C-0017): StockAnalysis shows 113.3 million shares per day (likely 30-day window); Yahoo Finance shows 134.88 million shares per day (likely 90-day window). The difference reflects calculation window, not a data error.
-
Analyst count and breakdown (C-0019): StockAnalysis (S&P Global) shows 49 analysts with breakdown Strong Buy 11, Buy 2, Hold 32, Sell 2, Strong Sell 2. MarketBeat shows a different breakdown. Both sources agree the modal rating is Hold.
-
EV/Sales peer table (C-0013): Sourced from Finviz as of June 25, 2026. Classified as UNVERIFIED on second-source basis. The INTC EV/Sales figure (12.9 times) includes internal Intel Foundry transfer revenue, which overstates revenue relative to fabless peers and makes the Intel EV/Sales ratio artificially favorable in peer comparisons.
-
Apple foundry deal (C-0022): UNVERIFIED as a signed contract. Preliminary status per compliance-report.md. No Intel or Apple SEC filing or joint press release has confirmed signed commercial terms, volume, or product as of June 25, 2026.
-
18A yield range (C-0122 context): 55 to 65 percent range is an analyst estimate, not an Intel-published figure. Intel’s CFO has guided “appropriate yields by end of 2026.” The D0 less than 0.4 defects per square centimeter claim is Intel-sourced and unvalidated by independent third parties.
-
Foundry wafer pricing (C-0153): The approximately $25,000 per wafer 18A price is an industry estimate. Intel has not publicly disclosed wafer pricing.
This article is OSINT research for educational purposes only and does not constitute investment advice or a solicitation. Figures are point-in-time as of 2026-06-25. The author may hold positions in securities discussed.