
Research date: June 25, 2026 | OSINT market research on Cisco Systems, Inc. (CSCO, NASDAQ), the $469B networking incumbent that spent a decade as a range-bound dividend stock and then broke out to all-time highs above its dot-com-era record in May 2026 - driven by a $9 billion hyperscaler AI infrastructure order ramp, the Silicon One G300 custom ASIC (Application-Specific Integrated Circuit - a chip purpose-built for one specific job rather than general-purpose computation; the Silicon One line are packet-processing ASICs), and a $28 billion Splunk acquisition that repositioned it overnight as one of the largest cybersecurity companies on the planet. Cisco’s fiscal year ends in late July; FY2025 closed July 26, 2025; Q3 FY2026 ended April 25, 2026.
Important disclaimer. This article is OSINT-based market research produced for educational and informational purposes only. It is not investment advice, not a recommendation to buy or sell any security, and does not constitute a personalized financial plan for any reader. Nothing here is a price target or a guarantee of any outcome. All prices, market capitalizations, and financial figures are point-in-time as of the research date (2026-06-25 / 2026-06-26) and move daily; verify before relying on any specific figure. Past performance is not indicative of future results. Consult a qualified financial adviser before making any investment decision.
CSCO-specific risks this piece examines: Hardware commoditization - Arista Networks holds the primary hyperscaler AI-switching design-wins while white-box SONiC paired with Broadcom Tomahawk merchant silicon offers a disaggregated alternative to Cisco’s integrated model. Splunk integration risk - a $28 billion acquisition whose cross-sell thesis (Cisco networking telemetry feeding Splunk SIEM) has not yet produced measurable ARR acceleration; Security segment revenue was flat year-over-year in Q3 FY2026. Security market competition - Palo Alto Networks, Fortinet, CrowdStrike, and Zscaler are pure-play specialists that are growing faster than Cisco’s Security segment. Hardware-to-software mix-shift risk - subscription revenue fell from 54% to 49% of quarterly revenue between Q4 FY2025 and Q3 FY2026 as AI hardware orders outgrew recurring software lines, compressing non-GAAP blended gross margin from 68.7% (FY2025) to 66.0% (Q3 FY2026). AI order concentration - the $9 billion FY2026 hyperscaler AI order target (orders booked, not revenue recognized) is concentrated in a small number of US hyperscalers and requires approximately $3.7 billion in Q4 alone - roughly twice Q3’s level - to close. Rate sensitivity - Cisco yields approximately 1.41% against a 10-year Treasury at approximately 4.4%, so a portion of the current ~25x multiple depends on the AI and Splunk growth narratives holding, not on income-stock mechanics. Tariff and supply-chain risk - hardware assembled in Mexico, Malaysia, India, and residual China-origin components face ongoing tariff exposure. Collaboration structural decline - Webex competes directly with Microsoft Teams and has been losing revenue ground. Net debt grew from $12.0 billion at FY2025 year-end to $14.7 billion at Q3 FY2026 as Cisco sustained dividends and buybacks rather than paying down Splunk acquisition debt.
Where this stock could be in 6 months, 1 year, 3 years, and 5 years
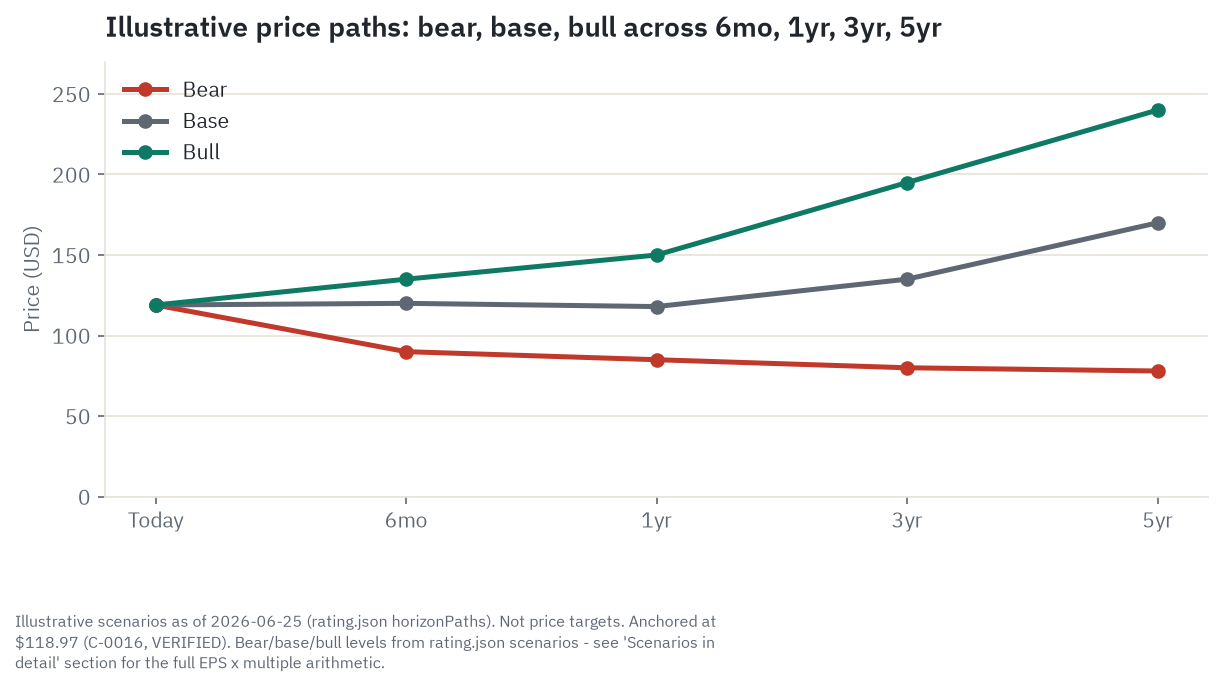
Cisco closed at $118.97 on June 25, 2026 (verified), roughly 8.7% below its all-time high of $130.37 set intraday in early June 2026 - the first time the stock had exceeded its split-adjusted dot-com-era peak in more than two decades. The stock spent most of the prior decade trading between $40 and $55 as a dividend utility. The breakout to all-time highs came in the twelve months following the first public AI infrastructure order disclosures. All dollar ranges below are illustrative estimates derived from stated scenario EPS assumptions and exit multiples. They are not price targets.
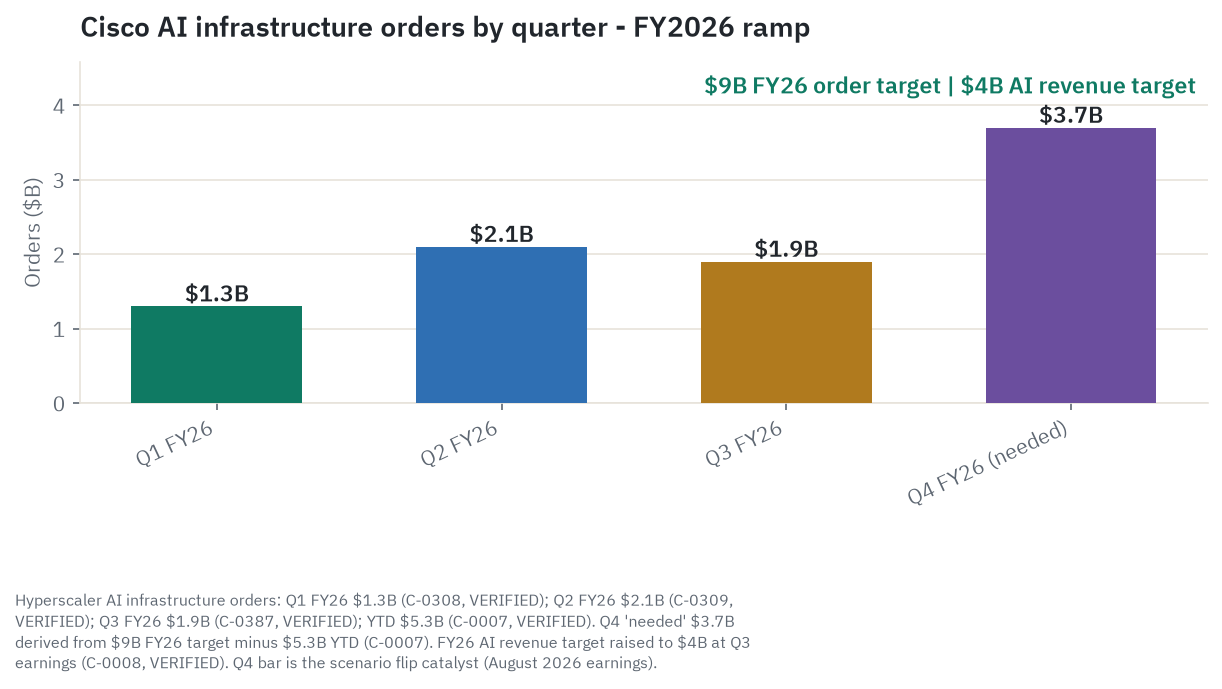
6 months (by December 2026). This window belongs to one event: Cisco’s Q4 FY2026 earnings, expected in August 2026. To hit its raised full-year target of $9 billion in hyperscaler AI infrastructure orders (a bookings figure, not recognized revenue), Cisco needs approximately $3.7 billion in Q4 alone - compared with $1.9 billion in Q3 and $2.1 billion in Q2. No single quarter has come close to that level. The G300 begins general availability in H2 FY2026, and year-end hyperscaler budget-flush behavior is a real seasonal pattern, so the math is not impossible. But it is also not mechanical. In the bull case, Q4 delivers at or above $3.5 billion and management provides a credible FY2027 AI framework at or above $10 billion in AI orders; the market prices FY2027 non-GAAP EPS of approximately $5.00 (estimate) at roughly 27x, implying approximately $135 (estimate). The base case assumes market consolidation near current levels while the street prices FY2027 EPS of approximately $4.75 (estimate) at roughly 25x, implying approximately $120 (estimate). The bear case is a Q4 miss below $2.5 billion with no credible FY2027 AI framework, causing multiple compression from roughly 25x back toward 20-21x on the FY2026 non-GAAP EPS guide midpoint of approximately $4.28, implying approximately $90 (estimate). The single thing that flips this window: Q4 AI order intake announced in August 2026.
1 year (by June 2027). At the one-year horizon, the roughly $5 billion in unconverted FY2026 AI orders provides a revenue bridge through the first half of FY2027 as those backlogged orders are delivered and recognized. That bridge runs out by Q3 FY2027. The dominant question is then whether new FY2027 order intake holds pace with FY2026. Hyperscaler AI capex growth is forecast to decelerate from approximately +51% in 2026 to approximately +13% in 2027 (Futuriom, estimate), creating a meaningful base-effect headwind. If FY2027 order intake sustains - supported by G300 design-wins and sovereign AI programs - the bull path to $150 (estimate) is available. If the bridge runs out and H2 FY2027 Networking revenue growth falls toward flat, the bear path to $85 (estimate) converges with the low sell-side price target of $84.98. The base case at $118 (estimate) reflects a market that prices mild growth deceleration but holds the AI narrative. The single flip: any major hyperscaler reducing its 2027 AI capex guidance by 15% or more is a 4-6 month leading indicator of Cisco Networking order deceleration.
3 years (by mid-2029). Structure governs beyond the near-term binary. Either Cisco’s Silicon One G300 has established multi-generational hyperscaler design-wins (creating a network-equipment installed base moat in AI clusters the way Catalyst switches built a moat in enterprise campus) or it has been a one-cycle participant in a market Arista continues to lead. Splunk’s cross-sell trajectory becomes clearly visible: Security ARR is either compounding at 8-12% organically - validating the $28 billion acquisition as a second growth engine - or is growing in the low single digits, making the acquisition look like a financial liability funded by $1.6-1.7 billion in annual interest expense. In the bull case, gross margin recovers toward 67-68% as G300 scale improves, Splunk cross-sell produces measurable ARR lift, and FY2029 non-GAAP EPS reaches approximately $7.25 (estimate) at roughly 27x, implying approximately $195 (estimate). The base case prices moderate compounding with partial AI durability: FY2029 EPS of approximately $5.90 (estimate) at roughly 23x implies approximately $135 (estimate). The bear case, where the AI cycle digests hard and Splunk stalls: FY2029 EPS near $4.50 (estimate) at roughly 18x implies approximately $80 (estimate). The single flip at this horizon: whether Security ARR is growing above or below 10% by late 2027.
5 years (by mid-2031). The five-year question is whether Cisco has earned the right to a sustained growth multiple or reverted to the income-stock valuation of the pre-AI decade. The bull requires Silicon One to have won at least two hyperscaler generations of design-wins, Splunk ARR to have compounded meaningfully, and the campus refresh cycle (driven by Wi-Fi 7 - the newest wireless standard, delivering roughly four to eight times the throughput of Wi-Fi 6 and pulling Catalyst switch upgrades into enterprise wiring closets alongside new access points) to have added a separate non-AI tailwind. In that scenario, FY2031 non-GAAP EPS of approximately $9.75 (estimate) at roughly 24.6x implies approximately $240 (estimate) - still at a material discount to whatever multiple the pure-play AI networking leaders command by then. The base case is a steady compounder through cycles: FY2031 EPS of approximately $8.00 (estimate) at roughly 21x implies approximately $170 (estimate), representing approximately 7% annual price appreciation from $118.97 plus the dividend - a low-to-mid-teens total return per year (estimate) if things proceed as the base projects. The bear case is value-trap reversion: FY2031 EPS near $5.00 (estimate) at roughly 15.5x implies approximately $78 (estimate) - the income-stock baseline multiple that prevailed from 2015 through 2023, when Cisco yielded 3-4% and grew slowly.
On balance, the evidence across valuation, growth, financial quality, risk, and momentum reads as a Buy at $118.97. This is not a screaming bargain - 25x forward non-GAAP earnings with gross margin compressing and ARR growing only 2% is not a gift - and the August 2026 AI order print is a genuine binary that could move the stock 20% in either direction. But consensus mean target of $127 sits above spot (unusual for large-cap tech after a big run), the dividend is covered and growing on its 15th consecutive annual increase, and the valuation gap to Arista at roughly 44x is wide enough that Cisco does not need to become Arista to justify its multiple - it just needs to not lose. I land on Buy.
Companion tool
The interactive dashboard sorts and filters Cisco’s key metrics against its ten-company peer set across valuation, growth, quality, risk, and momentum. The Excel model is a downloadable scenario builder with adjustable EPS growth and exit multiple assumptions for each of the four horizons above.
TL;DR
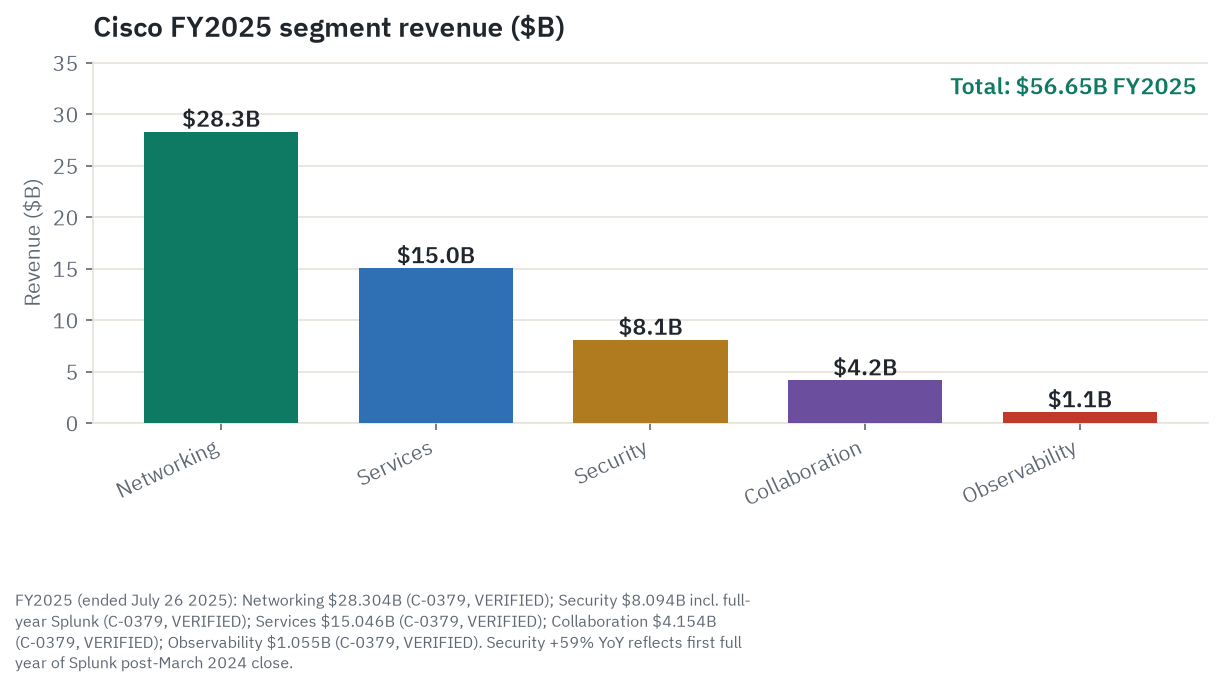
Cisco Systems is the world’s largest enterprise networking company by revenue - a company that built the plumbing of the internet over thirty years and has spent the past three years trying to convince the market it can also be the security analytics platform and the AI datacenter spine. Cisco’s fiscal year ends in late July; Q3 FY2026 ended April 25, 2026 and is the most recent completed quarter as of this writing. The company reports five segments: Networking (Catalyst campus switches, Nexus datacenter switches, Silicon One AI systems, ASR/NCS routers, and wireless - $28.3 billion in FY2025, the largest segment by far), Security (Splunk SIEM/SOAR, Cisco Firewall/Hypershield, SASE, Duo, XDR - $8.1 billion in FY2025, up 59% due to the first full year of Splunk contribution), Services (technical support contracts and professional services - $15.0 billion at the highest gross margin), Collaboration (Webex - $4.2 billion, structurally challenged by Microsoft Teams), and Observability (AppDynamics, ThousandEyes, Splunk observability - $1.1 billion). Total FY2025 revenue was $56.7 billion (+5% year-over-year), recovering from the FY2024 post-COVID inventory-correction trough of $53.8 billion. FY2026 guidance has been raised four consecutive times to $62.8-63.0 billion (+11% implied) as AI infrastructure orders from hyperscalers accelerated well beyond initial expectations. The AI infrastructure order ramp - $1.3 billion in Q1 FY2026, $2.1 billion in Q2, $1.9 billion in Q3, cumulative $5.3 billion through Q3 against a raised full-year target of $9 billion - is the single most load-bearing claim in the investment case. That $9 billion is a bookings figure, not recognized revenue; Cisco separately targets $4 billion in recognized AI revenue for FY2026, implying a roughly 4-6 month order-to-delivery lag. The Splunk acquisition ($28 billion, closed March 2024) made Cisco a top-five cybersecurity company by revenue overnight, adding approximately $4 billion in ARR at close, but Security segment revenue was flat year-over-year in Q3 FY2026, raising questions about integration progress. Total ARR reached $31.2 billion in Q3 FY2026 but grew only 2% year-over-year - the slowest pace since before the Splunk close - as the AI hardware surge outpaced subscription growth. Non-GAAP blended gross margin compressed from 68.7% (FY2025) to 66.0% (Q3 FY2026) as lower-margin Networking hardware grew fastest. Against this backdrop, Cisco trades at approximately 25x forward non-GAAP EPS (range 25.1-25.4x, DISPUTED across sources as of June 25-26, 2026) compared with Arista Networks at approximately 44x (range 43.85-44.72x, DISPUTED) - a gap that prices Cisco’s diversified legacy weight and prices Arista’s pure-play AI-networking growth. The quarterly dividend is $0.42 per share ($1.68 annualized), yielding approximately 1.41% at the June 25 close, with 15 consecutive annual increases. The evidence lands at Buy: genuine AI order momentum, a covered and growing dividend, the lowest forward multiple in its pure-tech peer set, and consensus mean target above spot. The honest caveat is that the August 2026 Q4 AI order print is the scenario-flip that could move this stock sharply in either direction.
Explore it yourself: the interactive dashboard
What Cisco actually is today
Most investors think of Cisco as “the router company” - the blue-chip name that has been on the Dow Jones Industrial Average since 2009 and pays a reliable quarterly dividend. That framing is about a decade out of date, and the gap between the popular mental model and the actual business is exactly where the investment case lives.
The two Ciscos inside one company. The first Cisco is the networking hardware incumbent: the company whose switches, routers, and wireless access points sit inside virtually every large enterprise, hospital, university, data center, and service-provider network on the planet. This hardware base - built over thirty years of relentless acquisitions, standards development, and certification-ecosystem creation - generates the $15 billion per year in support and services revenue and the $31 billion in total annual recurring revenue that make Cisco’s cash flows so stable. Hardware orders cycle up and down; the support annuity barely moves. That is the income stock.
The second Cisco is the transformation story: a company trying to convert its hardware installed base into a software and subscription platform, and - following the $28 billion Splunk acquisition in March 2024 - a company that became one of the largest cybersecurity operations in the world essentially overnight. Security analytics and observability are structurally different businesses from networking hardware: they compound in subscription form, carry 70%+ gross margins, and create the kind of sticky multi-year enterprise contracts that support a higher valuation multiple. The Splunk acquisition was a bet that Cisco could use its unmatched network visibility (it literally sees all traffic on every device it manages) as the data layer that makes a security analytics platform genuinely differentiated.
The tension between these two Ciscos - one hardware-cycle-dependent, one trying to compound in subscription form - defines the investment debate.
The five reported segments. Networking is Cisco’s largest segment and its primary cash engine. It includes campus switches (the Catalyst 9000 series), data center switches (Nexus 9000), enterprise routers (ASR, ISR), service-provider platforms (NCS 5500, Cisco 8000 running Silicon One), wireless access points (Meraki, Catalyst WiFi), and now the Silicon One-based AI cluster networking systems that are driving the FY2026 revenue reacceleration. Software embedded in Networking - Catalyst Center (formerly DNA Center) for campus orchestration, Meraki’s cloud-managed platform - is where most of Networking’s subscription revenue lives. Security became Cisco’s second-largest segment after the Splunk close and covers Splunk (SIEM, SOAR, Splunk Cloud), Cisco Secure Firewall (Hypershield - a cloud-native AI firewall - and Firepower NGFW, where NGFW stands for Next-Generation Firewall: a device that adds application-layer traffic inspection, intrusion prevention, and encrypted-traffic analysis beyond the port and protocol filtering of traditional firewalls), SASE (Cisco Umbrella, Meraki SD-WAN, Secure Access), XDR (Cisco’s Extended Detection and Response platform), Duo (zero-trust identity and MFA), and Umbrella. Collaboration covers Webex (meetings, calling, contact center, room devices) and competes directly with Microsoft Teams - a fight Cisco has been losing at the margin for years. Observability covers AppDynamics (application performance management), ThousandEyes (internet and network intelligence), and Splunk’s observability features. Services is the support annuity: Smart Net Total Care contracts, technical assistance, and professional services tied to the full installed base.
Scale and context. FY2025 total revenue: $56.7 billion. Approximately 80,000 employees. Headquarters: San Jose, California. CEO: Chuck Robbins, in the role since July 2015. CFO: Scott Herren. Market cap at the June 25, 2026 close: approximately $468.9 billion (Yahoo Finance, point-in-time, moves daily).
The analogy. Think of Cisco as the landlord of the internet’s interior. Every enterprise, hospital, university, and data center needs wiring, switches, and routers to move data between its systems - the equivalent of hallways and plumbing. Cisco built most of those hallways over thirty years and earns maintenance fees from the ongoing care of that infrastructure. The AI era is adding an entirely new wing to the building - AI training clusters that need extreme-bandwidth, low-latency Ethernet plumbing to connect thousands of GPU nodes. Cisco is competing to be the landlord of those new hallways too, while simultaneously trying to convert the old-hallway maintenance contracts into software subscriptions.
How money flows through Cisco
flowchart TD
    ENT["Enterprise IT budgets ~$125B networking TAM 2025"]
    SP["Service providers: AT&T Verizon DT NTT"]
    HYP["Hyperscalers + AI buildout: AWS Azure Google Meta xAI"]
    GOV["Government + sovereign AI programs"]

    ENT --> CISCO
    SP --> CISCO
    HYP -->|"$9B FY26 AI orders target"| CISCO
    GOV --> CISCO

    TSMC["TSMC 3nm - sole foundry for Silicon One G300"]
    ACACIA["Acacia Communications - silicon photonics 800G/1.6T"]
    EMS["EMS: Foxconn Flex Celestica - Mexico Malaysia India"]
    EXTOPT["External optics: Coherent Lumentum Innolight"]
    MEM["Memory: Samsung SK Hynix Micron - commodity"]

    TSMC --> CISCO
    ACACIA --> CISCO
    EMS --> CISCO
    EXTOPT --> CISCO
    MEM --> CISCO

    CISCO["Cisco Systems - $56.7B FY25 revenue - networking toll-taker"]

    CISCO --> NET["Networking hardware $28.3B FY25 - Catalyst Nexus ASR Silicon One"]
    CISCO --> SEC["Security + Splunk $8.1B FY25 - SIEM SASE Firewall Duo"]
    CISCO --> SVC["Services support $15.1B FY25 - support + pro-svcs"]
    CISCO --> SW["Software subscriptions - Meraki DNA Center Cisco+"]
    CISCO --> OBS["Observability - AppDynamics Splunk Observability"]

    NET --> ARR["ARR annuity $31.2B Q3 FY26 - contractual installed-base revenue"]
    SEC --> ARR
    SVC --> ARR
    SW --> ARR
    OBS --> ARR

    ARR --> RPO["RPO backlog $43.5B - forward contractual obligations"]
    ARR --> RET["Shareholder returns - dividend $1.68/yr + buyback"]

    ANET["Arista 7800 AI spine - DC switching rival - Broadcom TH6 silicon"]
    WBOX["White-box SONiC - hyperscaler self-build - disintermediation risk"]
    IB["Nvidia InfiniBand Quantum-3 - AI cluster rival - losing AI share to Ethernet"]
    TARIFF["Tariff + China risk - China mfg cut 80% - TSMC concentration"]

    HYP --> ANET
    HYP --> WBOX
    HYP --> IB

    EMS --> TARIFF
    TSMC --> TARIFF
Three paths move money from buyers into Cisco’s P&L. The campus and service-provider path is the annuity: an enterprise buys a Catalyst switch, activates a multi-year DNA Center subscription, and signs a Smart Net Total Care support contract. The hardware is recognized on shipment; the subscription and support stream in ratably over three to five years at roughly 68-72% gross margin. That stream compounds quietly regardless of whether the enterprise buys any new hardware next quarter. The AI infrastructure path is the growth story: a hyperscaler orders Silicon One-based Nexus systems and 800G pluggable optics for an AI cluster fabric. Revenue recognizes on delivery, typically 4-6 months after the order is placed. The gross margin on this path - approximately 62-64% on switching hardware, lower on commodity optics - is real but below the campus software subscription. The security and observability path is the transformation bet: a Cisco networking customer is sold Splunk SIEM or Cisco SASE, creating multi-year SaaS ARR recognized ratably at approximately 70%+ gross margin. This is the highest-quality revenue in the portfolio and the path the $28 billion Splunk acquisition was designed to widen.
Where Cisco’s moat sits: the enterprise installed base. Millions of switches and routers deployed globally generate service contracts that renew almost automatically, because the cost of replacing Cisco hardware - recertification, workforce retraining, integration rebuilding - outweighs the savings from switching to a competitor for most enterprises. The human-capital dimension makes this moat unusually durable. Network engineers who design and operate Cisco infrastructure typically hold CCNA (Cisco Certified Network Associate), CCNP (Professional), or CCIE (Expert) credentials - certifications that are Cisco-architecture-specific and do not transfer cleanly to Juniper EX or Arista EOS environments. Replacing Cisco gear means either retraining the entire network team or hiring differently credentialed engineers, a real organizational cost that procurement spreadsheets rarely capture but that CIOs factor into vendor consolidation decisions. That installed base is also the natural distribution channel for Splunk cross-sell: a Cisco networking customer already has a Cisco relationship and a Cisco support contract; selling them Splunk SIEM should, in theory, be a warmer conversation than a cold call.
The five segments: where the revenue actually comes from
Networking - the cash engine
Networking generated $28.304 billion in FY2025 revenue, representing 50% of total. That figure actually declined 3% year-over-year in FY2025 as enterprise customers worked through excess inventory purchased during the 2021-2022 supply-chain surge and paused new orders for most of FY2024. The recovery since then has been dramatic: Networking grew 15% year-over-year in Q1 FY2026, 21% in Q2, and 25% in Q3 - the best quarterly growth rates in the segment’s post-dot-com history - driven primarily by hyperscaler AI infrastructure orders.
Q3 FY2026 Networking segment revenue was $8.815 billion, its largest single-quarter reading ever. Campus switching and routing also contributed as the enterprise refresh cycle normalized. Within the segment, the AI infrastructure portion - Silicon One-based Nexus systems and pluggable optics - has grown from zero two years ago to a material fraction of Networking revenue. Cisco does not break out AI hardware revenue within Networking separately on a segment basis; the AI order metric ($5.3 billion year-to-date through Q3) is an order (bookings) figure that spans both Silicon One systems and optics, converting to recognized Networking revenue over roughly 4-6 months.
The gross margin pressure in Networking is real. GAAP product gross margin was 64.5% in FY2025 and fell to 61.9% in Q3 FY2026. The AI hardware orders - systems and optics - carry hardware margins that are lower than the embedded software subscriptions (DNA Center, Meraki cloud management) that come with campus equipment. As AI hardware grows faster than the software-rich enterprise campus business, blended Networking margins compress.
The product gross margin gap also matters for the long-term thesis. If AI orders eventually carry software attach - management software for AI cluster networks, Splunk observability monitoring - the margin profile improves. That attach is minimal today.
Security - the transformation engine, Splunk-boosted
Security generated $8.094 billion in FY2025, up 59% year-over-year. Nearly all of that growth came from the Splunk acquisition, which closed March 18, 2024 and contributed roughly $3.0-3.5 billion in incremental FY2025 revenue versus the partial FY2024 contribution. Organic Cisco security (firewall, SASE, Duo) also grew but not at 59%.
Splunk brought approximately $4 billion in ARR at acquisition close in March 2024. Cisco does not separately disclose Splunk ARR post-close; the only confirmed ARR figure is the approximately $4 billion at acquisition close. Total company ARR grew from $29.6 billion at FY2024 year-end to $31.1 billion at FY2025 year-end to $31.2 billion at Q3 FY2026 - a deceleration from the +22% growth (acquisition year) to +5% to +2% that tells you the organic post-close ARR trajectory has been sluggish.
The most alarming near-term signal is that Security segment revenue was flat at $2.0 billion in Q3 FY2026 despite Cisco having owned Splunk for more than two fiscal years. CEO Chuck Robbins acknowledged dissatisfaction with the Security segment’s pace in Q1 FY2026: “None of us are happy about where we are right now.” Management attributed the flatness primarily to a faster-than-expected shift of Splunk customers from on-premises perpetual licenses (recognized upfront) to cloud subscription (recognized ratably), creating a near-term revenue recognition trough. That timing explanation is credible - but it does not explain why cross-sell is not yet producing meaningful incremental ARR from Cisco’s 100,000+ networking accounts adopting Splunk SIEM. Through FY2025, Cisco cited “300 new logos across two quarters” from cross-sell. Against 100,000+ potential accounts, that pace is early-stage.
The Security segment carries the highest gross margins in the business - software-heavy Splunk SaaS and security subscriptions run at approximately 70%+ - so any acceleration here flows disproportionately to earnings. That is why the Splunk thesis matters so much at the five-year horizon.
Collaboration - the challenged segment
Collaboration generated $4.154 billion in FY2025, up a negligible 1%, and declined 1% year-over-year in Q3 FY2026. The competition is structural. Microsoft Teams bundles at effectively zero marginal cost inside Microsoft 365 enterprise agreements - the same agreement that virtually every Cisco Collaboration customer already holds. Cisco cannot win a price war when the competitor’s pricing is zero.
Cisco has pushed AI differentiation in Webex (AI meeting summaries, Webex AI Agent, Webex Contact Center AI) but the user-base gap is wide. Teams reported approximately 320 million daily active users as of 2025; Webex’s base is a fraction of that.
This segment provides cash flows that fund other areas, and Cisco manages it as a harvest business. The structural decline will likely continue at low-to-mid single-digit rates annually. It is a permanent drag on blended revenue growth, and any Webex goodwill write-down would be a negative headline.
Observability - the emerging segment
Observability, in software operations terms, means understanding the internal state of a distributed system from the signals it emits - metrics, logs, and traces - so that engineers can diagnose latency spikes, error rates, and request failures before end users feel them. APM, or Application Performance Management, is the narrower practice of tracking application-level performance: how long each service call takes, where requests slow down, and which code paths consume the most resources. Cisco holds three observability assets: AppDynamics for APM, ThousandEyes for network-path intelligence across the public internet, and Splunk’s observability stack for infrastructure monitoring and incident correlation.
Observability generated $1.055 billion in FY2025, up 26%, and $0.269 billion in Q3 FY2026, up 3%. The segment covers AppDynamics (application performance management - tracking service-level latency, error rates, and request traces inside application code), ThousandEyes (network intelligence - testing reachability and performance from vantage points across the internet), and the observability features from Splunk (IT Service Intelligence, Splunk Observability Cloud). The Splunk integration blurs the line between Security and Observability; some Splunk capabilities appear in both.
Observability matters for the cross-sell thesis: if Cisco can provide a single unified view of application performance, network behavior, and security telemetry - using its own networking sensors plus Splunk analytics plus AppDynamics APM plus ThousandEyes internet visibility - it has a full-stack offering that pure-play observability vendors like Datadog or Dynatrace cannot replicate from the network layer up. The execution of that cross-product integration, rather than its product roadmap, is what will determine whether Observability grows into a meaningful standalone business.
Services - the durable annuity
Services generated $15.046 billion in FY2025, up 3% year-over-year. Q3 FY2026 showed a slight decline at $3.724 billion (-1% year-over-year). This segment covers Smart Net Total Care (technical assistance center support for hardware), Solution Support (multi-vendor support), and professional services (implementation, optimization). Services gross margin is the highest of any segment: 68.5% GAAP (FY2025), rising to 69.2% GAAP and 71.6% non-GAAP in Q3 FY2026.
The Services annuity is the structural floor under Cisco’s cash flows. It is tied to the cumulative value of hardware and software deployed globally over three decades - a base so large that even a significant product revenue decline does not shrink Services meaningfully in the near term. As long as the installed base is maintained and refreshed, Services renews.
The long-term trajectory: as hardware transitions to subscription licensing, some revenue currently classified as hardware support in Services will migrate into product ARR. This is structurally positive for margin and revenue visibility but creates some reclassification noise in the near-term reporting.
The AI infrastructure thesis: is Cisco an AI winner?
The datacenter networking need
An AI training cluster of 10,000 Nvidia GPUs needs two separate networks. The front-end network connects the cluster to storage and the broader data center fabric - conventional Ethernet works fine for this. The back-end or intra-cluster fabric is where the physics gets demanding: during a training run, all the GPUs need to exchange gradient updates in coordinated all-reduce operations - where every GPU broadcasts its partial gradient to every other GPU simultaneously, thousands of times per second, so a 100,000-GPU cluster must move multiple terabits of data in perfectly synchronized bursts; one slow link stalls the whole training job. Even a small latency or bandwidth imbalance in that fabric slows the entire cluster. At scale (100,000+ GPUs), the back-end fabric must deliver terabits per second of bisection bandwidth with sub-microsecond latency and near-perfect load balancing. This is precisely why the back-end fabric requirements in AI clusters are so extreme - and precisely where Cisco’s AI-networking opportunity sits.
Nvidia’s InfiniBand - acquired through Mellanox in 2020 - dominated this back-end fabric market through 2023. Ethernet, historically slower for this use case, has been closing the gap through two mechanisms: the Ultra Ethernet Consortium’s protocol stack (lower-latency Ethernet flow control for AI workloads) and higher-radix Ethernet ASICs from both Broadcom (Tomahawk 6 at 102.4 Tbps) and Cisco (Silicon One G300 at 102.4 Tbps). Several hyperscalers have moved aggressively toward Ethernet back-end fabrics because they prefer not to be solely dependent on Nvidia for both the GPUs and the interconnect. That preference is Cisco’s opening.
[See also the Nvidia (NVDA) deep-dive for the Spectrum-X Ethernet AI networking roadmap and how it competes with Cisco’s Silicon One position.]
Silicon One: Cisco’s custom silicon strategy
Cisco’s Silicon One ASIC program began in 2019 as a unified routing and switching silicon family. The G300, announced in February 2026 at 102.4 Tbps on TSMC’s 3-nanometer node, is the first device positioned explicitly for hyperscale AI cluster back-end fabrics. Key technical claims: P4 programmability (customers can customize packet-processing behavior without hardware changes), power efficiency on a per-terabit basis, and the ability to handle both routing and switching on a single chip, which simplifies network architecture at scale.
Cisco shipped its one-millionth Silicon One chip in Q2 FY2026 - a volume milestone that confirms the G100/G200 generation is in production, not just in the lab. The G300 targets general availability in H2 FY2026; the orders Cisco has been booking through Q3 FY2026 are primarily on G200 silicon, with G300 systems starting to fill in as production ramps.
One supply risk worth noting: the G300 is fabricated exclusively at TSMC on 3nm, the same node used by Apple for iPhone SoCs and by Nvidia for its next-generation Blackwell and Rubin ASICs. A Taiwan Strait disruption, a TSMC production incident, or an allocation squeeze in the second half of 2026 would delay G300 volume delivery and put Cisco’s ability to fulfill the upper end of its AI order book at risk. TSMC 3nm silicon supply has been secured through calendar 2026 per management; the risk re-opens for calendar 2027.
Optics: the other half of the AI order
Approximately 60% of Cisco’s AI infrastructure orders are Silicon One-based switching systems; approximately 40% are pluggable optical transceivers. Every switch port in an AI cluster fabric needs a transceiver - typically 800G today, moving to 1.6 Tbps at the leading edge - to connect the physical fiber between nodes. Cisco sells both Cisco-branded optics manufactured through Acacia Communications (which it acquired for $2.6 billion in 2021 and which provides coherent optics and silicon photonics technology) and sourced from external suppliers.
The optics market is competitive. Chinese suppliers Innolight and HG Genuine compete aggressively on price in the commodity pluggable market. Cisco’s bundled value proposition - optics plus switching plus Silicon One silicon plus system-level integration - gives it an advantage with hyperscalers that want vendor accountability for the full fabric, even if individual components could be sourced cheaper elsewhere. That bundling premium is real but not permanent; hyperscalers with strong internal NOS teams can mix and match more easily than an enterprise.
The AI order pipeline: what the numbers say
Cisco began disclosing hyperscaler AI infrastructure order intake quarterly starting in FY2026. The progression: $1.3 billion in Q1 FY2026, $2.1 billion in Q2, $1.9 billion in Q3, for a year-to-date total of $5.3 billion through Q3 against a full-year target that was raised from $5 billion to $9 billion at the Q3 earnings call. The FY2025 full-year AI order total was described as “over $2 billion” and represented a beat of the original $1 billion target.
Every reference to this $9 billion target requires a clear distinction: these are orders booked (bookings, or purchase commitments from hyperscalers), not recognized revenue. Cisco separately targets $4 billion in recognized AI infrastructure revenue for FY2026 - a same-year order-to-revenue conversion of roughly 44%, with the rest converting in subsequent periods as equipment is delivered and deployed. Approximately $1 billion in AI revenue was recognized in FY2025. The delta between $9 billion in orders and $4 billion in revenue creates a backlog of unconverted orders that provides a revenue bridge into H1 FY2027.
Beyond the four major US hyperscalers, Q3 FY2026 saw approximately $300 million in AI infrastructure orders from neocloud operators (CoreWeave, Lambda Labs, and similar AI-cloud providers that are purpose-built to rent GPU compute to AI developers - distinct from the four established hyperscalers), sovereign AI programs, and enterprise customers - an emerging second channel that could partially offset hyperscaler-cycle deceleration.
The Q4 math is the near-term binary. Hitting the $9 billion full-year target requires approximately $3.7 billion in hyperscaler AI orders in Q4 alone - roughly twice Q3’s $1.9 billion. CEO Chuck Robbins described the environment as a “networking supercycle” on CNBC in May 2026, his characterization of what Cisco sees as a multi-year demand surge. Whether the cycle earns that label depends on hyperscaler AI capex holding above current levels through 2027-2028, which analyst estimates suggest will decelerate materially (Futuriom, estimate).
Cisco vs. Arista: the AI networking rivalry
The most important competitive context in this article is that Cisco was the third-largest datacenter Ethernet switch vendor by revenue in Q1 2025 (calendar year), with declining share, while the overall datacenter Ethernet switch market grew 54% year-over-year in that quarter (IDC, C-0802, analyst tier). Arista reached $1.48 billion in datacenter Ethernet revenue in Q1 2025 (approximately 21% share); Nvidia Spectrum-X reached $1.46 billion (approximately 21%); Cisco was approximately $1.25 billion (approximately 18%). Cisco’s current AI-order ramp represents a recovery toward relevance, not a position of leadership. This framing is important for calibrating the bull case.
Per IDC’s Quarterly Ethernet Switch Tracker (analyst tier), Cisco’s share of total Ethernet switching revenue declined from approximately 29.8% in Q3 2025 to approximately 27.6% in Q4 2025. The analyst view, consistent with competitive dynamics, is that Arista and HPE/Juniper have been capturing a portion of the data-center switching market the IDC data reflects; IDC does not separately attribute the incremental share gains in its tracker data.
Arista’s strategic position in the hyperscaler accounts matters for the Cisco bull thesis. Arista’s two largest customers are Meta (approximately 26% of Arista’s FY2026 revenue) and Microsoft (approximately 16%) - the two hyperscalers that represent the largest aggregate AI capex spenders and the most sophisticated AI-cluster builders. These accounts use Arista as their primary AI fabric vendor. Cisco’s $5.3 billion in hyperscaler AI orders year-to-date is real, but the hyperscalers placing those orders appear to be diversifying supply across vendors rather than replacing Arista with Cisco. A diversification-supply-chain order and a primary-design-win order look identical in Cisco’s order metric but carry very different implications for FY2027 durability.
The white-box risk adds a structural dimension. Open networking - the SONiC operating system running on Broadcom Tomahawk/Trident merchant silicon - allows hyperscalers to build their own switches from disaggregated components, bypassing Cisco’s integrated silicon-plus-NOS value proposition entirely. Broadcom’s Tomahawk 6 at 102.4 Tbps had been shipping since 2025, giving the white-box ecosystem a one-year head start over G300. Cisco itself acknowledged the disaggregation trend in May 2026 by expanding SONiC support to all enterprise customers via the Nexus 9000 platform (per The Register, May 27, 2026) - a defensive move that implicitly concedes the hyperscaler preference for open-NOS alternatives. [See the Broadcom (AVGO) deep-dive for the Tomahawk merchant silicon roadmap and the economics of the white-box threat from Broadcom’s side.]
Arista’s own FY2026 AI networking revenue target is $3.5 billion (from approximately $1.5 billion in 2025), growing more than 130% year-over-year in AI revenue. Arista FY2026 total revenue is approximately $11.5 billion, growing approximately 27.7% year-over-year (StockAnalysis, approximate as of June 25-26, 2026). For context: Arista’s entire revenue base is smaller than Cisco’s Services segment alone ($15.0 billion in FY2025). The company the market treats as Cisco’s arch-rival in AI networking is, by revenue, a fraction of Cisco’s size - but growing more than twice as fast and carrying no legacy Collaboration or Services drag.
Sovereign AI and enterprise AI: beyond hyperscalers
Beyond the four large US hyperscalers, Cisco is targeting sovereign AI programs (EU member-state national AI infrastructure, Middle East, Asia) and enterprise AI (corporate on-premise or private cloud AI clusters). These markets move slower than hyperscaler builds but offer advantages to Cisco: government customers value security clearances and supply-chain compliance (Cisco has both; many white-box alternatives do not), procurement cycles are less price-sensitive, and Cisco’s full-stack networking plus security plus observability bundle has more value in a government environment than in a hyperscaler that writes its own NOS.
The Q3 FY2026 non-hyperscaler AI orders of approximately $300 million are the first visible data point in this channel. Modest now, but a potential second vector in FY2027-FY2028 as sovereign programs formalize.
The Splunk integration: the $28B security bet
What Splunk is and why Cisco bought it
Splunk built its reputation as the platform that made sense of machine data at enterprise scale - originally known as “grep on steroids” for log analysis - and evolved into the dominant Security Information and Event Management (SIEM) platform for large enterprises and government. A SIEM ingests security telemetry from every source in an environment (firewalls, endpoints, network devices, cloud services), correlates events, detects threats, and helps security analysts investigate and respond. Layered on top of the SIEM sits a SOAR platform - Security Orchestration, Automation, and Response - which automates the triage and response steps a security analyst would otherwise run by hand, turning a SIEM detection into a remediation action without requiring manual intervention for every alert. Both tools live inside the SOC (Security Operations Center - the dedicated team and tooling that monitors an organization’s environment for threats around the clock). Once a SIEM is embedded in a SOC’s workflow - with custom detection rules, dashboards, response playbooks, and years of historical data - it takes 12-24 months and significant productivity disruption to migrate away.
At acquisition close in March 2024, Splunk had approximately $4 billion in ARR, more than 15,000 enterprise customers, and had been growing ARR at approximately 20-25% annually when it was an independent company. Cisco paid approximately $157 per share, totaling approximately $28 billion (C-0319, primary). The strategic logic: Cisco’s network sees all traffic; Splunk analyzes all data. Together, the argument runs, they could correlate network and endpoint telemetry for threat detection in ways neither company could deliver alone.
Financial impact: what Splunk added to the P&L
Security segment revenue jumped from approximately $4 billion pre-acquisition to $8.1 billion in FY2025 (the first full year with Splunk). Non-GAAP operating income expanded substantially because Splunk’s SaaS gross margins are well above Cisco’s blended margins. The FY2025 FCF of $13.3 billion - up 30% year-over-year - reflects in part the Splunk software cash flows flowing through the consolidated P&L.
The debt side is less comfortable. Cisco issued $13.5 billion in bonds in February 2024 to help fund the acquisition and assumed $3.1 billion in Splunk convertible notes. A further $5.0 billion was issued in February 2025 (five tranches at 4.55-5.50% coupon rates) to refinance approaching Splunk convertible maturities. Total debt rose from $22.9 billion at FY2025 year-end to $31.3 billion at Q3 FY2026 (short-term debt rose from $5.2 billion to $11.9 billion - not new borrowing, but an accounting reclassification of the Splunk 0.75% convertible as it moved within 12 months of its September 2026 maturity date). Net debt (total debt minus cash and investments) grew from approximately $12.0 billion at FY2025 year-end to approximately $14.7 billion at Q3 FY2026. Cisco did not pay down debt; it sustained dividends and buybacks. Annual interest expense on the approximately $31 billion in total debt is estimated at approximately $1.6-1.7 billion per year (based on nine-month FY2026 interest cost; exact FY2025 figure is in the 10-K interest expense line - readers should verify independently).
Integration progress: what has been built
Cisco has announced a “Cisco Data Fabric” as the common telemetry layer connecting networking device data to Splunk analytics. The XDR platform uses Splunk as the data backend for correlated threat intelligence. The September 2025 Splunk .conf25 event presented integration milestones - a dozen-plus announced integrations between Cisco networking telemetry and Splunk analytics.
The cross-sell evidence through Q3 FY2026 is “300 new logos across two quarters” (Q4 FY2025 earnings commentary). Against more than 100,000 potential Cisco networking accounts, 300 new Splunk cross-sell logos over six months is early-stage evidence. It is not yet a verified growth engine at the scale the $28 billion purchase price demands.
One competitive dynamic that should concern Cisco bulls: IBM’s QRadar - one of the three largest enterprise SIEM platforms alongside Splunk and Microsoft Sentinel, with thousands of enterprise and government SOC deployments - is being exited by IBM. IBM announced it is migrating its QRadar SaaS customers to Palo Alto Networks’ Cortex XSIAM (Extended Security Intelligence and Automation Management - Palo Alto’s AI-native platform that combines SIEM ingestion, SOAR automation, and threat intelligence into a single architecture) rather than to Cisco Splunk. When a major SIEM incumbent vacates the market and routes its installed base to a competitor rather than to Splunk, it is a revealed preference about where enterprise SOC consolidation is heading. Palo Alto’s Next-Gen Security ARR reached $6.3 billion growing 33% year-over-year in Q2 FY2026 (C-0806, C-0337) - Cisco’s total Security ARR trajectory, implied by total ARR growing only 2%, is not on the same footing.
The debt and its implications
Cisco’s net debt grew despite generating approximately $8.8 billion in operating cash flow over the first three quarters of FY2026. The capital allocation priority order implied by this data: dividend maintenance first, buyback second, debt paydown a distant third. Cisco has not disclosed a net debt-to-EBITDA target for returning to its historically net-cash balance sheet position. At $13-14 billion in annual FCF and $14.7 billion in net debt, paydown is mathematically achievable in one year - management is choosing not to pursue it. The practical consequence: approximately $1.6-1.7 billion per year flows to interest service on Splunk acquisition debt in perpetuity until management changes the capital priority order.
A useful frame for the Splunk opportunity cost: the $28 billion deployed in the acquisition, if applied instead to share buybacks at the pre-deal price range of approximately $55-65 per share, would have retired roughly 430-510 million shares - adding approximately $0.40-0.50 to annual non-GAAP EPS, an incremental 10-13% more earnings per share. The Splunk cross-sell must generate that and more in incremental Security ARR growth above whatever the organic Cisco security baseline would have achieved, before the acquisition proves its capital cost was justified. Security segment flat year-over-year in Q3 FY2026 is not yet producing that return.
The software and subscription transformation: ARR, RPO, and the mix-shift
ARR: the primary metric
Cisco defines ARR as the annualized value of all active subscription and support contracts - its clearest single signal of how much revenue is now recurring rather than one-time. The trajectory:
- FY2024 year-end (July 2024): $29.6 billion, +22% year-over-year - the Splunk acquisition year, which added approximately $4 billion in Splunk ARR at close.
- FY2025 year-end (July 2025): $31.1 billion, +5% year-over-year - the comparables catch up to Splunk, leaving organic growth visible.
- Q3 FY2026 (April 2026): $31.2 billion, +2% year-over-year. Product ARR grew +4%.
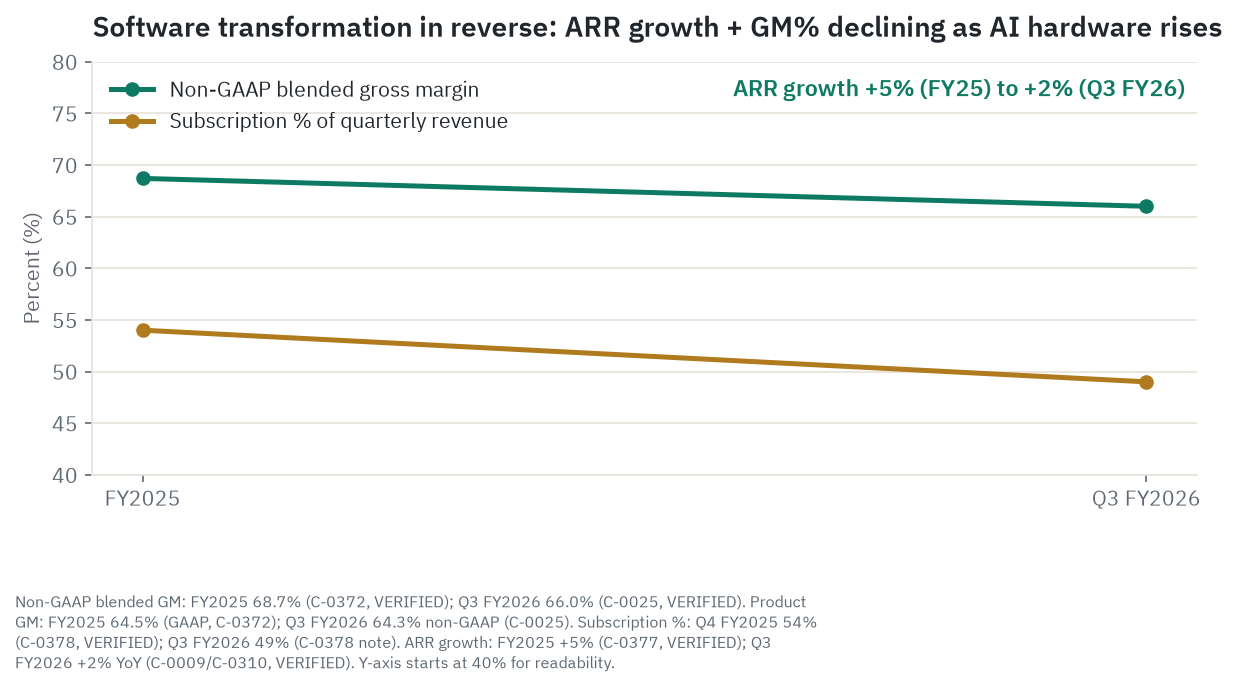
The deceleration from +22% to +5% to +2% in three periods is the most important structural signal in this thesis. The +22% was almost entirely the Splunk acquisition effect. The +5% was the first post-acquisition year. The +2% is the organic rate beneath the acquisition - and it is not accelerating. If AI hardware orders were generating meaningful software attach, product ARR would be rising as new AI cluster customers sign software subscriptions or Splunk observability contracts. It is not.
Total RPO (remaining performance obligations) was $43.5 billion at FY2025 year-end (up 6%), with product RPO up 8% and services RPO up 5%. At Q3 FY2026, total RPO was also approximately $43.5 billion (+4%), with product RPO at $22.1 billion (+6%) and long-term product RPO at $11.7 billion (+6%). This backlog tells you that multi-year contracts are being signed; the RPO is not shrinking. But the growth rate is modest.
Subscription revenue as a percentage of total revenue
The most counterintuitive data point in the FY2026 results: subscription revenue as a percentage of quarterly total revenue fell from 54% in Q4 FY2025 to 49% in Q3 FY2026. Cisco’s entire hardware-to-software transformation narrative requires this number to go up over time - to 60%, then 65%, then eventually 70%+ as SaaS and subscription replace one-time hardware. It is going down.
The mechanism is simple arithmetic: Networking hardware revenue grew 25% year-over-year in Q3 FY2026 while subscription-based lines grew at low single digits. The AI infrastructure orders are hardware orders. The transformation is not currently keeping pace with the AI hardware surge. Management has not disclosed a target subscription percentage in recent earnings calls.
RPO: the backlog quality check
The $43.5 billion RPO is the single most useful figure for assessing near-term revenue visibility. Approximately 50% is expected to convert to recognized revenue within 12 months, per the FY2025 10-K disclosure. Deferred revenue on the balance sheet - already billed but not yet recognized - was $28.6 billion at Q3 FY2026 (+2% year-over-year). These two numbers together indicate that Cisco’s near-term recognized revenue is well covered by contracted obligations, independent of whether any new order is placed tomorrow.
The hardware-to-software margin math
The gross margin logic is straightforward. Networking hardware carries approximately 57-64% non-GAAP gross margin depending on product mix. Software subscriptions (DNA Center, Meraki cloud management, Catalyst Center) carry approximately 72-78%. Services (TAC, SNTC) carry approximately 68-72%. Splunk SaaS carries approximately 70%+. Every dollar that shifts from hardware to software subscription should expand blended gross margins - in theory.
In practice, the AI hardware surge is running the math in the opposite direction temporarily. Non-GAAP blended gross margin fell from 68.7% in FY2025 to 66.0% in Q3 FY2026, a 270 basis-point compression in three quarters, as Networking hardware grew to 55.6% of total product revenue (from 49.9% in FY2025). Management’s assertion is that Silicon One G300 scale economics and improving optics margins will allow product gross margins to recover. That is forward-looking guidance backed by qualitative description, not a quantified target with a timeline. Until the margin recovery is visible in the quarterly data, the compression is the verifiable reality.
Competitive position
Cisco vs. Arista Networks (ANET): data center switching
Arista is Cisco’s most important competitive threat in data center switching and the pure-play AI networking alternative. The competitive comparison is blunt: Arista’s EOS (Extensible Operating System) and CloudVision management platform have been the preferred choice of hyperscaler and cloud network architects who want software simplicity, openness, and operational efficiency. Arista grew from negligible data center switching share in 2015 to approximately 21% of datacenter Ethernet revenue in Q1 2025 (IDC/NextPlatform, analyst tier) at the expense of Cisco, whose share declined over that period.
Arista’s FY2026 revenue is approximately $11.5 billion, growing approximately 27.7% year-over-year, with AI fabric revenue targeted at $3.5 billion for FY2026. Arista carries no net debt, has non-GAAP operating margins above 35% (approaching 43%), and focuses its entire R&D on a single product (EOS plus CloudVision plus the hardware platforms that run them). Cisco is larger by every revenue measure but slower-growing, more complex, and more leveraged. The market’s verdict is in the multiples: approximately 44x forward P/E for Arista versus approximately 25x for Cisco.
The Q1 2025 datacenter Ethernet picture (Cisco at #3 with declining share while the market grew 54%) was before most of Cisco’s FY2026 AI order ramp. The FY2026 orders represent a recovery, not a conquest. The credible bull case for Cisco in the Arista comparison is not “Cisco wins AI networking” but rather “Cisco wins enough AI networking that its multiple stops trading at a 44% discount to Arista.” Even a partial share recovery from the current position would narrow the valuation gap.
Cisco vs. HPE/Juniper: campus and service-provider
HPE acquired Juniper Networks for approximately $14 billion, closing in 2024. The combined entity covers campus switching (HPE Aruba plus Juniper EX), enterprise wireless LAN (Juniper Mist AI - a technically well-regarded AI-driven campus wireless platform), enterprise routing, and service-provider routing (Juniper MX480/960 competing with Cisco’s ASR 9000). Juniper’s Mist AI platform in particular is viewed by enterprise IT buyers as a credible alternative to Cisco Catalyst wireless in campus refreshes, particularly for customers who value AI-driven operations.
In service-provider routing, the combined HPE/Juniper is Cisco’s most significant challenger outside of hyperscaler accounts. Campus and SP market share shifts will become clearer over the next four to six quarters as the combined entity integrates and its sales force gets up to speed.
Cisco vs. Palo Alto Networks, Fortinet, CrowdStrike, and Zscaler (security)
The security peer set is Cisco’s most fragmented and fast-moving competitive arena. Each major security vendor has structural advantages:
Palo Alto Networks (PANW) is the consolidation play. Its XSIAM platform (AI-driven SIEM and SOAR) competes directly with Splunk, and its “platformization” narrative - convincing enterprise security teams to consolidate onto a single Palo Alto platform rather than running multiple point solutions - is the primary threat to the Splunk cross-sell thesis. Palo Alto’s NGS ARR reached $6.3 billion growing 33% year-over-year in Q2 FY2026, with a full-year target of $8.90-8.95 billion. Palo Alto will add more NGS ARR in FY2026 alone than Cisco’s entire Security segment generates in a quarter. (Palo Alto Networks forward P/E: approximately 74.80x as of June 25-26, 2026, per StockAnalysis - single-source, UNVERIFIED; point-in-time.)
Fortinet (FTNT) competes primarily in firewall and NGFW, where its ASIC-accelerated hardware delivers performance-per-dollar advantages in the mid-market and SMB segments where Cisco charges a significant premium for the integrated Cisco brand. Fortinet forward P/E: approximately 48.03x as of June 25-26, 2026, per StockAnalysis - single-source, UNVERIFIED; point-in-time.
CrowdStrike (CRWD) is the endpoint and XDR leader. Cisco’s XDR platform competes with CrowdStrike Falcon for enterprise extended detection and response. CrowdStrike’s Falcon platform has strong brand recognition in enterprise security after its rapid growth and its widely-publicized market presence.
Zscaler (ZS) is the cloud-native SASE leader, competing with Cisco Umbrella and Cisco Secure Access in the zero-trust network access market. Zscaler’s architecture is cloud-native from the ground up; Cisco’s SASE offering evolved from hardware-based network security appliances. The architectural difference matters to cloud-first enterprise buyers.
Microsoft Sentinel deserves separate treatment because it represents the same bundling dynamic that is quietly eroding Webex - applied now to SIEM. Sentinel is a cloud-native SIEM built into the Azure platform and included at effectively zero incremental cost inside Microsoft 365 E5 enterprise agreements. Any organization that already pays for an E5 license gets a functional SIEM without a separate Splunk purchase order. An enterprise running Cisco campus networking that also holds an E5 license is being offered SIEM capability by Microsoft for free at the exact moment Cisco is trying to cross-sell Splunk licenses. The competitive mechanic is structurally identical to Teams versus Webex: the competitor’s marginal price is zero, and no cross-sell motion wins purely on economics against that. Unlike Palo Alto XSIAM, which competes on technical platform consolidation logic and requires a deliberate purchase decision, Sentinel competes on price - and “already paid for” is a price point that no Splunk license can match on a comparable basis for budget-constrained enterprise security teams.
Cisco’s counterargument to all of these is integration. An enterprise running Cisco campus switching plus Cisco Secure Firewall plus Duo plus Umbrella plus Splunk has unified telemetry that flows from the network through to the SIEM. The bet is that this integration advantage translates into sales. The current evidence - Security segment flat at $2.0 billion in Q3 FY2026 after 27 months of Splunk ownership - says the advantage is real in pitch decks but not yet visible in bookings.
Cisco vs. Microsoft Teams: Collaboration
Microsoft Teams had approximately 320 million daily active users as of 2025. Webex’s user base is much smaller. The competitive dynamic is structurally unfavorable: Microsoft bundles Teams inside the Microsoft 365 enterprise agreement that most Cisco Collaboration customers already pay for, so switching to Webex requires paying a premium that Teams does not. Cisco has been repositioning Webex hardware (conference room devices, desk phones) and Webex Contact Center as premium enterprise tiers, while adding AI features. Neither has reversed the trend.
White-box and merchant silicon: the structural risk
The disaggregation architecture deserves its own treatment because it is the long-duration structural risk to Cisco’s data center switching business. The white-box model: a hyperscaler buys standard merchant silicon (Broadcom Tomahawk 6 at 102.4 Tbps, for example) from an ODM (original design manufacturer), runs SONiC (an open-source network operating system originally developed by Microsoft) on top, and builds its own switches at a significantly lower per-switch cost than buying a branded Cisco Nexus system. The hyperscaler trades Cisco’s integrated support, software stack, and Silicon One differentiation for lower cost, more control over their NOS, and vendor independence.
[The Broadcom (AVGO) deep-dive covers the Tomahawk merchant silicon roadmap, the white-box ecosystem economics, and Broadcom’s position as simultaneously a competitor (white-box enabling) and a Cisco supplier for some legacy switching silicon.]
Cisco’s own SONiC expansion in May 2026 - adding SONiC support to Nexus 9000 enterprise customers (The Register, May 27, 2026) - is a strategic acknowledgment of the disaggregation trend. On a Silicon One chip running SONiC rather than Cisco’s NX-OS (the proprietary Nexus OS that bundles management, telemetry, and orchestration tightly with the Silicon One hardware), the integrated-software value proposition that differentiated Cisco from a white-box switch largely disappears. This move may be necessary for Cisco to compete in disaggregated hyperscaler environments, but it erodes the margin quality of those accounts.
Peer comparison
| Metric | CSCO | ANET | PANW | FTNT | HPE |
|---|---|---|---|---|---|
| Fwd P/E (approx, as of Jun 25-26 2026) | ~25x (DISPUTED, range 25.1-25.4x) | ~44x (DISPUTED, range 43.85-44.72x) | ~74.8x (UNVERIFIED, single source) | ~48x (UNVERIFIED, single source) | ~12x (UNVERIFIED, single source) |
| Market cap (approx, Jun 25-26 2026) | $468.9B | ~$199B | ~$242B | ~$111B | ~$58B |
| Dividend yield | 1.41% | 0% | 0% | 0% | ~1.31% |
| FY2026 rev growth (approx) | +11% | +27.7% | n/a | n/a | n/a |
All peer market caps are approximate as of June 25-26, 2026 per StockAnalysis and move daily. All peer forward P/Es carry single-source UNVERIFIED status per the compliance review except CSCO and ANET, which have multi-source DISPUTED ranges. Readers should verify independently before relying on any specific multiple.
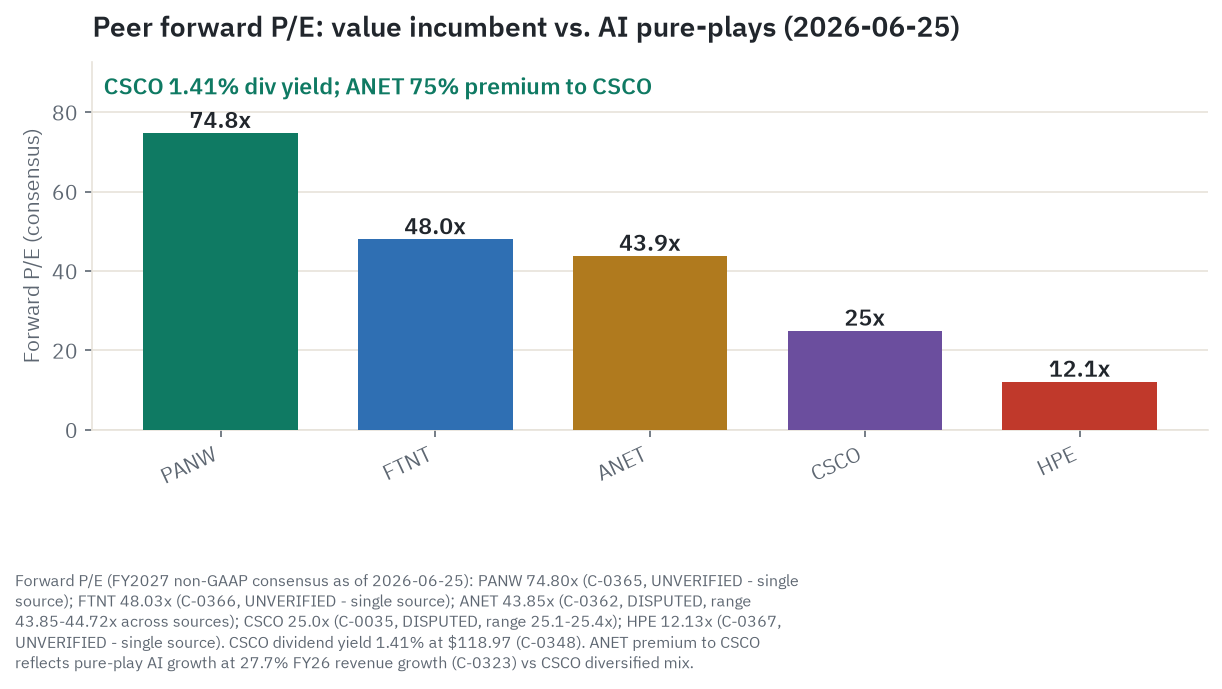
The peer table frames the valuation debate. Cisco at approximately 25x forward non-GAAP P/E is the lowest multiple in the pure-tech peer set, the only name with a meaningful dividend, and the only one with a business large enough to include legacy segments that depress the blended growth rate. HPE at approximately 12x shows what the market does to a hardware-heavy name with no AI networking premium despite the Juniper acquisition.
Financials from the filings
Sources: Cisco 10-K FY2025 (accession 0000858877-25-000111); 10-Q Q3 FY2026 (accession 0000858877-26-000078); 8-K earnings releases for Q4 FY2025 (August 13, 2025), Q1-Q3 FY2026 (November 2025, February 2026, May 13, 2026). CIK 0000858877.
Income statement
Multi-year revenue.
| Fiscal year | Revenue | YoY |
|---|---|---|
| FY2023 (ended July 2023) | $57.0B | Record peak |
| FY2024 (ended July 2024) | $53.8B | -6% |
| FY2025 (ended July 2025) | $56.7B | +5% |
| FY2026 guidance (midpoint) | ~$62.9B | +11% |
FY2024’s 6% decline was an inventory correction: enterprises had over-ordered networking hardware during the 2021-2022 supply chain panic and then stopped placing orders while working down the backlog. FY2025 recovered via the first full year of Splunk (Security segment +59%). FY2026 guidance has been raised four consecutive quarters from the original $59.0-60.0 billion to $62.8-63.0 billion, driven by AI order acceleration well above original expectations.
Product revenue FY2025: $41.6 billion (+6% year-over-year). Services revenue FY2025: $15.046 billion (+3%). Services represent 26.6% of total revenue.
FY2025 margins.
| Metric | GAAP | Non-GAAP |
|---|---|---|
| Gross margin | 65.6% | 68.7% |
| Product gross margin | 64.5% | n/a disclosed separately |
| Services gross margin | 68.5% | n/a disclosed separately |
| Operating income | $12.115B | $19.491B |
| Operating margin | 21.4% | 34.4% |
| Net income | $10.453B | $15.213B |
| Diluted EPS | $2.61 | $3.81 |
The GAAP-to-non-GAAP gap - approximately 1,300 basis points on operating margin and $1.20 on EPS - reflects primarily amortization of Splunk-acquired intangibles and stock-based compensation. The amortization is a real cost paid at acquisition; it is not a paper adjustment. The trailing GAAP P/E implied by $2.61 EPS at $118.97 is approximately 39.65x (cross-checked against Yahoo Finance, approximate; single-source). The forward non-GAAP P/E of approximately 25x (DISPUTED, range 25.1-25.4x across sources as of June 25-26, 2026) is what most sell-side analysts use and what the valuation discussion in this piece references. Both numbers matter; neither should be hidden from the reader.
Operating expenses FY2025: R&D $9.3 billion (16.4% of revenue), Sales and Marketing $10.966 billion, G&A $2.992 billion. Total operating expenses approximately $23.3 billion.
Q3 FY2026 (quarter ended April 25, 2026). Revenue $15.841 billion (+12% year-over-year) - record quarterly revenue. Non-GAAP EPS $1.06 (+10%). GAAP EPS $0.85 (+37%). GAAP gross margin 63.6% (product 61.9%, services 69.2%). Non-GAAP gross margin 66.0% (product 64.3%, services 71.6%). Non-GAAP operating margin 34.2%.
Geography
Americas $9.6 billion (+14% year-over-year) in Q3 FY2026, EMEA $4.1 billion (+9%), APJC $2.2 billion (+9%). Americas represents approximately 61% of quarterly revenue, driven by US hyperscaler AI spend concentrated in Northern Virginia, Phoenix, and Pacific Northwest data-center corridors plus US federal and enterprise demand.
China enterprise revenue is structurally shrinking as Chinese enterprises shift to Huawei networking under domestic-preference policies, and US export controls restrict high-performance Cisco routing equipment to Chinese government-adjacent entities. APJC’s 9% growth in Q3 FY2026 reflects Japan, Australia, and India offsetting China weakness.
ARR and RPO
| Period | Total ARR | YoY |
|---|---|---|
| FY2024 end (Jul 2024) | $29.6B | +22% |
| FY2025 end (Jul 2025) | $31.1B | +5% |
| Q3 FY2026 (Apr 2026) | $31.2B | +2% |
RPO at FY2025 year-end: $43.533 billion (+6%); product RPO $21.572 billion (+8%), services RPO $21.961 billion (+5%). RPO at Q3 FY2026: approximately $43.5 billion (+4%), long-term product RPO $11.7 billion (+6%). Deferred revenue: $28.6 billion at Q3 FY2026 (+2%), representing already-billed contracted revenue not yet recognized.
Cash flow
FY2025 full year:
- Operating cash flow: $14.193 billion (+30% year-over-year)
- Capital expenditures: $905 million
- Free cash flow: approximately $13.3 billion (FCF margin 23.5% of revenue)
- Dividends paid: $6.437 billion
- Share repurchases: $6.0 billion (approximately 93 million shares at average approximately $64.50)
- Total returned to shareholders: $12.437 billion (approximately 94% of free cash flow)
FY2026 year-to-date (Q1-Q3):
- Nine-month operating cash flow: approximately $8.8 billion (Q1 $3.2B, Q2 $1.8B, Q3 $3.8B)
- Nine-month capex: approximately $1.0 billion
- Nine-month free cash flow: approximately $7.8 billion
- Nine-month total returned: approximately $9.6 billion ($4.9B dividends plus $4.7B buybacks)
OCF running below FY2025’s quarterly pace, partially due to working capital timing as AI infrastructure orders require advance component procurement.
Balance sheet
| Item | FY2025 end (Jul 26, 2025) | Q3 FY2026 (Apr 25, 2026) |
|---|---|---|
| Cash + short-term investments | $16.1B | $16.6B |
| Short-term debt | $5.232B | $11.9B |
| Long-term debt | $22.861B | $19.4B |
| Total debt | $28.093B | $31.3B |
| Net debt | ~$12.0B | ~$14.7B |
The sharp shift in short-term debt from $5.2 billion to $11.9 billion is not new borrowing - it is an accounting reclassification: the remaining Splunk 0.75% convertible notes, due September 2026, moved from long-term to current liabilities as they came within 12 months of maturity. Cisco issued $5.0 billion in new notes in February 2025 at 4.55-5.50% coupon rates across five tranches to refinance upcoming maturities - locking in higher interest rates than the original Splunk financing for the refinanced tranches. Enterprise value as of June 25, 2026: approximately $484 billion (derived from closing market cap of $468.9 billion [C-0017, verified] plus net debt of approximately $14.7 billion per the Q3 FY2026 10-Q [C-0382, primary, verified]; this is a point-in-time calculation not sourced from any aggregator).
Guidance
Q4 FY2026 guidance (issued May 13, 2026): Revenue $16.7-16.9 billion; non-GAAP EPS $1.16-1.18; non-GAAP gross margin 65.5-66.5%; non-GAAP operating margin 34-35%. Q4 guidance also includes up to approximately $450 million in restructuring charges, with the balance of up to $1 billion total flowing into FY2027.
Full-year FY2026 guidance raised to $62.8-63.0 billion revenue and non-GAAP EPS $4.27-4.29. The trajectory of guidance raises tells a story on its own: the original August 2025 FY2026 guide was $59.0-60.0 billion; it has been raised approximately $3.5 billion over four quarters, driven almost entirely by AI order acceleration.
Market action and valuation
All figures are point-in-time as of the June 25, 2026 research date and move daily.
Stock price and context
Close June 25, 2026: $118.97 (Yahoo Finance, C-0016, verified). Market cap: approximately $468.9 billion (Yahoo Finance, C-0017, verified). 52-week range: $65.75 (low) to $130.37 (high) (C-0018, verified). The $130.37 intraday high set in early June 2026 was also a closing all-time high that exceeded the dot-com-era split-adjusted record - the first time Cisco’s stock had achieved this level in more than two decades.
Returns. CSCO returned approximately +49-54% year-to-date through June 25, 2026 (price-only return on the lower end at approximately +49%; total return including dividends approximately +54% on the upper end; figures vary by source and measurement date cutoff). The 1-year total return was approximately +67-74% depending on measurement method - price-only return approximately +67% (Barchart) versus total-return including dividends approximately +74% (Yahoo Finance); all figures are point-in-time and move daily (C-0028, C-0029, DISPUTED across sources). The 5-year price-only return was approximately +122% and total return including dividends was approximately +153% (C-0031, DISPUTED; price-only and total-return figures differ materially over longer periods). The 12-month stretch through June 2026 was, by most measures, the strongest in CSCO’s history since the dot-com era. The 3-month return through June 26, 2026 was approximately +40% (Barchart), driven by the Q3 FY2026 earnings beat and the raised AI-order target.
Beta. The 5-year monthly beta is approximately 1.00 (Yahoo Finance, StockAnalysis, C-0351). Cisco historically carried a beta of approximately 0.8-0.9 as a defensive income stock. The elevation to 1.00 reflects the AI narrative re-rating - the stock now correlates roughly with the broad market, which is a change from its prior defensive character.
Short interest. Approximately 1.57% of float as of June 25, 2026 (StockAnalysis, C-0352, UNVERIFIED; single source). Very low. The bear thesis is not being pressed by the short community at these levels. There is no short-squeeze dynamic in either direction.
Valuation multiples
| Multiple | CSCO | ANET | PANW | FTNT | HPE |
|---|---|---|---|---|---|
| Forward P/E | ~25x (DISPUTED, 25.1-25.4x range) | ~44x (DISPUTED, 43.85-44.72x range) | ~74.8x (UNVERIFIED) | ~48x (UNVERIFIED) | ~12x (UNVERIFIED) |
| EV/EBITDA (trailing) | ~28.5-28.9x (UNVERIFIED) | ~46x (UNVERIFIED) | n/m | ~45x (UNVERIFIED) | ~14x (UNVERIFIED) |
| P/FCF | ~39.8x (UNVERIFIED) | ~39.5x (UNVERIFIED) | n/m | n/m | ~16x (UNVERIFIED) |
| Dividend yield | 1.41% | 0% | 0% | 0% | ~1.31% |
All multiples are point-in-time as of June 25-26, 2026 per StockAnalysis, GuruFocus, and/or Yahoo Finance; they vary across data providers and move daily. Figures marked UNVERIFIED are single-source; figures marked DISPUTED have cross-source range differences. Readers should verify before relying on any specific multiple.
Trailing vs. forward P/E gap. The trailing GAAP P/E is approximately 39.65x (Yahoo Finance cross-check, approximate). The forward non-GAAP P/E is approximately 25x. The roughly 14-point gap is almost entirely the Splunk acquired-intangible amortization effect - a large real accounting charge that depresses GAAP earnings for the amortization life of the acquired assets (typically 7-15 years). GAAP investors see an expensive stock; non-GAAP investors see a mid-priced one. Both numbers are honest representations of different questions about the business.
PEG ratio. The PEG ratio of approximately 2.82 (StockAnalysis, UNVERIFIED) signals the market is paying a growth premium above what current forward growth rates mechanically justify. FCF yield: approximately 2.5% (trailing FCF approximately $11.8 billion TTM against $469 billion market cap). Against the 10-year Treasury at approximately 4.4%, the FCF yield does not offer a cash-flow-vs-bonds argument for owning CSCO; the thesis rests on growth.
Cisco vs. its own historical valuation
Cisco’s 5-year average forward non-GAAP P/E is approximately 22.35x (StockAnalysis, C-0359, UNVERIFIED). Its 3-year average is approximately 23.09x. The current approximately 25x sits above both - the AI-networking order disclosures and the Splunk security narrative have produced a modest re-rating above the recent-historical range. By this measure, the stock is not cheap on a relative-to-history basis. The income-era multiple of 14-18x (2015-2023 pre-AI period) is long gone. At approximately 25x, the market is explicitly pricing in continued AI order durability, not just a hardware-cycle recovery.
The dividend-growth profile
Quarterly per share: $0.42 (raised from $0.41 for Q3 FY2026; ex-date approximately April 2, 2026). Annualized: $1.68 per share (C-0347, verified). Yield at the June 25 close: approximately 1.41% (C-0348, UNVERIFIED; single source). Payout ratio: approximately 55.33% on trailing GAAP EPS (C-0349, UNVERIFIED; single source; uses GAAP $2.61 EPS as denominator). On a non-GAAP EPS basis ($3.81), the payout ratio is approximately 44%. On an FCF basis (FCF approximately $11.8 billion TTM, dividend approximately $6.6 billion per year), the FCF payout coverage ratio is approximately 1.8x - the dividend is well covered even in a moderate revenue decline. Consecutive annual dividend increases: 15 (the Q3 FY2026 8-K stated “15th consecutive year” of dividend increase).
Cisco is not yet a Dividend Aristocrat (which requires 25 consecutive years), but the 15-year growth streak, the low FCF payout ratio, and management’s consistent description of the dividend as the “first priority” in capital allocation all support dividend durability in most scenarios outside a sharp FCF contraction.
Institutional ownership, insider activity, and short interest
Institutional ownership: approximately 79.84% of shares (StockAnalysis, C-0354, UNVERIFIED). Largest holders: Vanguard Group approximately 9.3%, BlackRock approximately 8.4%, State Street approximately 4.4%, plus Geode Capital, Morgan Stanley, Schwab. CSCO is a Dow Jones Industrial Average component, which locks in continuous index-fund buying across the major passive vehicles. Passive index ownership (Vanguard plus BlackRock plus State Street combined) likely represents more than 20% of the float.
CEO insider transactions. Form 4 filings show that CEO Chuck Robbins sold shares at multiple price levels under pre-arranged Rule 10b5-1 trading plans: a sale of approximately 578,504 shares in November 2025 at approximately $76-79 per share (per Form 4 filings, C-0418, UNVERIFIED - press-tier intermediary source, not directly confirmed from primary SEC Form 4 in this research pass; readers should verify at SEC.gov) and a sale of approximately 21,400 shares in May 2026 at approximately $118-120 per share (C-0421, UNVERIFIED, same caveat). All sales are made under 10b5-1 plans adopted months before the transactions; no inference about near-term corporate developments or management confidence can be drawn from pre-scheduled plan sales. Cisco’s management messaging remains unambiguously bullish - “networking supercycle,” record AI orders - while the CEO has been a systematic seller at every major price level under his pre-arranged plans. The simultaneous existence of bullish public messaging and scheduled share sales is normal for executives managing concentrated equity compensation. Insider ownership is approximately 0.03% of shares outstanding at the mega-cap scale (C-0355, UNVERIFIED).
Analyst consensus
As of June 25, 2026 (S&P Global / StockAnalysis, C-0356, C-0357, C-0358; all UNVERIFIED, single aggregator source):
- Analysts polled: 26
- Rating distribution: 13 Strong Buy, 4 Buy, 8 Hold, 1 Sell, 0 Strong Sell
- Consensus: Buy
- Mean 12-month price target: approximately $127.18 (approximately +7% above the June 25 close)
- Median price target: approximately $130 (approximately +9% above)
- High target: $150 (BofA Securities, raised June 8, 2026)
- Low target: approximately $84.98
The $65 spread from low to high target is unusually wide for a mega-cap, reflecting genuine disagreement between AI transformation bulls and skeptics who question whether the AI order surge reflects durable hyperscaler preference or pull-forward demand. The mean and median targets sitting above the current price is unusual for large-cap tech after a significant run - it suggests the street has not fully chased the stock higher. Recent target raises: KeyBanc to $130 from $125 (Overweight, June 25, 2026); BofA to $150 from $135. Targets are analyst opinions with their own assumptions and should not be treated as facts.
Sentiment and narrative read
The Wall Street narrative
The dominant sell-side frame as of June 2026: Cisco has completed a successful business-model transition to date - the FY2024 inventory correction is resolved, AI infrastructure orders are a genuine incremental demand source above any model from eighteen months ago, and Splunk is adding ARR to a security customer base that is genuinely sticky. The counternarrative: the AI order concentration in a small number of hyperscalers is a risk, the cross-sell evidence from Splunk remains thin relative to the $28 billion investment, and the forward multiple of approximately 25x may already discount the transformation upside if FY2027 AI orders decelerate.
The contrarian coverage has begun to emerge. Trefis published two pieces in late June 2026 flagging the ARR deceleration to 2% (“Cisco Stock Looks Strong, But One Number Says Be Careful,” June 22) and the 330 basis-point product gross margin compression (“Everyone Is Watching Cisco Stock’s AI Orders. Here’s The Number They Stopped Bragging About,” June 24). These are the first mainstream contrarian reads after six weeks of near-uniform enthusiasm following the Q3 FY2026 breakout. The easy momentum phase may be maturing - though the scenario binary in August 2026 means the next datable catalyst is still ahead.
Retail investor sentiment
On r/dividends (the primary Cisco forum among income-oriented retail investors), the dominant frame in June 2026 is “AI dividend stock for retirees” - a rare combination of reliable dividend growth and AI-era participation. Posts celebrate the $1.68 per share annual dividend, the raised AI order target, and the fact that the stock has roughly doubled while remaining a “sensible” name. The income investor base tends toward multi-year holding periods and does not chase momentum.
On r/stocks and r/investing, the recurring post-run question is “is it too late to buy CSCO?” The consensus leans toward acknowledging the AI story is real but hesitating at $119 for a stock that was $65 eighteen months ago. Cisco is not a meme stock; retail position sizing is modest and the community does not YOLO into it.
On StockTwits and fintwit, the “networking supercycle” phrase propagated widely after CEO Robbins used it on CNBC in May 2026. The Cisco vs. Arista trade debate is a visible thread: CSCO bulls often frame it as “the value play catching up”; Arista bulls frame it as “Cisco is late to the party and the AI hardware wins are margin-dilutive.” Both are defensible readings of the same dataset.
An April 1, 2026 aggregated sentiment data point (25/100 bearish, 418 combined comments across r/WSB, r/stocks, r/investing, sourced from a 24/7 Wall St. article - soft/anecdotal signal) shows the crowd was actually negative on Cisco going into the quarter that produced the May 14 breakout. The crowd was not ahead of the stock. Retail sentiment tracking has almost certainly shifted materially since then, but no verified post-breakout quantified metric is available.
News flow
The timeline of narrative-shaping events:
September 2025 (Splunk .conf25): Integration milestone presentation. Broadly positive press but noted that cross-sell at scale remains unproven.
October 2025 (Q1 FY2026 earnings): $1.3 billion in AI infrastructure orders disclosed. Evercore ISI upgraded to Outperform with a target raised from $80 to $100 in late January 2026, an early leading sell-side rotation signal.
February 2026 (Silicon One G300 announcement plus Q2 FY2026 earnings): The G300 at 102.4 Tbps on TSMC 3nm landed well in the AI networking trade press. Analyst Dylan Patel of SemiAnalysis called it “a clear proof point” of Cisco’s emergence as an important AI Ethernet player. Q2 earnings ($15.3 billion revenue, $2.1 billion AI orders) beat the top line but Q3 guidance came in roughly in-line rather than above. The stock fell approximately 7% in extended trading and pulled back toward $78-80 through mid-March.
May 13-14, 2026 (Q3 FY2026 earnings): Record quarterly revenue $15.841 billion (+12%). Year-to-date hyperscaler AI orders hit $5.3 billion, already above the prior full-year $5 billion target. Full-year AI order target raised to $9 billion. CEO Robbins described the environment as a “networking supercycle” on CNBC. The stock surged approximately 15-17% on May 14 - its best single-day gain since 2011 - and touched an intraday all-time high above $119, exceeding the dot-com-era record. Market cap expanded by roughly $70 billion in a single session.
June 2026: Continued target raises (KeyBanc to $130, BofA to $150). First cautionary analyst pieces emerging on ARR deceleration and gross margin compression.
Narrative vs. fundamentals: where they diverge
The sharpest divergence: the AI winner narrative versus the ARR deceleration reality. The dominant crowd story frames Cisco as a growth-re-rated AI infrastructure company. The filings show total ARR growing only 2% year-over-year, subscription revenue falling from 54% to 49% of quarterly revenue, and Security segment revenue flat despite 27 months of Splunk ownership. The AI orders are hardware orders - they add to Networking segment revenue but do not add to ARR.
The margin divergence follows directly: the crowd anchors on management’s prior “highest gross margins in 20 years” message from FY2025 (68.7% non-GAAP blended), while the actual Q3 FY2026 blended margin is 66.0% non-GAAP and the product gross margin is 64.3% non-GAAP - a 270 basis-point compression that management has not quantified a recovery path for.
The Cisco vs. Arista rotation narrative (Cisco up 32% in a month around the Q3 print, Arista down 10%) is capturing a stock price trade, not a verified share-shift in AI cluster design-wins. Arista continues to hold higher cloud switching market share and grows revenue roughly 2.5x faster than Cisco.
The CEO insider selling is a factual disclosure, not a signal - all sales are under 10b5-1 plans adopted months in advance, and the transactions reflect standard executive equity compensation management. The dissonance between “networking supercycle” messaging and pre-scheduled share sales at multiple price levels is worth noting as a transparency observation, not as a bearish inference.
Macro context
Enterprise IT spending cycle
Gartner revised its worldwide IT spending forecast to $6.31 trillion for 2026, up 13.5% from 2025 (C-0398, analyst tier). The revision was the third consecutive upward adjustment; data-center spending growing approximately 55.8% in 2026 is the primary driver. For Cisco’s campus and routing businesses, the enterprise networking TAM was approximately $124.6 billion in 2025 (MarketsandMarkets, C-0405, analyst tier), growing at approximately 9% CAGR through 2030 on their forecast. That baseline is the background against which Cisco’s campus, routing, and wireless businesses grow.
The post-COVID inventory hangover is resolved. The cohort of network hardware deployed during 2020-2022 is now hitting the 5-7 year replacement window. Wi-Fi 7 - the newest wireless standard, delivering approximately four to eight times the throughput of Wi-Fi 6 - provides an incremental technology-upgrade trigger that did not exist in the prior refresh cycle. Deploying Wi-Fi 7 access points pulls Catalyst switch upgrades into enterprise wiring closets, because the higher per-port bandwidth that Wi-Fi 7 radios generate moves the bottleneck from the radio into the switching infrastructure behind it; the access point upgrade alone is insufficient without the switch. This campus refresh wave is a non-AI, non-Splunk tailwind for Networking segment growth in FY2026-FY2028 that is separate from the hyperscaler AI order ramp.
Enterprise IT budget sentiment in H1 2026 has been cautious. Tariff uncertainty prompted a subset of corporate IT buyers to delay discretionary hardware decisions while trade policy was unstable. Cisco management’s Q3 FY2026 commentary did not signal systemic enterprise weakness; the record quarterly revenue was broadly based. But the discretionary budget pause is a drag on the campus and routing portions of Networking.
AI capex: the hyperscaler tailwind
The four US hyperscalers (Microsoft, Amazon/AWS, Google/Alphabet, Meta) are collectively guiding to approximately $700-725 billion in total capital expenditure for calendar 2026 (C-0399, press tier), up roughly 77% from approximately $410 billion in 2025. The majority of this spend is AI infrastructure. If approximately 25-30% of hyperscaler capex goes to networking (a rough rule of thumb from prior datacenter build cycles), the AI networking addressable pool is approximately $175-210 billion globally across all vendors in 2026. A $9 billion Cisco order target against that pool represents approximately 4-5% capture - plausible given Cisco’s incumbent system-integration advantages.
The critical forward risk: hyperscaler AI capex growth is forecast to decelerate from approximately +51% in 2026 to approximately +13% in 2027 and approximately +5% in 2028 (Futuriom, C-0400, estimate). This is primarily base-effect deceleration - 50% annual growth rates cannot compound forever against an ever-larger base. A second layer of risk is AI-ROI rationalization: OpenAI reportedly spent approximately $60 billion per year on compute against approximately $13 billion in revenue in 2025 (press-tier estimate; labeled as such, and figures move - verify independently), illustrating the gap between AI infrastructure investment and AI software monetization. If enterprise customers cannot demonstrate returns on AI deployments fast enough to justify the infrastructure spend, hyperscalers may reduce new networking orders in 2027-2028 while the existing buildout proves its economics - a digestion cycle that could be deeper and longer than simple base-effect deceleration implies. [See the AI infrastructure capex cycle discussion in the AMAT deep-dive for the parallel WFE digestion risk - the mechanism is similar even though the specific product categories differ.]
Interest rates
The Federal Reserve held the federal funds rate at 3.50-3.75% at its June 17, 2026 meeting (C-0401, primary). The 10-year Treasury yield was approximately 4.40% as of late June 2026 (C-0402, FRED, primary). Goldman Sachs projects the next rate cuts arrive in June and December 2027; rates stay in the 3.50-4.00% range for most of the remainder of 2026 and 2027. No credible near-term rate-cut catalyst exists to mechanically re-rate income stocks.
The rate sensitivity hits Cisco through two channels. The multiple channel: Cisco’s approximately 25x forward P/E is above the income-stock range of 14-18x that prevailed when 10-year yields were 2-3%. At 4.4%, the income-stock floor bid is weaker (a 1.41% dividend yield is not competitive with Treasuries on income grounds alone), and the AI narrative is doing much of the multiple work. If the AI thesis disappoints, the stock does not fall back to an income-stock floor at 18-20x with a 3% yield (that would imply approximately $56 per share); it reprices as a growth disappointment from the AI-premium entry point. The debt service channel: approximately $1.6-1.7 billion per year in interest expense on the Splunk acquisition debt is a permanent drag; any refinancing of the $11.9 billion in short-term debt at 4.5-5.0% locks in higher rates for the affected tranches.
Tariffs and supply chain
Section 301 tariffs on Chinese-origin electronics run at 25%, combined with a 10% Section 122 tariff, for a 35% combined effective rate on routers and switches manufactured in China (C-0403, tariffstool.com, press tier). Chinese-origin semiconductors face approximately 60% combined rates. CFO Scott Herren disclosed at the Q2 FY2026 earnings call that China-based manufacturing has been reduced by approximately 80% relative to the pre-tariff baseline (C-0020, primary), rebalancing primarily to Mexico, Malaysia, and India. India manufacturing formally began in 2023 and is growing.
The residual China exposure is concentrated in certain optical components and printed circuit board subassemblies that have not been fully rerouted. The gross-margin consequence: management attributed the approximately 330 basis-point year-over-year compression in Q3 FY2026 product gross margin (64.3% vs. 67.6% a year prior) primarily to product mix (AI hardware growing faster than software), with memory costs as a secondary factor and tariffs as a third contributor. Management has not disaggregated the tariff-specific gross-margin impact in basis points; all FY2026 guidance is stated to include estimated tariff impacts based on current trade policy.
Cisco has also signaled networking hardware list price increases of approximately 5-10% to partially pass tariff costs to customers - a significant action given how rarely Cisco raises hardware list prices.
Micro-economics: hardware margins, software mix, and capital allocation
Gross margin structure
The gross margin architecture matters for understanding both the near-term P&L reality and the long-term compounding potential.
| Period | GAAP product GM | GAAP services GM | GAAP blended | Non-GAAP blended |
|---|---|---|---|---|
| FY2025 full year | 64.5% | 68.5% | 65.6% | 68.7% |
| Q1 FY2026 | 64.5% | 68.4% | 65.5% | 68.1% |
| Q2 FY2026 | 63.9% | 68.4% | 65.0% | 67.5% |
| Q3 FY2026 | 61.9% | 69.2% | 63.6% | 66.0% |
The mechanism is simple: Networking hardware - growing 25% year-over-year in Q3 - carries approximately 57-64% non-GAAP product gross margin depending on mix. Software subscriptions carry approximately 72-78%. Services carry approximately 68-72%. As Networking’s share of product revenue grew from approximately 50% (FY2025) to 55.6% (Q3 FY2026), the blended margin fell. Services gross margin is stable and rising (69.2% GAAP in Q3 FY2026 versus 68.5% in FY2025), which provides a floor.
The enterprise campus unit economic illustrates what a healthy mix looks like. A Catalyst 9300 switch sale anchors a multi-year DNA Center software subscription recognized ratably at approximately 72-78% gross margin, plus a Smart Net Total Care support contract at approximately 68-72%. Lifecycle unit economics blend to approximately 65-68% gross margin with more than half the revenue stream being recurring. This is the moat. The AI infrastructure hardware order does not carry this tail: a Silicon One system for a hyperscaler AI cluster ships without a bundled multi-year software subscription. The AI order is good revenue but lower-quality revenue than the campus unit economic.
Management’s assertion that Silicon One G300 scale economics and improving optics margins will drive product gross margin recovery is unquantified. There is no disclosed target gross margin or timeline for recovery. The quarterly data shows 270 basis points of compression in three quarters. Until the margin turns, the compression is the fact.
Operating leverage: the offset
Non-GAAP operating margin held essentially flat at 34.4% in FY2025 and 34.2% in Q3 FY2026 despite the gross margin compression. The offset is operating expense discipline: Cisco’s total operating expense base (R&D approximately $9.3 billion, Sales and Marketing approximately $11.0 billion, G&A approximately $3.0 billion, totaling approximately $23.3 billion in FY2025) is growing slowly as revenue grows faster. The roughly $6.1 billion in revenue growth from FY2025 to FY2026 guidance midpoint flows largely through to operating income because the cost base did not grow proportionally. This is real operating leverage.
The fragility: if FY2027 revenue growth decelerates from 11% toward low-single digits as the AI order bridge runs out, the same $23.3 billion cost base becomes a larger percentage of slower-growing revenue, and operating margin compresses from 34% toward 31-32% without any additional spending.
The restructuring announced alongside Q3 FY2026 results (up to $1 billion pretax, with approximately $450 million expected in Q4 FY2026 and the remainder in FY2027; per press reports citing Cisco communications at the time, the restructuring would affect approximately 4,000 positions) represents Cisco rebalancing resources from areas like Collaboration toward AI infrastructure and security. A separate reduction of approximately 6,000 employees was reported in 2025 ahead of this announcement (per press reports citing Cisco communications; readers should verify current figures directly with Cisco’s disclosures). The financial benefit: reduced headcount-related operating expenses that partially fund continued investment in Silicon One and Splunk integration without growing total opex.
R&D intensity and what it buys
Cisco spends approximately 16.4% of revenue on R&D ($9.3 billion in FY2025) - a significant absolute amount for a $57 billion revenue company. This R&D is spread across five segments. Arista, by contrast, spends roughly 13-15% of its smaller revenue base on a single product family (EOS plus CloudVision). Cisco’s distributed R&D creates the risk that no single product line gets enough investment to be the best-in-class offering in its category. Silicon One gets a growing R&D allocation; Collaboration likely gets a declining one. The prioritization of R&D within Cisco’s budget is a management quality question that will determine whether G300 is followed by a competitive G400 or G500 in subsequent years.
Capital allocation: dividend plus buyback math
Annual dividend at $1.68 per share times approximately 3.94 billion diluted shares equals approximately $6.6 billion per year. Against $13.3 billion in FY2025 FCF, the dividend consumes approximately 49.6% of FCF. Even in a scenario where FCF falls 40% (to approximately $8 billion), the dividend would be covered at approximately 1.2x. This is why management calls the dividend the “first priority.”
At the June 25 close of $118.97, $6.0 billion in buybacks (the FY2025 pace) would retire approximately 50 million shares - approximately 1.3% of the diluted share count. The buyback is maintained but not heroic at current prices; it adds modest EPS accretion. Net debt growing from $12.0 billion to $14.7 billion despite strong FCF means management has explicitly chosen not to use FCF for debt paydown. That is a capital allocation choice, not a financial constraint.
Durability synthesis
Cisco’s durable economics sit in three places, each with different growth trajectories.
The Services annuity ($15.1 billion at 68.5%+ GAAP gross margin, growing low single digits) is the most structurally durable cash flow in the portfolio. It compounds slowly but is tied to thirty years of installed base that will not be replaced overnight. Even in a significant hardware downturn, the Services line moves modestly.
The enterprise software subscription stack (ARR $31.2 billion, RPO $43.5 billion, growing at approximately 2-5%) is the second durable layer. Multi-year contracts, high renewal rates, and the switching costs embedded in Cisco’s IOS certification ecosystem and DNA Center automation make this base sticky.
The Splunk SIEM franchise - if the cross-sell thesis plays out - has the potential to become a third durable toll: enterprise security operations centers that have years of Splunk configurations embedded in their SOC workflows are extremely difficult to displace. The problem is that “if the cross-sell thesis plays out” is carrying all the analytical weight in that sentence. The current evidence is thin.
The AI infrastructure order ramp is the least durable of the four revenue drivers in isolation. Hyperscalers are sophisticated buyers without captive loyalty to Cisco. The orders are real and growing, but their durability depends on Silicon One G300 winning design-ins at the hardware level and on hyperscalers not having better alternatives when the next cluster generation is specified.
The structural bull case rests on Cisco compounding all three of the durable layers simultaneously while converting AI hardware wins into a fourth (AI networking installed-base annuity). The structural bear case is that the campus-and-services annuity grows at low single digits, Splunk stalls, and the AI hardware wins prove to be one-cycle. In between is the base case: Cisco is a moderate compounder that monetizes one AI cycle, grows ARR at 4-6% annually with visible (if modest) Splunk cross-sell, and sustains its dividend through the process.
The scenarios in detail
Bull case (FY2028-FY2031 horizon)
What must happen. Q4 FY2026 delivers $3.5 billion or more in AI infrastructure orders, and management provides a credible FY2027 AI order or revenue framework of $10 billion or more at the August 2026 earnings call. Silicon One G300 wins multi-generational hyperscaler design-ins - at least two major hyperscalers specify G300 for their next cluster buildout cycle. Splunk cross-sell accelerates: Security ARR grows 8-12% organically in FY2027-FY2028 as the network telemetry-to-SIEM integration gains traction with 3,000+ networking accounts. Non-GAAP blended gross margin recovers toward 67-68% by FY2028 as G300 scale reduces per-unit cost and optics margins expand. Campus and SP routing benefit from the 2026-2028 equipment refresh cycle and Wi-Fi 7 enterprise wireless upgrades.
Illustrative EPS trajectory (estimates). FY2026: approximately $4.28 non-GAAP EPS (guided midpoint, verified). FY2027: approximately $5.10-5.25 (estimate). FY2029: approximately $7.00-7.50 (estimate). FY2031: approximately $9.50-10.00 (estimate).
Illustrative valuation (estimate). At FY2031 EPS midpoint approximately $9.75 and an exit multiple of approximately 24.6x (still at a material discount to the pure-play AI networking peers of the era, but reflecting a proven multi-generational AI franchise and Splunk compound): implied price approximately $240. This represents approximately 15% annual price appreciation from $118.97 over five years plus the dividend.
Single most likely disconfirmation. A major hyperscaler publicly cutting its 2027 AI infrastructure ordering and validating the digestion thesis before Cisco can lock in multi-year G300 design-wins. Arista winning the next-generation AI cluster fabric at Meta and Microsoft (Arista’s anchor accounts) would directly signal this failure.
Base case (FY2028-FY2031 horizon)
What must happen. Q4 FY2026 delivers approximately $2.8-3.2 billion in AI orders (close to but not decisively clearing the $9 billion annual target). FY2027 AI order intake provides a $7-9 billion framework. Networking segment revenue grows 10-12% in FY2027 as the order conversion bridge sustains the first two quarters, then decelerates to low single digits in H2 FY2027 as new order intake slows from the 2026 pace. Splunk cross-sell shows modest but visible progress (300-500 new logos per quarter). Security ARR grows 4-7% organically. Non-GAAP blended gross margin stabilizes near 66-67% without a full recovery. The Services annuity and RPO backlog buffer the Networking deceleration.
Illustrative EPS trajectory (estimates). FY2026: approximately $4.28 non-GAAP EPS (guided). FY2027: approximately $4.60-4.85 (estimate). FY2029: approximately $5.75-6.10 (estimate). FY2031: approximately $7.75-8.25 (estimate).
Illustrative valuation (estimate). At FY2031 EPS midpoint approximately $8.00 and an exit multiple of approximately 21.3x (reflecting a moderate-growth diversified tech company that monetized one AI cycle without achieving pure-play growth status): implied price approximately $170. This implies approximately 7% annual price appreciation plus the dividend - a total return near 8-9% per year (estimate). This base case is consistent with the current sell-side consensus mean price target of approximately $127 for twelve months (approximately +7% above spot), suggesting the sell-side base case is also the financial model base case.
Single most likely disconfirmation. FY2027 H2 Networking revenue growth stalls to flat or negative rather than decelerating to low single digits, triggered by a sharper-than-forecast hyperscaler AI capex deceleration from +51% (2026) to lower than the Futuriom +13% (2027) estimate.
Bear case (anchored on the skeptic’s strongest arguments)
What must happen. Q4 FY2026 AI orders come in below $2.5 billion - a 30%+ miss of the quarter implied by the $9 billion full-year target. Management either does not provide a credible FY2027 AI framework or provides one below $7 billion. The FY2027 H2 networking air pocket is severe: new FY2027 order intake fails to replenish the converted FY2026 backlog as hyperscalers digest and Arista wins the next-generation AI fabric at the largest accounts. Security remains flat or declines as Palo Alto’s XSIAM displacement accelerates and Splunk on-premises churn exceeds SaaS additions. Gross margin stays compressed below 66% and non-GAAP operating margin compresses from 34% toward 31-32%.
The skeptic’s framework is honest about what this bear case does and does not require. It does not require a Cisco-specific failure or a recession. It requires the hyperscaler AI capex cycle to pause and digest for four quarters - which the macro forecast from Futuriom (deceleration from +51% in 2026 to +13% in 2027, C-0400, estimate) already projects as the central tendency. The stock at $118.97 is priced for the “networking supercycle” to continue without interruption. It is not priced for a normal capex digestion cycle.
Illustrative EPS trajectory (estimates). FY2026: approximately $4.28 non-GAAP EPS (guided). FY2027: approximately $4.10-4.30 (estimate) - the air pocket. FY2029: approximately $4.25-4.75 (estimate). FY2031: approximately $4.75-5.25 (estimate).
Illustrative valuation (estimate). At FY2031 EPS midpoint approximately $5.00 and an exit multiple of approximately 15.5x (reverting toward the 2015-2023 income-stock baseline of 14-18x, as the AI premium fully evaporates with no demonstrable return on the Splunk investment): implied price approximately $78. Near-term (6-12 months): multiple compression from approximately 25x to 19-21x on approximately $4.20 FY2027 EPS produces approximately $84-88 (estimate), convergent with the low sell-side target of $84.98 and the skeptic’s $84 floor ($4.20 x 20x = $84).
Single disconfirmation that would break the bear case. Named hyperscaler design-win announcements for G300 (not the generic “three hyperscalers for scale-across applications” cited in the Q3 call) with multi-year supply frameworks. This would require evidence not yet in the public domain. Until it appears, the bear case rests on more solid ground than the bull with respect to the specific AI design-win claim.
Companies and names to watch
Arista Networks (ANET) is the single most important competitive signal. If Arista reports data center switching growth above 30% in FY2027 while Cisco Networking decelerates sharply, Cisco is losing in AI networking. If Arista growth decelerates to 15-20% as Cisco wins AI infrastructure share, the bull case for CSCO strengthens. Arista’s customer concentration disclosure (Meta at approximately 26%, Microsoft at approximately 16% of FY2026 revenue) is the tell: if those percentages fall as customers diversify to Cisco, Cisco is winning primary design-ins, not just diversification supply.
Palo Alto Networks (PANW) is the Splunk competitive signal. PANW’s Next-Gen Security ARR metric (currently at $6.3 billion, growing 33%, with full-year target $8.90-8.95 billion) is the most direct comparable to Splunk’s performance. If PANW’s XSIAM platform hits $8 billion+ in ARR by mid-FY2027 while Cisco’s Security segment ARR stagnates, the Splunk cross-sell thesis is losing to platformization.
Broadcom (AVGO) matters on two sides. As a merchant silicon supplier (Tomahawk 6 powers white-box AI switching alternatives to Cisco’s Silicon One), Broadcom datacenter switching silicon revenue is a leading indicator of white-box penetration. Accelerating Broadcom datacenter silicon revenue growth signals that disaggregated SONiC architectures are gaining share over Cisco integrated systems. Separately, Broadcom also supplies silicon to some older Cisco switching platforms - not every Cisco switch runs Silicon One.
Nvidia (NVDA) provides an indirect AI networking read. Nvidia InfiniBand versus Ethernet attach rate in new AI cluster deployments tells you whether Cisco’s Ethernet-for-AI narrative is gaining ground. If NVLink and InfiniBand continue to dominate AI cluster back-end fabrics, Cisco’s AI infrastructure addressable market is structurally smaller than the FY2026 order book suggests. Nvidia’s Spectrum-X Ethernet platform also competes with Cisco’s Silicon One in the same Ethernet-for-AI segment.
HPE/Juniper (HPE) is the enterprise campus signal. HPE Networking segment revenue growth - and specifically any evidence of Juniper Mist AI winning enterprise wireless LAN accounts from Cisco Catalyst - would indicate that the campus refresh cycle is not entirely accruing to Cisco. HPE forward P/E approximately 12x (StockAnalysis, UNVERIFIED, single source, point-in-time) suggests the market assigns no AI networking premium to the combined entity.
Fortinet (FTNT) and CrowdStrike (CRWD) are security market-share proxies. If Fortinet firewall and SASE ASP trends indicate pricing pressure in the security appliance market, Cisco Hypershield faces a similar environment. CrowdStrike Falcon growth rates signal whether XDR is consolidating around pure-plays or whether integrated-platform security (Cisco’s argument) is winning enterprise decisions.
Risk controls
AI order concentration and Q4 binary. The most immediate and highest-magnitude risk is the Q4 FY2026 AI order print in August 2026. A miss below $2.5 billion against the approximately $3.7 billion needed to close the $9 billion target would trigger multiple compression from approximately 25x toward 19-21x on FY2026 non-GAAP EPS, implying approximately $85-90. There is no stop-loss that prevents this - it is a binary event with a 4-week horizon from the research date. The risk management response for a concentrated CSCO position is to be aware that August 2026 is the scenario-flip date.
Hyperscaler capex deceleration and the FY2027 air pocket. Even if Q4 FY2026 AI orders hit the target, the more important structural risk is whether FY2027 order intake sustains the FY2026 pace as hyperscaler AI capex growth decelerates from +51% to +13%. The $5 billion in unconverted FY2026 orders provides a revenue bridge through H1 FY2027 but does not insulate H2 FY2027. Watch: quarterly hyperscaler capex guidance revisions from AWS, Azure, Google, and Meta. Any hyperscaler reducing 2027 capex guidance by 15% or more is a 4-6 month leading indicator of Cisco Networking deceleration.
Splunk integration stall. If Security segment ARR does not accelerate above 8% year-over-year organically within the next two to three quarters, the cross-sell thesis has not materialized on the timeline the $28 billion acquisition price demands. Watch: Security segment quarterly revenue growth and any management commentary on Splunk-specific ARR growth on earnings calls.
Gross margin trap. If non-GAAP product gross margin falls below 63% or blended gross margin falls below 65.5% in Q4 FY2026 or FY2027, the AI hardware mix problem is worse than management’s forward assertions imply, and the AI re-rating multiple becomes harder to defend. Watch: the non-GAAP product gross margin trend quarter-over-quarter.
Collaboration secular decline. Revenue likely continues declining at low-to-mid single-digit rates annually. A large write-down of Webex goodwill would be a negative headline and balance-sheet event. Not an immediate risk but a persistent drag.
Rate environment. A sustained 10-year Treasury yield above 5% would compress the AI-premium multiple and push the income-stock bid toward historical levels (14-18x), amplifying any fundamental disappointment. The 299 basis-point spread between the 10-year (approximately 4.4%) and the dividend yield (approximately 1.41%) already limits the income-investor floor bid.
Dividend sustainability check. The dividend is covered by FCF at approximately 1.8-2.0x, and management has described it as the “first priority.” In a scenario where FCF falls to approximately $8 billion (roughly a 40% decline from FY2025 levels), the dividend would still be covered at approximately 1.2x. A simultaneous FCF decline and a debt-refinancing event at higher rates could narrow that margin, but a dividend cut is not a near-term or base-case risk.
TSMC 3nm concentration. The G300 general availability in H2 FY2026 depends on TSMC 3nm supply secured through calendar 2026 per management. The risk re-opens for calendar 2027 - any geopolitical disruption to Taiwan, TSMC production incident, or allocation squeeze (Apple, Nvidia, AMD, and Cisco all competing for limited 3nm capacity) could delay G300 volume delivery and impair FY2027 AI revenue.
Methodology, sourcing, and data-quality flags
Source tiers. Primary: Cisco 10-K FY2025 (accession 0000858877-25-000111, filed ~September 2025), 10-Q Q3 FY2026 (accession 0000858877-26-000078, filed ~June 2026), and 8-K earnings press releases for Q4 FY2025, Q1-Q3 FY2026 from investor.cisco.com. Analyst: Gartner IT spending forecast (C-0398), MarketsandMarkets enterprise networking TAM (C-0405), IDC Ethernet switch market share (C-0014), Futuriom hyperscaler AI capex deceleration forecast (C-0400). Press: Cisco Investor Relations product announcements, trade press (The Register, Network World, CRN, SDxCentral, SemiAnalysis), CNBC, Bloomberg, Yahoo Finance. Estimate: AI infrastructure scenario EPS and scenario prices derived from stated driver assumptions (all labeled as such throughout); Splunk post-close ARR analyst estimates (UNVERIFIED, excluded as fact per compliance requirement); forward P/E consensus EPS from StockAnalysis, GuruFocus, Yahoo Finance. All claims recorded in companies/CSCO/claims.jsonl.
Key data-quality flags. Forward P/E for CSCO is DISPUTED across sources (range 25.1-25.4x; StockAnalysis 25.36x, Yahoo Finance 25.06x, GuruFocus 25.12x as of June 25-26, 2026) due to different EPS consensus sources and timing. ANET forward P/E is DISPUTED (range 43.85-44.72x). PANW, FTNT, and HPE forward P/Es are UNVERIFIED (single-source StockAnalysis). Return figures are DISPUTED across sources due to price-only vs. total-return methodology and cutoff-date differences; stated as ranges. EV derived from primary balance-sheet data (market cap $468.9 billion plus net debt $14.7 billion), not from any aggregator. Dividend growth streak corrected to 15 consecutive years per the Q3 FY2026 8-K. Payout ratio stated on GAAP EPS basis (approximately 55%); non-GAAP basis (approximately 44%). Post-close Splunk standalone ARR not disclosed by Cisco; the only confirmed figure is approximately $4 billion at acquisition close in March 2024. Zscaler market cap excluded from peer table per compliance requirement (single-source figure inconsistent with derived check). Job-cut headcounts (approximately 4,000 in May 2026, approximately 6,000 in 2025) are attributed to press reports citing Cisco communications at the time; the restructuring charge ($1 billion pretax, C-0391, primary, verified) is the confirmed financial figure. CFO is Scott Herren; a reference to “Mark Patterson” in a research file was flagged as a probable error and excluded from this article.
The five-factor read. The verified evidence across five dimensions informs the Buy rating as follows.
Valuation: At approximately 25x forward non-GAAP P/E, Cisco sits above its own five-year average of approximately 22.35x - the AI re-rating has already compressed the prior discount. Against peers, it is the lowest multiple in the pure-tech set and carries the sector’s only meaningful dividend. The sell-side consensus mean target of approximately $127 sits above the June 25 close - a configuration that is unusual after a big run and suggests the crowd has not gotten ahead of the stock. The PEG of approximately 2.82 and FCF yield of approximately 2.5% against Treasuries at 4.4% are not screaming bargain signals. The valuation picture reads as roughly fair - the AI premium is real but partially priced; the consensus support is genuine. This factor is neutral.
Growth: The revenue trajectory has genuinely re-accelerated. FY2024 was -6%, FY2025 +5%, FY2026 tracking +11%. Networking grew 25% year-over-year in Q3 FY2026. The AI infrastructure order book ($5.3 billion through Q3, $9 billion full-year target) is backed by disclosed hyperscaler purchase behavior. The offsetting weakness is also real: total ARR grew only 2%, subscription share fell from 54% to 49%, Security is flat, Collaboration is declining, and FY2027 order intake will face a decelerating hyperscaler capex environment. Growth is genuine but concentrated and subject to a digestion cycle. This factor is moderately positive.
Quality: Cisco generates approximately $13.3 billion in annual FCF at a 23.5% FCF margin and returned approximately 94% of it to shareholders in FY2025 while raising its dividend for the 15th consecutive year. The Services annuity and $43.5 billion RPO provide earnings visibility that most hardware-exposed companies cannot match. The quality negatives are material: non-GAAP blended gross margin compressed 270 basis points in three quarters with no quantified recovery target; net debt grew from $12.0 billion to $14.7 billion over the same period; GAAP operating margin of 21.4% versus non-GAAP 34.4% reflects real Splunk amortization; post-Splunk ROIC is diluted by approximately $18-20 billion in goodwill. The quality picture is solid but not exceptional for a company at this stage of a large acquisition integration. This factor is moderately positive.
Risk: The near-term risk is concentrated in the Q4 FY2026 AI order binary (August 2026) - a single event that could move the stock 20%+ in either direction. Medium-term risk is the 2027-2028 hyperscaler AI capex digestion cycle, which macro evidence already projects as a material deceleration from +51% to +13%. Competitive risk - Arista defending its primary hyperscaler design-wins while white-box SONiC plus Broadcom TH6 represents a disaggregated architectural alternative - is structural and ongoing. Splunk cross-sell stall risk is already partially realized (Security flat in Q3 FY2026). Tariff risk has been significantly mitigated (80% China manufacturing reduction). On the offsetting side: very low short interest (approximately 1.57%), manageable financial leverage (net debt-to-non-GAAP EBITDA well below 1x), Services annuity as an earnings floor, and a covered growing dividend. The risk set is elevated relative to Cisco’s historical income-stock profile but not extreme. This factor is mildly negative.
Momentum and sentiment: The price trajectory is exceptional - approximately +67-74% over twelve months, the best in CSCO’s history since the dot-com era, with a crossing of the dot-com-era all-time high in May 2026. The post-Q3 surge of approximately 15-17% in a single session was the largest single-day gain since 2011. The sell-side consensus is Buy (13 of 26 analysts at Strong Buy) with mean and median targets above spot. Short interest is negligible at approximately 1.57%. The stock has pulled back approximately 8.7% from its all-time high and the 14-day RSI is at a neutral 46-47. The first contrarian coverage emerged in late June 2026, suggesting the easy momentum phase is maturing. This factor is strongly positive.
The five factors together - neutral valuation, moderately positive growth, moderately positive quality, mildly negative risk, strongly positive momentum - support a Buy rating at $118.97. The weighting lands at Buy, not Strong Buy, because the AI order binary in August 2026 is a single-event risk that could swing the growth and risk factors materially in either direction, and the margin compression is a real fundamental concern rather than a noise item.
All prices, market capitalizations, and financial figures are point-in-time as of the research date (2026-06-25 / 2026-06-26) and move daily. All forward-looking statements, scenario EPS estimates, and price paths are illustrative estimates derived from stated driver assumptions and are labeled accordingly throughout; none is a price target or a guarantee of any outcome. This is OSINT-based market research, not investment advice. Not a recommendation to buy or sell CSCO or any other security. Do your own due diligence before making any investment decision.