
Research date: June 14, 2026 | OSINT research on whether the 2026 FIFA World Cup moves US-listed companies and US stock indices, using the full global World Cup record as the evidence base
Important disclaimer. This is OSINT-based research and educational analysis, not investment advice. I am not a financial advisor. Nothing here is a recommendation to buy or sell any security. This piece analyzes sports betting, gaming, and consumer/markets companies; it is not betting, gambling, or gaming advice and is not an encouragement to wager - gambling carries real financial risk. Market caps, prices, handle, and market-share figures are point-in-time (June 14, 2026), press-reported where noted, and move fast. Do your own due diligence and consult a licensed advisor.
Companion tool - jump to the interactive dashboard to sort and filter every company and explore the supply-chain map, leaderboard, and analysis.
TL;DR
The World Cup touches the US stock market through two completely separate doors, and the press jams them together constantly. Door one is sentiment: a result moves investor mood, and mood nudges the broad index for about a day. The best academic work puts that nudge at roughly minus 49 basis points after a World Cup elimination loss, one day, in the losing nation’s own market, with no matching bump after a win, and for the US specifically it was historically driven by foreign investors disengaging, not American fans. It is real, tiny, and effectively un-tradeable. Door two is revenue: actual dollars flow through FIFA, sponsors, broadcasters, sportsbooks, payment networks, and hotels into specific tickers. That is real money, but the cleanest US-listed slice is sub-$1 billion and lands as under 1 percent of annual revenue for almost every name, mostly inside one quarter. The whole tournament’s gross US economic footprint, around $17 to $30 billion, is roughly 0.04 percent of a US equity market worth about $74 trillion, a rounding error a single CPI print would erase. What genuinely changed for 2026: this is the first US World Cup with legal online betting at scale, from essentially zero states in 2018 to about 33 in 2026, and Fox is monetizing rights it locked in far below market, which makes its one-quarter ad windfall unusually high-margin. The single biggest risk is that everyone already knows all of this, so the obvious names are likely priced, and the obvious “sell the news” risk is asserted more than it is proven.
Explore it yourself: the interactive dashboard
Here is the whole roster in one place. Use the dashboard to sort and filter all 40 companies by tier, search by name or ticker, and read each one’s position with a one-line bull and bear, without leaving this page.
Open the dashboard in a full screen
Prefer a spreadsheet? Download the Excel scoring model with the full company table, a reader-adjustable scorer, and the betting-handle and cross-border math laid out in live formulas.
Does a football match move a $74 trillion market?
Walk into a sold-out stadium and you can feel the building shake. Eighty thousand people groan as one when the shot goes wide, and for a few seconds the mood of the place is the only thing that exists. Now picture the building itself. The concrete, the steel, the land, the leases, the value of the thing as an asset. The mood of the room and the price of the building are two different quantities. The mood swings every ninety minutes. The price of the building barely moves in a year. That gap, between what the crowd feels and what the asset is worth, is the entire subject of this article.
The US stock market is the building. As of mid-June 2026 the total value of all US-listed equities runs around $74 trillion (an estimate, recorded below). A World Cup is the crowd: loud, emotional, watched by billions, and over in about five weeks. The question every June of a tournament year is whether the noise in the stands shows up in the price of the building. Fans are certain it must. The tape is mostly indifferent. The honest answer, which this piece will build up from the evidence rather than assert, is that the crowd’s mood does leave a faint, brief mark on the index, and that real money does flow into a short list of companies, but that neither effect is large enough or durable enough for a US-index investor to do much with. The interesting part is exactly where, and why, the small real effects live.
A note on the calendar before we start. The 2026 tournament runs June 11 to July 19, co-hosted by the United States, Mexico, and Canada, with 48 teams playing 104 matches across 16 host cities, 11 of them in the US. The final is at MetLife Stadium in New Jersey. Every price, market cap, and forecast in this piece is stamped to June 14, 2026, and will drift. Treat the numbers as point-in-time and move fast.
Two channels, one tournament: sentiment versus revenue
Before any company or any chart, fix the two channels in your head, because keeping them apart is the whole discipline of this topic.
Channel A is sentiment to index. A team loses, fans feel it, some of those fans are also investors, and a slightly gloomier mood produces slightly more selling the next morning. This touches the entire market at once, the S&P 500 and the broad index, not any single stock. It is a behavioral effect, measured in basis points, and it lives almost entirely in the academic event-study literature. Most of that literature is about a participating nation’s own home index, which is why applying it to the US in 2026 takes care.
Channel B is revenue to tickers. Global spend on the World Cup, the broadcast deals, the sponsor checks, the bets placed, the hotel rooms booked, funnels through FIFA and the host economy into the income statements of specific US-listed companies. This is a follow-the-money supply chain. It does not move the index, because it is far too small, but it can color a quarter for a sportsbook or a broadcaster.
The trap is sliding from one to the other in a single sentence. “The index dipped after the US lost” is a Channel A claim about mood. “Visa earns a fee on every ticket a foreign fan buys” is a Channel B claim about dollars. They are unrelated mechanisms with unrelated magnitudes, and a lot of World Cup market commentary fails simply by confusing them. We will treat them in separate sections and never let them blur.
A crash course in the tools (the finance words you need)
To read the evidence honestly, you need six plain-English definitions. One analogy each, then we move on.
Basis point. One basis point is one hundredth of one percent, 0.01 percent. If a stock falls 49 basis points, it fell 0.49 percent, less than half a percent. Think of a basis point as a single cent on a hundred-dollar bill. The whole sentiment literature is measured in these cents, which is your first clue about how small the effect is.
Event study. This is the standard tool for asking “did a specific event move a price.” You take the day of the event, you estimate what the return should have been on a normal day given how the stock usually tracks the market, and you measure the gap. Picture weighing a truck before and after it drives over a scale: the difference is the cargo. The “cargo” here is the return attributable to the event and nothing else.
Abnormal return. That gap is the abnormal return: the actual return minus the return you would have expected anyway. If the market was up 1 percent and a stock you expected to track the market was up only 0.5 percent, its abnormal return that day was about minus 0.5 percent. Every World Cup loss-day figure in this piece is an abnormal return, not a raw price move.
Beta. Beta is how much a stock normally moves when the whole market moves. A beta of 1 means it moves in step with the index; a beta of 1.5 means it tends to swing half again as hard. You need beta to compute the “expected” return in an event study. It is the baseline the scale is zeroed against.
Investor sentiment, or behavioral finance. Classic finance says prices reflect cold expectations of future cash flows. Behavioral finance says human moods leak into prices, especially when lots of people share the same mood at the same time. A national team losing on a Tuesday night is a rare moment when millions of people in one country feel the same disappointment at once. That shared mood is the proposed mechanism for any World Cup index effect. It is not about the team’s finances. It is about the investor’s bad morning.
Statistical significance versus economic significance. This is the distinction that decides the whole question. A result is statistically significant if it is unlikely to be random noise. It is economically significant if it is big enough to matter to a real decision. A loss-day effect can be statistically real, showing up reliably across decades of data, and still be economically trivial, because half a percent for one day vanishes the moment a CPI report lands. Keep both ideas in hand. The World Cup sentiment effect is the textbook case of “statistically real, economically tiny.”
A crash course in the money (the sports-business words you need)
Channel B has its own vocabulary, and the betting terms in particular trip people up.
How FIFA makes money. FIFA sells four things. Media rights (broadcasters pay to show the matches), sponsorship (brands pay to be official partners), ticketing and hospitality (fans and corporates pay to attend), and licensing (merchandise royalties). For the full 2023 to 2026 cycle FIFA’s original budget split those as roughly $4.26 billion media, $2.69 billion marketing and sponsorship, $3.10 billion hospitality and ticketing, and $0.67 billion licensing, on an $11 billion total, later revised toward about $13 billion (estimates, FIFA primary for the original budget). The crucial point for an investor is that this money flows to FIFA, not to the host cities, and not directly to most of the companies people assume benefit.
Sponsorship tiers. FIFA sells three levels. Partners (the top tier, global, every FIFA event, names like Coca-Cola, Visa, Adidas), Sponsors (the next level, the specific tournament, names like Bank of America, McDonald’s, PepsiCo’s Frito-Lay, Verizon, AB InBev), and Supporters (regional, lower cost, names like DoorDash, Marriott Bonvoy, The Home Depot, Airbnb). FIFA discloses no per-deal price, so every deal value you will see is an estimate. The industry clusters Partner deals above roughly $95 million, Sponsor deals around $65 to $95 million, and Supporter deals at $5 to $30 million (estimates).
Host-economy impact, gross versus net. When a promoter says a tournament will “generate $30 billion,” that is a gross figure: every dollar that changes hands, counted once and optimistically. The net figure subtracts two things. Substitution is locals spending money on the World Cup that they would have spent in the same town anyway, so no new value is created. Crowding-out is the regular visitors who stay away because the city is congested and expensive during the event. Independent economists consistently find the net number is a fraction of the gross. We will name names in the host-economy section.
Ambush marketing. A brand that is not an official sponsor running World Cup-themed advertising to grab the attention without paying FIFA. It matters here because it explains why a non-sponsor like Constellation Brands can spend heavily around the event without owning any rights.
Handle, hold, and GGR. This is the betting chain, and it is where casual readers lose the thread. Handle is the total amount wagered, not revenue. If you bet $100, lose $60, and win back $40, you contributed $100 of handle. Hold, also called the win percentage, is the share of handle the sportsbook keeps after paying winners. US online books run roughly 7 to 11 percent. GGR, gross gaming revenue, is handle times hold, and that is the operator’s actual top line before promotions and taxes. A real anchor: New York’s mobile market in May 2026 ran $2.26 billion of handle into $229 million of GGR, a hold of about 10.1 percent (press). Handle is the headline; GGR is the money.
Take rate (and why cross-border pays more). A take rate is the slice a middleman keeps from each dollar that passes through it. Think of a highway toll: the road does not care where you are driving, it just charges a fixed cut for every car that rolls through the booth. For a payment network like Visa, the take rate is the fraction of each purchase it keeps when you swipe a card. The detail that matters for the World Cup is that a foreign card swiped in the US pays a higher take rate than a domestic one. Two charges stack on top of the normal fee. One is currency conversion, because the bank has to turn euros or pesos into dollars. The other is a cross-border assessment, an extra network fee of roughly 40 to 100 basis points of the transaction that applies specifically because the card was issued in another country (estimate, merchant-side). So when a million-plus foreign fans arrive and tap non-US cards, the same volume of spending earns the network more per dollar than usual. That is the entire mechanism behind the cleanest Visa toll-booth case below.
The sentiment channel: what the historical record actually shows
Now Channel A, the behavioral effect, with the real evidence. This is the credibility backbone, so it gets the most careful treatment.
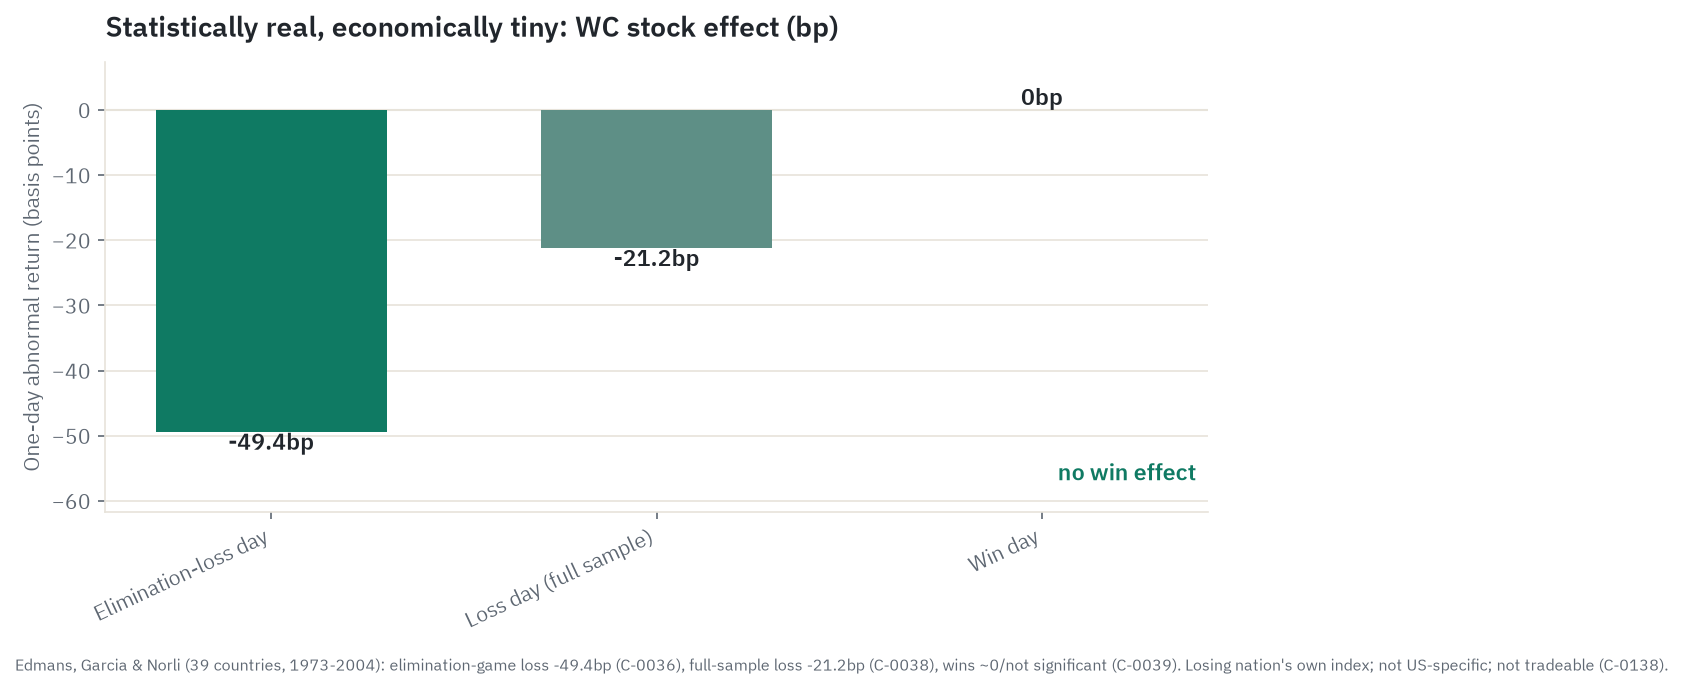
The foundational paper is Edmans, Garcia, and Norli, “Sports Sentiment and Stock Returns,” published in the Journal of Finance in 2007. They looked at 39 countries and 1,162 soccer mood-event matches from 1973 to 2004, across eight World Cups plus continental cups. The headline finding: after a loss, the losing nation’s own stock index returned about minus 21.2 basis points the next trading day across the full sample, and about minus 49.4 basis points after a World Cup elimination loss specifically (primary). That minus 49 is the number you will see quoted everywhere. Two features make it credible rather than a fluke. First, the effect was asymmetric: there was no matching gain after a win, the win coefficient was statistically indistinguishable from zero (primary). A pure mood story predicts exactly that, because losing stings more than winning soothes. Second, the effect was larger in small-cap stocks, which are held more by local retail investors whose mood is in play, and larger for more important games. The authors deliberately ruled out the boring economic explanation, that a loss costs the country real money, by controlling for the result the betting markets already expected. What was left was mood.
The most robust finding in the whole field is not about returns at all. Ehrmann and Jansen, in an ECB working paper using minute-by-minute data across 15 exchanges during the 2010 and 2014 tournaments, found that when a country’s team is playing, the number of trades in that country drops about 45 percent and trading volume drops about 55 percent (primary). A goal causes a further roughly 5 percent drop. Investors stop trading and watch the match. This is the distraction effect, and it replicates cleanly, because it is about attention, not valuation. It dents liquidity for ninety minutes; it does not move the level of the index.
Now the skeptics, because the bear case here is genuine. Klein, Zwergel, and Fock rebuilt an earlier study on the FTSE 100 and found that once you properly control for how surprising the result was, the soccer-result return effect is not replicable (primary). Gerlach found the same abnormal-return patterns in countries that were not even playing, which implies the apparent effect might be a common market factor masquerading as football (primary). That is the single most damaging finding, and it has to be stated plainly: the return effect may be partly spurious. Layer on McLean and Pontiff’s general result that published market anomalies lose about 35 percent of their strength after publication, as traders learn about them, and you have a phenomenon that is real as a correlation, contested as a cause, and fading where it was ever exploitable.
Out of sample, the split is clean. The distraction and volume effect keeps showing up. The return effect gets noisy game by game: the day after Canada lost 4-1 to Croatia in 2022 the Toronto index fell 0.8 percent, but the day after Canada lost 1-0 to Belgium it rose 0.3 percent (press). Single games tell you almost nothing. The effect survives only as an average over many matches, which is the opposite of something you can trade.
Can you trade it at all? Essentially no, for four reasons. The effect is measured on the first trading day after the result is known, so by the time you know a team lost, the price has already moved; it is a reaction, not a forecast. The magnitude is basis points for one day, swamped by any macro release. The asymmetry means there is no clean long-short, since only losses move prices. And the robustness doubts plus anomaly decay eat whatever was left. Real, tiny, fragile, and mostly already gone.
Does the sentiment effect reach the US market?
Everything above is mostly about soccer-mad nations reacting to their own teams. The US is the awkward case, and 2026 is the live test.
There is one rigorous study of the US aggregate: Kaplanski and Levy, in the Journal of Financial and Quantitative Analysis in 2010. They found the average S&P 500 return over the World Cup window was minus 2.58 percent, versus plus 1.21 percent for a comparable non-tournament window (primary for the headline figures; sample detail of 15 World Cups from 1950 to 2006 is press-sourced). That sounds large until you read the mechanism. The effect was result-independent, meaning it did not depend on who won, which rules out a mood story tied to a specific outcome. It was distraction-driven, and the authors attributed it to foreign investor sentiment, not American fans, which fits the historical fact that soccer was a minor sport in the US. In plain terms: the one US-aggregate World Cup effect in the literature was historically powered by overseas investors disengaging, not by US fans being sad. That is a fragile foundation for a US-index trade, and Kaplanski and Levy themselves noted the 2010 pattern looked different from prior cycles once their result was published.
Here is the genuinely open question for 2026, and it cuts toward the bull side, so credit it honestly. The historical US aggregate effect was foreign-driven precisely because US engagement was low. In 2026 that premise is inverted. US media rights are up sharply (more on the size dispute below), legal sports betting now exists in roughly 33 jurisdictions, and the home team is playing at home in front of a record domestic audience. US engagement is structurally higher than in any prior edition. So the distraction and volume effect, the most robust finding in the entire field, has never actually been tested on an engaged US market with the home team in the tournament. Whether US trading volume measurably dips on big match days in 2026 is a real, untested empirical question. It is the one datapoint that could be new this year.
Two cautions keep that from becoming a bullish leap. Higher engagement changes liquidity and specific tickers, not the level of the index. And the identification trap is brutal: in June 1994, during the last US-hosted World Cup, the S&P 500 fell 2.68 percent, and lazy commentary still attributes that to football. It was the 1994 Federal Reserve tightening and the bond-market crash (press). Any 2026 summer dip will face the same trap, and as the next section shows, the 2026 macro backdrop is busy enough to manufacture one.
The verdict for a US-index investor: there is nothing here you can act on at the index level. The sentiment effect is small, brief, mostly foreign in its US form, and about to be confounded by a noisy macro tape. The one thing worth watching is volume, not price.
One more thing belongs here, because every June someone resurrects it: the “lost productivity” story. The claim is that workers skip out or zone out to watch matches, output drops, and the lost output dents the economy and therefore the market. Two things to keep straight. There is a real, measured distraction effect, but it is about investors, not workers: Ehrmann and Jansen showed trading activity falls sharply while a team plays. That is people not placing trades for ninety minutes, which dents liquidity, not the level of the index. The worker-absenteeism version is mostly folklore. It surfaces in human-resources press releases and consultancy “X billion in lost productivity” headlines, almost never in serious economics, and the academic record actively rejects it as a market mechanism. The foundational sentiment paper, Edmans, Garcia, and Norli, went out of its way to rule out the “a loss costs the country real output” explanation by controlling for the result the betting markets already expected, and what survived was mood, not lost work (primary). The size check is brutal: their loss-day effect was far too large to be explained by any plausible amount of skipped work. For 2026 specifically, the absenteeism angle is even weaker, because most US group-stage matches kick off in the weekday afternoon or evening and a large share of the affected white-collar workforce can watch from a phone or a remote desk. So the honest resolution is that worker absenteeism is real as a human story and close to meaningless as a market story. It does not move the index, and it does not move the stocks. The distraction that the data actually finds lives in the order book, not the office.
The magnitude reality check: why the index cannot move on revenue
Before following the money into Channel B, settle the index question with arithmetic, because this is what keeps the whole piece honest.
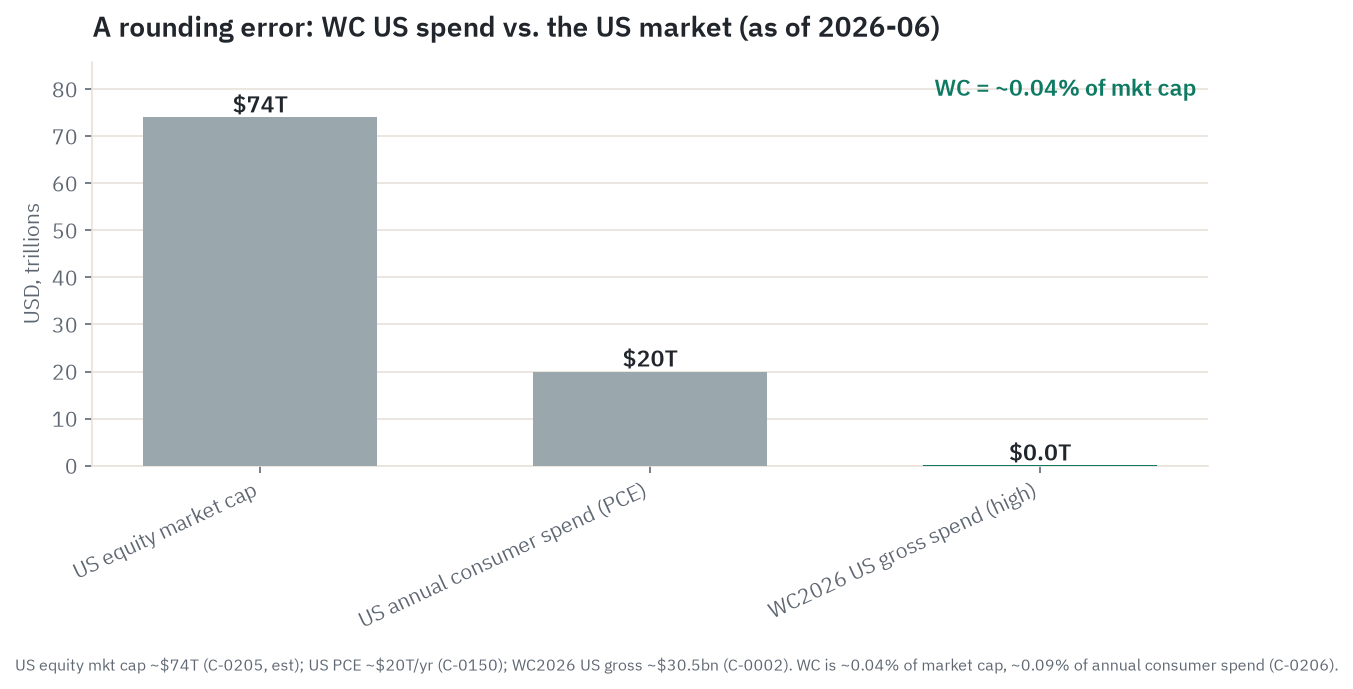
Three numbers. Total US equity market cap is about $74 trillion (estimate, mid-2026). Total annual US consumer spending runs around $20 trillion (approximate). The World Cup’s gross US economic footprint is somewhere between roughly $17.2 billion in GDP contribution and about $30.5 billion in total activity, and both are gross, ex-ante, promoter-commissioned figures (FIFA and OpenEconomics, via CFR).
A quick word on the big numbers, because you will see several and they look like they contradict each other. They differ by scope, not by error. The $17.2 billion is the US GDP contribution. The $30.5 billion is total US economic activity, a broader and larger gross tally of every dollar changing hands. The $47 billion you will meet later is global gross output for the 2025 Club World Cup and the 2026 World Cup combined, and the related $40.9 billion is global GDP for the 2026 tournament alone. So the figures climb as the scope widens from US-GDP, to total-US-activity, to global. That is why headlines quote anything from $17 billion to $47 billion for the “same” event. All of them are gross and pre-event, and the independent net figure, after subtracting the dollars that would have been spent anyway, is far smaller. One more wrinkle worth flagging now: the booster forecast (Tourism Economics, the $17.2 billion and 1.24 million-visitor source) and the most-quoted skeptic forecast (Oxford Economics, the “under 0.1 percent of GDP” line) come from the same house. Tourism Economics is a division of Oxford Economics. Same parent, opposite headlines.
Now divide. Even taking the most generous gross figure and pretending every dollar were brand-new value, $30.5 billion against a $74 trillion market is about 0.041 percent, four cents per hundred dollars of market cap (estimate). Against annual consumer spending, $17.2 billion is about 0.086 percent, under a tenth of one percent of what US consumers spend in a year. Put another way, US consumer spending grows by roughly $100 billion in a single month; the entire World Cup’s gross US GDP contribution is smaller than one ordinary month’s increase in consumer spending. It would be invisible inside the normal data noise.
And that already flatters the revenue channel, for two reasons. First, the net number is far below the gross. The independent literature, Oxford Economics and Statista back-calculations, puts the realized net effect under 0.1 percent of GDP, perhaps around 0.05 percent, once you subtract substitution and crowding-out. Smith College economist Andrew Zimbalist says the net effect “can go either way.” Holy Cross economist Victor Matheson called FIFA’s impact figures “insanity.” The ex-post record is the clincher: Baade and Matheson found that 1994 US host cities underperformed their forecasts by about $712 million each (primary). Promoter forecasts overstate by roughly an order of magnitude.
Second, and more fundamental, a dollar of one-time revenue is not a dollar of market cap. What moves an index is the change in the present value of all future profits across thousands of listed firms. The World Cup is one-off, so it earns a single-period valuation, not a perpetuity. It is low-margin and diffuse, much of it hotel rooms and restaurant meals spread across small private operators, not concentrated in listed mega-cap profit pools. And it is largely substitution at the index level. Marriott, the single largest pure beneficiary, guides the tournament to add only 30 to 35 basis points to its full-year RevPAR (primary). That is about a tenth of one year’s normal RevPAR growth, for the best-positioned name.
The ceiling on any index-level revenue effect is therefore well under one basis point of market cap, below the noise floor of a single trading minute. The revenue channel is real for specific companies. It is mathematically incapable of moving the S&P 500.
One more inoculation. The 2026 macro tape will dominate the summer. As of mid-June 2026 the Fed funds target sits at 3.50 to 3.75 percent on a hawkish pause, headline CPI is around 4.2 percent, unemployment is about 4.3 percent, and the Shiller CAPE valuation measure is near 40, its second-highest reading in 140 years (all press, point-in-time). There is an FOMC meeting inside the tournament window. In that regime a single CPI surprise or Fed decision routinely moves the S&P 500 by 50 to 200 basis points in a session, which is the same order as, or larger than, the biggest claimed World Cup sentiment effect over a multi-week window. The macro will overwrite the football in the tape. And the old “sell in May” summer-seasonality cliche is an identification trap, not protection: it overlaps the tournament window and tempts people to relabel an ordinary summer move as a World Cup effect. Net it out first, or the claim is spurious.
How the money flows
flowchart TD
    DEMAND["WC2026 demand: ~$8.9bn FIFA revenue + ~$17.2bn host activity (gross)"]

    DEMAND --> POOL1["Pool 1: FIFA commercial ~$8.9bn (cycle ~$13bn)"]
    DEMAND --> POOL2["Pool 2: Host-economy spend ~$17.2bn gross = taxpayer COST"]
    DEMAND --> OFF["Off-FIFA flows: betting handle + card spend"]

    POOL1 --> MEDIA["Media rights ~$3.8bn"]
    POOL1 --> SPON["Sponsorship ~$2.4bn"]
    POOL1 --> TIX["Ticketing + hospitality ~$3bn"]
    POOL1 --> LIC["Licensing / merch"]

    MEDIA --> FOXA["FOXA: Fox, below-mkt rights = windfall"]
    MEDIA --> CMCSA["CMCSA: Telemundo/Peacock"]
    FOXA --> ADWAVE["US ad take ~$850m est, ~$635m incremental"]
    CMCSA --> ADWAVE
    ADWAVE --> ADTECH["Ad-tech/CTV: MGNI, TTD, ROKU (diluted)"]
    ADWAVE --> SOCIAL["META, GOOGL: spillover"]

    SPON --> BRAND["Brand-spend tier: KO V PEP BUD MCD BAC VZ"]
    SPON --> NKE["NKE apparel: brand halo, not segment"]

    TIX --> TKO["TKO / On Location: sole hospitality (CAPTURED)"]
    TIX --> NOTLYV["FIFA-run ticketing (NOT LYV)"]
    LIC --> FAN["Fanatics PRIVATE + Adidas foreign"]

    OFF --> BET["Sportsbooks DKNG FLUT: GGR ~$250-310m (CAPTURED)"]
    OFF --> PAY["Visa cross-border (CAPTURED); MA halo-free"]

    POOL2 --> COST["Host-city cost $100-200m each; FEMA $625m + DOT $100m"]
    POOL2 --> TRAVEL["Host locals: MAR + REITs DRH SHO HST, ABNB"]
    POOL2 --> AIR["Airlines DAL UAL AAL (weakest); UBER LYFT"]
    COST --> AXON["AXON counter-drone, telecom capex halo (cost/fringe)"]

    BET --> POOL3["Pool 3: US-listed INCREMENTAL revenue (sub-$1bn, <1% of each co.)"]
    PAY --> POOL3
    TKO --> POOL3
    ADWAVE --> POOL3
    TRAVEL --> POOL3
    BRAND -.->|brand spend, not revenue| POOL3
    AXON -.->|cost, not revenue| POOL3

    POOL3 --> RISK["Concentration risk: priced-in / sell-the-news, one-month, Q2-Q3 2026"]
The single most useful idea in this whole topic is that there are three separate money pools, each about an order of magnitude smaller than the last, and the headlines mix them constantly.
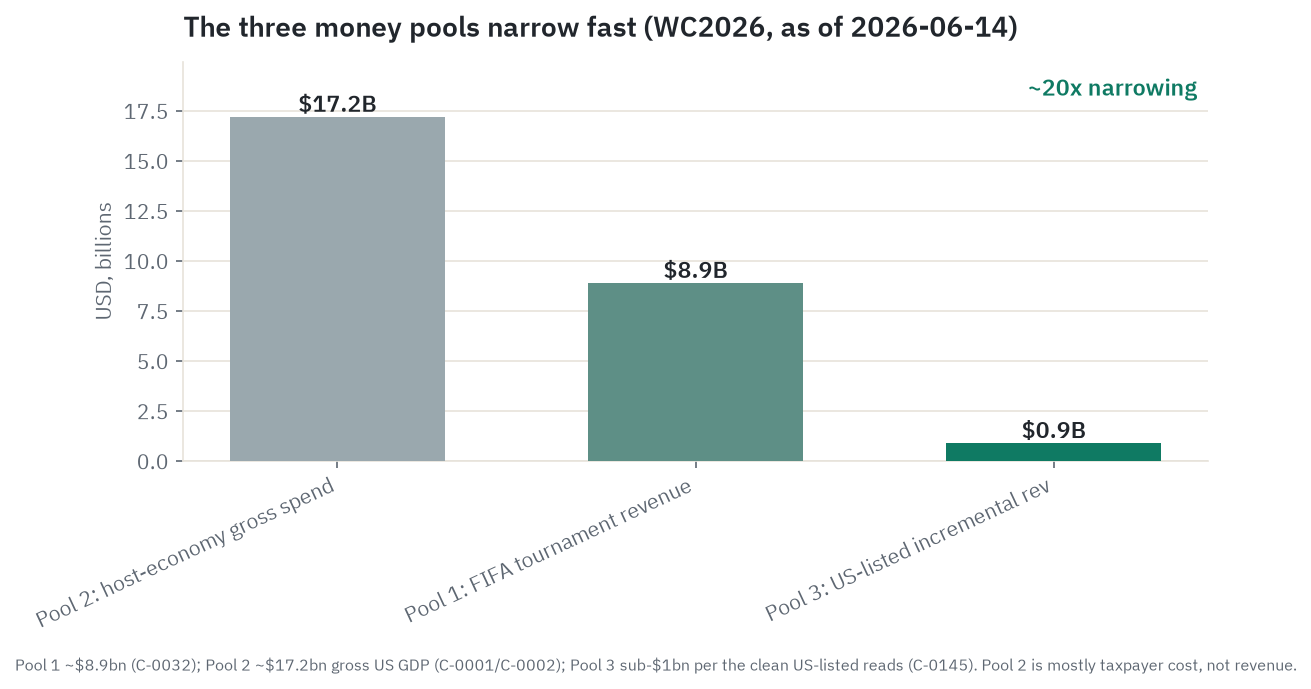
Pool 1 is FIFA’s commercial revenue, the money FIFA collects: about $8.9 billion from the 2026 tournament out of a roughly $13 billion 2023 to 2026 cycle. Host cities get no share of it.
Pool 2 is host-economy spend, what cities, states, and taxpayers lay out plus the claimed tourism activity: about $17.2 billion in gross US GDP terms, roughly $30.5 billion in total activity. Mostly this is a cost. Each US host city spends on the order of $100 to $200 million on security, transit, and services, with a federal backstop of about $625 million in FEMA grants and $100 million in DOT transit support. FIFA keeps the revenue; cities bear the bill.
Pool 3 is US-listed incremental revenue, what listed firms actually book on the income statement because of the World Cup. The big, clean ones are sub-$1 billion: the Fox-plus-Telemundo ad uplift of perhaps $635 million one-time (estimate, disputed), industry betting GGR of roughly $250 to $310 million (estimate), and per-company exposure running from about 0.05 percent to 4 percent of a single year. This is the equity-relevant pool, and it is a fraction of a fraction.
The investing trap is reading “$47 billion economic impact” (FIFA’s gross, ex-ante number) and assuming it lands on stocks. It does not. Pool 2 is mostly a cost, and Pool 3 is what equities capture.
Walk the diagram top to bottom and the shape is the lesson. The demand splits into FIFA’s pool and the host pool. FIFA’s pool divides into media rights, sponsorship, ticketing and hospitality, and licensing. Media rights route to Fox and Comcast, who sell ads, which cascade to ad-tech and social platforms in steadily diluted form. Sponsorship routes to the brand-spend tier, where the money is a marketing cost, not captured revenue. Ticketing and hospitality route mostly to FIFA itself, which runs ticketing in-house, with the one clean listed exposure being On Location, the hospitality operator owned by TKO. Riding alongside, outside FIFA’s books entirely, are the betting handle that lands with the sportsbooks and the cross-border card spend that lands with Visa. The structural feature worth tattooing on your wrist: the toll-booths (payments, hospitality, betting) take a cut of volume regardless of who wins, while the direct sellers pay up front and hope.
A field guide to the revenue channels
Here is the plain-language tour of every beneficiary channel, with who leads it and a size where one exists. The channels are the meat of Channel B.
Broadcast and streaming. Fox holds the English-language rights (Fox, FS1, and the FOX One streaming app); Comcast’s NBCUniversal holds Spanish-language via Telemundo and Universo, with all 104 matches streaming on Peacock and the Telemundo app. The headline economics: Fox’s rights are locked at roughly $450 to $500 million through a no-bid extension FIFA granted in 2015, widely viewed as well below the $1 to $1.5 billion the rights would fetch at open tender (press, unverified). That below-market cost is what makes the tournament unusually high-margin for Fox. Telemundo reports its 2026 ad inventory roughly 90 percent sold, about double its 2022 spend, across some 60 brands. There is a free, ad-supported leg too: Fox owns Tubi, its free ad-supported streaming service (a FAST platform, free ad-supported streaming television), which it used to extend Super Bowl LIX to a record audience, and which gives it a second inventory surface to monetize World Cup attention beyond the traditional broadcast feed.
Advertising and ad-tech. The combined Fox-plus-Telemundo ad take is forecast around $850 million by a single analyst (Sportico, disputed), versus about $213.6 million in 2022, which implies a one-time incremental uplift of roughly $635 million split between the two (estimate). Globally, WARC put the World Cup’s 2026 ad-market impact at about $10.5 billion, or 1.1 percent incremental, and noted the US-specific lift is “modest and inconsistent,” typically 0.4 to 1 percent of total US ad spend, and shrinking versus prior cycles. US connected-TV ad spend is forecast above $37 billion in 2026, up 14 percent, with the World Cup one input among many. The structural new wrinkles: 104 matches versus 64 is about 63 percent more ad slots, plus first-ever in-game ads during hydration breaks (estimate on the extra seconds). Streaming CPMs for marquee matches, the cost an advertiser pays per thousand ad impressions, are quoted at $60 to $120 by ad buyers (buyer-side estimate). The ad-tech names (Magnite, The Trade Desk, Roku) catch a diluted slice; Magnite is the only one with a named, contracted FIFA deal, as global programmatic provider for FIFA+, FIFA’s own streaming service, though the terms are undisclosed. The social platforms (Meta and Alphabet, which owns YouTube) sit one rung further out: they catch ambient World Cup ad-budget spillover, the highlight clips and second-screen chatter and the brand campaigns that ride alongside the tournament, but they hold no World Cup rights and run no World Cup-specific deal. Any lift is invisible against their base, which is why they sit in the money-flow map as a faint spillover node and not as a profiled beneficiary.
Beverages. Coca-Cola is a top-tier Partner; PepsiCo (via Frito-Lay) and AB InBev (Budweiser) are Sponsors. The important correction: in the US, Modelo and Corona belong to Constellation Brands, not AB InBev, which holds those brands only outside the US. Constellation is not a FIFA sponsor at all; it is running record media around the event without rights. The evidence on beverages is consistent and unflattering to the bull case. Wealth manager Quintet found that beverage demand effects around the World Cup are “temporary” and that “sales normalise quickly,” a short-term consumption spike, not structural demand.
Betting and sportsbooks. This is the highest-torque channel, so it gets its own math below. DraftKings and FanDuel (owned by Flutter) together contest roughly 70 percent of the US World Cup handle, with BetMGM (an MGM and Entain joint venture), Caesars, ESPN Bet (Penn), Fanatics, and Hard Rock splitting the rest. The structural fact that makes 2026 different: legal US online betting barely existed at the last two tournaments and exists at scale now.
Payments and ticketing. Visa is FIFA’s official payment partner and was the exclusive payment provider for the first ticket-sales window; it earns a higher take rate on inbound cross-border transactions from foreign visitors. Mastercard holds no World Cup sponsorship but benefits from the same cross-border volume, halo-free. On ticketing, the common error is naming Live Nation or Ticketmaster: FIFA self-operates official ticketing and resale, so the listed ticketing read-through is negligible. The real listed hospitality play is On Location, owned by TKO.
Travel, hotels, and airlines. Marriott (the official hotel supporter) plus the host-city-concentrated hotel REITs (DiamondRock, Sunstone, Host Hotels, Park, Ryman) capture room demand; Airbnb absorbs the spillover hotels cannot; airlines (Delta, United, American) and rideshare (Uber) catch travel demand. The catch, covered below, is that 2026 demand is running below forecast and the airline read is the weakest in the whole map.
Apparel and licensing. Nike outfits about 12 teams including the US; Adidas outfits more and supplies the match ball, but Adidas is foreign-listed. The replica-kit and merchandise upside flows largely to private Fanatics and to Adidas. There is no clean US-listed apparel pure-play on the World Cup.
QSR and food delivery. McDonald’s is a Sponsor; DoorDash is the new official on-demand delivery and reservations partner for 2026. Food delivery is the one channel with genuinely measurable incremental volume, in the form of event-day order spikes around matches, though the lift is transient and does not show up in full-year results.
Telecom and connectivity. Verizon is the official telecom infrastructure provider, with private 5G and fiber built into host stadiums (it installed 2,400 antennas and 6 million feet of fiber at MetLife). AT&T and T-Mobile upgraded host-city networks. This is mostly capex already inside normal budgets plus a marketing halo, not a revenue event.
Security and infrastructure. A federal program above $1.1 billion (about $625 million in FEMA grants plus $500 million in counter-drone funding) underwrites host-city security. Axon picks up city-by-city counter-drone contracts (Dallas added $10.3 million to its Axon contract, Cobb County about $9.7 million), but its World Cup bookings are not broken out in filings. On construction, the defining structural fact of 2026 is that there is no new-stadium build: all 11 US venues are existing NFL stadiums, retrofit only. That removes the white-elephant capex that sank past hosts and also removes any large US-listed construction beneficiary. AECOM is the nearest name, on retrofit scope only.
Who wins where: the tier map
Group the names not by sector but by behavior, because behavior is what determines who keeps the incremental dollar.
Toll-booths take a per-transaction cut regardless of the result, at high incremental margin, with real pricing power. Visa on cross-border payments, On Location (TKO) on hospitality, and the sportsbooks (DraftKings, Flutter) on betting hold all get paid whether the US team wins the trophy or goes home in the group stage. This is the best risk-adjusted exposure in the map. The dollar lands on the rail.
Direct sellers need actual incremental unit volume, and mostly they just reallocate a marketing budget. Coca-Cola, PepsiCo, AB InBev, McDonald’s, Nike. Sponsorship is a sub-1 percent line item, around 0.2 percent of revenue for the biggest names, and the academic and analyst evidence shows no durable volume lift. Do not own these for the World Cup.
Attention harvesters monetize eyeballs and ad inventory: Fox and Comcast on broadcast, the ad-tech layer behind them, and the sportsbooks again on the betting side. Real incremental cash, but one-time, capped at the size of a fixed one-month pie, and shared.
Host-economy locals are asset-located and capacity-constrained: the hotel REITs, Marriott, Airbnb, the airlines, rideshare. Genuine local pricing power on match days, heavily diluted at the company level, and exposed to displacement (the regular guests who stay away) and, in 2026, to a real booking shortfall.
The priced-in and immaterial fringe is where the World Cup is a rounding error: the payment networks at the consolidated level, the sponsor mega-caps, the telecom carriers, and the construction names. Included here precisely to puncture the assumption that being “a World Cup stock” means anything for the equity.
The single sharpest distinction: toll-booths get paid a cut of volume that flows whether the US wins or loses, while direct sellers pay up front and hope the dollar comes back as volume the data has never reliably shown. That asymmetry, not the absolute size of any number, is the durable analytical content of Channel B.
The conversion math, three cleanest read-throughs
Here is the dollar traveling from the headline down to what the company keeps. Every input traces to a claim; the multiplied results are flagged as estimates.
Sportsbook: handle to GGR (DraftKings, Flutter). Eilers and Krejcik Gaming project about $2.82 billion of US legal World Cup handle, in a range of $2.32 to $4.33 billion, roughly triple the 2022 tournament, with the range tied asymmetrically to how deep the US team runs (analyst). Split by operator, DraftKings is forecast around $1.02 billion of handle and FanDuel around $945 million. Apply an assumed hold of about 10 percent and you get roughly $282 million of industry GGR, about $100 million for DraftKings and about $95 million for FanDuel (estimates). Sized against the companies, that is about 1.5 to 2 percent of DraftKings’s annual revenue and about 1.3 percent of Flutter’s US revenue. A meaningful Q2 and Q3 catalyst and a customer-acquisition event, not a full-year needle-mover. Read the soft spots in the bear case below; this number can plausibly halve.
Payments: inbound spend to cross-border fee (Visa). Foreign visitors paying with non-US cards generate cross-border transactions, which carry a higher take rate than domestic, on the order of 40 to 100 basis points of spend (estimate, merchant-side). At Qatar 2022, about 70 percent of Visa card spend by value came from international cards by the end of the group stage. Apply that band to the inbound-spend range, roughly $5.4 billion (Allianz) to $17.2 billion (Tourism Economics), and the gross cross-border assessment runs from about $22 million to about $172 million, of which the network keeps only a slice (estimate). Against Visa’s roughly $40 billion annual net revenue and $11.2 billion fiscal Q2 2026 net revenue, even the high end is a fraction of one quarter. Wolfe Research raised its Visa price target from $385 to $395 citing the cross-border catalyst (analyst). A quarter-coloring tailwind, not a re-rate.
Hotels: RevPAR uplift to REIT (DiamondRock, Host, Park, and Marriott). RevPAR, revenue per available room, is average daily rate times occupancy, and the World Cup lifts both in host cities on match days. The lift concentrates in 11 US cities, which is why asset-located REITs read cleaner than asset-light national brands. Deutsche Bank estimates a roughly 50 to 75 basis-point city-level RevPAR lift for the most concentrated REITs, against Marriott’s company-guided 30 to 35 basis points of blended global RevPAR (analyst and primary). DiamondRock has the highest host-city exposure at about 34 percent. Aggregate extra host-city hotel room revenue is put around $900 million (analyst). Real pricing power, diluted at the company level, haircut by displacement (roughly 1 displaced guest per 4 new in an LA study), and arriving into a booking shortfall.
Company by company: who’s who
From the roster, grouped by tier. For each: what it does in this story, its World Cup exposure as a share of total revenue (usually tiny, which is the generalist insight), one sourced recent result, then a real bull and a real bear. All figures point-in-time June 12 to 14, 2026.
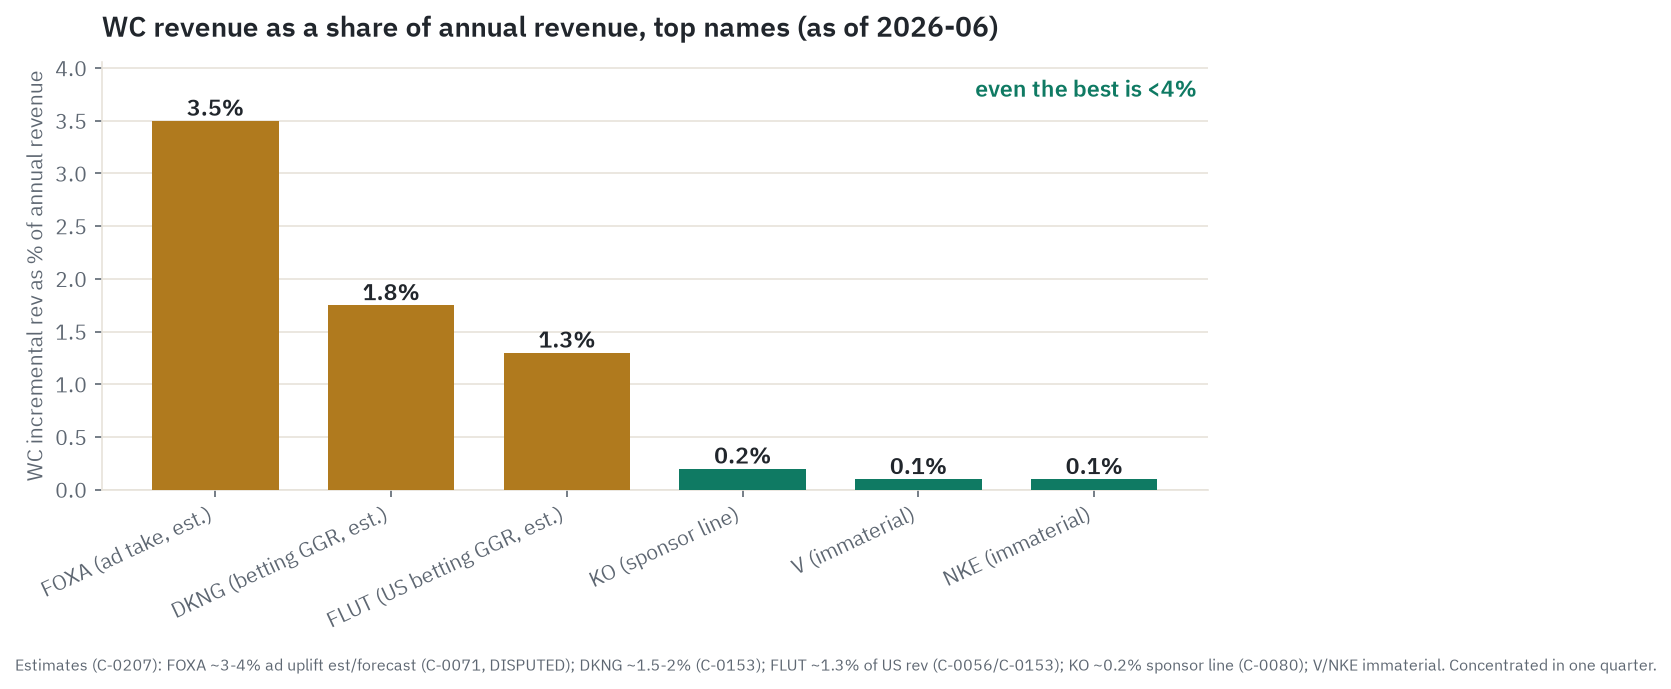
The chart is the whole company section in one picture: the World Cup is a low-single-digit, single-quarter line for the few names with any real exposure, and a rounding error for everyone else. Read each name below against that backdrop.
Toll-booths (payments, hospitality)
TKO Group Holdings (TKO). Owns On Location, the sole official hospitality provider for 2026. This, not Live Nation, is the real listed ticketing and hospitality play. Market cap about $38.9 billion. Recent result: as of March 31, 2026, World Cup hospitality sales had more than doubled any prior World Cup’s total and surpassed Qatar 2022 a year early, with over 500,000 packages sold to buyers in 125-plus countries (primary). Exposure: On Location takes a share of FIFA’s roughly $3.1 billion cycle ticketing-and-hospitality pool, but TKO does not break out its World Cup revenue (undisclosed), and the contribution is small against TKO’s UFC and WWE core. Bull: a contractual monopoly on official hospitality in a record-setting tournament, the cleanest official link in the map. Bear: every World Cup statement is a growth statement with no dollar attached and no segment guidance; an unsizeable number is a narrative, not a quantified catalyst, on a company whose value is UFC and WWE media rights.
Visa (V). FIFA’s official payment partner; earns a higher take rate on inbound cross-border spend. Market cap about $607 billion. Recent result: fiscal Q2 2026 net revenue $11.2 billion with cross-border volume up 12 percent (primary); Wolfe raised its target to $395 on the World Cup catalyst. Exposure: immaterial at the consolidated level, far below 1 percent; the inbound spend is a small fraction of Visa’s roughly $16 trillion in annual payments volume, landing as a 3 to 4 week spike in fiscal Q3 2026. Bull: official partner, higher-margin cross-border mix, clean and result-independent. Bear: a rounding error on a $40 billion revenue base, already flagged by the sell side and likely priced; the price-target bump is a quarter-coloring call, not a thesis.
Mastercard (MA). Not a sponsor (Visa holds the rights), but benefits passively from the same cross-border volume. Market cap about $433 billion. Recent result: FY2025 net revenue $32.8 billion with strong cross-border (primary). Exposure: immaterial, well below 1 percent, same mechanics as Visa without the marketing halo. Bull: passive cross-border lift with zero sponsorship spend. Bear: no rights, no halo, and the volume is a rounding error on a $33 billion base.
Attention harvesters (betting)
DraftKings (DKNG). The largest US sportsbook, co-leader of US World Cup handle. The cleanest high-torque read-through. Market cap about $14.4 billion, down 19 percent year on year. Recent result: FY2025 revenue above $6.0 billion, up 27 percent, with 2026 guidance of $6.5 to $6.9 billion (primary). Exposure: about $1.02 billion of handle at an assumed 10 percent hold is roughly $100 million of GGR (estimate), about 1.5 to 2 percent of annual revenue, concentrated in 6 weeks; the real value is acquiring casual bettors who stick (LTV), which is not quantifiable. Bull: the biggest book in the first US-hosted, legal-betting World Cup, a customer-acquisition windfall at peak attention. Bear: the GGR estimate is soft on two axes (see below), the upside is asymmetric to a deep US run, and the promo war can make the event dilutive to earnings in the quarter it happens.
Flutter Entertainment (FLUT). Parent of FanDuel, the number-one US sportsbook by share; NYSE-primary after moving its listing from London. Market cap about $19.2 billion, down 56 percent year on year. Recent result: FY2025 US (FanDuel) revenue $6.97 billion, group revenue $16.38 billion, US adjusted EBITDA $0.92 billion (primary). Exposure: about $945 million of handle at 10 percent hold is roughly $95 million of GGR (estimate), about 1.3 percent of US revenue. Same conclusion as DraftKings. Bull: number-one US share plus global soccer-betting DNA into the highest-interest US World Cup ever. Bear: immaterial to a $16 billion group; the stock is already down sharply on US-betting-tax and competition fears, so the benefit is largely discounted, and the same hold and promo softness applies.
MGM Resorts (MGM), Penn Entertainment (PENN), Caesars (CZR). The trailing-tier books. BetMGM (a 50/50 JV with Entain), ESPN Bet (Penn), and Caesars Sportsbook each compete for the roughly 14 percent of handle behind the DraftKings and FanDuel duopoly. Market caps about $12.5 billion, $2.76 billion, and $6.0 billion. Exposure: immaterial in all three cases; their equity stories are dominated by Las Vegas and regional casinos, not online World Cup handle. Bull: participation in the handle wave plus any Vegas visitation lift. Bear: trailing share, and for MGM a minority-economics JV; the World Cup is sub-1 percent of the casino-heavy consolidated business.
Attention harvesters (broadcast and ad-tech)
Fox Corporation (FOXA). English-language rights holder; rights locked far below market make the event high-margin. Market cap about $27.7 billion. Recent result: FY2025 revenue about $16.30 billion; the 2026 combined Fox-plus-Telemundo World Cup ad take is forecast around $850 million by a single analyst (Sportico, disputed). Exposure: Fox’s share of that take (an estimated split, itself uncertain) lands mostly in one quarter at perhaps 3 to 4 percent of annual revenue, at high incremental margin given the cheap rights; Fox does not disclose World Cup ad revenue. Bull: below-market rights make every incremental ad dollar a windfall, and 63 percent more match slots plus first-ever in-game ads expand the sellable pie; this is the one name where the margin structure, not just the revenue, is favorable into a single quarter. Bear: the $850 million is a single-analyst figure combined with Telemundo on an estimated split; the windfall is one quarter and one cycle, since rights re-price toward market next round. Note: the “94 percent step-up versus Qatar” you may see quoted attaches to US media rights (Ampere), not to advertising, and is disputed; do not read it as an ad-revenue figure.
Comcast (CMCSA). Spanish-language rights via Telemundo plus all-104-match streaming on Peacock. Market cap about $87.5 billion. Recent result: Q4 2025 Media segment revenue $7.62 billion, Peacock FY revenue $5.4 billion (primary); Telemundo about 90 percent sold, double the 2022 spend. Exposure: immaterial to a roughly $123 billion-revenue company, well under 0.5 percent, but a notable Q2 and Q3 Media-segment and Peacock-engagement driver. Bull: exclusive all-match streaming drives Peacock, and Spanish-language World Cup is a US growth audience. Bear: immaterial at the consolidated level; cable and broadband dynamics dominate the equity far more than a one-month ad bump.
Magnite (MGNI), The Trade Desk (TTD), Roku (ROKU). The ad-tech layer. Magnite is the strongest concrete link, named global programmatic provider for FIFA+ (FIFA’s own service, not the Fox or Telemundo broadcast), terms undisclosed; The Trade Desk and Roku benefit only indirectly via overall connected-TV demand, with no World Cup-specific deal. Market caps about $2.33 billion, $9.1 billion, and $21.2 billion. Exposure: immaterial and indirect; the US World Cup ad lift is 0.4 to 1 percent of US ad spend, and only a slice flows to any one platform. Bull: positioned for the connected-TV budget wave the World Cup contributes to; Magnite has the one named FIFA deal. Bear: no World Cup-specific revenue line; FIFA+ is a minor channel against the broadcast money, and these stocks are under heavy competitive pressure.
Host-economy locals (lodging, OTA, airlines, rideshare)
DiamondRock Hospitality (DRH). The hotel REIT with the highest host-city exposure, about 34 percent (Deutsche Bank). Market cap about $2.45 billion. Recent result: DB estimates a 50 to 75 basis-point city-level RevPAR lift; no company-specific guidance issued. Exposure: highest in the group, but still a low-single-digit annual effect. Bull: the most host-city-concentrated REIT, owned assets capturing demand directly. Bear: about 80 percent of US host-city hotels were behind booking forecast by April 2026 (AHLA called it a “non-event”), plus displacement of price-sensitive base demand; small-cap, RevPAR lift in basis points not points.
Sunstone (SHO), Host Hotels (HST), Park (PK), Ryman (RHP). The rest of the REIT group, at roughly 23, 21, 21, and 14 percent host-city exposure (DB). Market caps about $2.18 billion, $17.3 billion, $2.92 billion, and $7.71 billion. Host is the largest and most liquid (it beat Q1 2026 and raised AFFO guidance, adjusted funds from operations, the cash-flow measure REITs are valued on, on fundamentals unrelated to the World Cup); Ryman is the least concentrated. Exposure: low-single-digit annual in every case. Bull: owned host-city assets capture event demand directly. Bear: the same booking shortfall, displacement, and priced-in risks, on a bps-level RevPAR item.
Marriott (MAR). Official hotel supporter, properties in all 16 host cities, asset-light fee model. Market cap about $106 billion. Recent result and the punchline: management guides the World Cup to add only 30 to 35 basis points to FY2026 global RevPAR, against a 2 to 3 percent total RevPAR guide (primary). Exposure: management-quantified and tiny, about a tenth of one year’s RevPAR growth, far below 1 percent of revenue. Bull: the cleanest management-confirmed datapoint, official partner, high-margin fee model. Bear: Marriott’s own guidance proves it is immaterial to a global fee base.
Hilton (HLT) and the other asset-light brands. Hilton is the obvious peer next to Marriott, named by Deutsche Bank in the host-city lodging group, and it reads the same way. It is an asset-light fee-and-franchise model, so it earns a small percentage of room revenue rather than owning the rooms, which means a host-city RevPAR spike reaches its income statement only after being diluted across its global system. Exposure: immaterial, the same conclusion as Marriott, and cleaner-read at the asset-located REITs than at any national brand. Bull: properties in every host city and a fee on the event-window pricing power. Bear: the fee base is global and the World Cup is a rounding error against it; if even Marriott’s official-partner guidance is 30 to 35 basis points of blended RevPAR, an unsponsored peer is no more material.
Airbnb (ABNB). Alternative lodging absorbing demand the REITs cannot. Market cap about $78.5 billion. Recent result: the company calls 2026 its biggest-ever event, above the Paris 2024 Olympics, with 100,000-plus new host-city listings since October 2025 and about 1 in 6 tournament guests a first-time user (primary). Exposure: even a record event is small versus global gross booking value, likely well under 1 percent of FY revenue. Bull: biggest-ever event plus new-host acquisition in supply-constrained cities. Bear: tiny versus global GBV; the host-city booking shortfall and priced-in risk cap it.
Booking Holdings (BKNG), Expedia (EXPE). Global OTAs named generically as host-city lodging beneficiaries; no company-specific guidance. Market caps about $128 billion and $27.0 billion. Exposure: immaterial, a sliver of vast global platforms. Bull: global scale captures inbound lodging demand. Bear: no company-specific signal; diluted to insignificance by global mix.
Delta (DAL), United (UAL), American (AAL). Named by Deutsche Bank for transatlantic and intra-Americas networks, but the airline read is the weakest in the map. Market caps about $54.3 billion, $37.5 billion, and $9.9 billion (American is also a regional Supporter). Recent result: a counterintuitive headwind, with summer 2026 transatlantic demand soft into added capacity (single press source, needs corroboration). Exposure: immaterial and directionally ambiguous; inbound World Cup travel may not offset a weak US-inbound backdrop. Bull: networks into host metros capture some inbound fan travel. Bear: soft transatlantic and US-inbound demand mean the World Cup may not even be a net positive this summer.
Uber (UBER). Deutsche Bank-named for host-city visitor traffic; intra-city event-clustered demand. Market cap about $140 billion. Exposure: immaterial, plausibly clean at the city level but tiny versus global bookings. Bull: transit-and-rideshare-heavy host-city travel favors rideshare. Bear: negligible versus Uber’s global bookings, unquantified, transient.
Direct sellers (beverages, QSR, apparel, retail)
Coca-Cola (KO). Top-tier Partner, the longest-running FIFA sponsor. Market cap about $355 billion. Recent result: FY2025 revenue about $47.9 billion (press/IR). Exposure: immaterial; the estimated Partner fee above $95 million a year is about 0.2 percent of revenue, a marketing line, not incremental volume; Quintet finds beverage demand effects are temporary and normalize quickly. Bull: flagship global sponsor reinforcing brand equity at peak attention. Bear: sponsorship is roughly 0.2 percent of revenue and a cost, with no measurable durable lift.
PepsiCo (PEP), McDonald’s (MCD), AB InBev (BUD), Bank of America (BAC), Home Depot (HD). The Sponsor and Supporter mega-caps, grouped because the World Cup is the same immaterial brand line item for all five, but here is why each is on the roster and why none of them moves. PepsiCo is a Sponsor through Frito-Lay, the snack side of the watch-party occasion, with the deal a sub-0.1 percent marketing line on a roughly $91 billion revenue base. McDonald’s is a Sponsor and the canonical QSR name, the one people first reach for, and the lift is a brief match-day promotion bump, under 0.4 percent of revenue and not a segment. AB InBev (BUD) is the official beer Sponsor (Budweiser), but note it is an ADR rather than a US common-stock primary, and remember the trap that its Modelo and Corona brands belong to Constellation in the US, not to BUD. Bank of America is a Sponsor and is on the roster only because people assume a financial-services partner must benefit; for a bank with a roughly $100 billion-plus revenue base a sponsorship fee is invisible, and there is no World Cup transaction the way there is for the payment networks. Home Depot is a Supporter (its Spanish-language brand activations target the same Hispanic soccer audience the beer makers chase), included to show that even a retailer with a World Cup tie-in books no measurable World Cup revenue. Market caps about $197 billion, $202 billion, $161 billion, $398 billion, and $327 billion. Each pays an estimated $65 to $95 million Sponsor fee, less for Supporters, which is under 0.4 percent of revenue for all of them and a brand line item, not a measurable revenue segment. Bull: brand activation reaching match-day occasions at scale. Bear: sub-1 percent marketing cost with no documented durable revenue lift; these are the textbook “immaterial at the consolidated level” names.
Constellation Brands (STZ). Owns the US rights to Modelo and Corona, the number-one import beers, and is running its biggest-ever soccer media push around the event. It is not a FIFA sponsor. Market cap about $25.5 billion, down 20 percent year on year. Recent result: Constellation flagged a US Hispanic-consumer demand slump (Hispanics are about half of its US beer sales) while Modelo runs record media (press). Exposure: immaterial and partly defensive; the spend is aimed at arresting a demand slump, not capturing a sponsorship gain. Bull: the World Cup reaches Constellation’s core Hispanic and soccer audience exactly when it needs a catalyst. Bear: the spend is defensive against a real demand problem; the year-on-year stock decline reflects that, not a World Cup tailwind. This is the defensive-spend trap: spend rising because demand is falling.
Molson Coors (TAP). Owns Coors and Miller, and like Constellation it is not a FIFA sponsor but is spending heavily around the event. Reporting puts its 2026 World Cup outlay above any live sporting event it has backed in the past decade (press). Exposure: immaterial and, like Constellation, partly defensive. The money is ambush-style media spend chasing attention, not captured sponsorship revenue, and US mainstream-beer volumes have been under structural pressure for years. Bull: a record live-event push that puts its brands in front of a captive World Cup audience at peak attention. Bear: it is the same defensive-spend trap as Constellation. Heavy outlay with no documented incremental volume, into a category that has been shrinking, with no World Cup rights to show for it.
Nike (NKE). Outfits about 12 teams including the US; no soccer segment disclosure. Market cap about $66.5 billion, down 29 percent from end-2025. Recent result: FY2025 revenue about $46.3 billion, down 10 percent, no football reportable segment (primary). Exposure: immaterial and undisclosed; the best proxy is FY2014, when Brazil-World-Cup soccer revenue of about $2.3 billion was only about 8 percent of total Nike revenue. A brand-halo event, not a needle-mover. Bull: brand halo across a dozen marquee nations in a US-hosted World Cup, with soccer a growth category against a soft backdrop. Bear: no segment disclosure, soccer high-single-digit at peak, and replica-kit upside flows to private Fanatics and foreign-listed Adidas.
DoorDash (DASH). New official on-demand delivery and reservations partner; the one channel with measurable event-day order spikes. Market cap about $65.6 billion, down 24 percent year on year. Recent result: official partner; DoorDash Ads self-reports above 30 percent average sales lift for CPG advertisers (a vendor claim, not World Cup-specific), and trade data shows event-day delivery spikes around major-tournament finals (single trade source). Exposure: real but transient, likely well under 1 percent of FY revenue. Bull: the cleanest real-volume pocket plus a retail-media angle. Bear: spikes are match-day transient with no evidence of durable full-year lift.
Yum Brands (YUM). Owns Pizza Hut, KFC, and Taco Bell, and is the QSR peer a reader expects right next to McDonald’s. It is not a FIFA sponsor, and it reads exactly like McDonald’s at the company level: any World Cup effect is a brief match-day order and promotion bump (pizza and delivery are classic watch-party food), not a measurable revenue segment, and it is immaterial against a global franchise base. Exposure: immaterial. Bull: match-day occasions across three large delivery-friendly brands during the highest-attention sporting window of the year. Bear: no rights, no disclosed lift, and a transient event-day spike that does not show up in full-year results. The textbook immaterial-at-the-consolidated-level QSR name.
Infrastructure and the corrective fringe
Verizon (VZ), T-Mobile (TMUS). Verizon is the official telecom provider; T-Mobile upgraded host-city capacity. Market caps about $201 billion and $205 billion. Exposure: immaterial to revenue; stadium build-out is mostly normal capex plus a marketing halo. Bull: official-provider halo and a chance to demonstrate private-5G capability to enterprise buyers. Bear: capex-and-halo, not revenue, on a roughly $130 billion-revenue carrier.
Axon (AXON). Public-safety and counter-drone vendor aligned to over $1.1 billion in federal World Cup security funding. Market cap about $35.6 billion, down 37 percent year on year. Recent result: city-level contract add-ons (Dallas $10.3 million), but Axon’s own World Cup bookings are not broken out (unverified). Exposure: immaterial and unverified; tens of millions against a multi-billion base. Bull: aligned to over $1.1 billion of security spend, with counter-drone demand that could outlast the event. Bear: World Cup bookings not isolated in filings; immaterial at scale.
AECOM (ACM). Engineering and construction; included to show the construction channel is structurally absent in 2026. Market cap about $9.0 billion. Exposure: immaterial; retrofit-only work since the venues are existing NFL stadiums. Bull: broad infra exposure to host-city work. Bear: no new-stadium build means the classic World Cup construction wave does not exist this cycle.
Live Nation (LYV). Included as a correction. Live Nation and Ticketmaster are not the official World Cup ticketer or resale platform; FIFA runs ticketing and resale itself. Market cap about $40.2 billion. Exposure: effectively zero World Cup exposure. Bull: a strong standalone live-events business unrelated to the World Cup. Bear: the World Cup ticketing thesis for Live Nation is a misconception; do not frame it as a beneficiary.
Host nation versus the rest: what the editions teach
The cross-tournament record tells two stories at once: a brutal one about host economics, and a more hopeful one about 2026 being structurally different.
The host-economics record is grim and consistent. South Africa 2010 spent about $4 billion on 10 stadiums; Cape Town’s Green Point stadium loses millions a year and sits largely abandoned, and the tourist forecast was cut from 750,000 to 200,000 to 250,000. Brazil 2014 spent about $4 billion on stadiums (total infrastructure $8 to $15 billion, roughly 78 percent public funds), leaving underused arenas in cities with no top-tier clubs. Russia 2018 spent $11 to $11.6 billion, and Moody’s judged the benefit short-lived. Qatar 2022, at about $220 billion all-in, was a nation-building outlier, not a comparable. In every case the public paid for the stadiums and FIFA and the contractors captured the gains. Twelve of the last 14 World Cups lost money for hosts.
So who exactly pays when a US host city comes out behind, and is there any tax offset? The bill lands at three levels of government, and it lands on taxpayers at each. The host cities and their states carry the operating cost directly, on the order of $100 to $200 million per US city for security, transit, logistics, fan festivals, and venue retrofit, and they get no share of FIFA’s revenue, because the host-city agreement hands FIFA all the TV, ticket, sponsorship, and hospitality money while leaving cities the “safety and security” and “all taxes, duties and levies” obligations (Chicago walked away from bidding over exactly these terms). On top of the cost, the states forgo revenue: FIFA demands tax exemptions for itself and its entities, and host states exempt sales tax on World Cup tickets, which the Institute on Taxation and Economic Policy estimates costs individual states roughly $7 million to $25 million each (Georgia up to about $25 million, Missouri about $11 million, Florida about $7.4 million). The federal taxpayer backstops the rest: about $625 million in FEMA security grants across the 11 US cities plus about $100 million in Department of Transportation transit support. The natural follow-up is whether the hotel and sales tax on all that gross activity offsets the bill. Some of it does, which is why cities bid at all. But the independent net studies already net that incremental tax take out, and they still find a loss: Baade and Matheson’s ex-post work on the 1994 US World Cup found host cities underperformed their forecasts by roughly $712 million each, with an aggregate net loss against the promised gain. The offsetting tax revenue is real and is already counted, and the math still comes out negative for the public purse.
What 2026 changes is the single biggest historical driver of those losses: there is no new-stadium build. All 11 US venues are existing NFL stadiums, retrofit only, so the white-elephant capex is simply absent. That is the strongest structural argument that 2026 is not a repeat of South Africa or Brazil. It also caps the upside, because there is no construction-stimulus leg and therefore no large US-listed construction beneficiary.
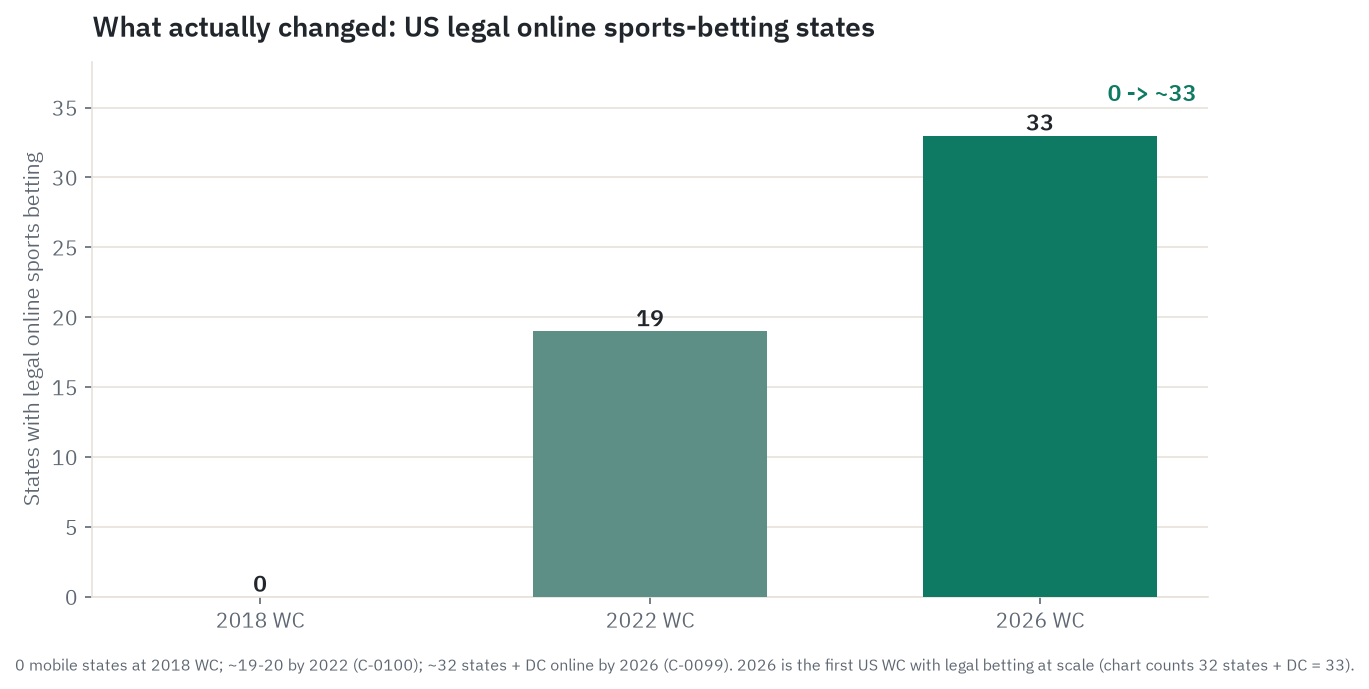
Three other things make 2026 different, and these are the genuine breaks the bear case must credit. First, the US is the engine of FIFA’s commercial machine this cycle: US media rights are up about 94 percent versus Qatar (Ampere, disputed, and attached to rights, not advertising), and US brands are about 52 percent of sponsorship revenue, up from 36 percent in 2022. Second, legal US online sports betting went from essentially zero states at the 2018 tournament to about 19 to 20 in 2022 to about 33 jurisdictions in 2026. This is the first World Cup that is a legal US betting event at scale, which is a step-change in the addressable opportunity, not a marginal handle bump. Third, the home team plays at home in front of a record domestic audience, which is exactly the condition under which the never-tested US distraction effect might finally show up. The format itself expands too: 48 teams and 104 matches instead of 32 and 64.
The honest synthesis of the editions: 2026 dodges the capex disaster that defined recent hosting, but the diffuse, overstated revenue critique still applies, and the realized 2026 demand (the hotel shortfall, the unsold opening-phase tickets, the soft inbound tourism) is running below even the gross forecasts.
Is the men’s World Cup special, or just one big US sporting event among many?
A fair reader finishing the host editions will ask the obvious comparison question. Is the men’s World Cup a uniquely large event for these companies, or do the Super Bowl, the Olympics, the Euros, and the Women’s World Cup do the same thing to the same tickers? The honest answer splits cleanly: on advertising it is one of several, and not even the biggest; on betting it may be the biggest the US has ever seen.
Rank the major US sporting events by how much advertising money they move, and the men’s World Cup sits in the middle of the pack. The Super Bowl is the US yardstick. Super Bowl LIX in February 2025 generated more than $800 million in gross US ad revenue for Fox across the broadcast, Tubi, and Telemundo, in a single night, at roughly $8 million per thirty-second spot, in front of a record 127.7 million average US viewers (primary). The Summer Olympics is the bigger sustained event: NBCUniversal, owned by Comcast, pulled in more than $1.25 billion of US ad revenue for Paris 2024 over seventeen days, averaging about 30.6 million US viewers a day (primary for the ad figure; viewership press). The men’s World Cup 2026 comes next. Its forecast US ad take of around $850 million across Fox and Telemundo is, almost exactly, one Super Bowl’s worth of advertising, except it is spread over six weeks and 104 matches instead of one night, and no single World Cup match comes anywhere near the Super Bowl’s audience (the 2022 final drew about 16.8 million on Fox). Below that, the Euros are a real but niche US property: Euro 2024 was the most-watched in US English-language history and still averaged only about 1.675 million viewers a match, roughly half a men’s World Cup match (primary). And the Women’s World Cup is the smallest US ad event of the set, with global sponsorship around $308 million in 2023 and US audiences a fraction of the men’s tournament (the 2023 final drew about 2.2 million across all US platforms versus the men’s 16.8 million).
The crucial nuance is that different companies get different-sized versions of the same effect, so “World Cup beneficiary” means different things on different income statements. Fox gets the men’s World Cup plus the smaller Euros. Comcast’s marquee event is not the World Cup at all; it is the Olympics, a larger and wholly-owned franchise it holds in the US through 2032, with the home-soil Los Angeles 2028 games likely larger still. And the Women’s World Cup is leaving the broadcasters entirely: FIFA sold the exclusive US rights to the 2027 and 2031 editions to Netflix, the first major FIFA tournament on a pure streamer, which moves that (small) asset off Fox and Comcast and onto a name not otherwise in this story (primary). For the payment networks, the effect simply scales with the size of the crowd and stays immaterial at the consolidated level across all of them.
The one place the men’s World Cup is arguably special is betting, and it is the standout for DraftKings and Flutter. US legal betting handle on the 2022 men’s tournament ran about $1.3 to $1.8 billion. The 2026 home-soil edition is forecast at about $2.9 billion in a base case and up to $4.4 billion if the US team runs deep, which would make it potentially the largest single US betting event ever, topping the roughly $1.7 billion handle of a Super Bowl and rivaling the roughly $3 billion of March Madness (press, forecast). That is a status the Olympics, with thin US betting markets, and the Women’s World Cup, with negligible handle, do not approach. So the clean summary is this: as an advertising event the men’s World Cup is large but not unique, a Super Bowl of ad dollars stretched across a month and outranked by the Olympics for Comcast; as a betting event, it may be the biggest the country has ever had.
Is the effect real and durable?
Now the thesis-level bull, base, and bear, not per stock. The skeptic’s job was to make all three real.
Bull. There is a genuine, decades-stable sentiment anomaly in the data (the loss-day effect, asymmetric and behavioral), and there is a real revenue wave concentrated in betting and media, arriving in a US-hosted edition with legal betting at scale for the first time and a broadcaster monetizing below-market rights at unusually high margin. Two of these are genuine 2026 structural breaks, not noise. For Fox specifically, a high-margin, one-Super-Bowl-sized ad windfall lands in a single fiscal quarter of a roughly $16 billion-revenue company, which is meaningful to that quarter’s print. For DraftKings and FanDuel, the strategic value of a once-every-four-years, peak-attention customer-acquisition window in a newly legal market is the biggest it has ever been, even if the revenue is small. Trigger and timing: Q2 and Q3 2026 earnings, where the betting and media windfalls show up.
Base. The sentiment effect is real but sub-tradeable and mostly foreign in its US form; the revenue is real but diffuse and largely priced; and the net signal is close to noise for a US-index investor. The toll-booths are the better-quality exposure, but not a large one: even the cleanest single names are 1 to 4 percent of annual revenue in a single quarter, and the index cannot move because the whole footprint is a rounding error. The most likely outcome is a split: a few names get a visible quarter-coloring catalyst, the index does nothing detectable, and most of the “World Cup stocks” do nothing because the World Cup is immaterial to them.
Bear. The whole “World Cup trade” is data-mined, displacement-laden, and a marketing story. The sentiment return effect may be partly spurious (Gerlach found it in non-playing countries; Klein could not replicate it with proper controls). The revenue gross figures overstate by an order of magnitude (Baade and Matheson). The betting math is double-soft (see risk controls). And the macro tape will overwrite any football pattern. Trigger and timing: a summer macro event (an in-window FOMC decision, a hot CPI print) moves the tape, lazy commentary blames the World Cup, and the 1994 bond-crash confound repeats. The tape shows nothing durable.
The most likely way this analysis goes wrong is not being wrong about the index, where the arithmetic is close to unbreakable. It is getting the tone wrong by being so armored against the bull that it buries the two real structural breaks under a “1.5 to 2 percent” shrug, and then DraftKings reports a record-handle but margin-light quarter exactly as the bear predicted while Fox prints a clean media quarter on the rights windfall. Both can be true: the index will not move, and a short list of quarters will be visibly colored.
Companies to watch (bull / base / bear)
The watch-list, focused on the names with the highest World Cup-to-total exposure and the cleanest read-through. Each gets a genuine bear.
DraftKings (DKNG). Largest US sportsbook, the highest-torque single-name read-through.
- Bull: peak-attention customer acquisition in the first legal-betting US World Cup; about $100 million of GGR in a quarter (estimate).
- Base: a real Q2/Q3 catalyst at roughly 1.5 to 2 percent of annual revenue, with durable value in retained casual bettors that nobody can size yet.
- Bear: the GGR estimate can halve (see risk controls), and the promo war can make the event dilutive to earnings in the quarter.
- Watch: how deep the US team runs (the handle forecast embeds a US advance), and the realized hold reported in Q2/Q3.
Flutter / FanDuel (FLUT). Number-one US share, global soccer DNA.
- Bull: the strongest soccer-betting franchise into the highest-interest US World Cup.
- Base: about $95 million of US GGR (estimate), roughly 1.3 percent of US revenue, immaterial to a $16 billion group.
- Bear: the diversified group dilutes any World Cup upside to invisibility, and the stock already prices US-tax and competition fears.
- Watch: the same hold and promo dynamics as DraftKings, plus group-level US tax commentary.
Fox Corporation (FOXA). The one favorable-margin broadcast windfall.
- Bull: below-market rights make every incremental ad dollar high-margin; a one-Super-Bowl-sized take in a single quarter.
- Base: perhaps 3 to 4 percent of annual revenue (estimate), one quarter, one cycle.
- Bear: the $850 million is single-analyst, combined with Telemundo on an estimated split, and the rights re-price next round.
- Watch: whether Q2/Q3 media revenue visibly steps up, and any disclosure of World Cup ad sell-through.
TKO Group (TKO). The sole official hospitality provider.
- Bull: a contractual monopoly in a record-setting hospitality cycle.
- Base: real at the On Location segment level, immaterial against the UFC and WWE core.
- Bear: no disclosed dollar, no segment guidance; real but unsizeable for a generalist.
- Watch: any On Location segment color in TKO’s 2026 reporting.
Visa (V). The cleanest toll-booth, smallest relative dollars.
- Bull: official partner, higher-yield cross-border mix, result-independent.
- Base: a fraction of one fiscal-Q3 quarter; a quarter-coloring tailwind.
- Bear: immaterial to a $40 billion base and likely priced.
- Watch: cross-border volume growth in fiscal Q3 2026.
DiamondRock (DRH) and the host-city REITs. The cleanest real-economy read.
- Bull: highest host-city concentration, owned assets capturing demand directly.
- Base: a 50 to 75 basis-point city RevPAR lift, a low-single-digit annual effect.
- Bear: the booking shortfall and displacement may cut even that; small-cap.
- Watch: realized host-city RevPAR versus the AHLA “non-event” warning.
Airbnb (ABNB). The cleanest demand signal in lodging.
- Bull: biggest-ever event, new-host acquisition in supply-constrained cities.
- Base: well under 1 percent of FY revenue, a Q2/Q3 color item plus user acquisition.
- Bear: tiny versus global GBV, into a host-city shortfall.
- Watch: new-user retention after the tournament, the only durable angle.
Risk controls
The honest risk paragraph, because this is where the whole thesis is most exposed.
This is a one-month event with a tiny per-company footprint. Even the best read-through is low-single-digit percent of one year, concentrated in roughly six weeks, so the right frame is “quarter-coloring catalyst,” never “re-rate.” The backtests behind the sentiment channel are short and contested: Gerlach found the return effect in non-playing countries, and Klein could not replicate it with proper controls, so treat it as a robust correlation and distraction phenomenon but a fragile, possibly spurious causal return effect. After transaction costs and timing (you only learn the result after the price has moved), the sentiment effect is not exploitable for a US investor.
The betting math is double-soft, and this is the single most important caveat for the highest-torque name. The GGR estimates rest on an analyst handle forecast multiplied by an assumed roughly 10 percent hold, and both inputs flatter the bull. The handle forecast embeds an assumption about how deep the US team runs; an early US exit deflates it. And the casual World Cup bettor, the exact customer the acquisition story is built on, tends to bet simple winner and moneyline markets, which hold around 5 to 7 percent, below NFL, not the 9 to 11 percent assumed for a parlay-heavy mix. A blended realized hold of 7 to 8 percent is at least as defensible as 10, which would cut the roughly $100 million and $95 million GGR estimates by 20 to 30 percent. Worse, the World Cup is a customer-acquisition land-grab, so promotional spend (bonus bets, odds boosts) rises with handle and is deducted before net revenue; the event can be EBITDA-dilutive in the quarter it happens even as handle sets records. The payoff is deferred lifetime value the research itself concedes is not quantifiable.
The host-economy and travel reads carry their own haircuts: the booking shortfall (about 80 percent of host-city hotels behind forecast by April 2026), displacement of regular guests (roughly 1 in 4 in the LA study), soft transatlantic airline demand, and grey-market offshore betting siphoning handle away from regulated US books. The broadcast windfall is a one-cycle artifact; the next rights round re-prices toward market.
And the “priced-in / sell-the-news” risk is the crowd-favorite caveat, so be precise: it is asserted, not proven. Goldman noted that World Cup-linked names “may already reflect the benefit,” but the research here did not establish whether Visa, DraftKings, or Fox have actually re-rated on World Cup news, so treat “already priced” as a plausible hypothesis rather than a demonstrated fact. The clean test that would change the whole index verdict is simple to state and unlikely to occur: a consistent, seasonally-adjusted, result-linked S&P 500 move across US matches. History says it will not appear.
Methodology, sourcing, and data-quality flags
This piece was built from eight parallel research streams (historical event studies; broadcast, media, and advertising; sponsors, beverages, apparel, and QSR; betting, payments, and ticketing; travel, hospitality, and airlines; 2026 host economics; a macro top-down reality check; and a micro pricing-power analysis), plus a company roster and an adversarial skeptic pass. Every load-bearing figure traces to an entry in the run’s claims ledger with a source and an as-of date.
The source hierarchy, strongest to weakest: peer-reviewed journal (the event-study literature), then FIFA or company filings (rights holders, sponsor rosters, earnings releases), then analyst estimates (Eilers and Krejcik, Deutsche Bank, Ampere, Wolfe, Sportico), then trade press, then author arithmetic flagged as estimate. Where sources disagreed, the piece leads with the named, methodical source and flags the dispute.
Data-quality flags:
- US equity market cap (~$74 trillion) and the derived market-cap fractions are estimates, not primary-sourced figures, used in place of a dropped lower figure; treat the 0.04 percent fraction as order-of-magnitude.
- Economic-impact figures bounce by house and by definition. The $17.2 billion (US GDP), $30.5 billion (total US activity), $40.9 billion (global GDP for 2026), and $47 billion (global gross output for the 2025 Club World Cup plus 2026 combined) are distinct gross, ex-ante, promoter-commissioned numbers that sources routinely conflate; the independent net estimate (Oxford Economics, Statista back-calc) is under 0.1 percent of GDP. Note that the booster source (Tourism Economics, the $17.2 billion and 1.24-million-visitor figure) is a division of Oxford Economics, the same house behind the most-cited skeptic line, so the two opposing headlines share a parent. Baade and Matheson’s ex-post finding (1994 host cities missed forecast by about $712 million each) is the cleanest evidence that gross overstates by roughly an order of magnitude.
- Betting handle and GGR are forecasts, not facts. The EKG handle (~$2.82 billion, range $2.32 to $4.33 billion) is an analyst forecast; the GGR figures (~$250 to $310 million industry, ~$100 million DraftKings, ~$95 million FanDuel) are author arithmetic (handle times an assumed ~10 percent hold) and are double-uncertain. Casual-bettor hold may be 5 to 7 percent, which would cut GGR 20 to 30 percent. Houses disagree on the operator split (EKG runs lower than CNBC press estimates). The “could top $50 billion global” headline is mostly offshore and is color only.
- The Fox ad take is a single-analyst forecast. The ~$850 million combined Fox-plus-Telemundo 2026 ad figure is Sportico (single source, disputed); Fox’s share (~3 to 4 percent of revenue) rests on an estimated split of that unverified total; the ~$635 million incremental uplift is derived from two press endpoints. Fox discloses no World Cup ad line. The “+94 percent versus Qatar” attaches to US media rights (Ampere), not advertising, and is disputed; per-match rights cost actually fell.
- Event-study effect sizes are robust in-sample but contested as causal. The minus 49 basis-point elimination-loss figure (Edmans, Garcia, Norli) is primary and well-replicated as a correlation; Gerlach (effect in non-playing countries) and Klein (non-replication with surprise controls) make the causal, tradeable return effect contested. Kaplanski and Levy’s US minus 2.58 percent figure is primary, but its sample years and seasonal-control claim are press-sourced.
- Sponsorship and rights values are estimates; FIFA discloses none. Tier deal values ($65 to $95 million Sponsor, above $95 million Partner) and the ~$2.4 to $2.7 billion sponsorship total are analyst aggregations. Fox’s rights value (~$450 to $500 million) reconciles across conflicting press sources.
- Several host-economy and travel figures are single-source. Tourism Economics’ $17.2 billion / 1.24 million visitors (original report not fetched), transatlantic demand down 7.3 / 14.2 percent (one weak press source), Axon’s World Cup-attributable bookings (not isolated in filings), and the Euro 2024 delivery spike (single trade source) are flagged; the draft keeps them qualitative or attributed.
- The macro backdrop is point-in-time and single-secondary-sourced. Fed funds 3.50 to 3.75 percent, CPI ~4.2 percent, unemployment ~4.3 percent, CAPE ~40 are mid-June 2026 readings from secondary sources; confirm against the relevant primary releases.
- TKO’s, Verizon’s, and the telecom names’ World Cup contributions are undisclosed. TKO does not break out On Location World Cup revenue; the “more than doubled prior World Cup hospitality” statement is the strongest sourced figure and carries no dollar.
- The comparison-event figures mix primary and forecast tiers. The Super Bowl LIX ad take (over $800 million) and viewers (127.7 million) are Fox Corp primary; the Paris 2024 over-$1.25-billion ad figure is an NBCUniversal primary release (the higher $1.9 billion total-revenue and $1.4 billion all-in ad figures circulating in press are UNVERIFIED and not used); the Euro 2024 viewership is Fox Sports primary; the Netflix 2027/2031 Women’s World Cup rights deal is FIFA primary. Two of the comparison numbers are explicitly UNVERIFIED forecasts and are flagged in text as such: the 2026 men’s World Cup US betting-handle projection of about $2.9 to $4.4 billion (single ESPN/analyst origin, forecast, and tied to how deep the US team runs) and the 2022 baseline of about $1.3 to $1.8 billion (sources split between roughly $1.3 billion and $1.8 billion). The Olympics US-rights total (about $7.75 billion plus a $3 billion extension) and the Paris daily-viewership figure (about 30.6 million) are press, not re-confirmed from filings.
- Worker absenteeism is treated as folklore, not a market mechanism, by design. No load-bearing figure rests on it; the resolution is the Edmans, Garcia, and Norli rejection of the lost-productivity explanation (primary), and the weekday-afternoon-kickoff and remote-work points are qualitative.
Key sources: Edmans, Garcia and Norli (2007, Journal of Finance); Kaplanski and Levy (2010, JFQA); Ehrmann and Jansen (ECB WP 1424); Gerlach (2011) and Klein, Zwergel and Fock (2009) for the skeptic side; FIFA filings and the 2023-26 cycle budget; company 8-Ks and 10-Ks (DraftKings, Flutter, Visa, Mastercard, Comcast, Marriott, Nike, Airbnb, TKO); EKG via casino.org / next.io (handle); Sportico (ad take); Ampere (rights and sponsorship); Deutsche Bank via Investing.com (host-city REIT exposure); Wolfe (Visa); Baade and Matheson, Zimbalist and Matheson (host economics); CFR and AHLA (2026 demand); WARC and eMarketer (ad spend); Fox Corporation (Super Bowl LIX ad revenue), NBCUniversal (Paris 2024 ad revenue), Fox Sports (Euro 2024 viewership), FIFA and Netflix (2027/2031 Women’s World Cup rights), and ESPN (betting-handle comparison) for the comparison-events section.
Prepared June 14, 2026. Figures are point-in-time and will change. This is research and analysis for educational purposes - not investment advice, not a recommendation, and not a solicitation. This piece analyzes sports betting, gaming, and consumer/markets companies; it is not betting or gambling advice and is not an encouragement to wager. Verify all figures independently and consult a licensed financial advisor before making any decision.